
The Daily Drip
Core markets charts updates and commentary
Note: The counts on the right edge are real-time, and they are prone to adjustments as price action develops. Elliott Wave has a fluid approach, is evidence-based, and requires constant monitoring of certain thresholds.
In the counts below, this (( )) = circle on chart
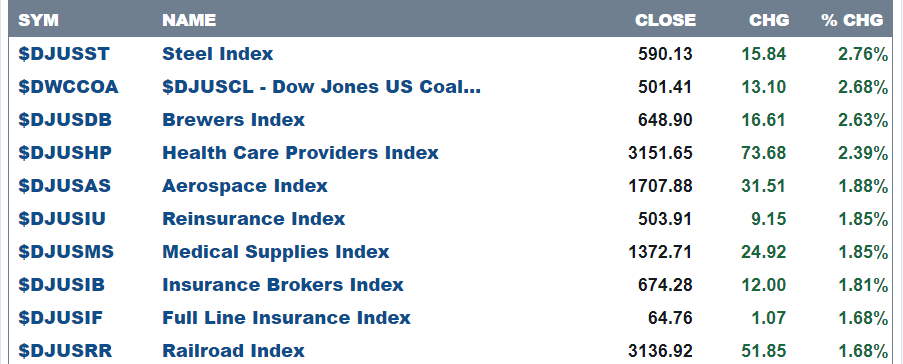
Here are today’s top 10 best performers out of 104 industries.
87 positive closes and 17 negative.
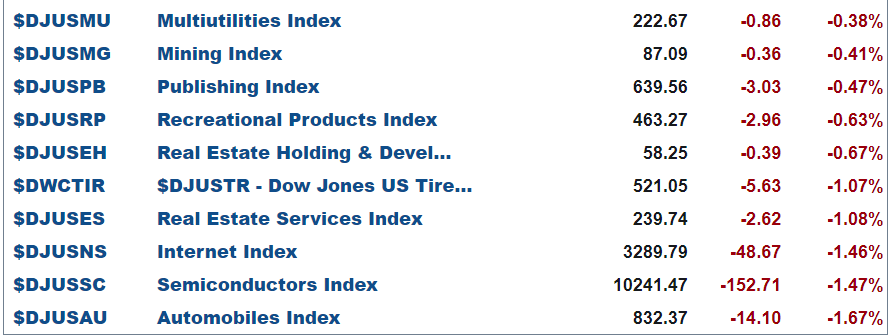
and bottom 10 …
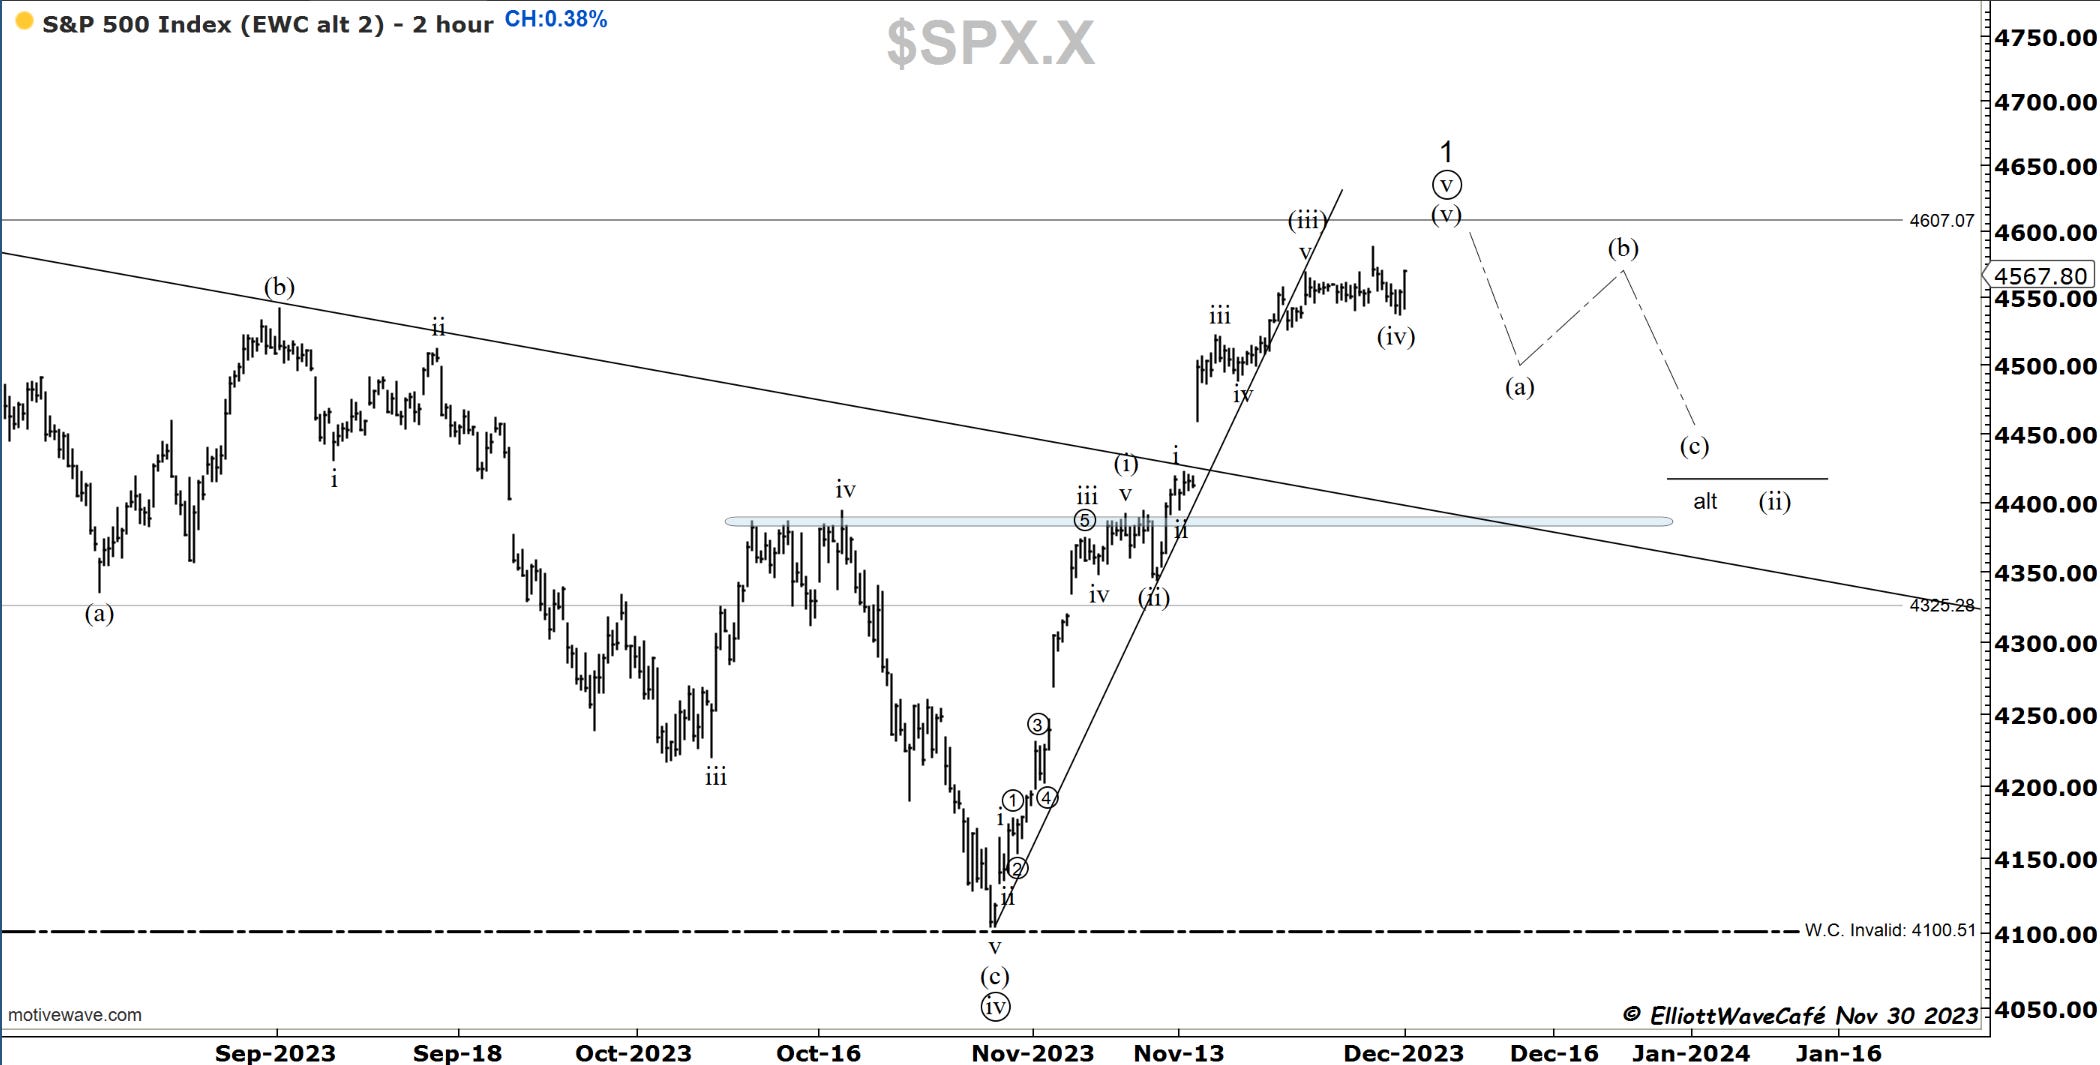
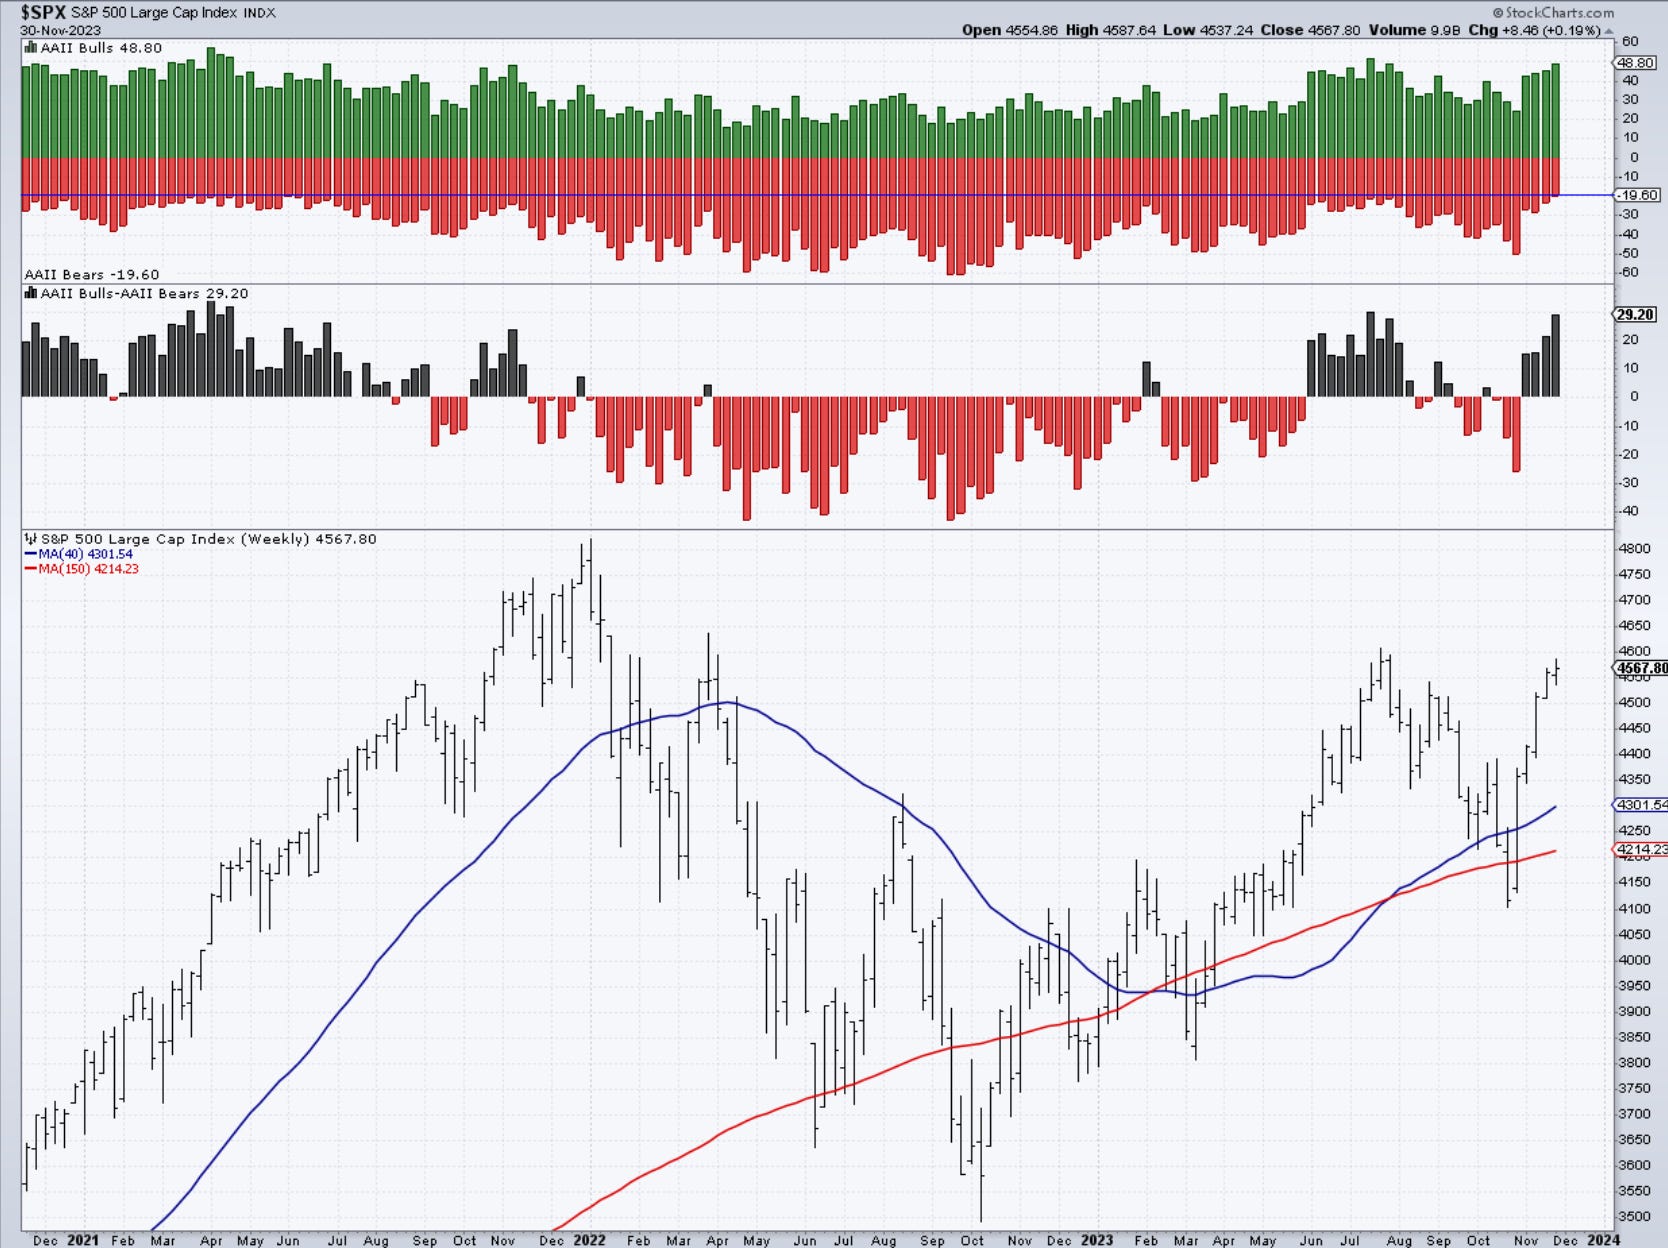
SP500
After yesterday’s upside failure, the index sold off for the first part of the day, only to strongly recover as the day and month ended. By the look of the volume today, I am pretty sure it had to do with month-end flows and should not alter the technical picture much. I continue to expect a correction, at least for the first half of December.
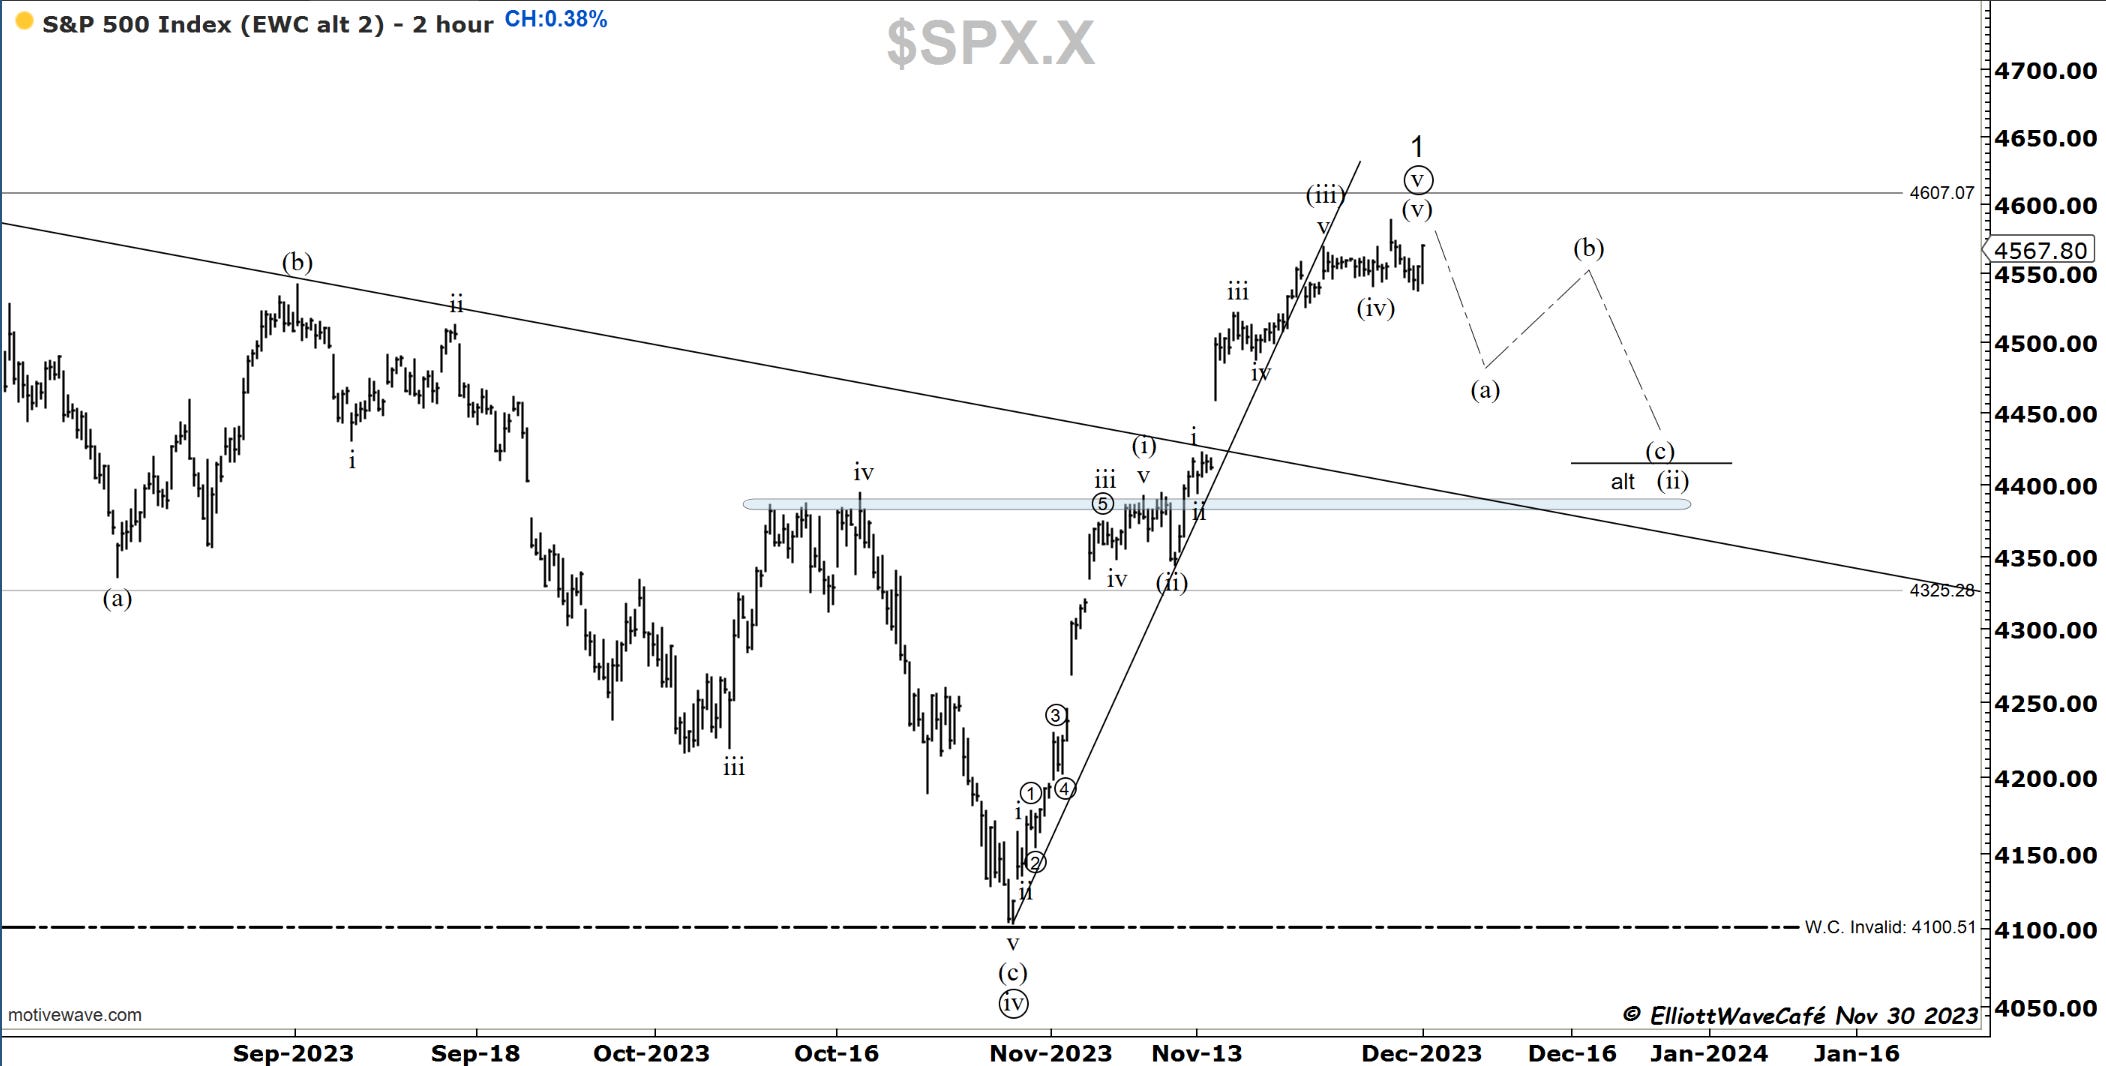
If wave (iv) was just completed as a flat, then a move above 4607 will be the 5th wave.
The bulls are growing stronger for the 4th week in a row says AAII survey. Referring to my comments on sentiment and herd yesterday, I am not surprised. If they would be bearish here, then I would be worried.
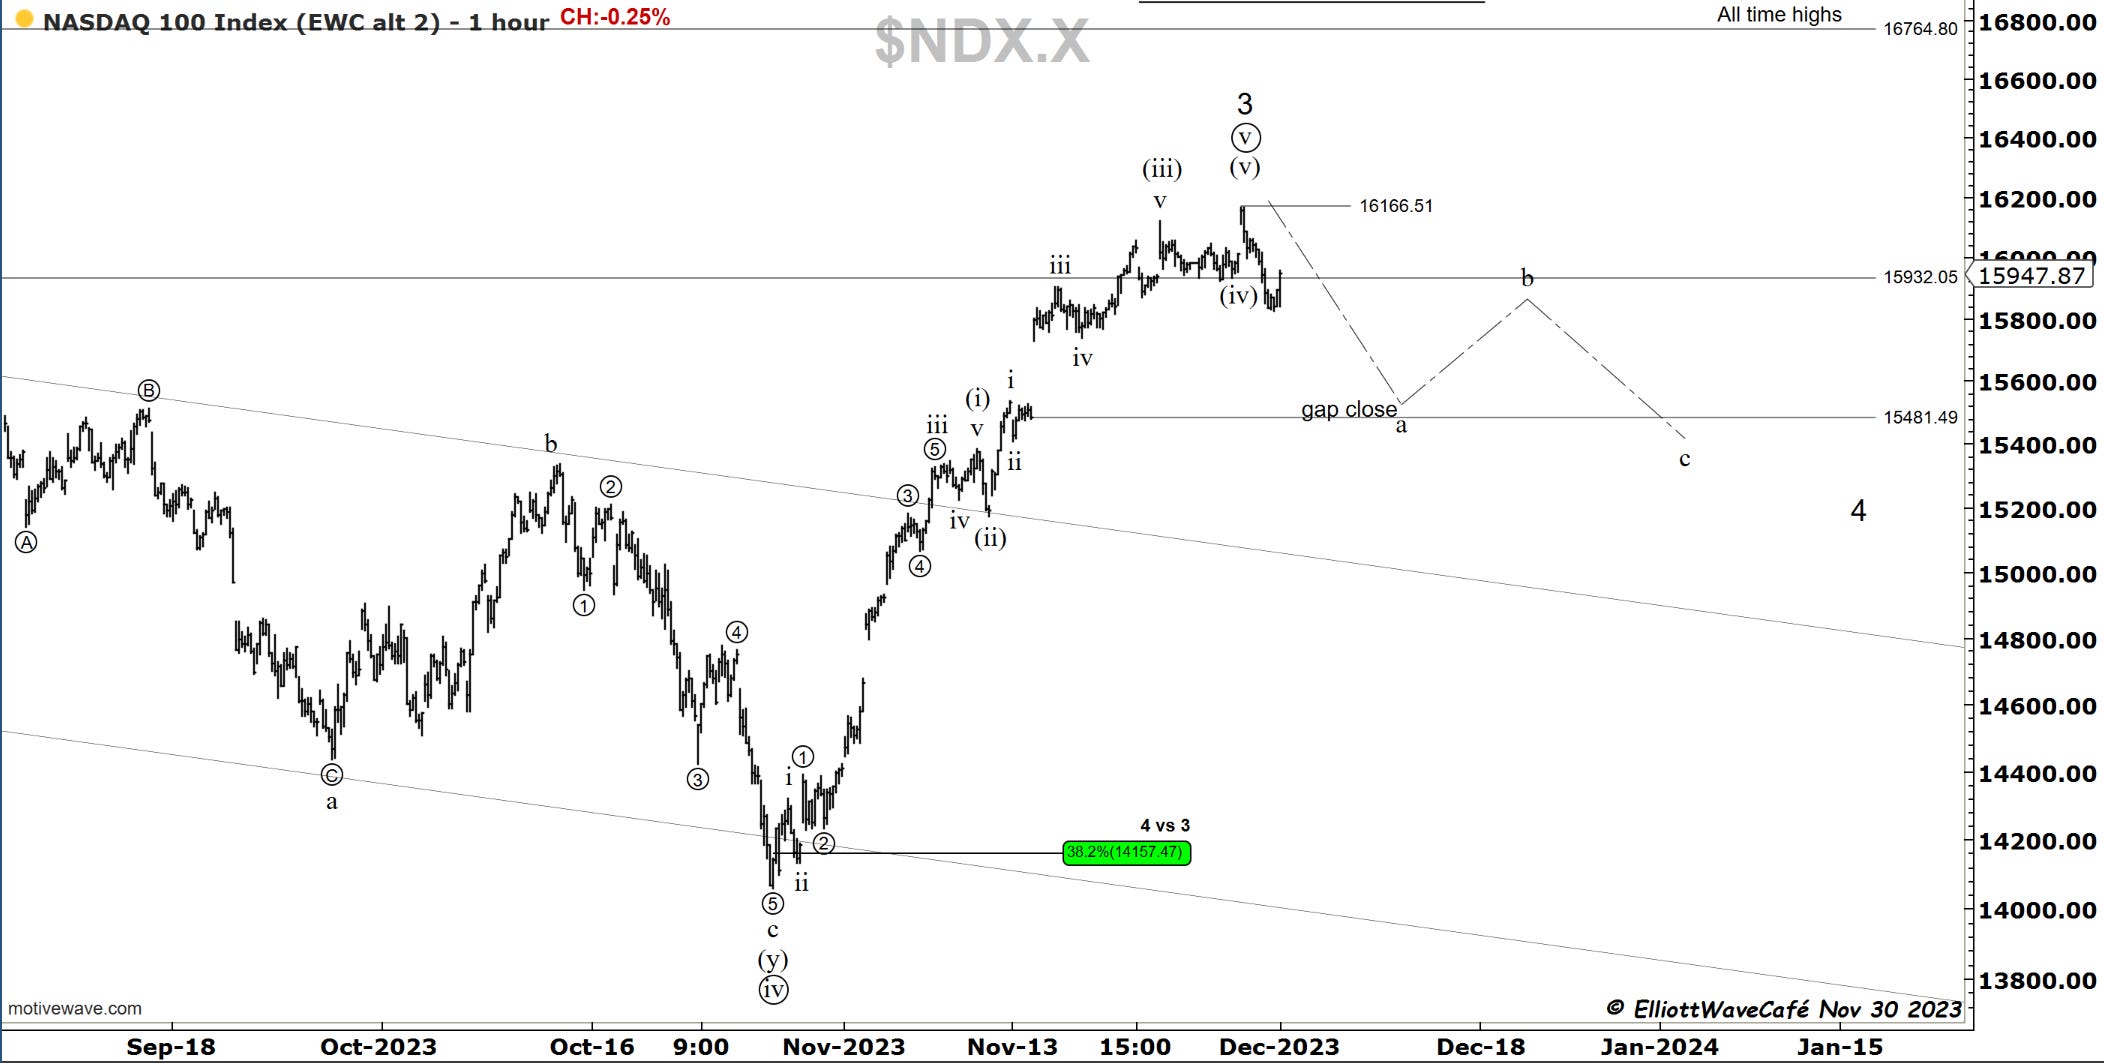
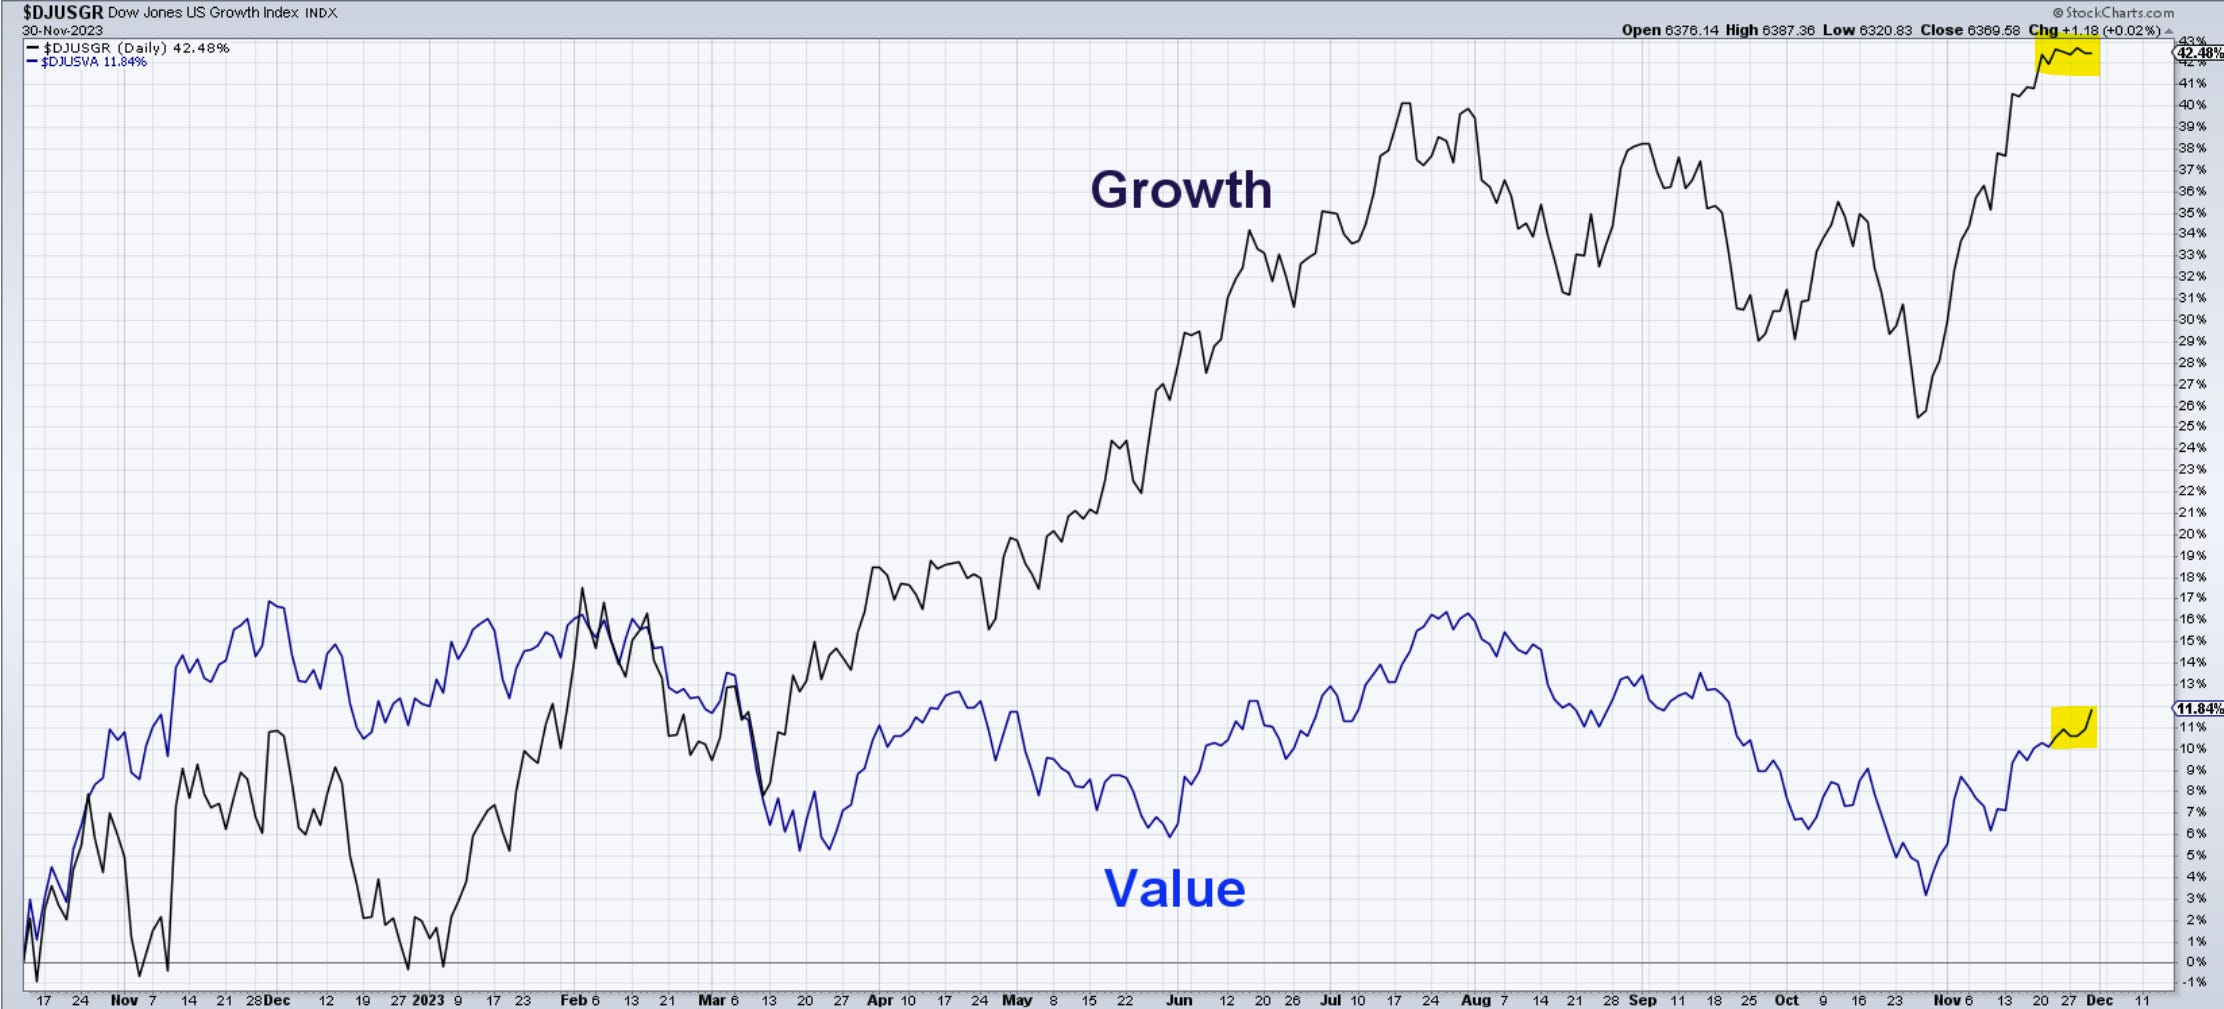
Nasdaq100
The Nasdaq100 and the Dow were heading in completely different directions today. While at some point we were losing -1% in the Nas, the Dow was up +1%. It felt like whatever profits were being taken from the growth trade were being moved into value. The chart structure shows a broken trend and a drop below the previous wave (iv) low. While there is a small chance of a flat in (iv) just like in the Sp500, my bet is that this correction continues lower and closes that gap shown below.
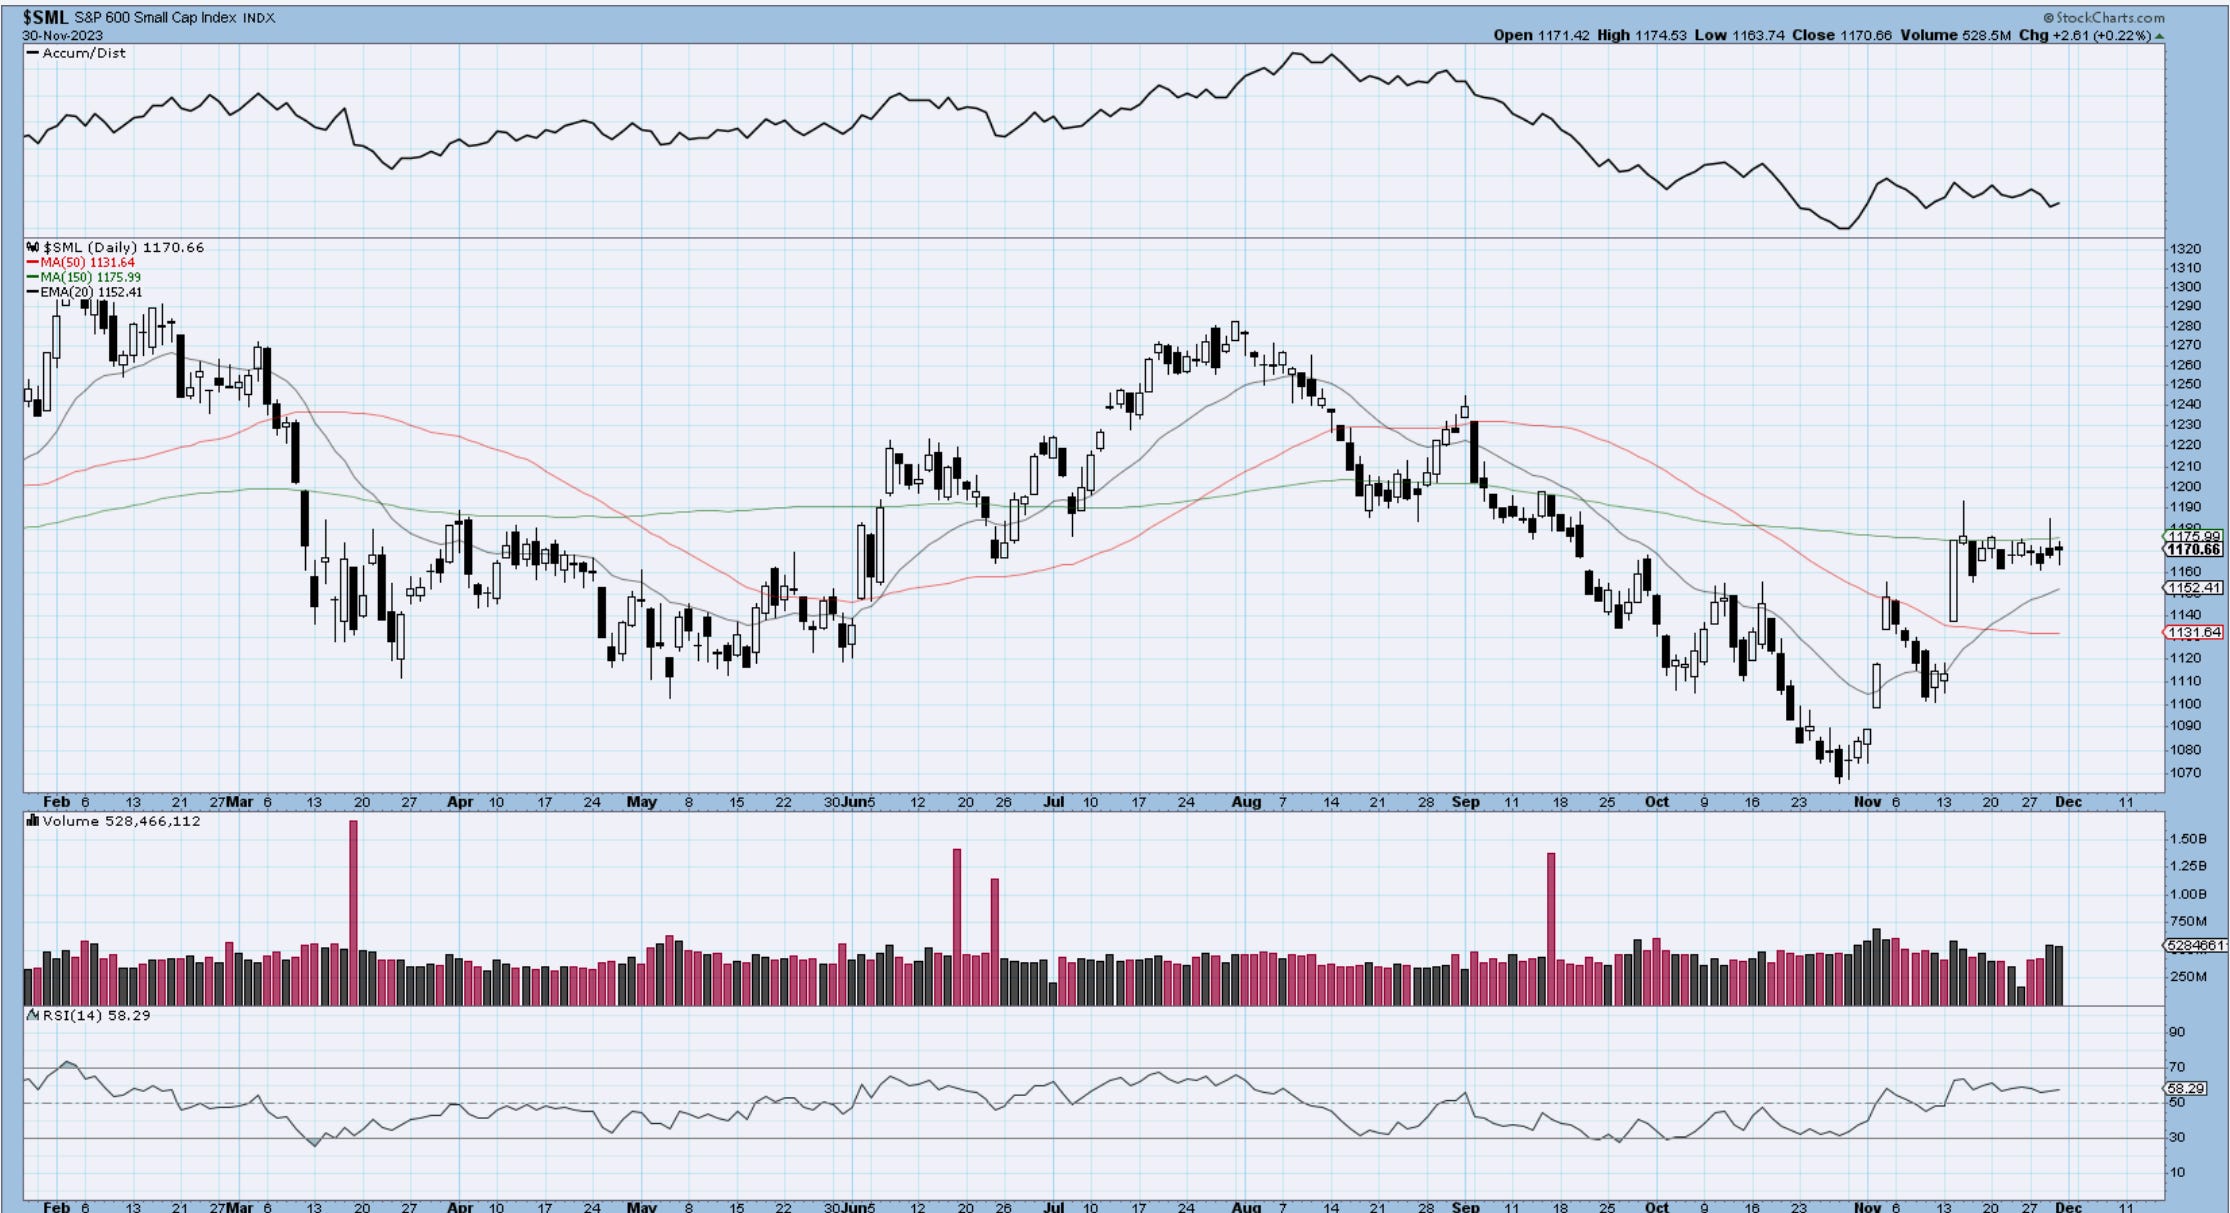
RUSSELL 2000
Small caps are being capped just under that 150-day MA. A triangle that has not been resolved yet. Once it does, for the sake of the bulls let’s hope they sustain it.

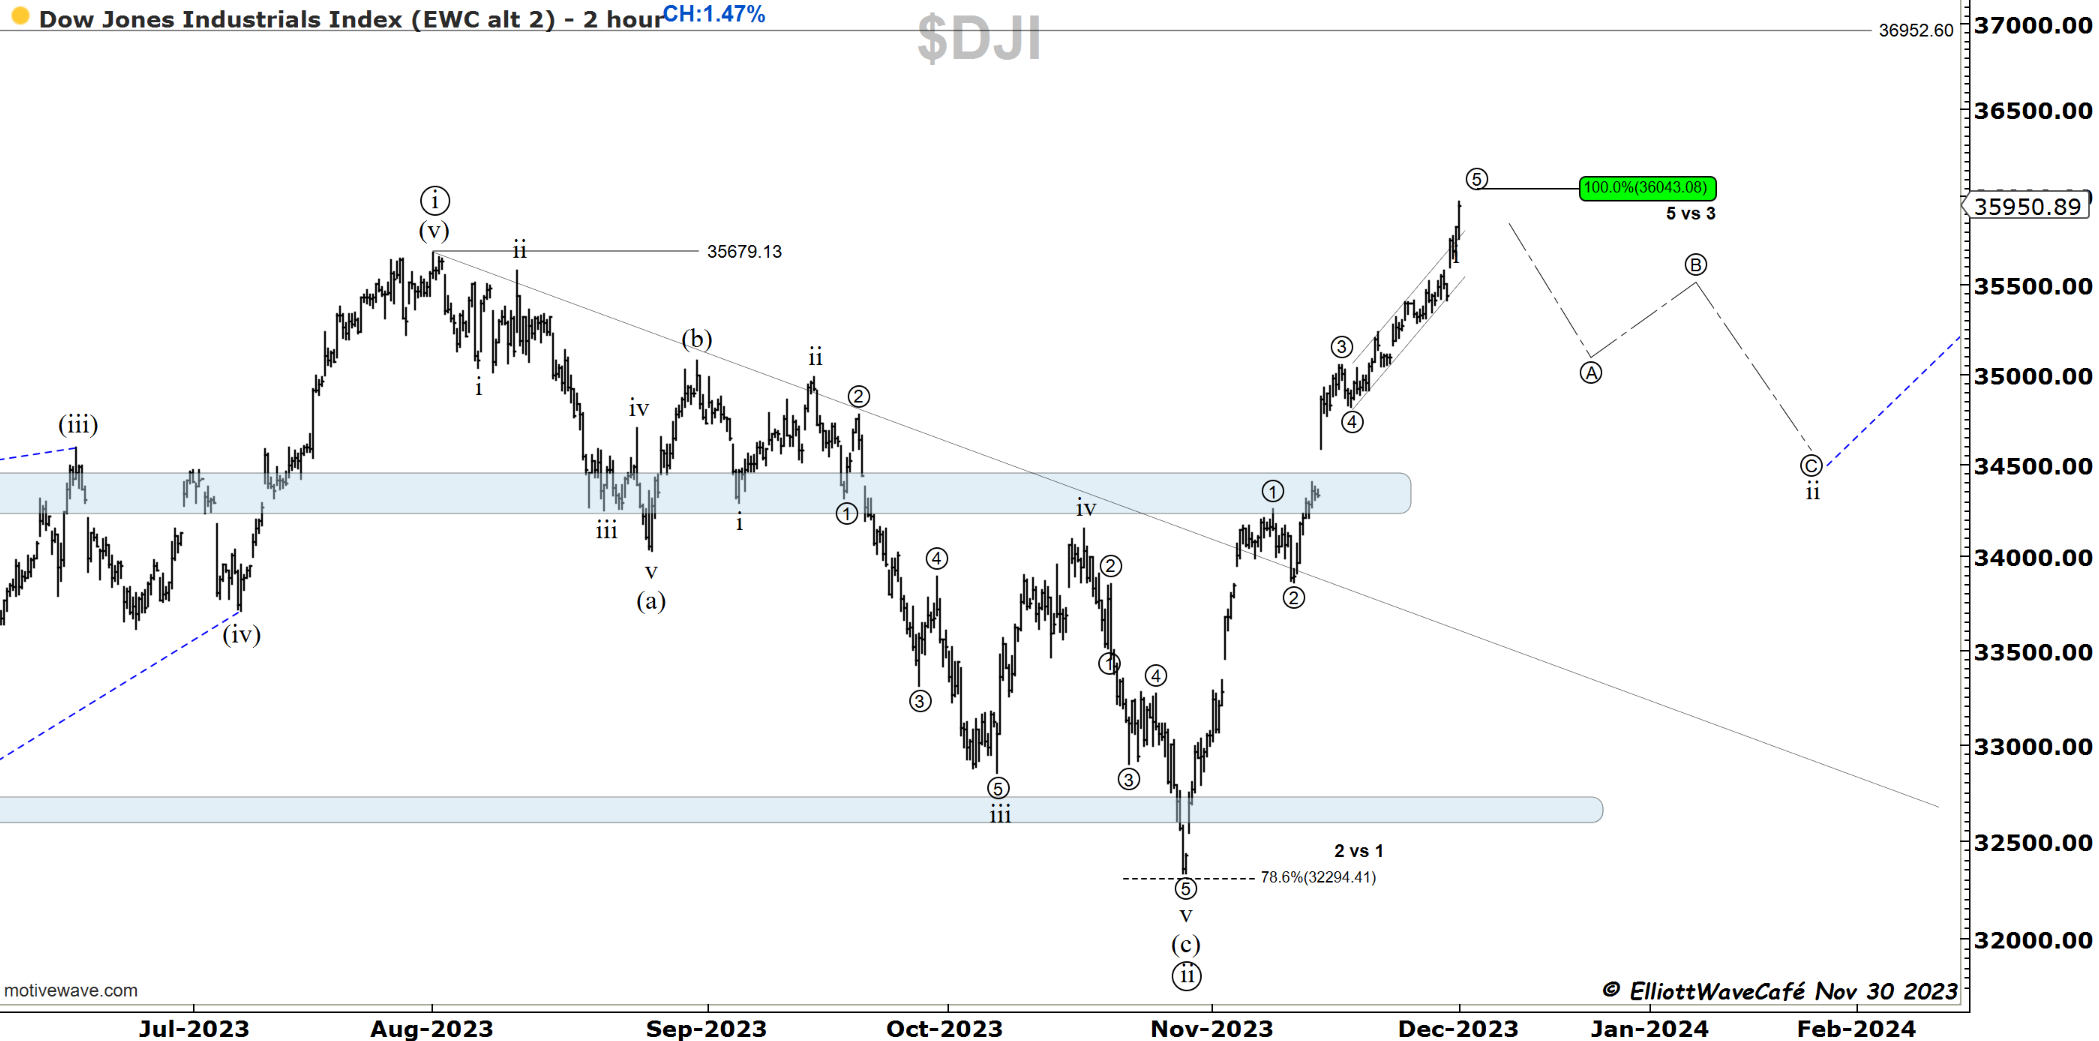
Dow30
What a display of strength from the Dow today. The count is pressured, but the rules are clear. The price cannot surpass 36,043 or else wave ((3)) becomes the shortest wave in the sequence. That’s a rule violation of motive waves. If it does, that’s a signal that wave ((3)) is still unfolding and will need to be adjusted.
If you were a reader here, back in June, and July I said that the Dow will be the first market that will reach new ATH this year. Little did I expect that the turnaround would be so quick and swift. This reinforces the well-known axiom “Markets go to the most obvious places, in the least obvious way”.
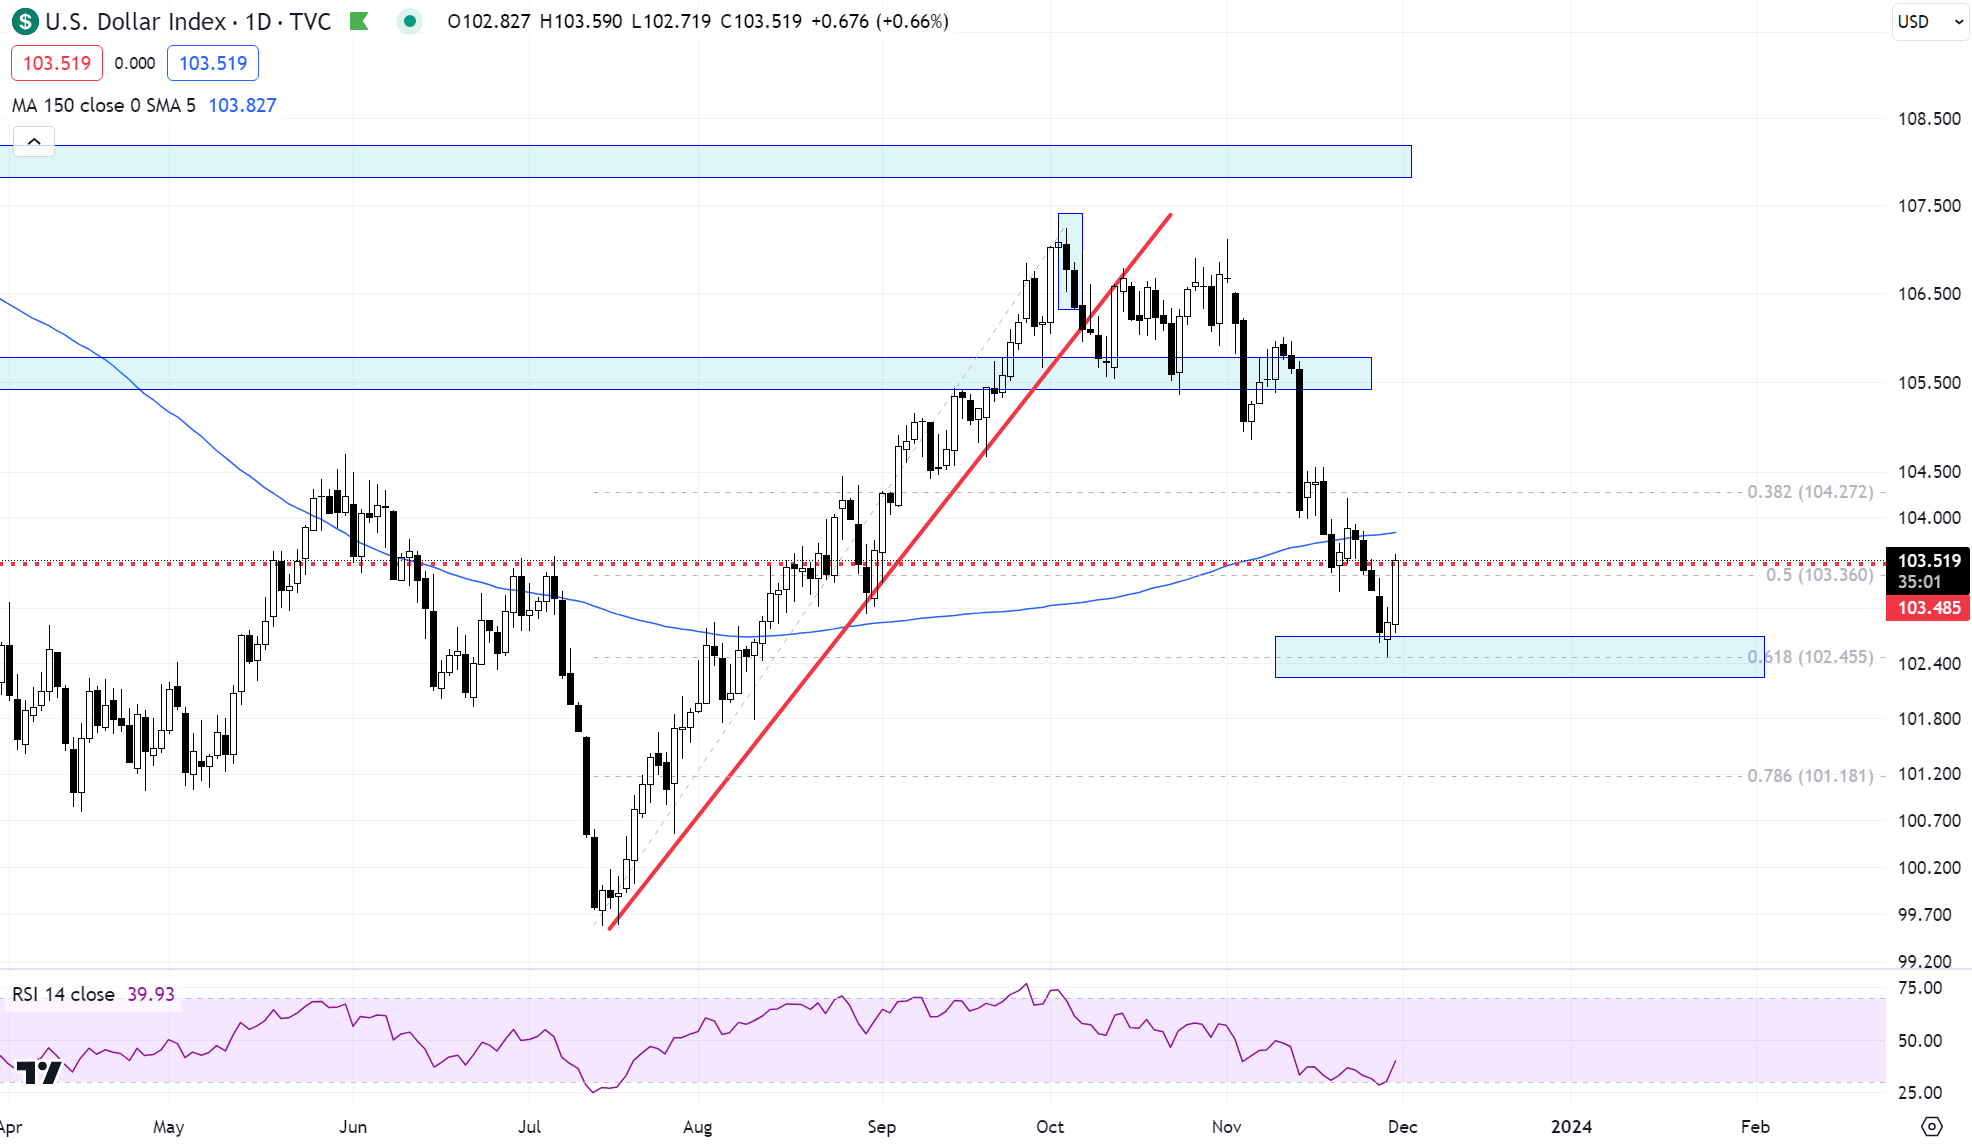
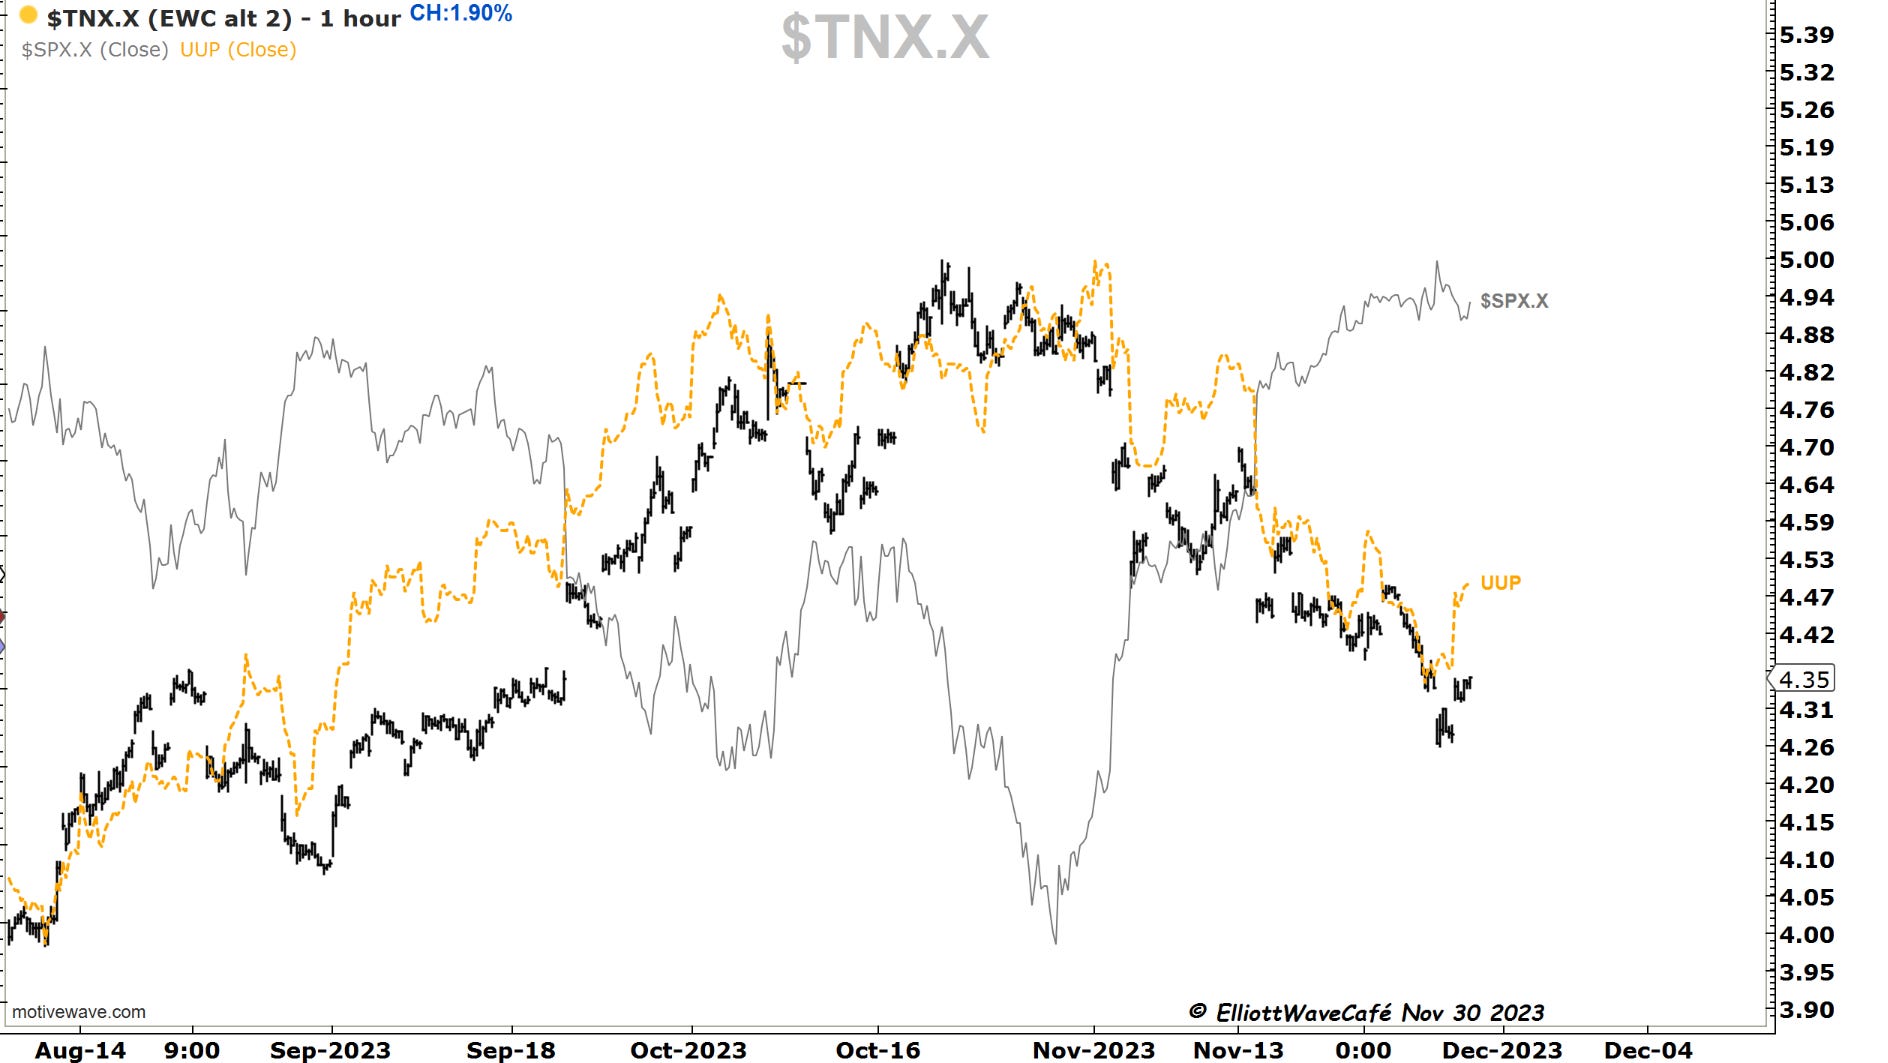
US Dollar and Yields
Today was a whacky market. The dollar had a huge day while risk assets were mixed. Good reaction from the fib zone. If the USD strength continues, it will be difficult for equities to keep positive. Yields have found a bid as well into 4.25.
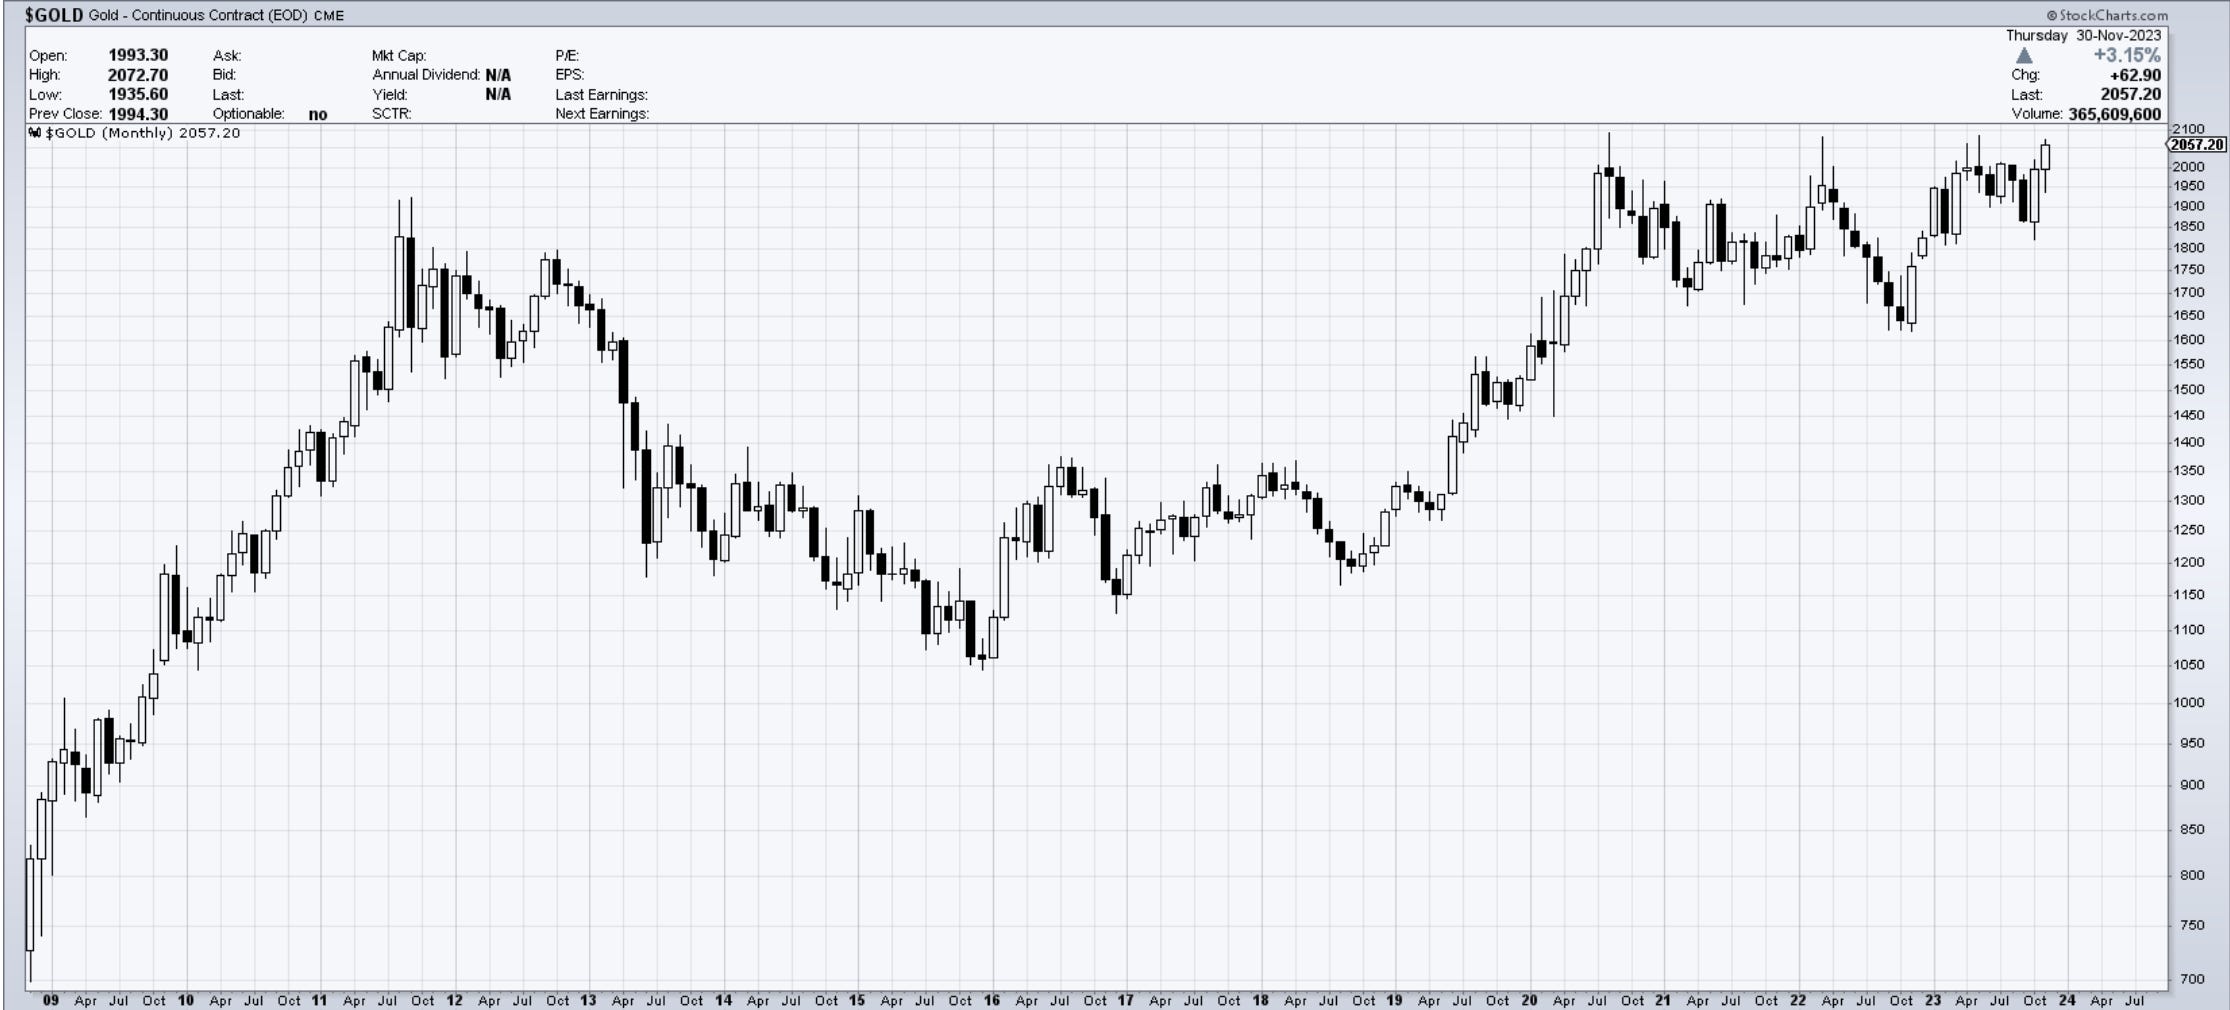
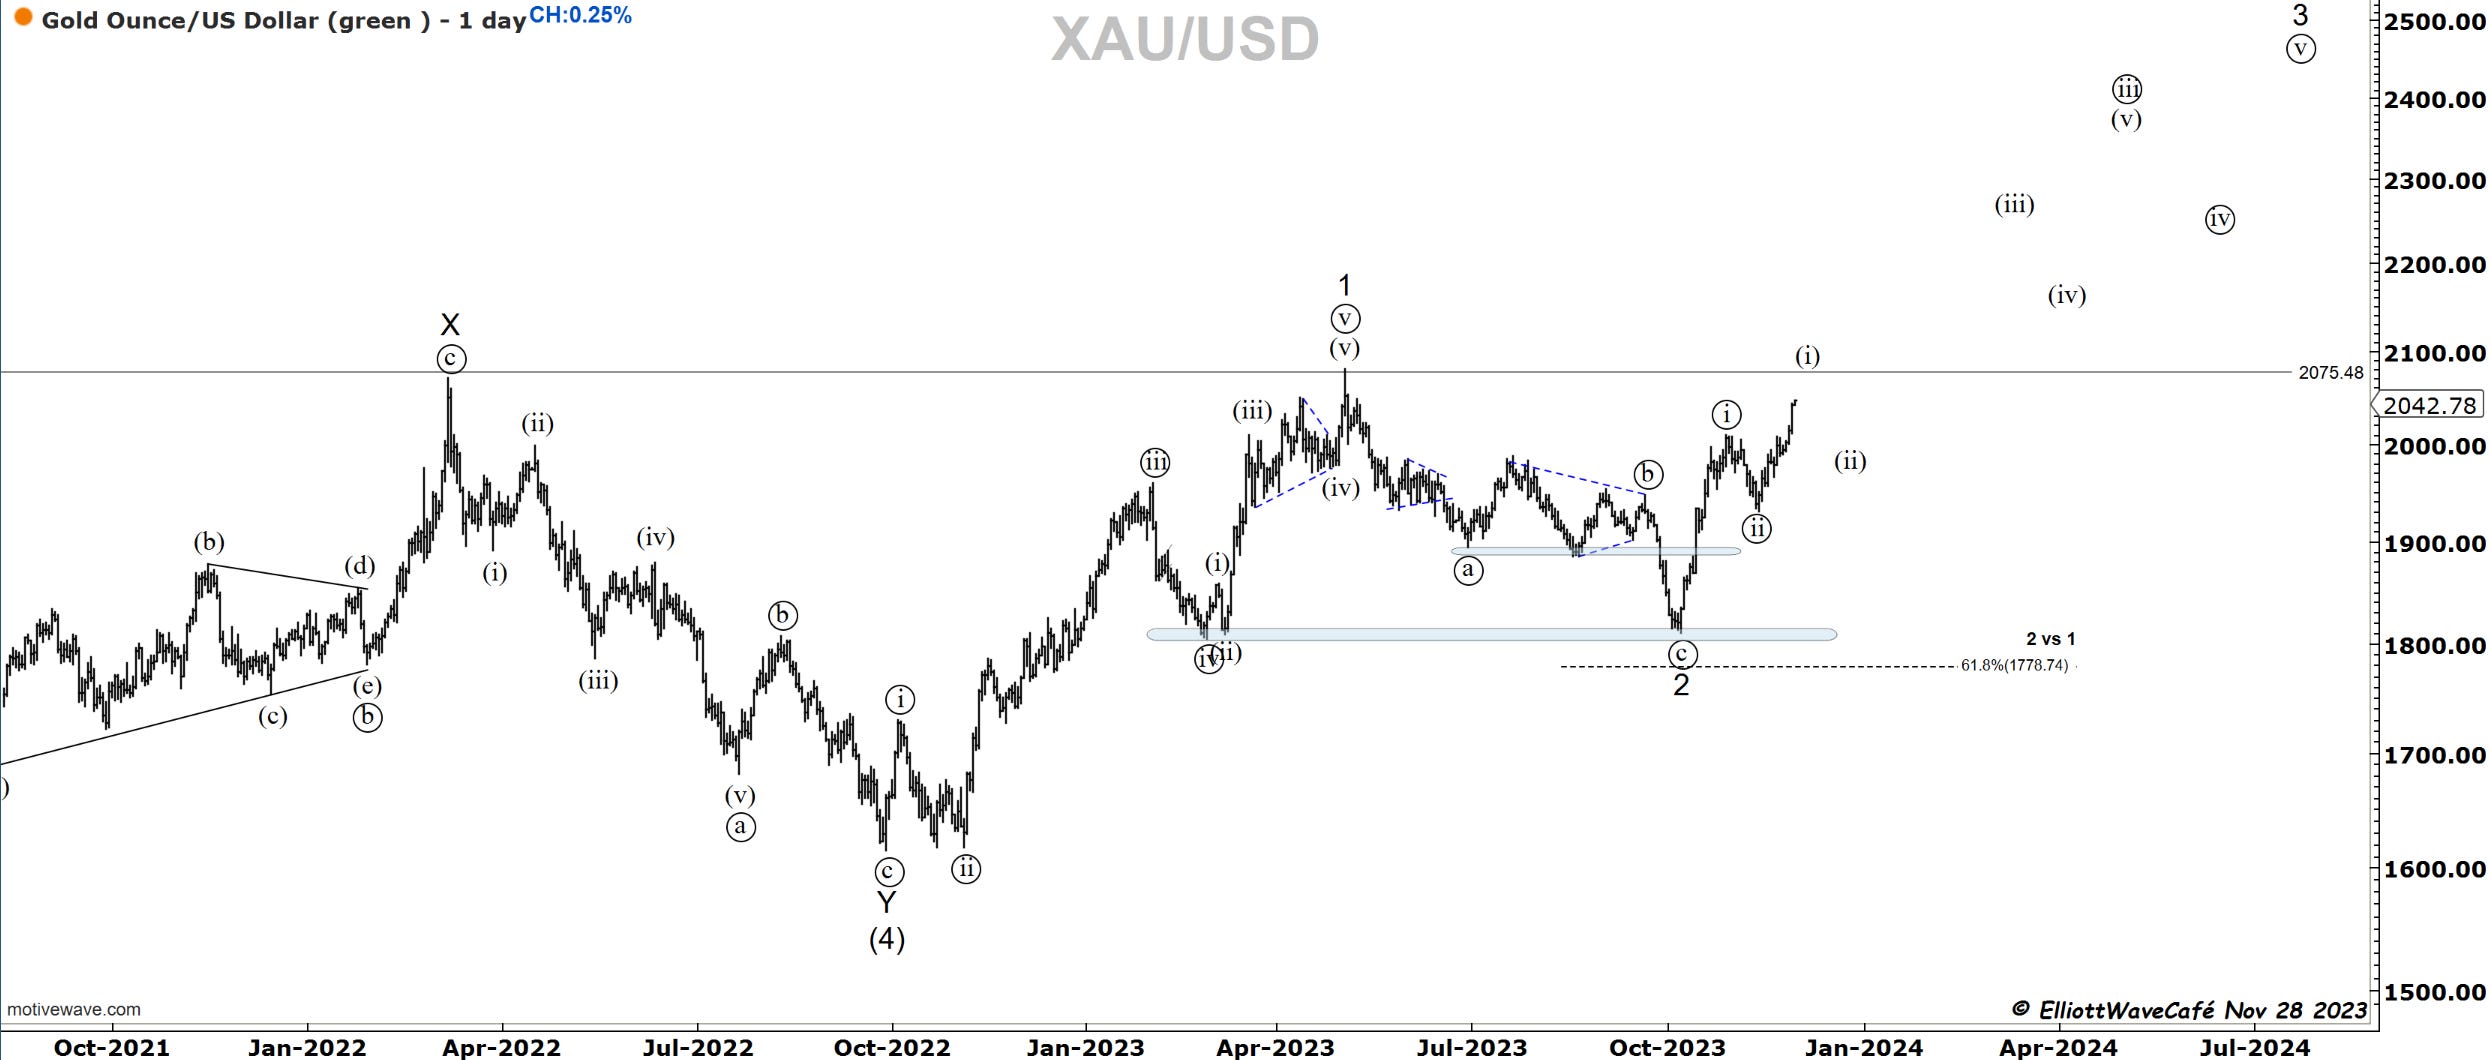
Gold
Highest monthly close in the history of Gold. 2057.20. Looks like the engines are warming up. Due to so many failures, I have my share of skepticism but it’s hard not to notice what’s happening on this chart. A very simple rule here could be. Long above 2000 only. As simple as that.
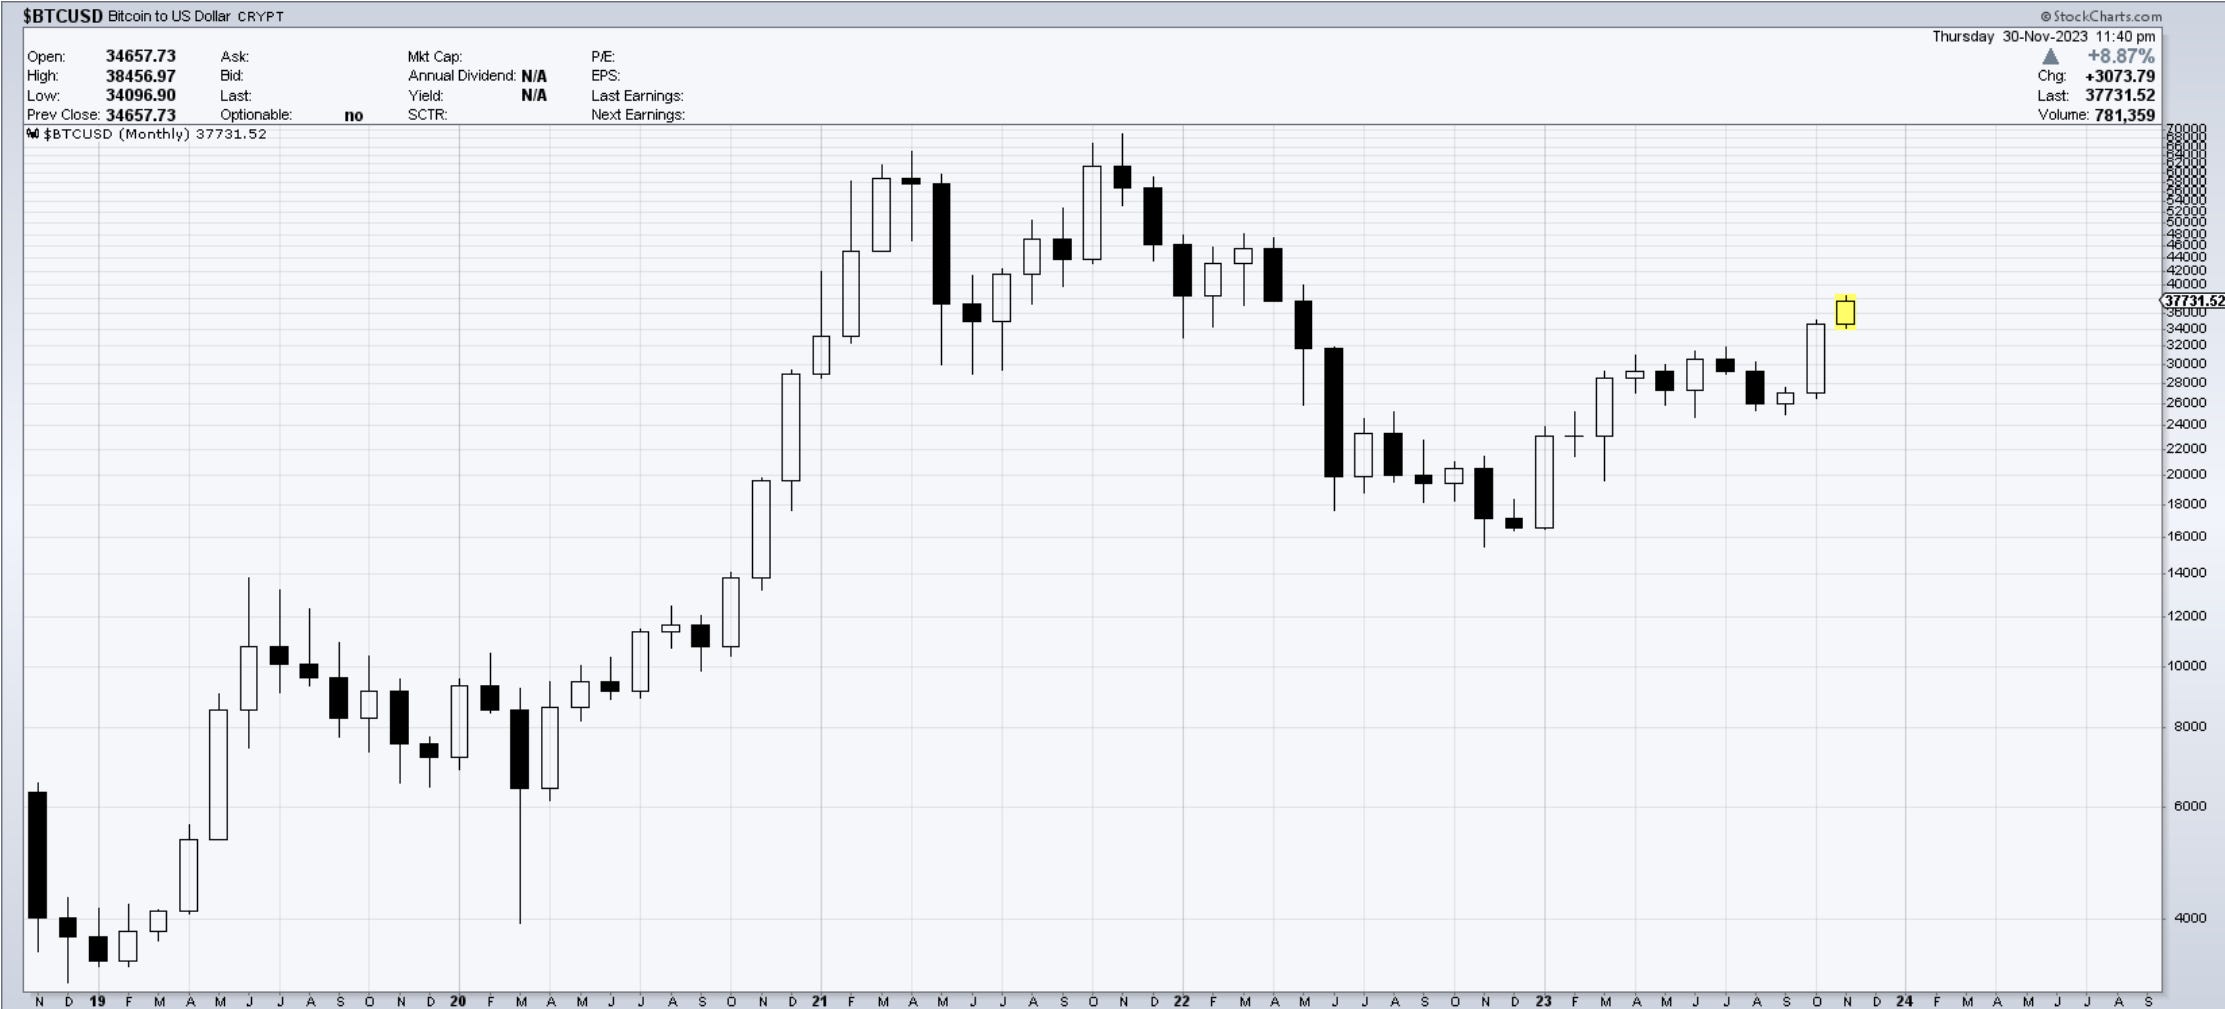
Bitcoin
Not a huge month for BTC but this chart continues to look bullish. You can see the 32k support which even if it gets tested it would not do much technical damage. Especially if it leaves a long tail from it. On this chart, if we break higher there is nothing much in the way until 47k. Just like in Gold, as simple as Long only above 32k. Will discuss shorter term moves next week.
See you all next week! Thanks for subscribing and sharing!
Daily video coming up next,
Have a great day wherever you are! - trade well, and don’t forget to subscribe and drop a like if this letter helps you in any way.
Cris
email: ewcafe@pm.me