
The Daily Drip
Markets review, strategy and analysis
Note: The EW counts on the right edge are real-time, and they are prone to adjustments as price action develops. Elliott Wave has a fluid approach, is evidence-based, and requires constant monitoring of certain thresholds.
In the counts below, this (( )) = circle on chart
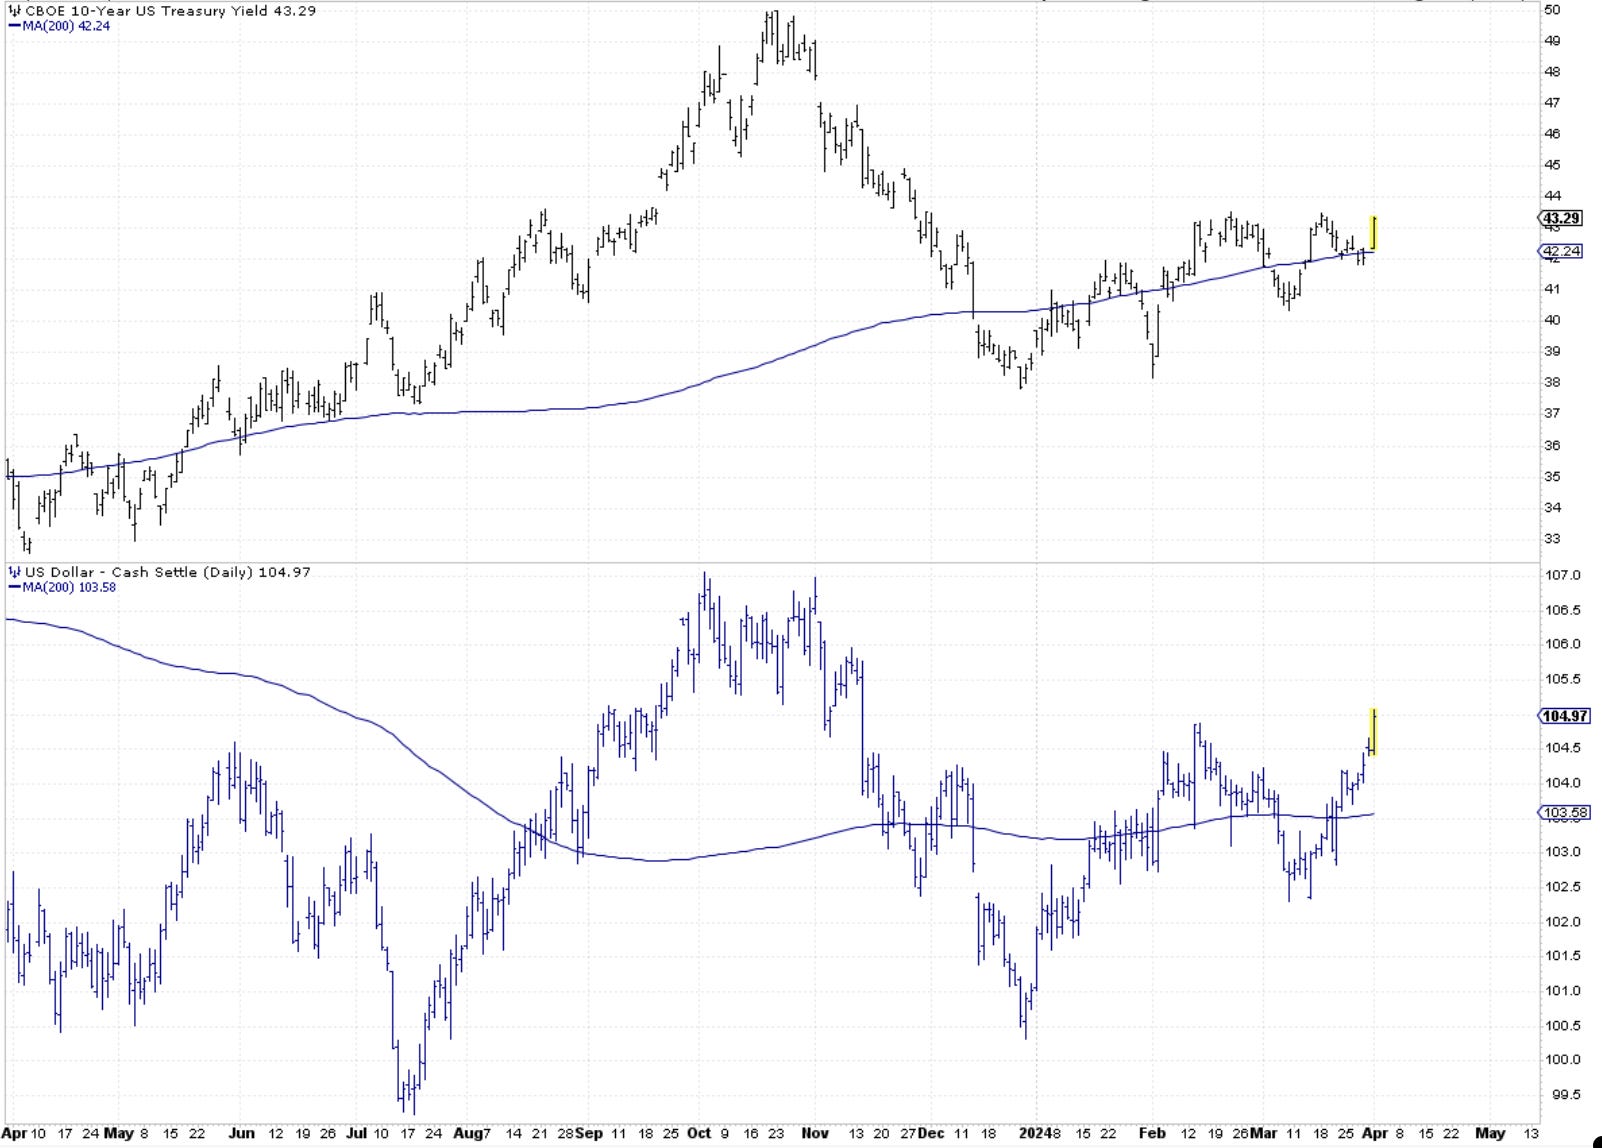
Chart of the Day—DXY and TNX—The Dollar and yields remain pretty tight at the hip. The 10-year is threatening to break 4.35%, and the dollar wants to break 105. Both of these moving higher are not friendly toward risk appetite. What kind of alarm are they sounding?
On the last notes from last week, we looked at markets outside the US and discussed the small caps behavior.
Today I will go over the current price action in the regular core markets
In the daily video, I will go over a set of stocks with decent buy opportunities …
Let's dive into the charts below …
