Bottom Line: Prior expectations have been met, and new all-time highs were made today in multiple markets. The upward trend remains in full force, and it suggests a continuation and increasing of long exposure.
Let’s now dive into charts and further analysis below…
Yesterday, we looked at wave counts; today, we will revisit the technical picture…
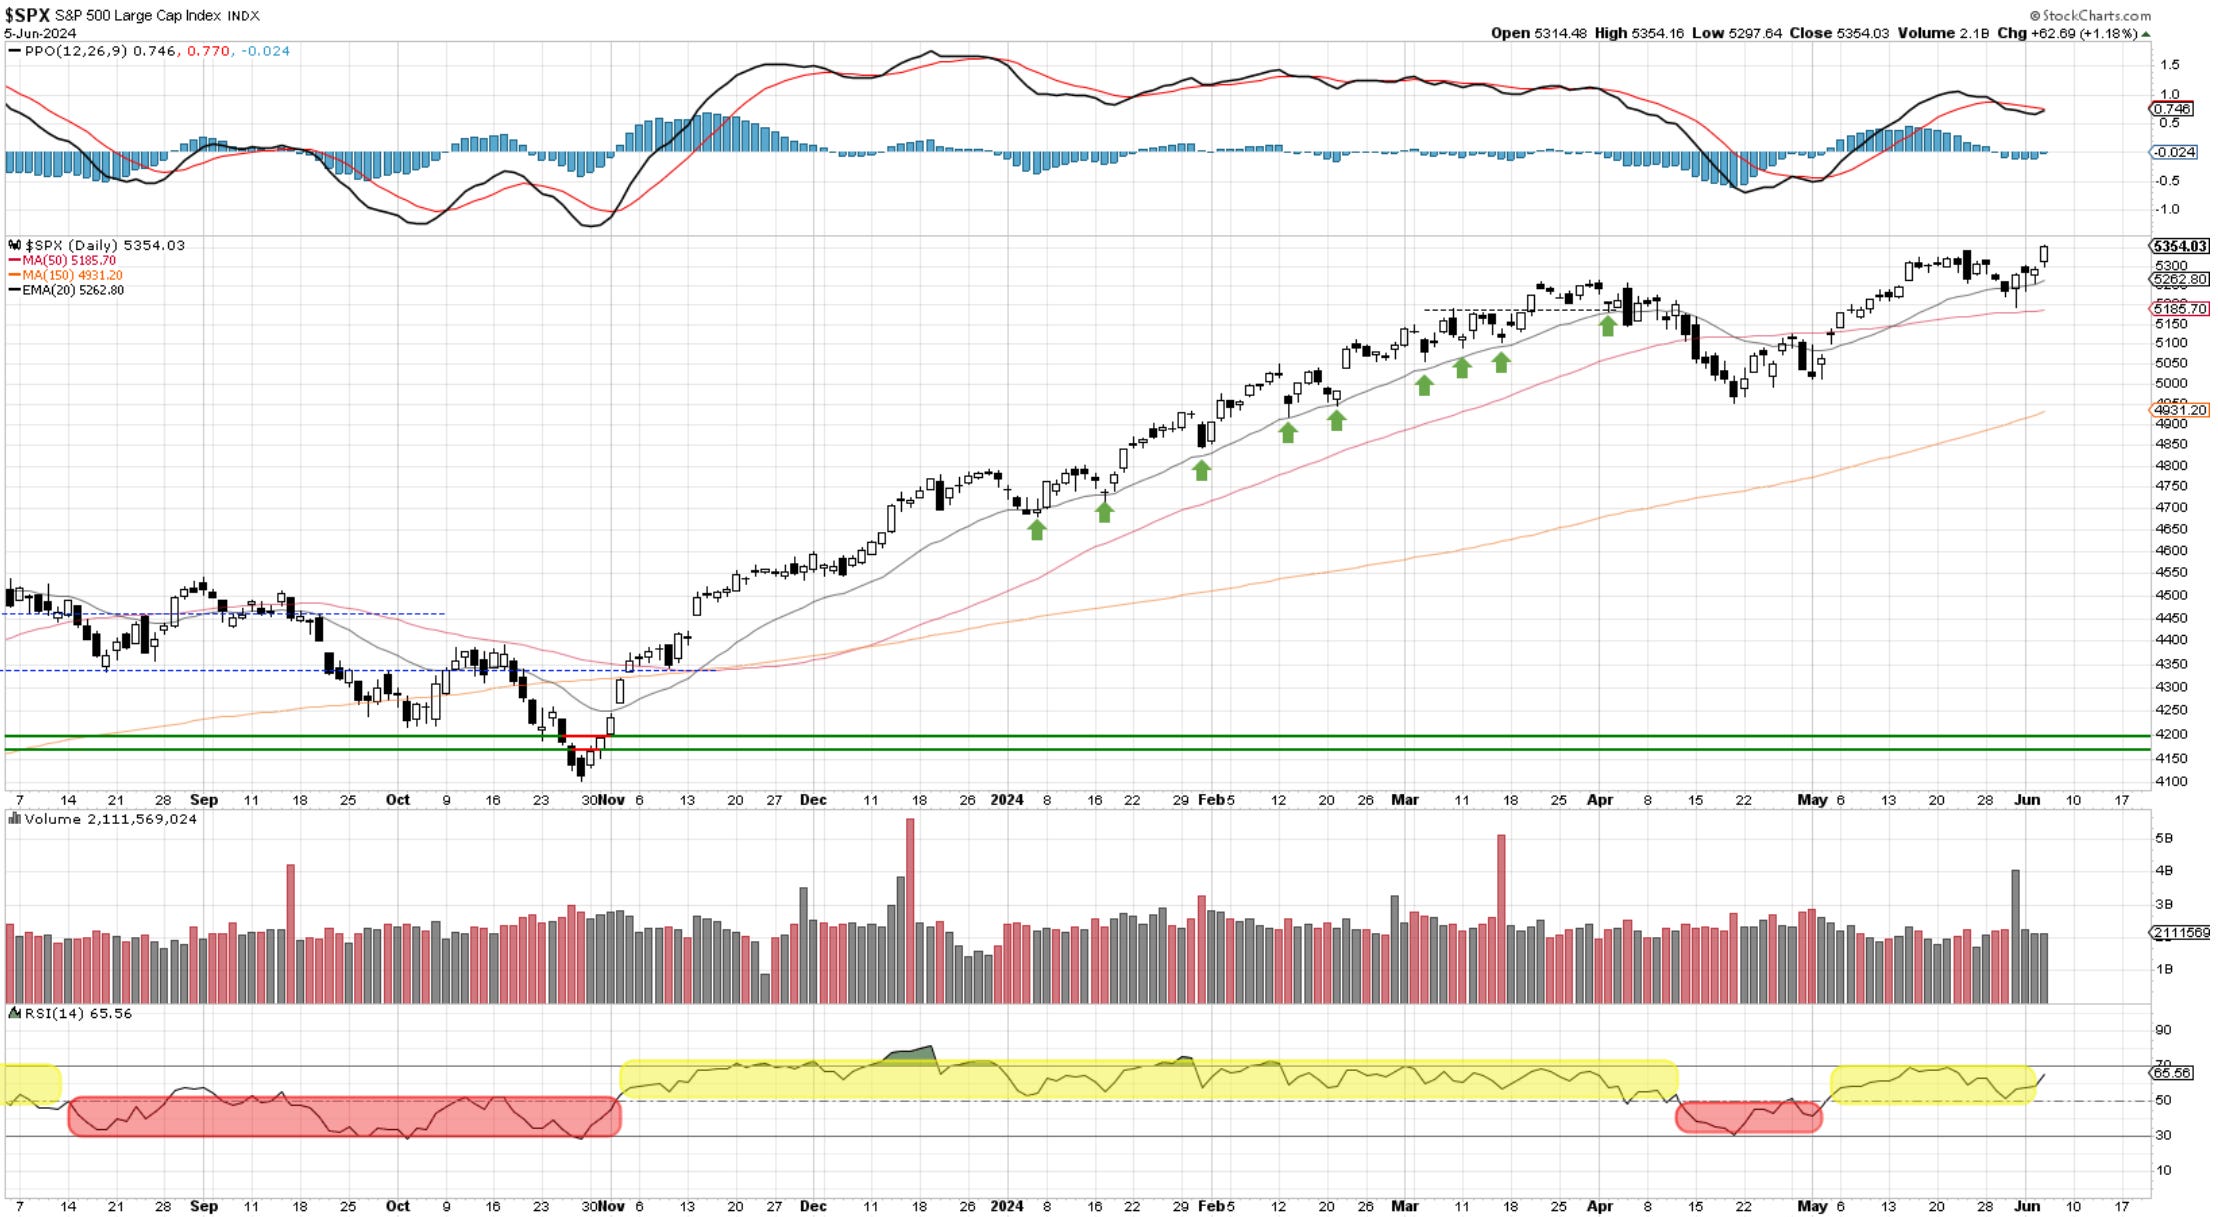
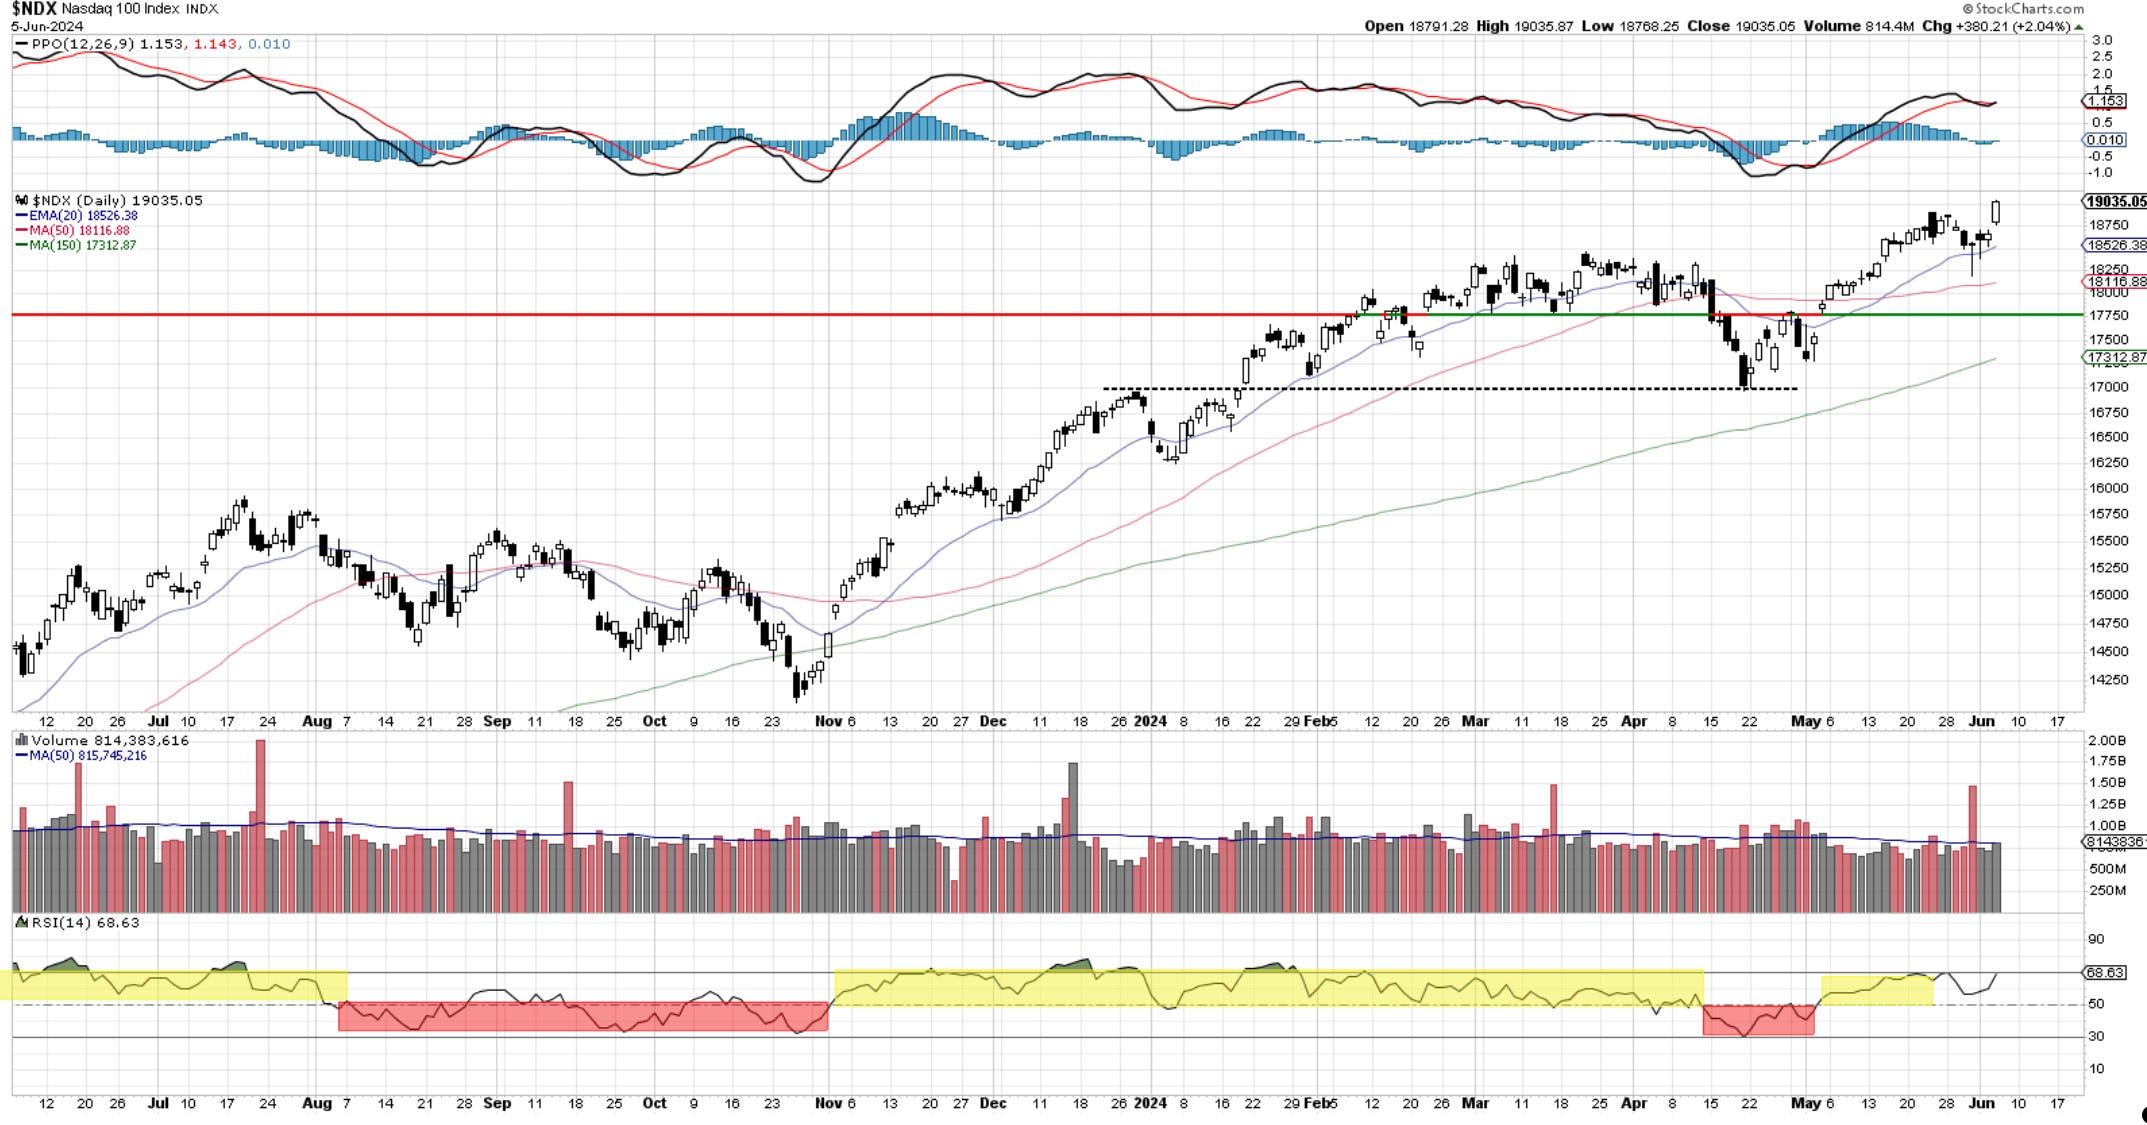
The market's signals in previous days have come to fruition today, with a breakout to new all-time highs. The close at the highs is encouraging for further upside, but yes I will always monitor for signs of failure. For now there are none, the RSI travels toward 70, the PPO is curving back, and the moving averages are starting to spread apart. The 20 is the first line of defense and it held its testing last week. I am increasing long exposure by adding to my APPL position and using some at the money 2-week calls for additional income.
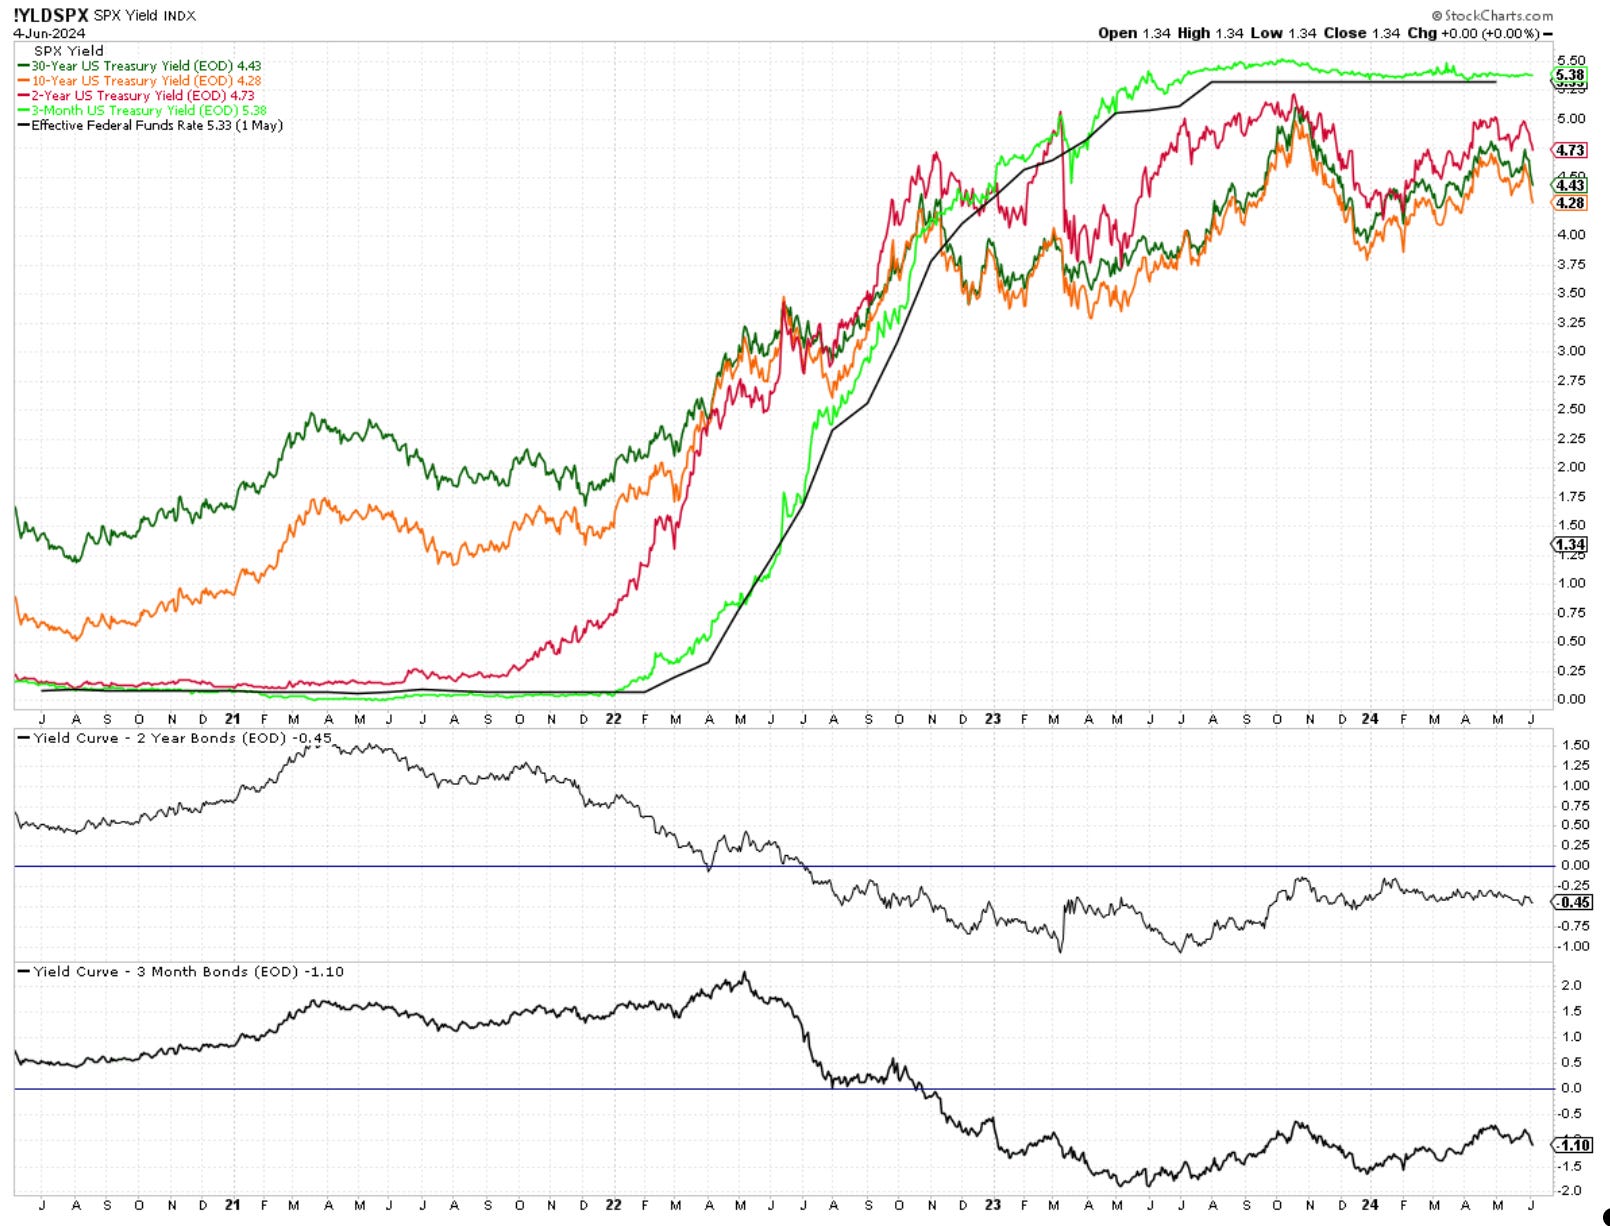
The upper pane shows a complex chart of yields at different durations. Most are heading lower, which is supportive for risk assets, while the 3MO remains steady until better signals appear from the Fed. Investors are making money both on the equity side and on the money market side. The lower panes show the yield inversion that continues to exist, and not many expected it to still be here after two years.
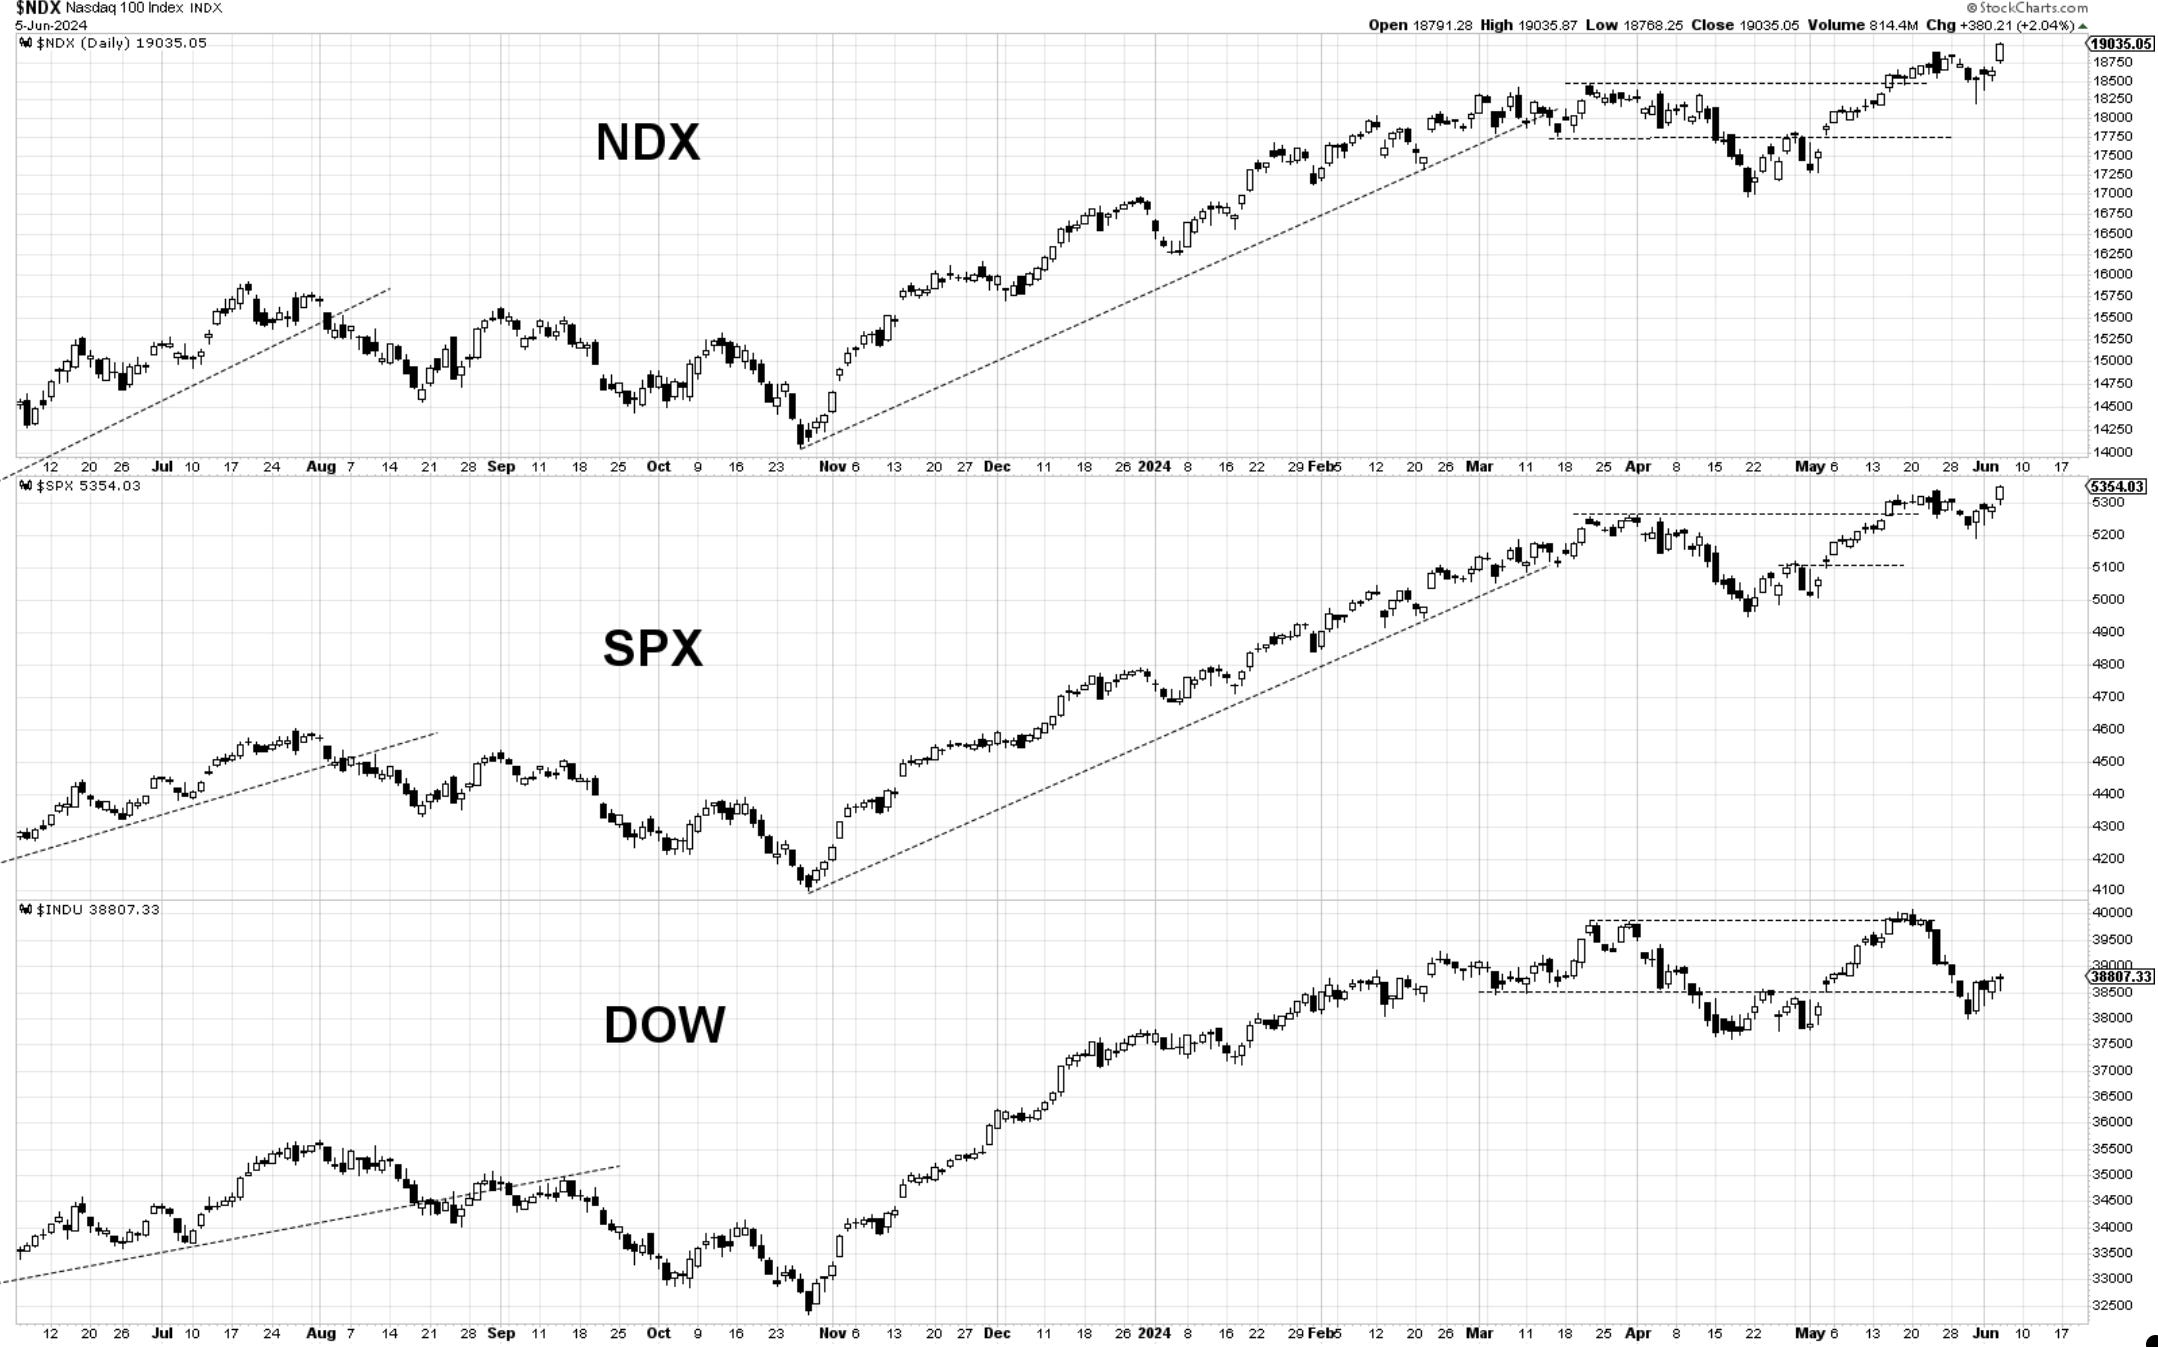
Nasdaq100 had a very strong day but it was actually the Nasdaq Composite that broke the sky first today. Higher then average volume is always welcome on breaks, let;s see if we get the follow thru tomorrow. I mentioned in videos the Friday and Monday action that left candle tails on charts suggestive of underlying buying strength. The market leaves clues in price behavior and this one seemed easier then others.
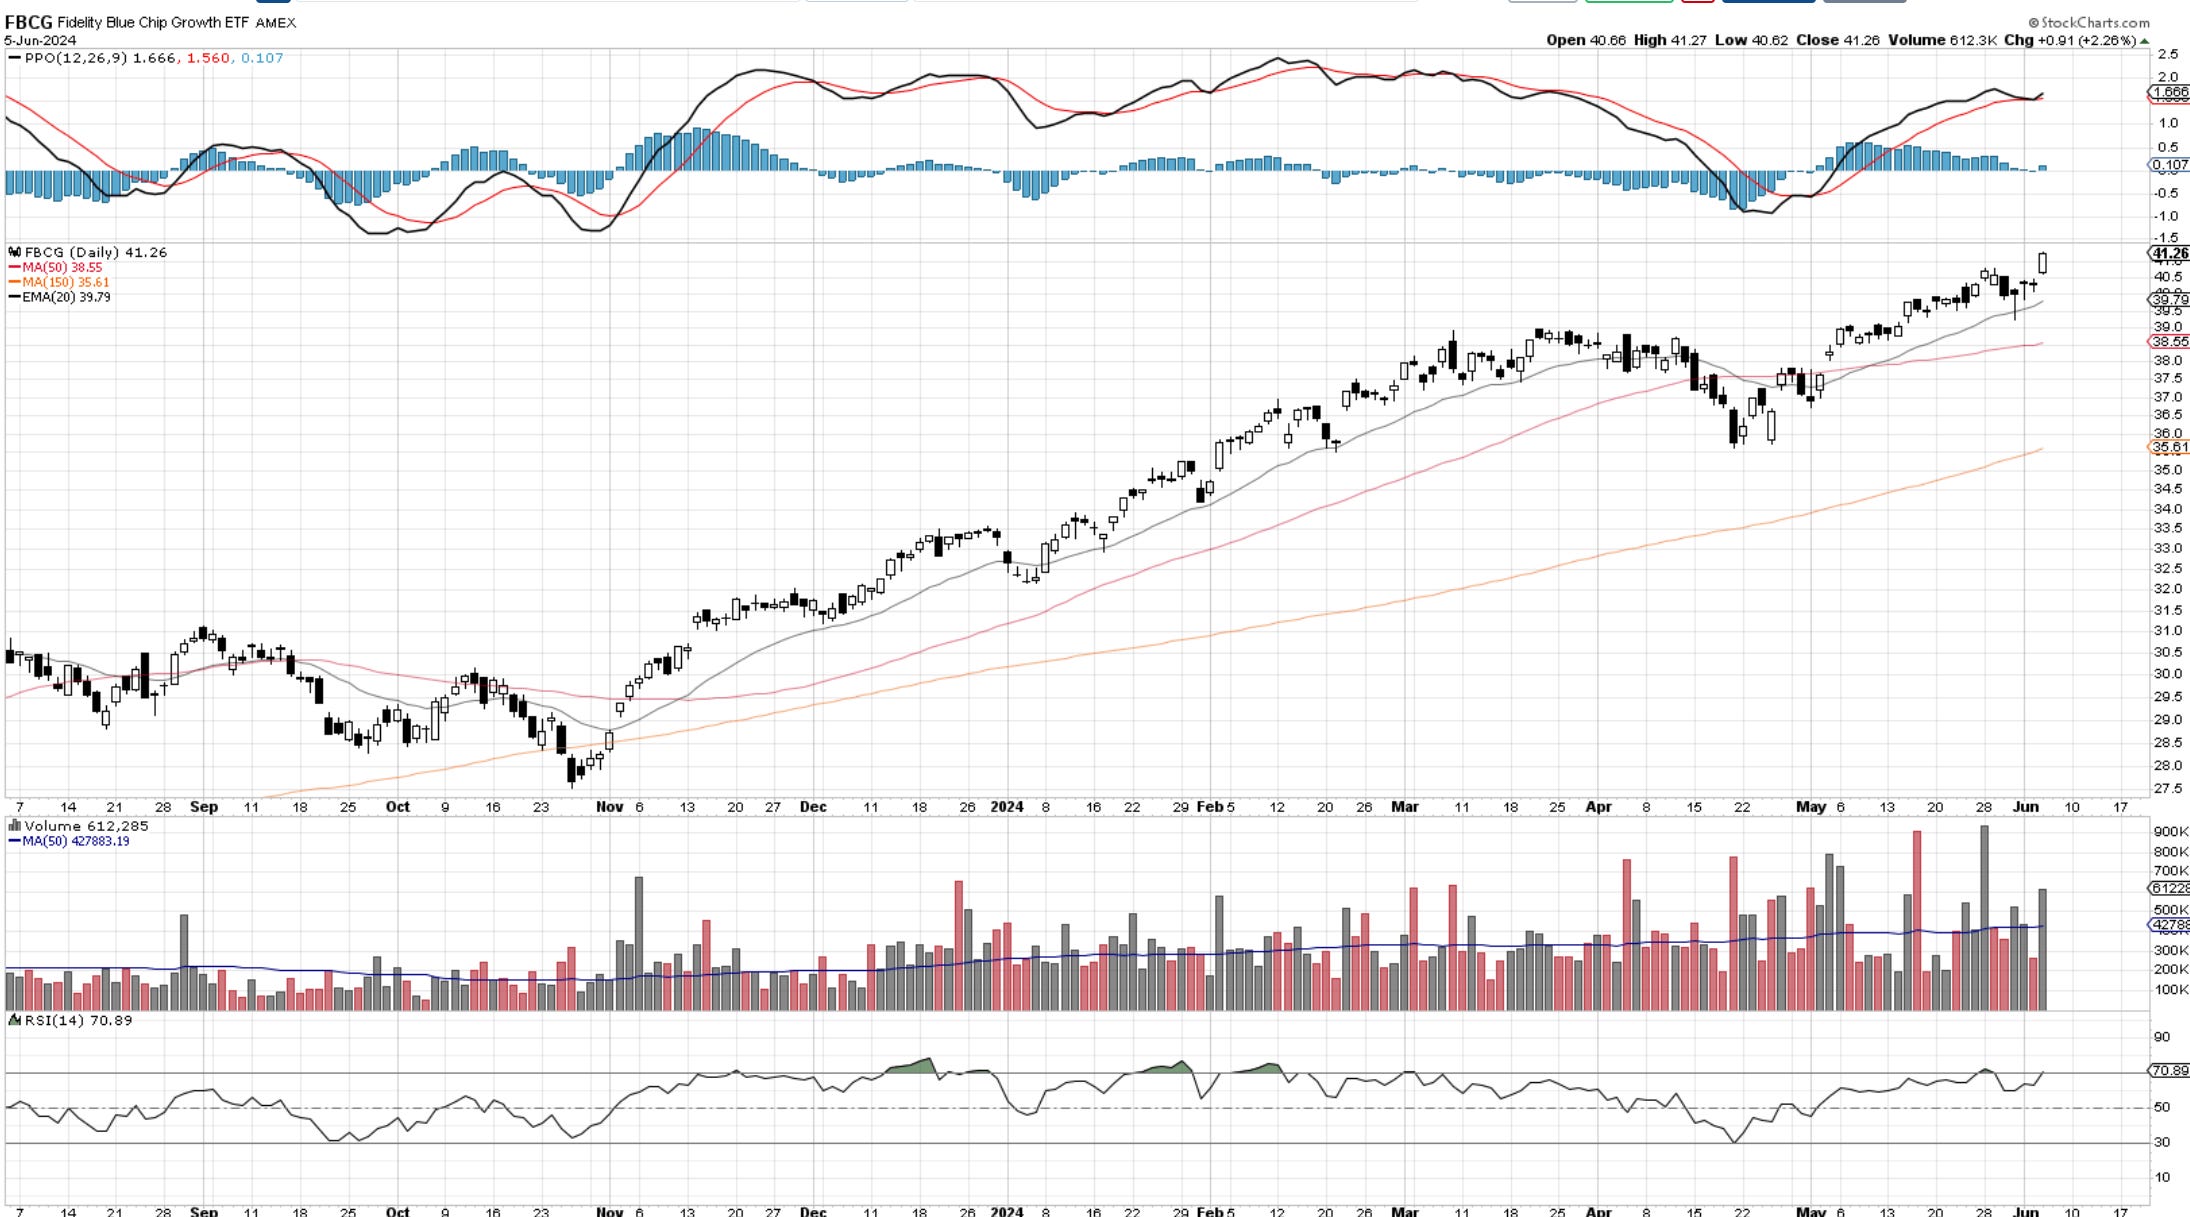
Blue Chip Growth was another chart that never faltered, and it actually told us it has relative strength. Many will only point to NVDA as the main culprit for the rise in markets, but there are many other stocks that act just as well. The leaders have to lead and she is doing a great job so far. One day it won’t, but who really knows when that day comes?
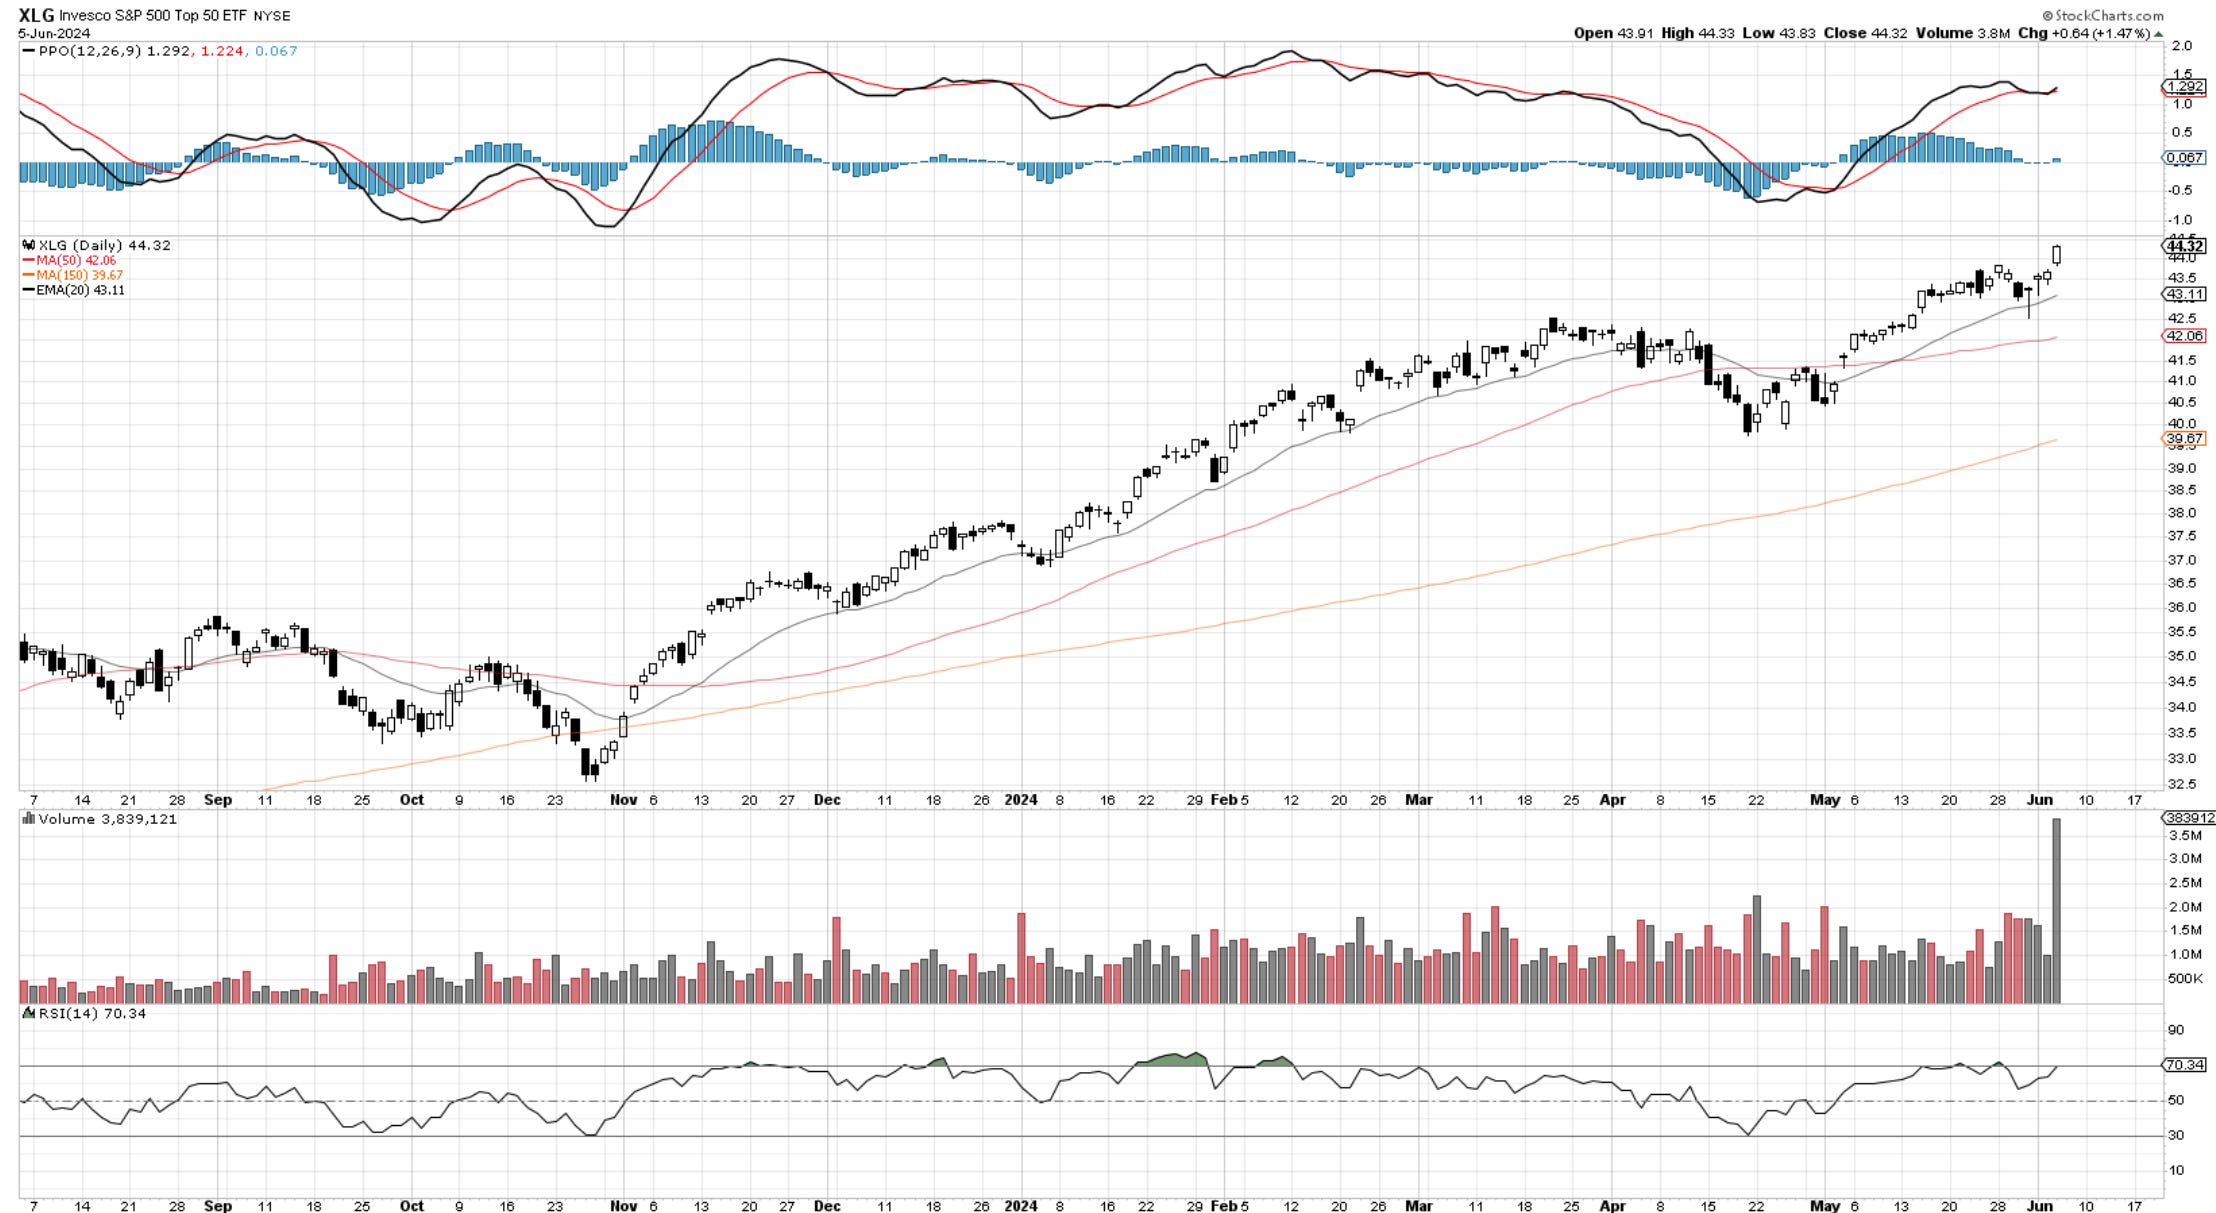
For kicks and giggles take a look at the top 50 stocks in the market and the accompanying volume today. Maybe it’s a glitch but I doubt it.
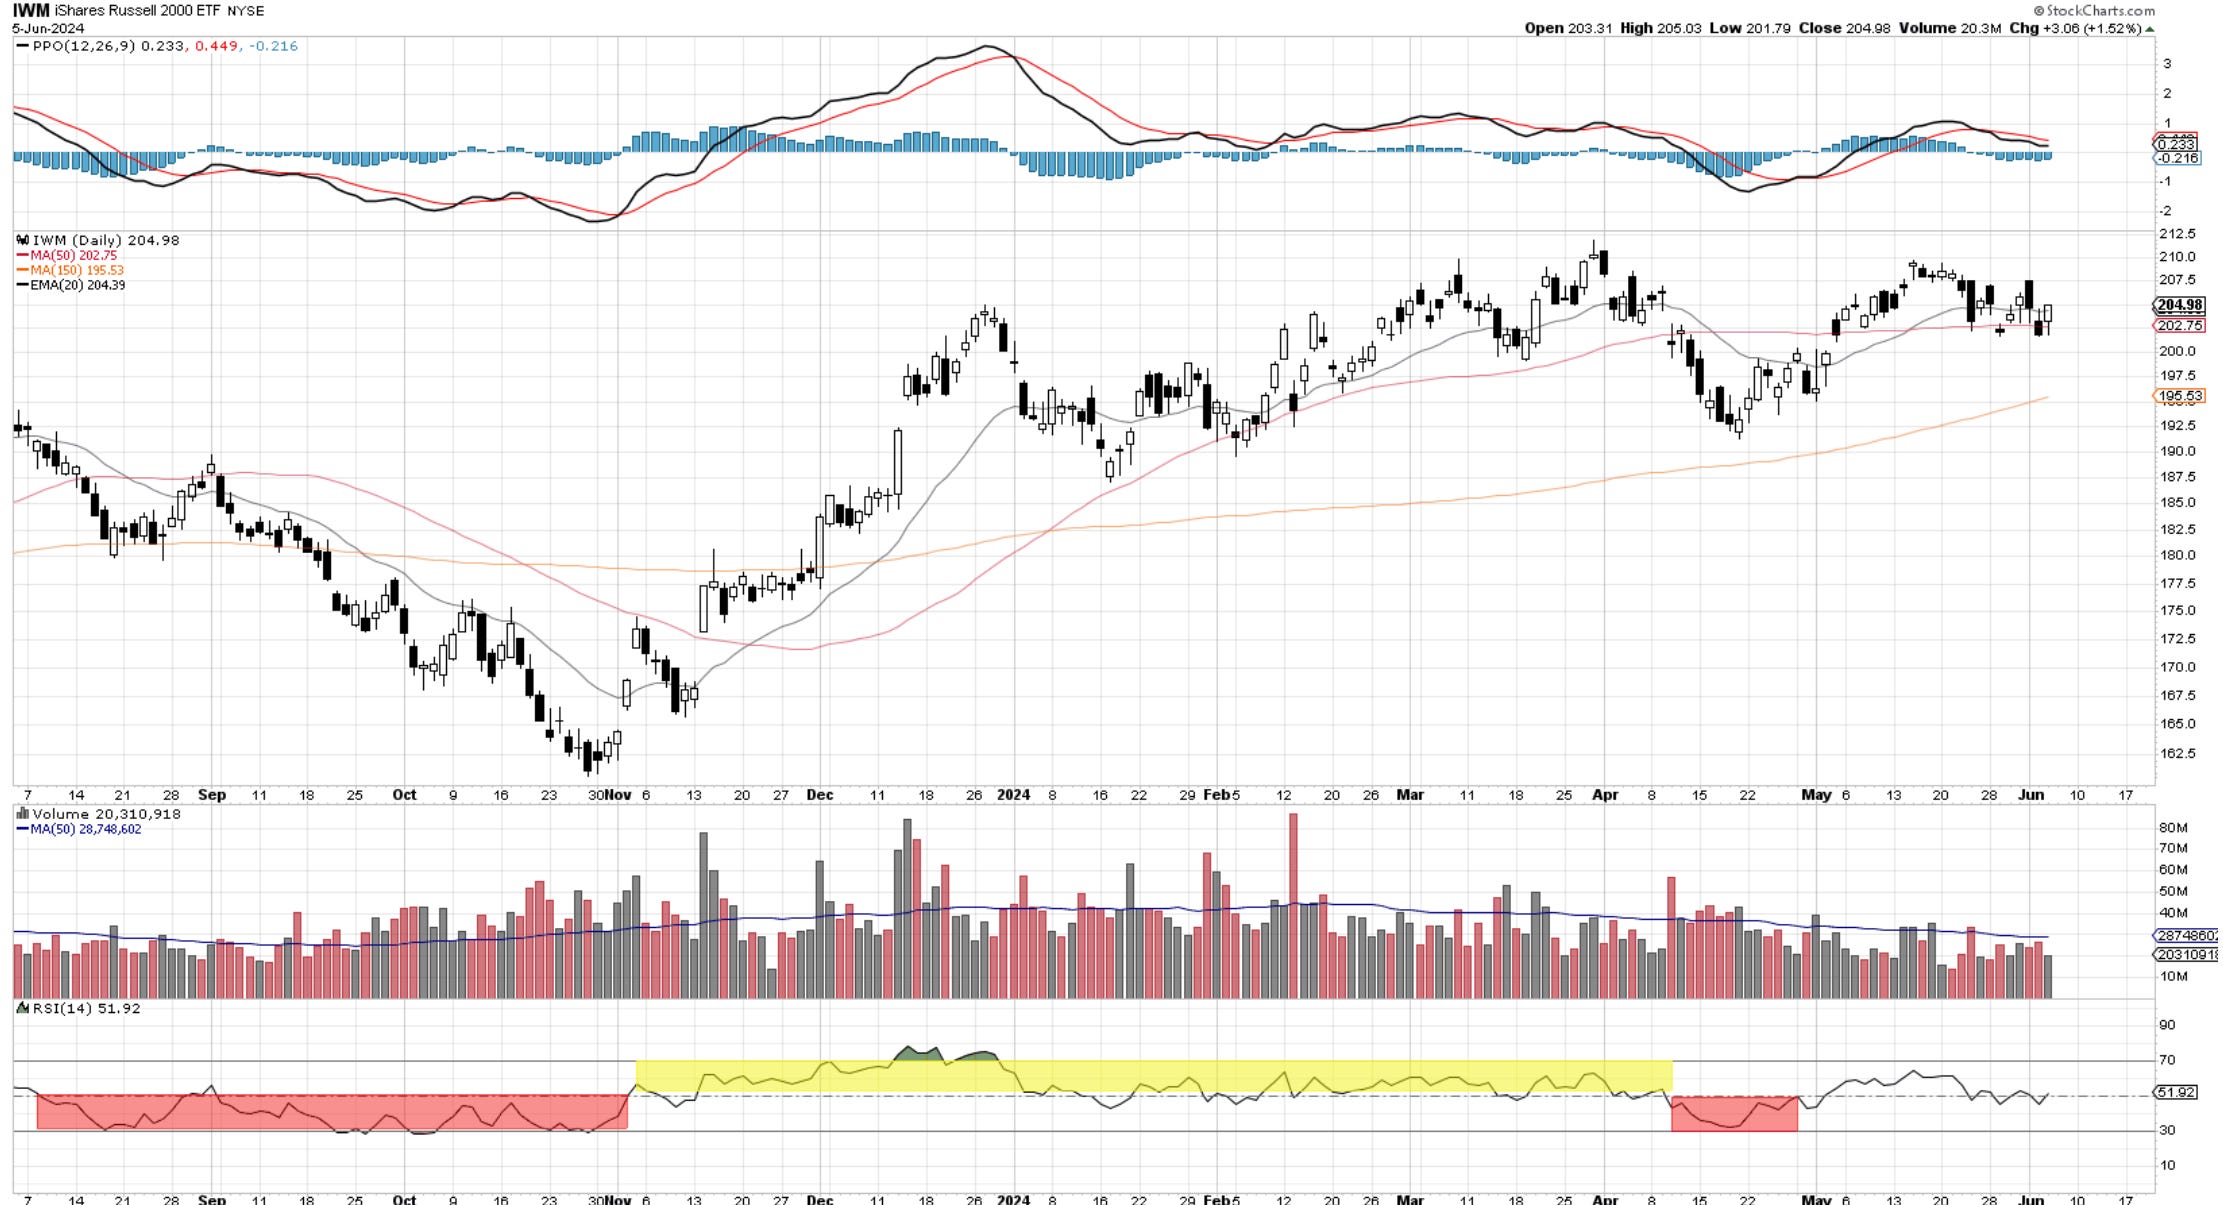
Our friend IWM Small Caps is trying. Yet most money seems to be going to the top stocks and not to the little ones. The pattern continues to look good and will get aggressive above 207.5 and 210.
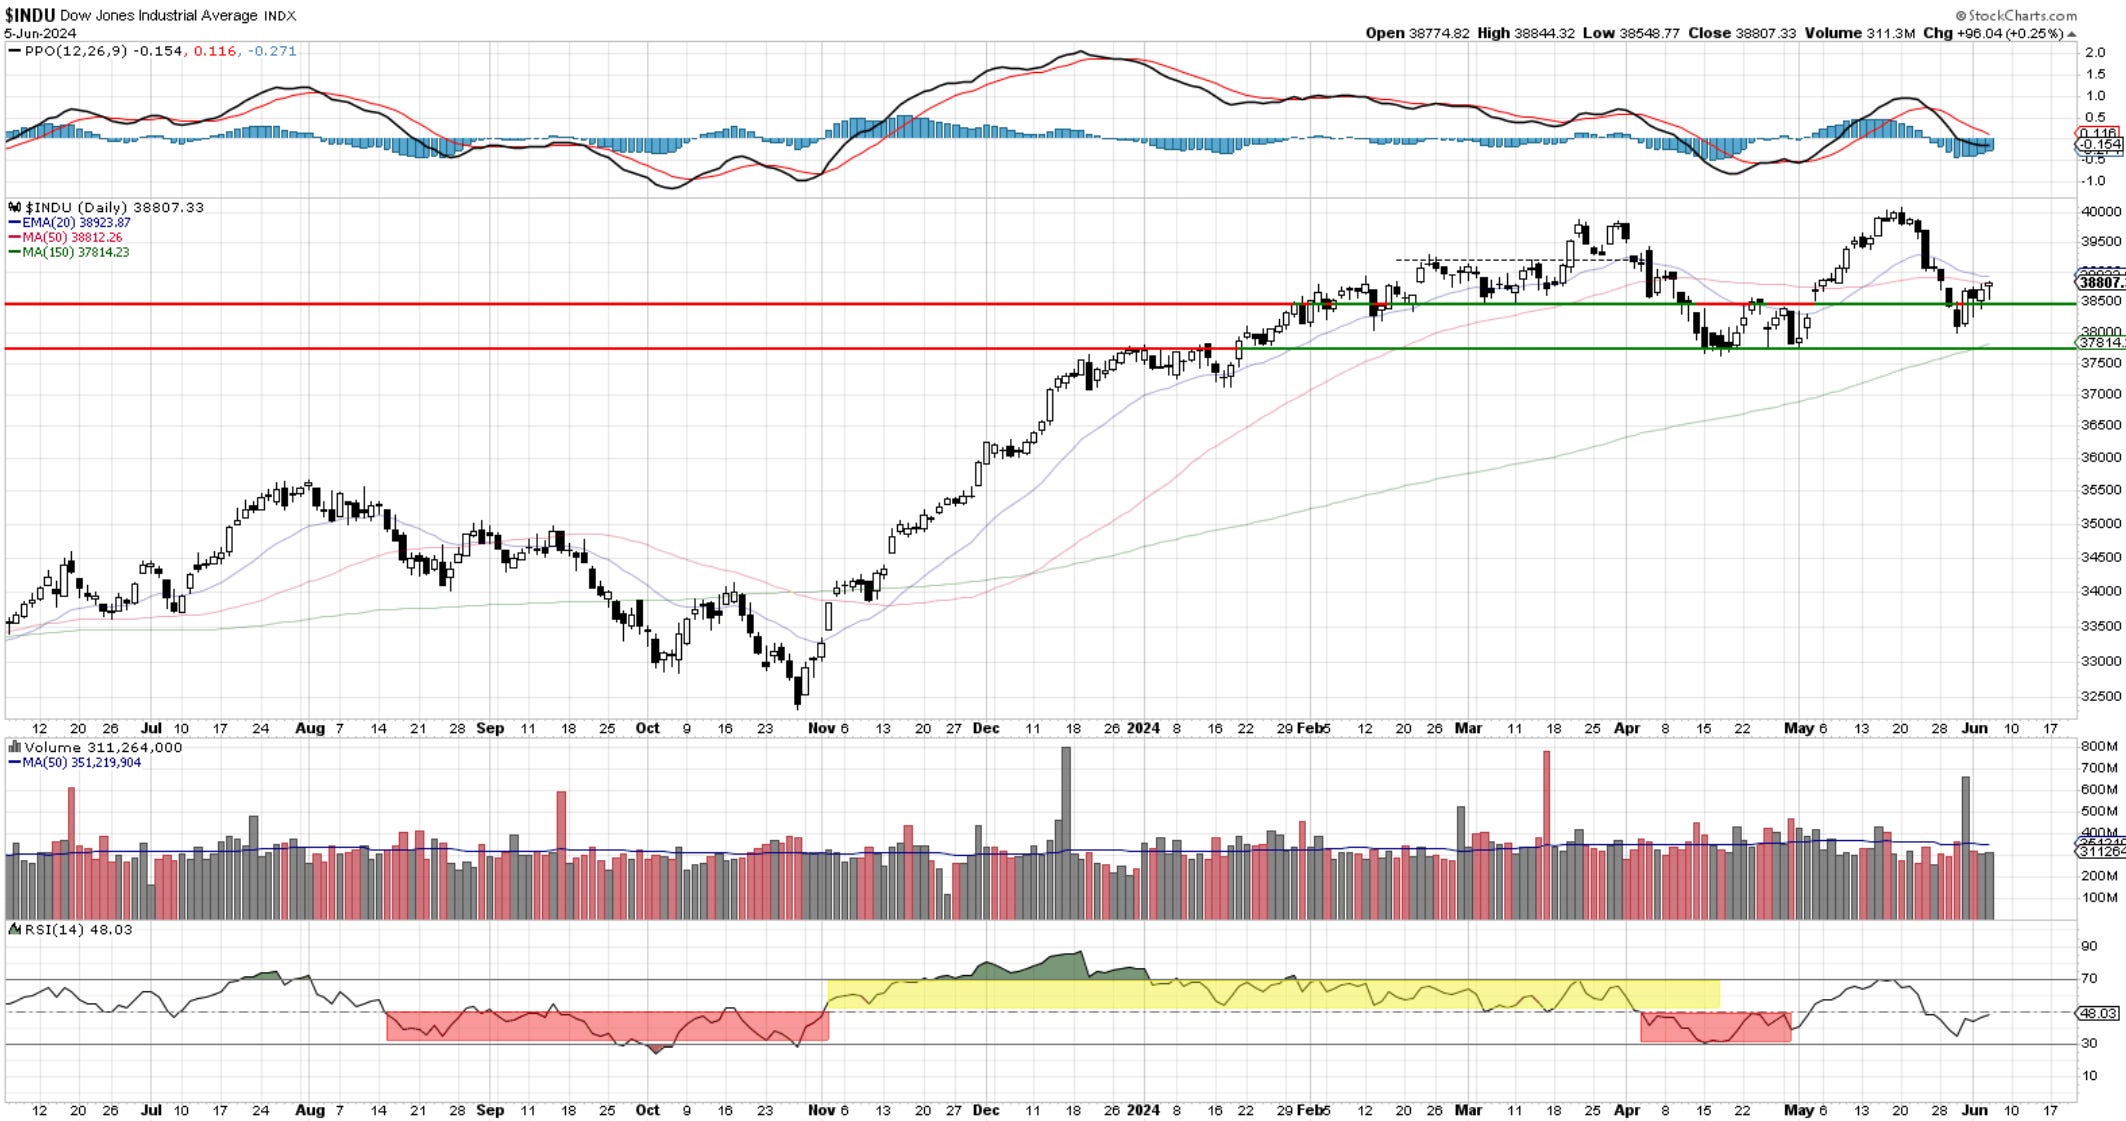
What are we going to do with the Dow 30? It is waking up slowly but still suffering quite a bit of damage. One could think that there may be alpha here to be picked up, but do markets really make it that simple? I would not touch this for now until it improves its technical standing.
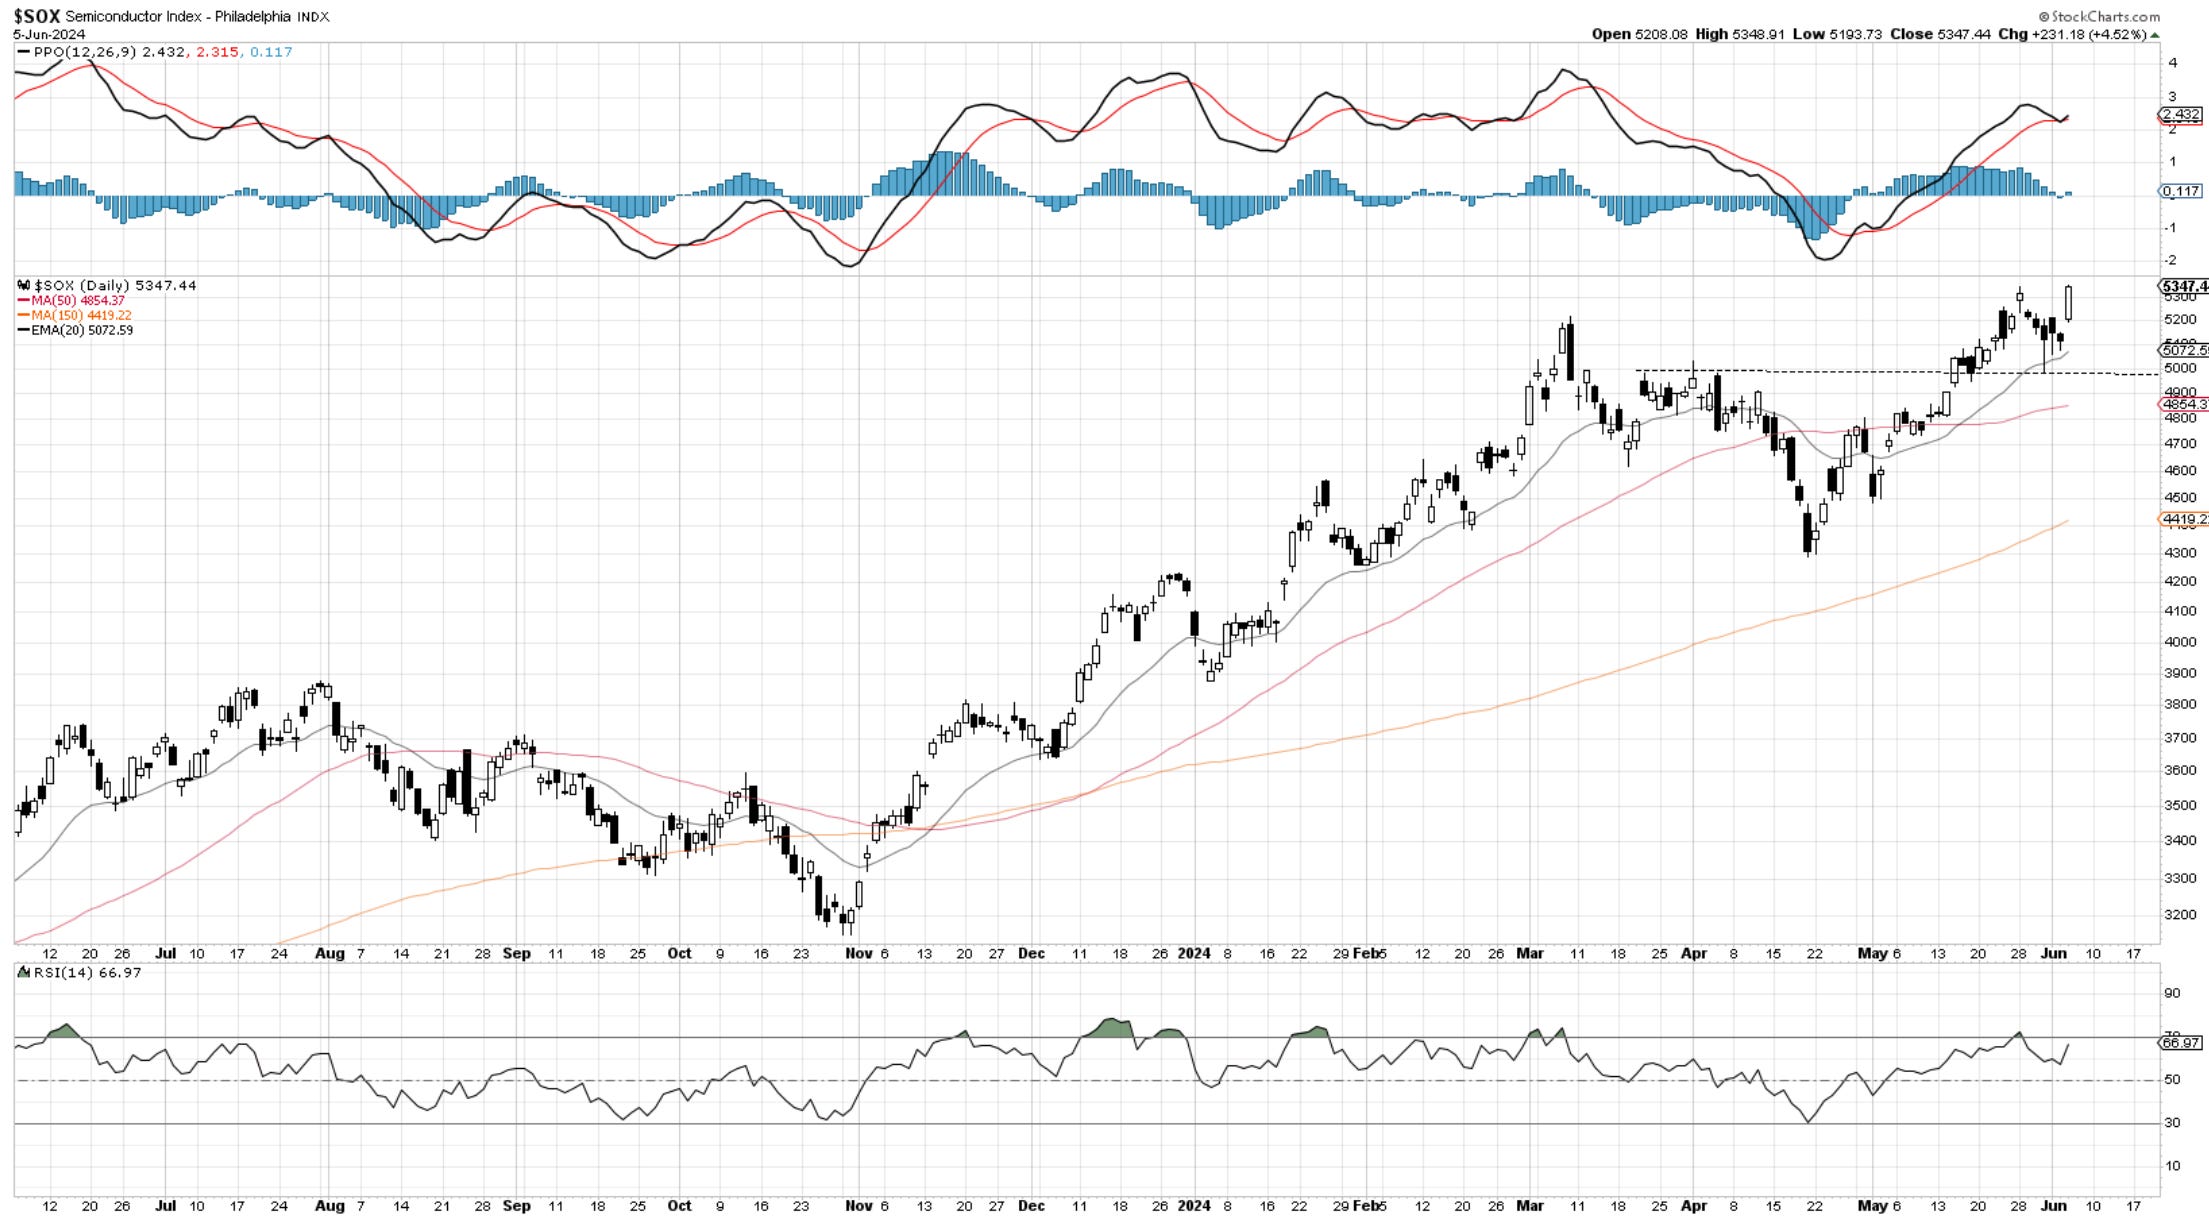
Semiconductors told us about a three-wave move lower a while back. The drop retested the B wave high and reversed. No reason to fight this. It is doing the right things.
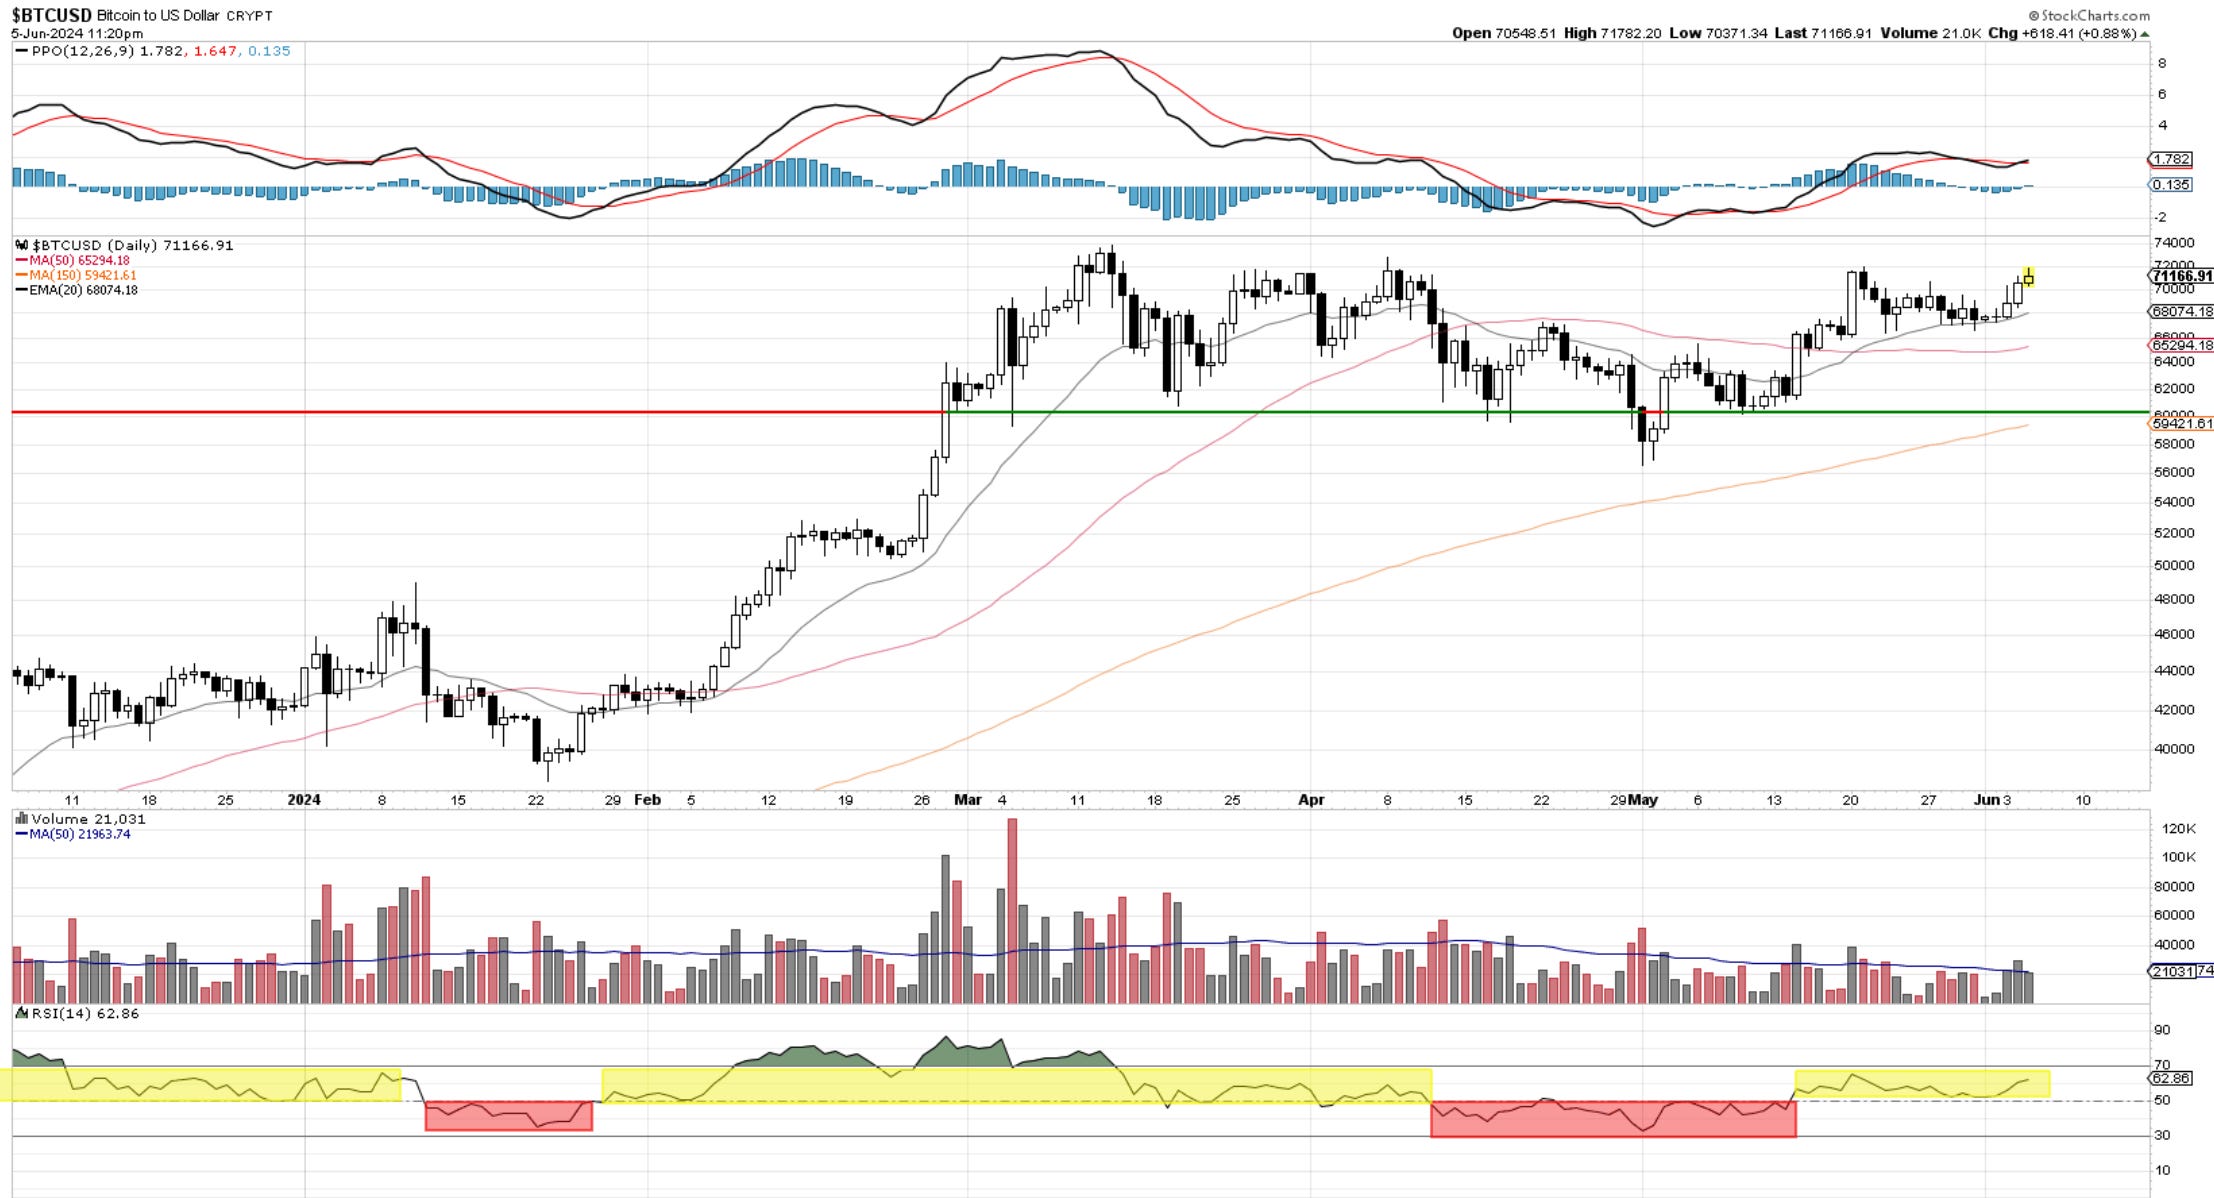
Bitcoin tests 72k and pulls back for a bit. It is trying to eat the supply and gather power for a breakout. It might happen tomorrow, over the weekend, or next week. Or maybe never. No one knows. What I do know is that when certain upside levels get taken out, I want to be involved. And if any lower levels get challenged, I need to reconsider. No need to overthink this.
For those wanting to chat with fellow traders, the link is below.

Thanks for reading,
Cris
ewcafe@pm.me
If you’re new to Elliott Wave or need to refresh, there is a 7-hour video course with downloadable slides under The Coarse tab on the website. Requires a yearly “Founding Member subscription.” You can find it HERE.