
The Daily Drip
Core markets charts updates and commentary
Note: The counts on the right edge are real-time, and they are prone to adjustments as price action develops. Elliott Wave has a fluid approach, is evidence-based, and requires constant monitoring of certain thresholds.
In the counts below, this (( )) = circle on chart
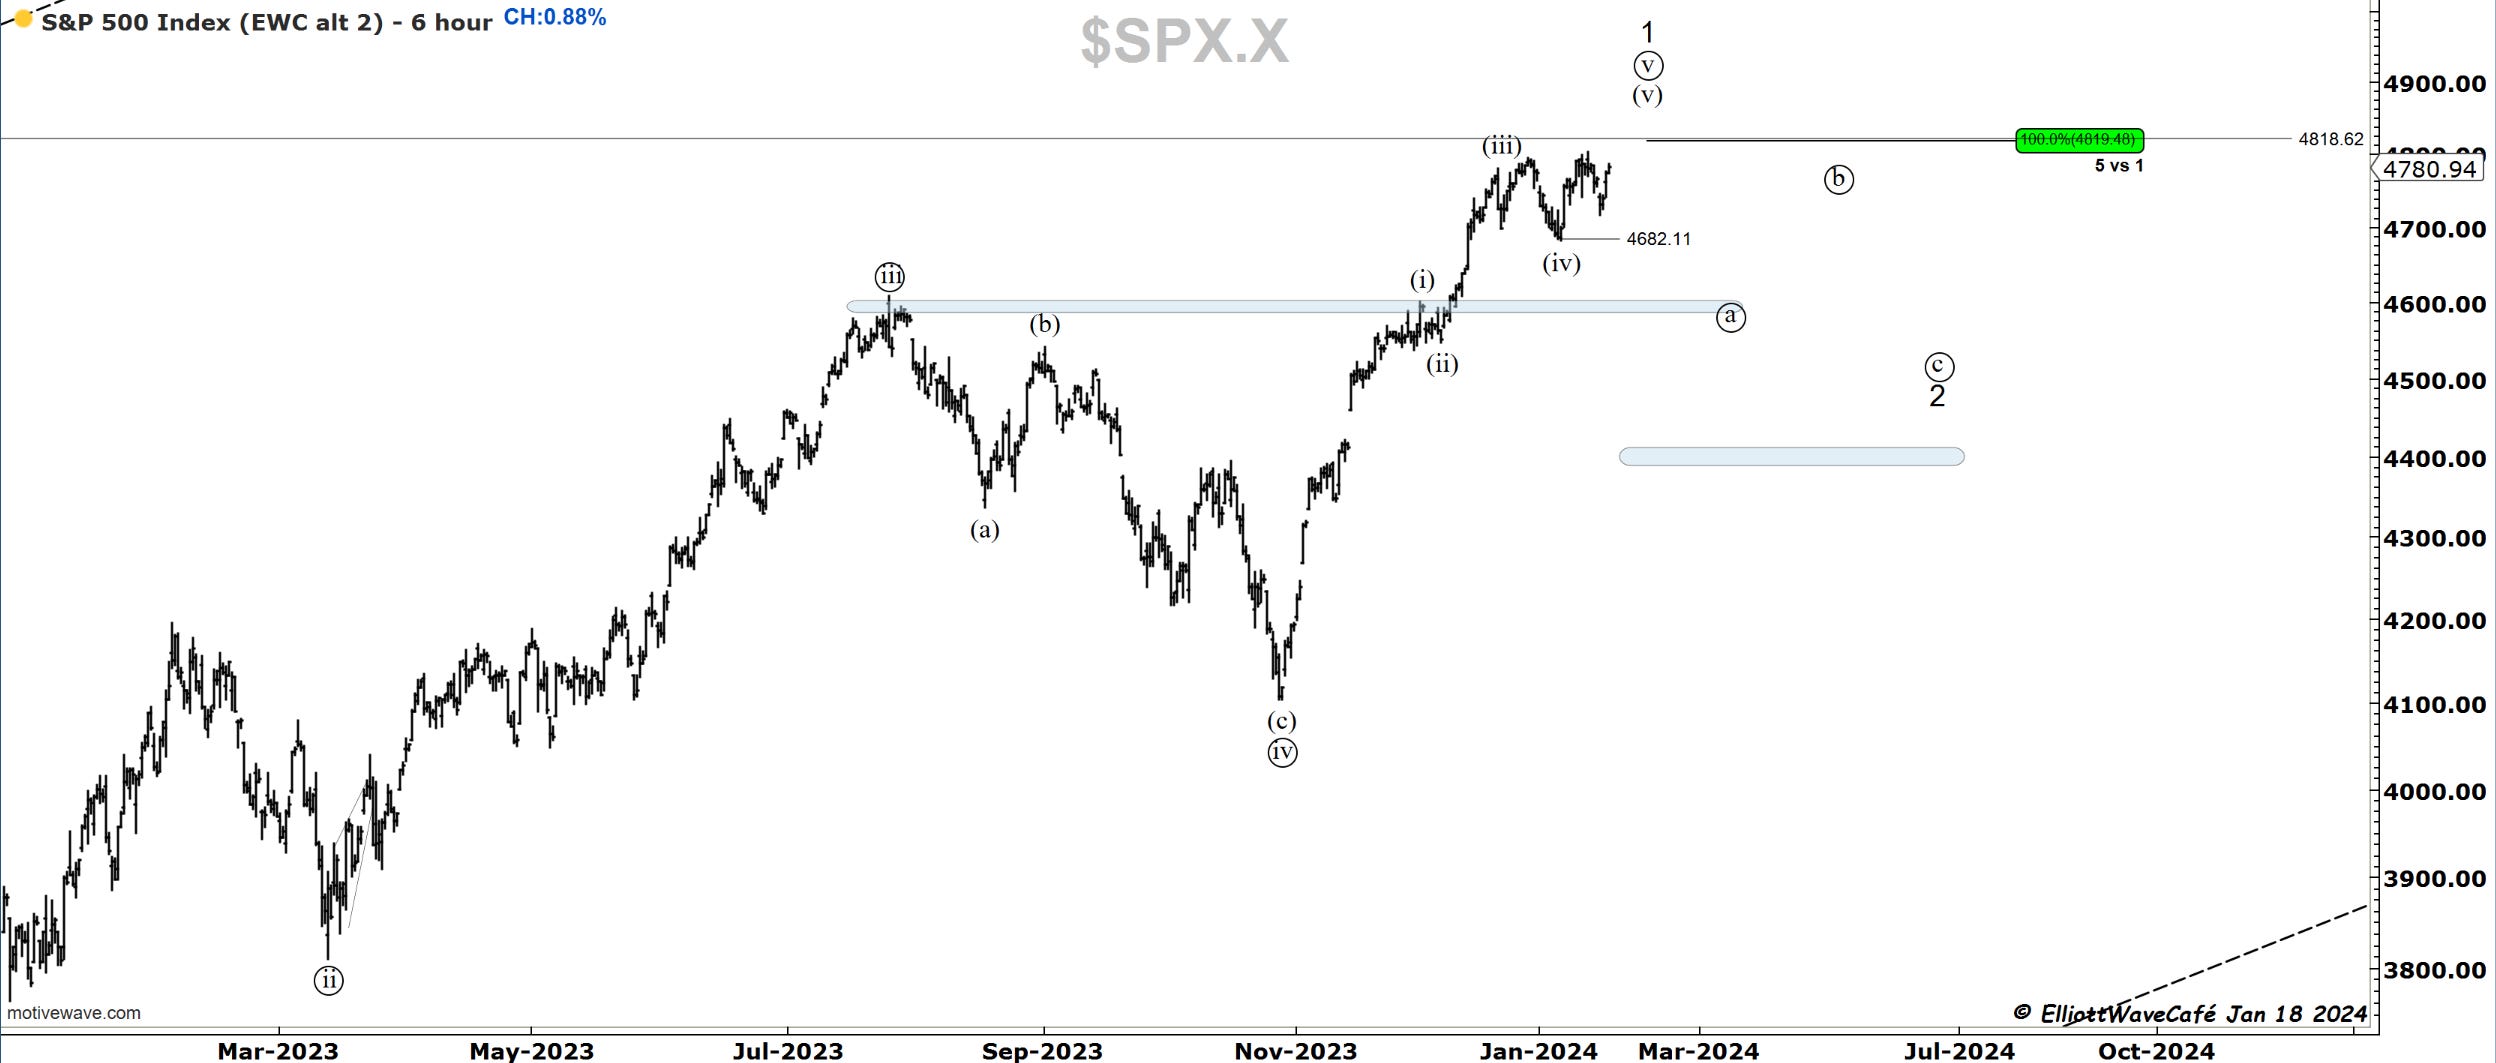
SP500
There were rallies across the markets today. It was mostly a tape dominated by technology and semiconductors, with transports and a little discretionary sprinkled in. With a failure to break below 4682, the count might not happen right away. Today’s close was strong, and unless fully reversed tomorrow, the odds of a break higher instead are now growing. I am still viewing it as the final stages of this thrust, with a correction to follow.
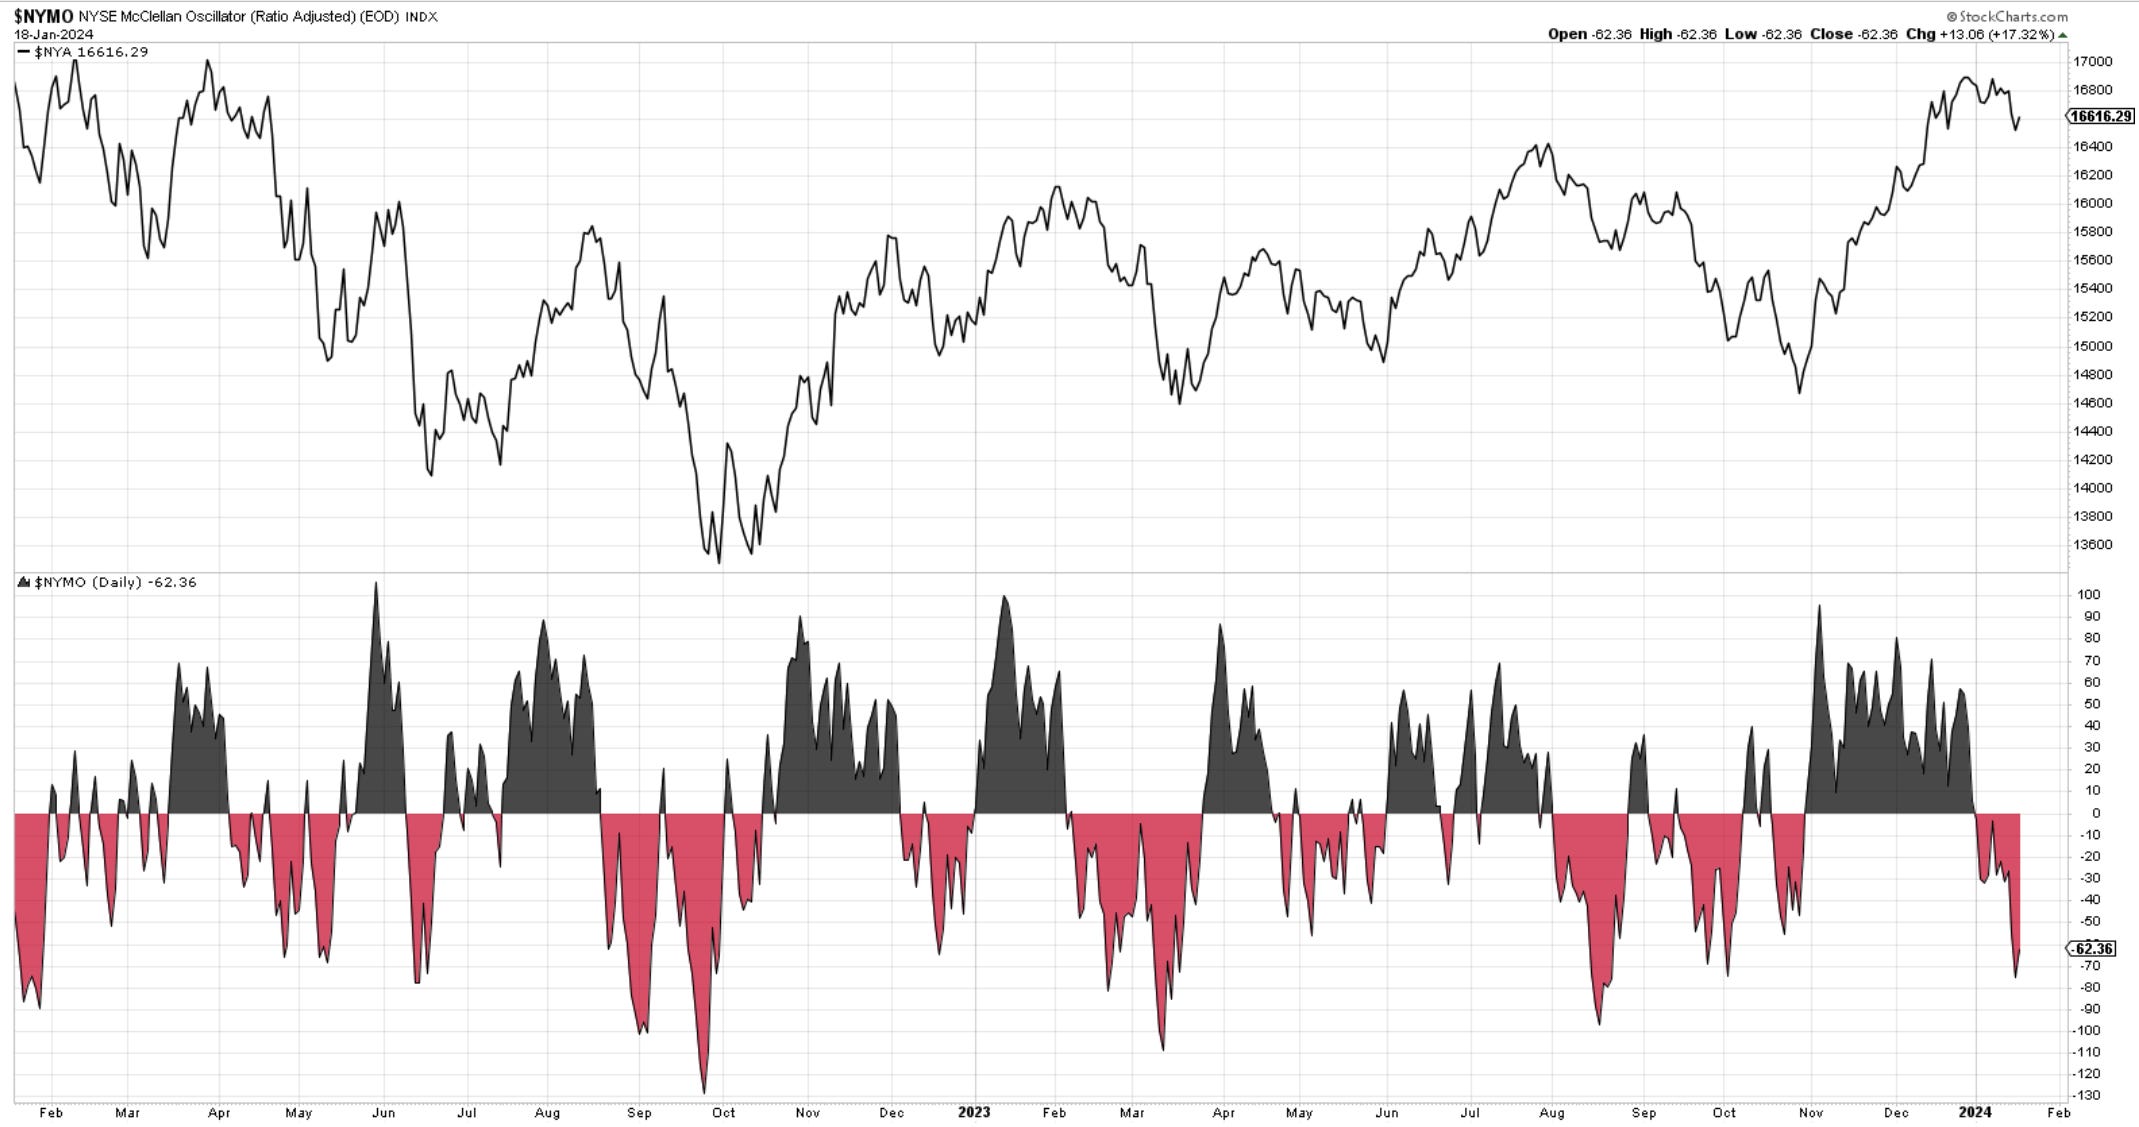
The breadth on NYSE recovered a bit, but it’s far from getting back to neutral levels. What is interesting is that even tho the declines outpaced advances at a rate seen in August and October of last year, the entire price decline was a mere -2%. Was this the entire flush of this market? Definitely interesting.
Tomorrow is the monthly options expiration day, and price action around these times tends to be quite whippy.
Nasdaq100
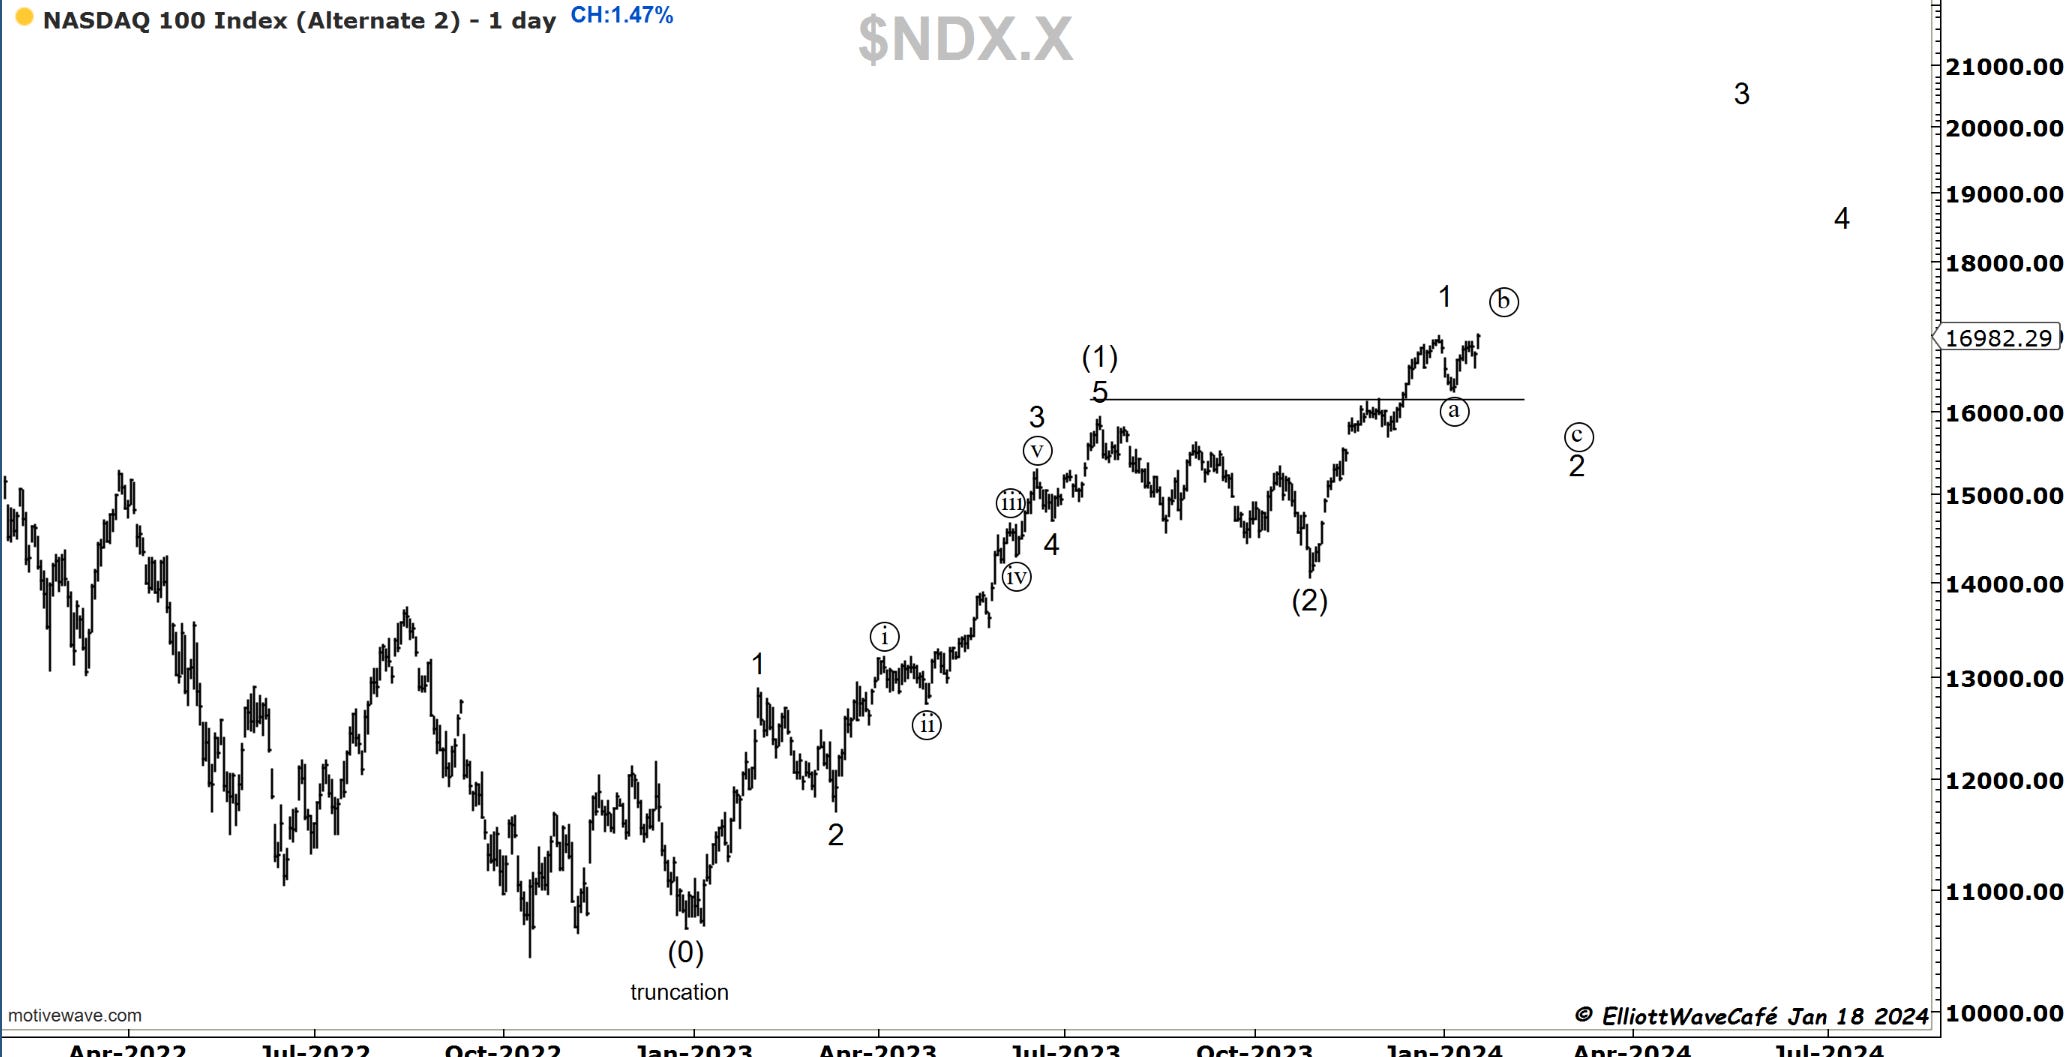
Nasdaq made a fresh high today, throwing the (b) wave idea under the bus. It could still be one in the form of a flat, but we only revert back to it if enough price evidence is being presented to suggest such a count. For now, I will view it as a wave v and wave iv similar to the Sp500.
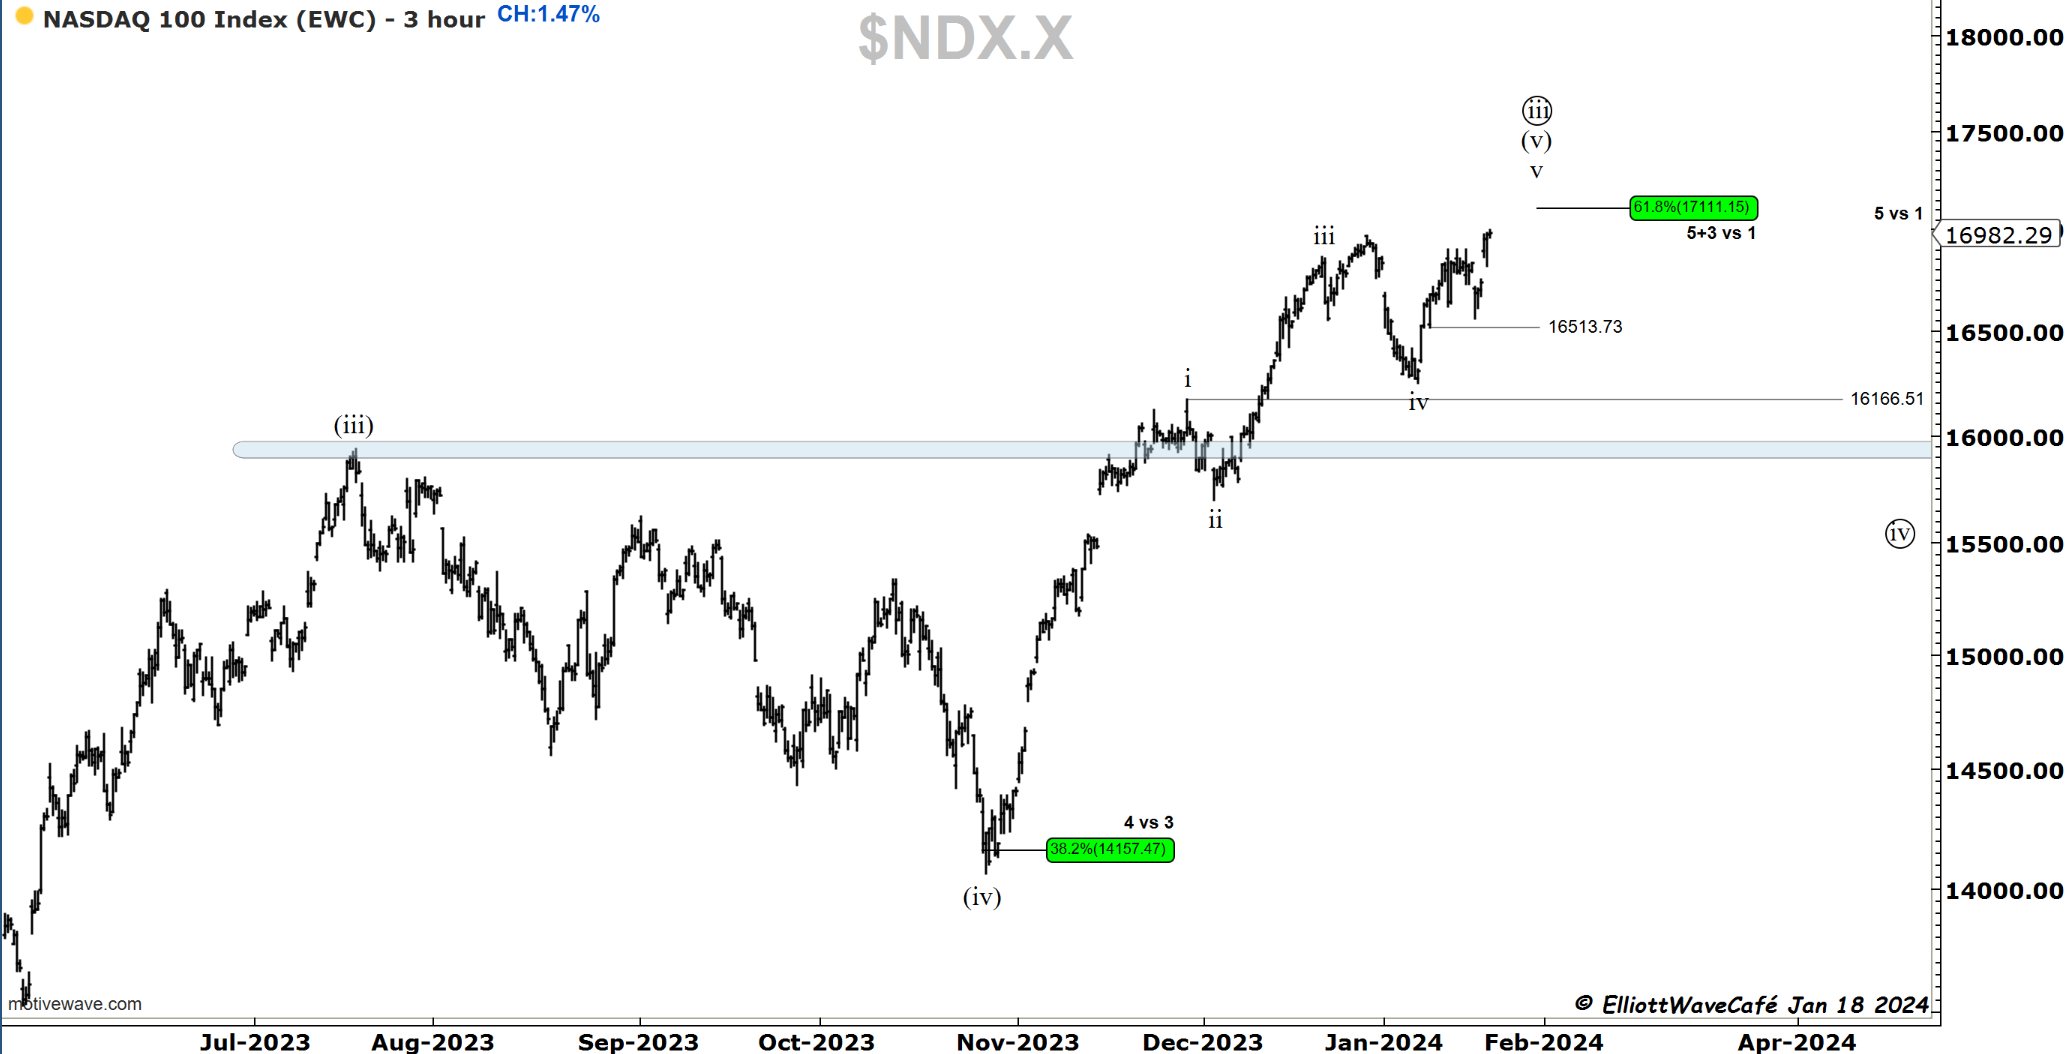
Here is the bullish count that never looks back. For this to happen, we need a huge amount of participation and lots of liquidity. There are some macro factors fighting this at the moment, some of which we have mentioned here.
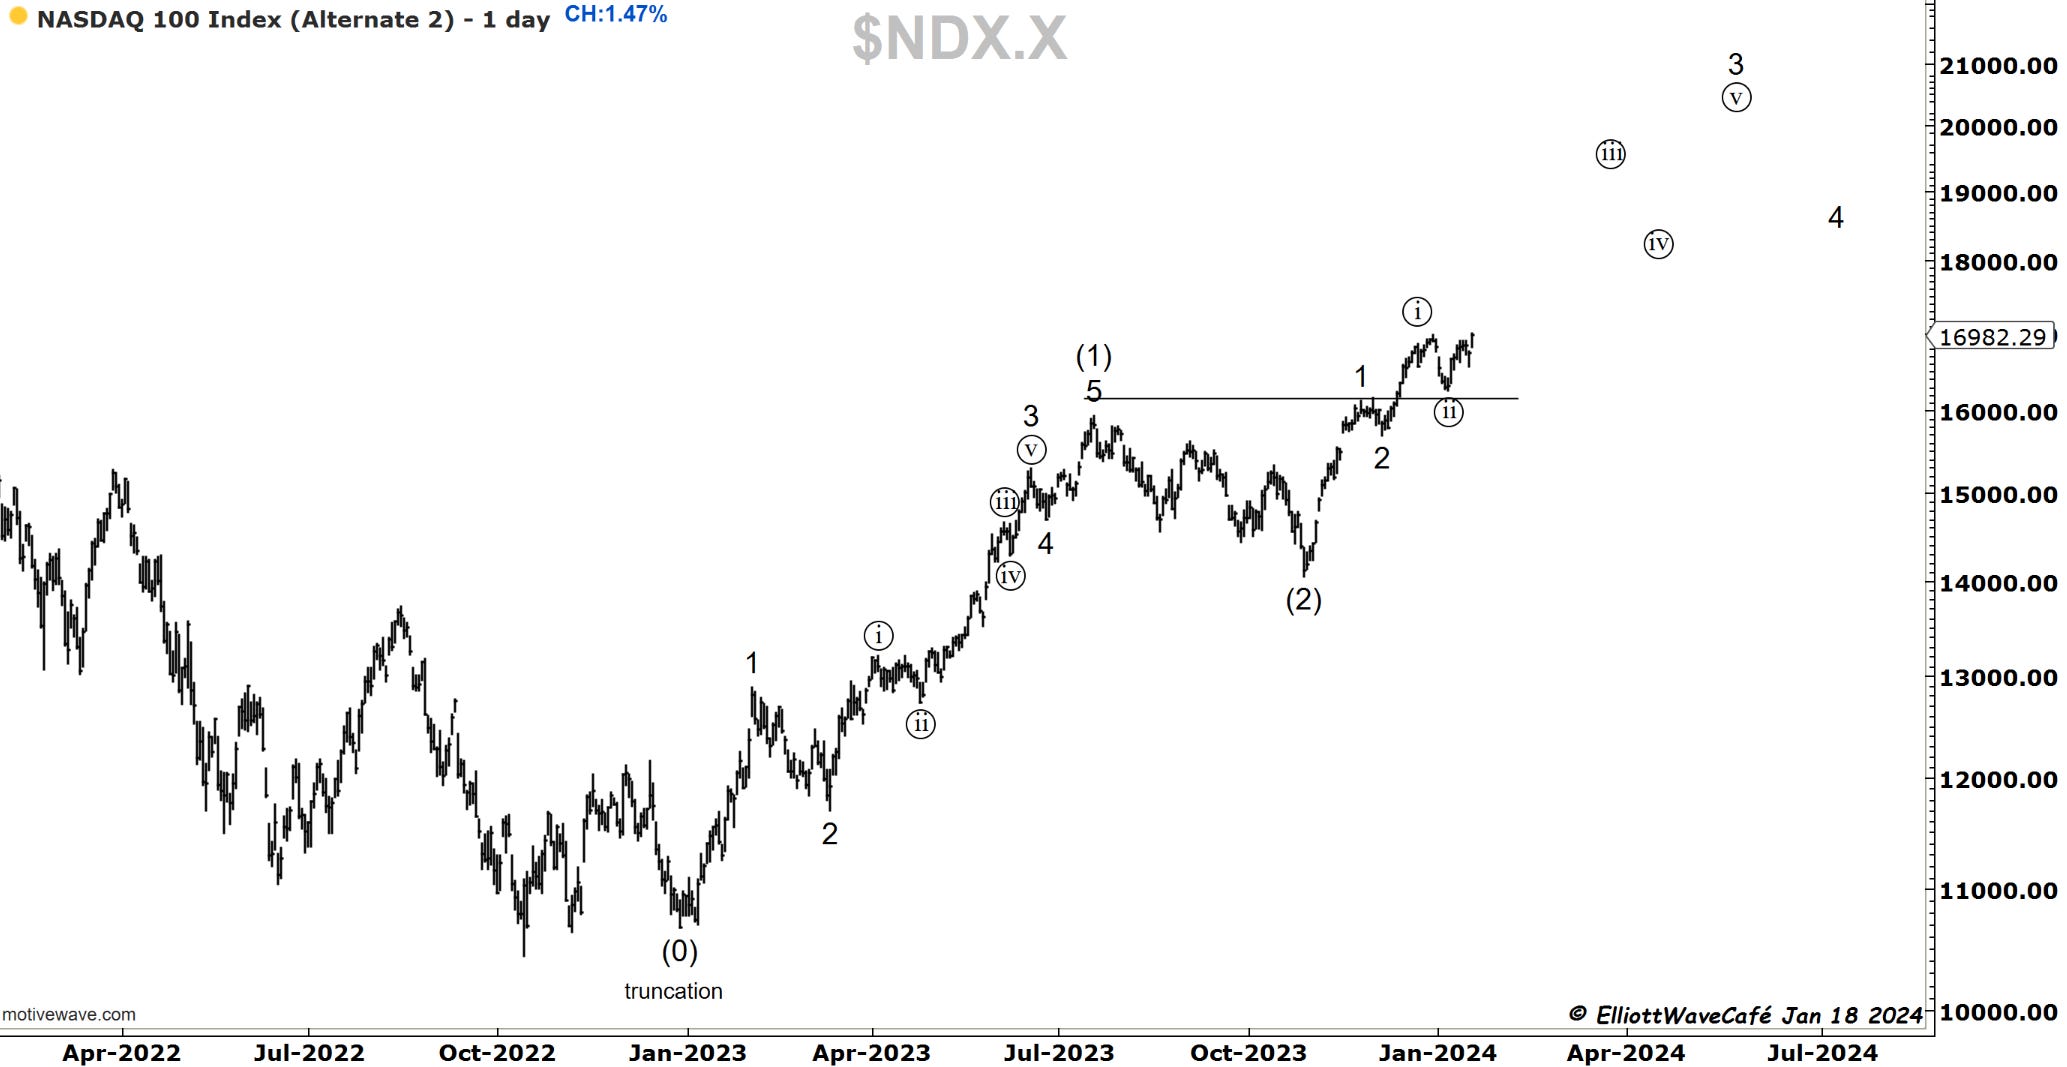
And the one with a flat in((b)) wave. This is the “gotcha” count that traps both sides of the market. Notice both of these courts are assuming a wave (2) low in Oct 2023 and not a (iv).
Across my coverage of EW over the years, I always get asked which one is my favorite count. My answer is the one that aligns more with the macro landscape, seasonality, cycles, and sentiment. It’s a constant work of combing through that information.
RUSSELL 2000
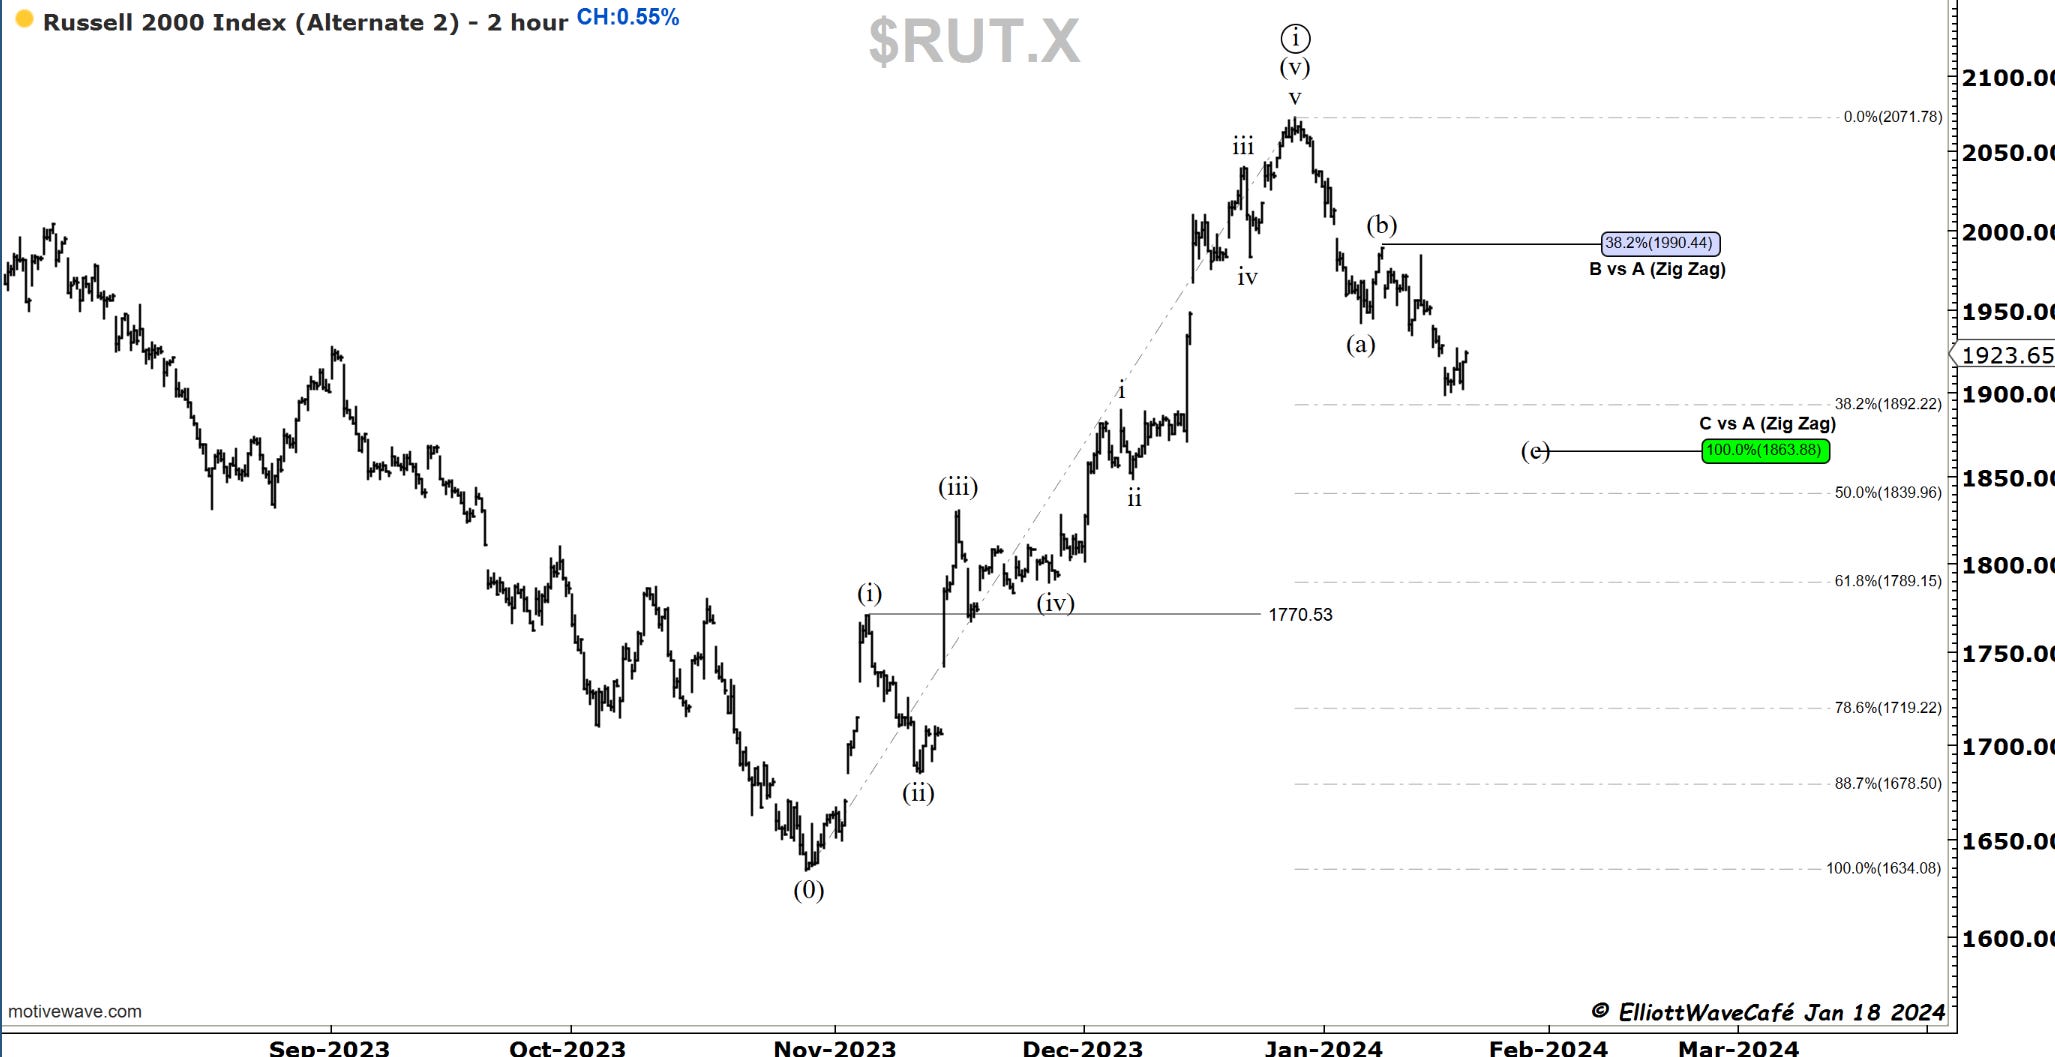
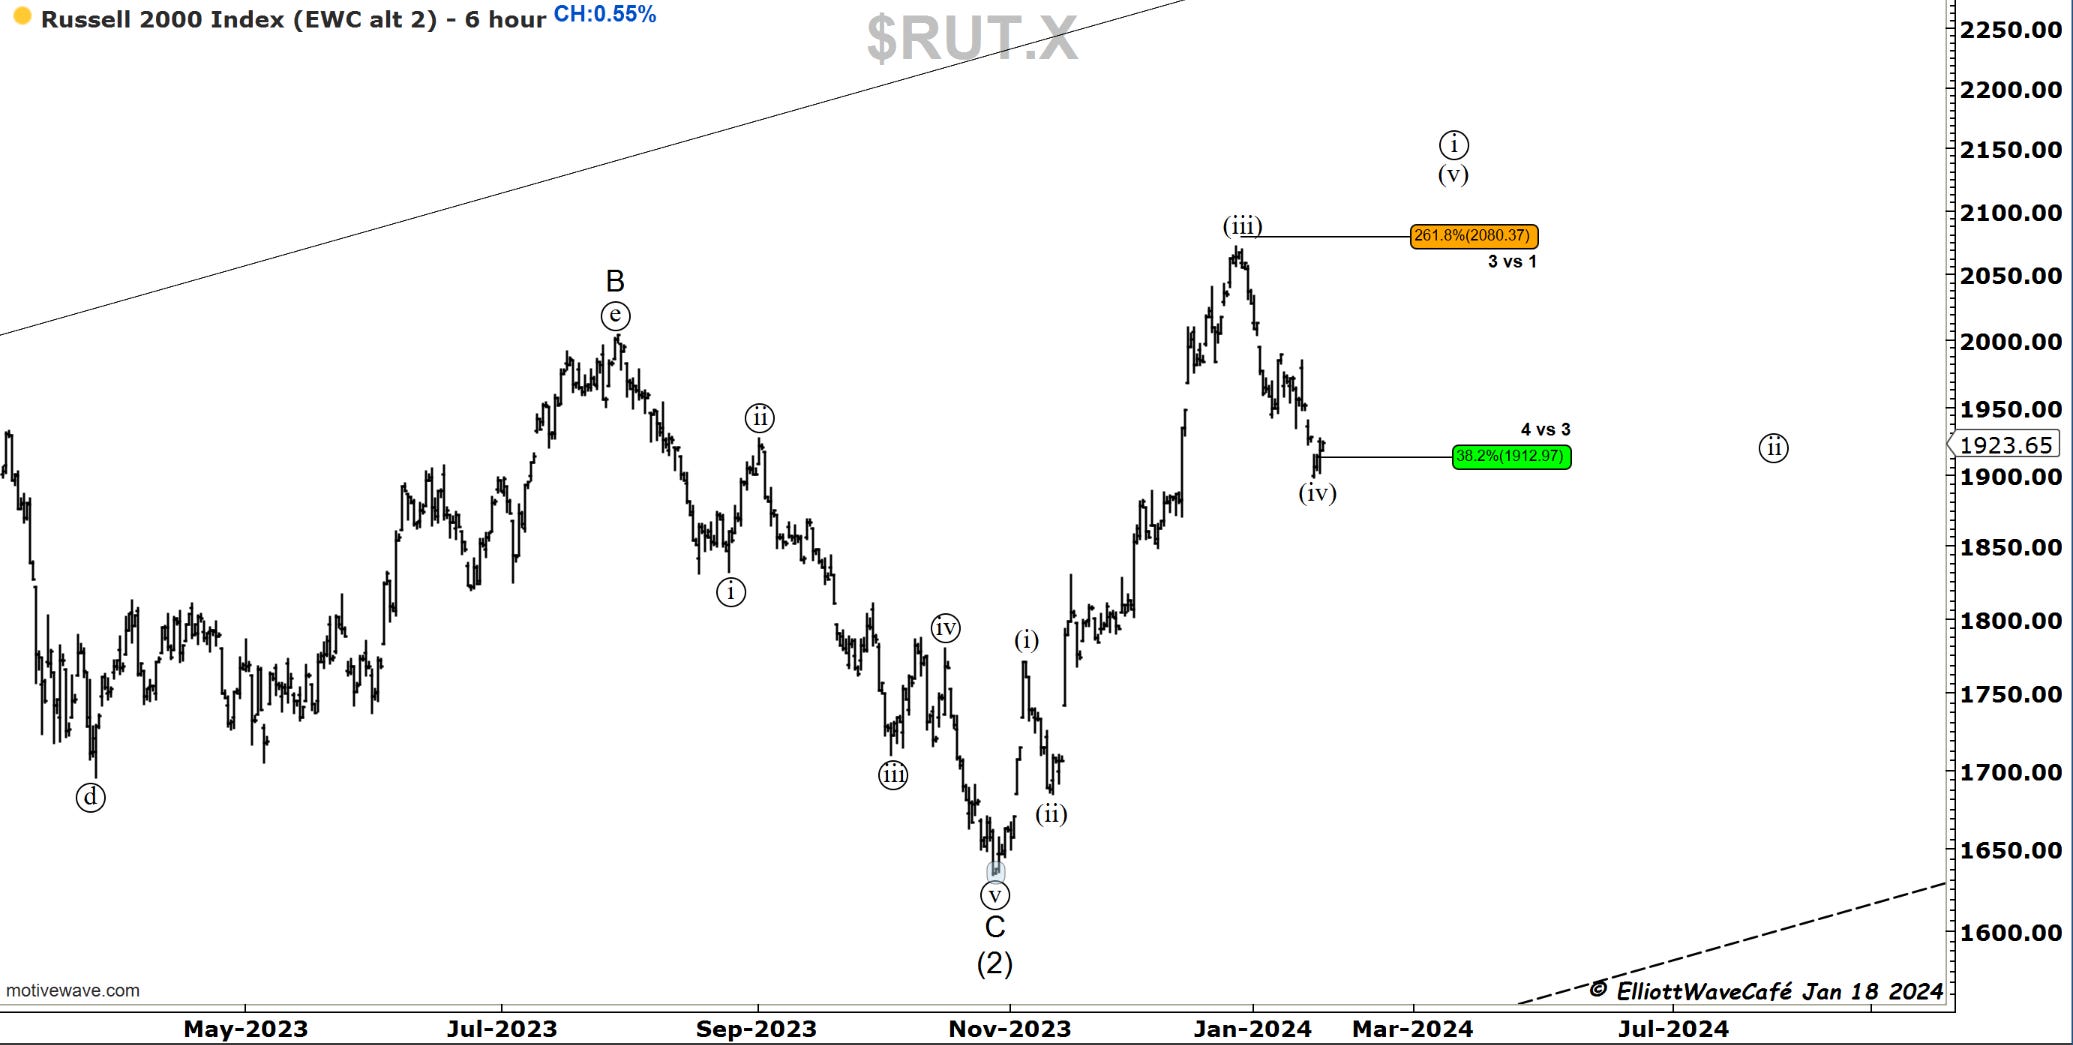
As mentioned yesterday, we were coming into a zone of decent support for the small caps. Today’s rally was small and looks corrective for the time being. If they can manage to take this market above that (b) wave high, the odds will be growing that new highs are coming. You’ve seen the second chart before, but I bring it back to show you a possible wave (iv) reaction to 38.2%.

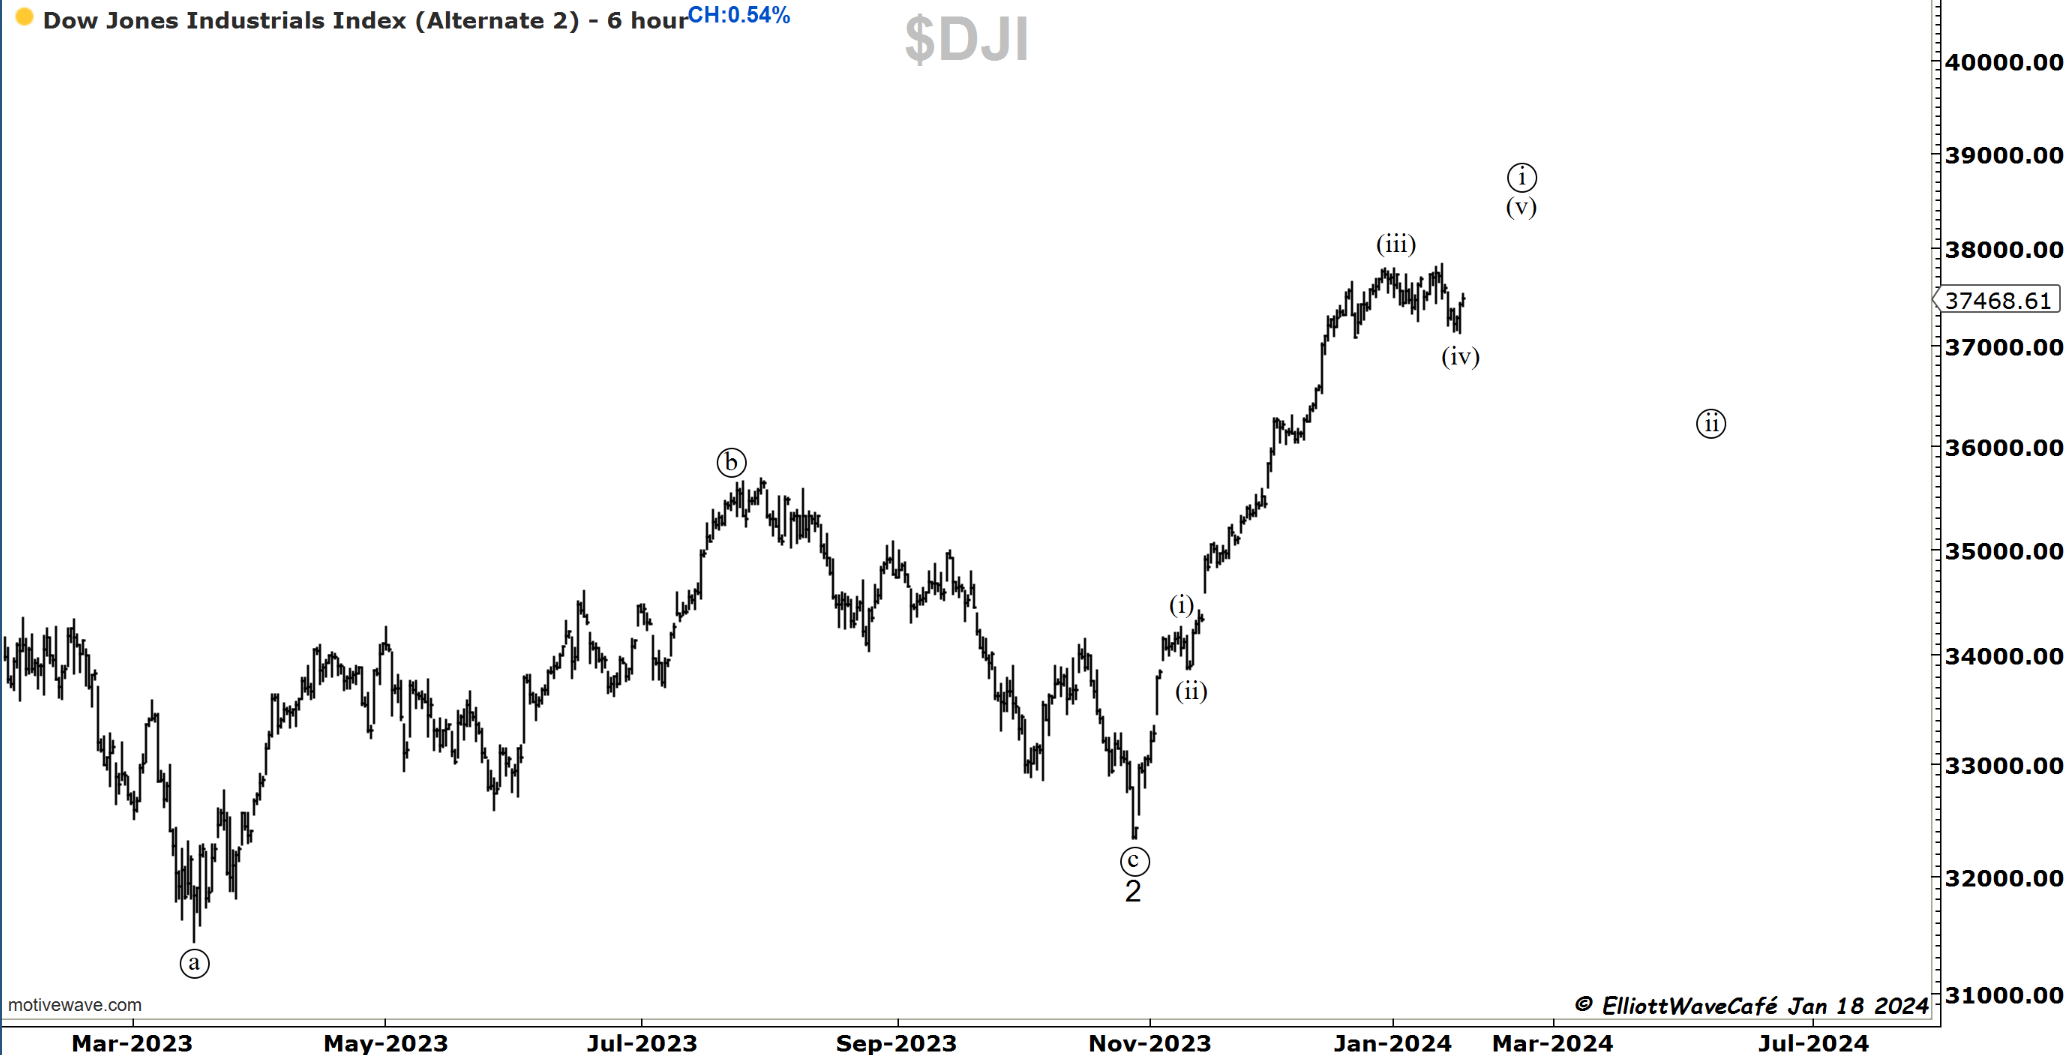
Dow30
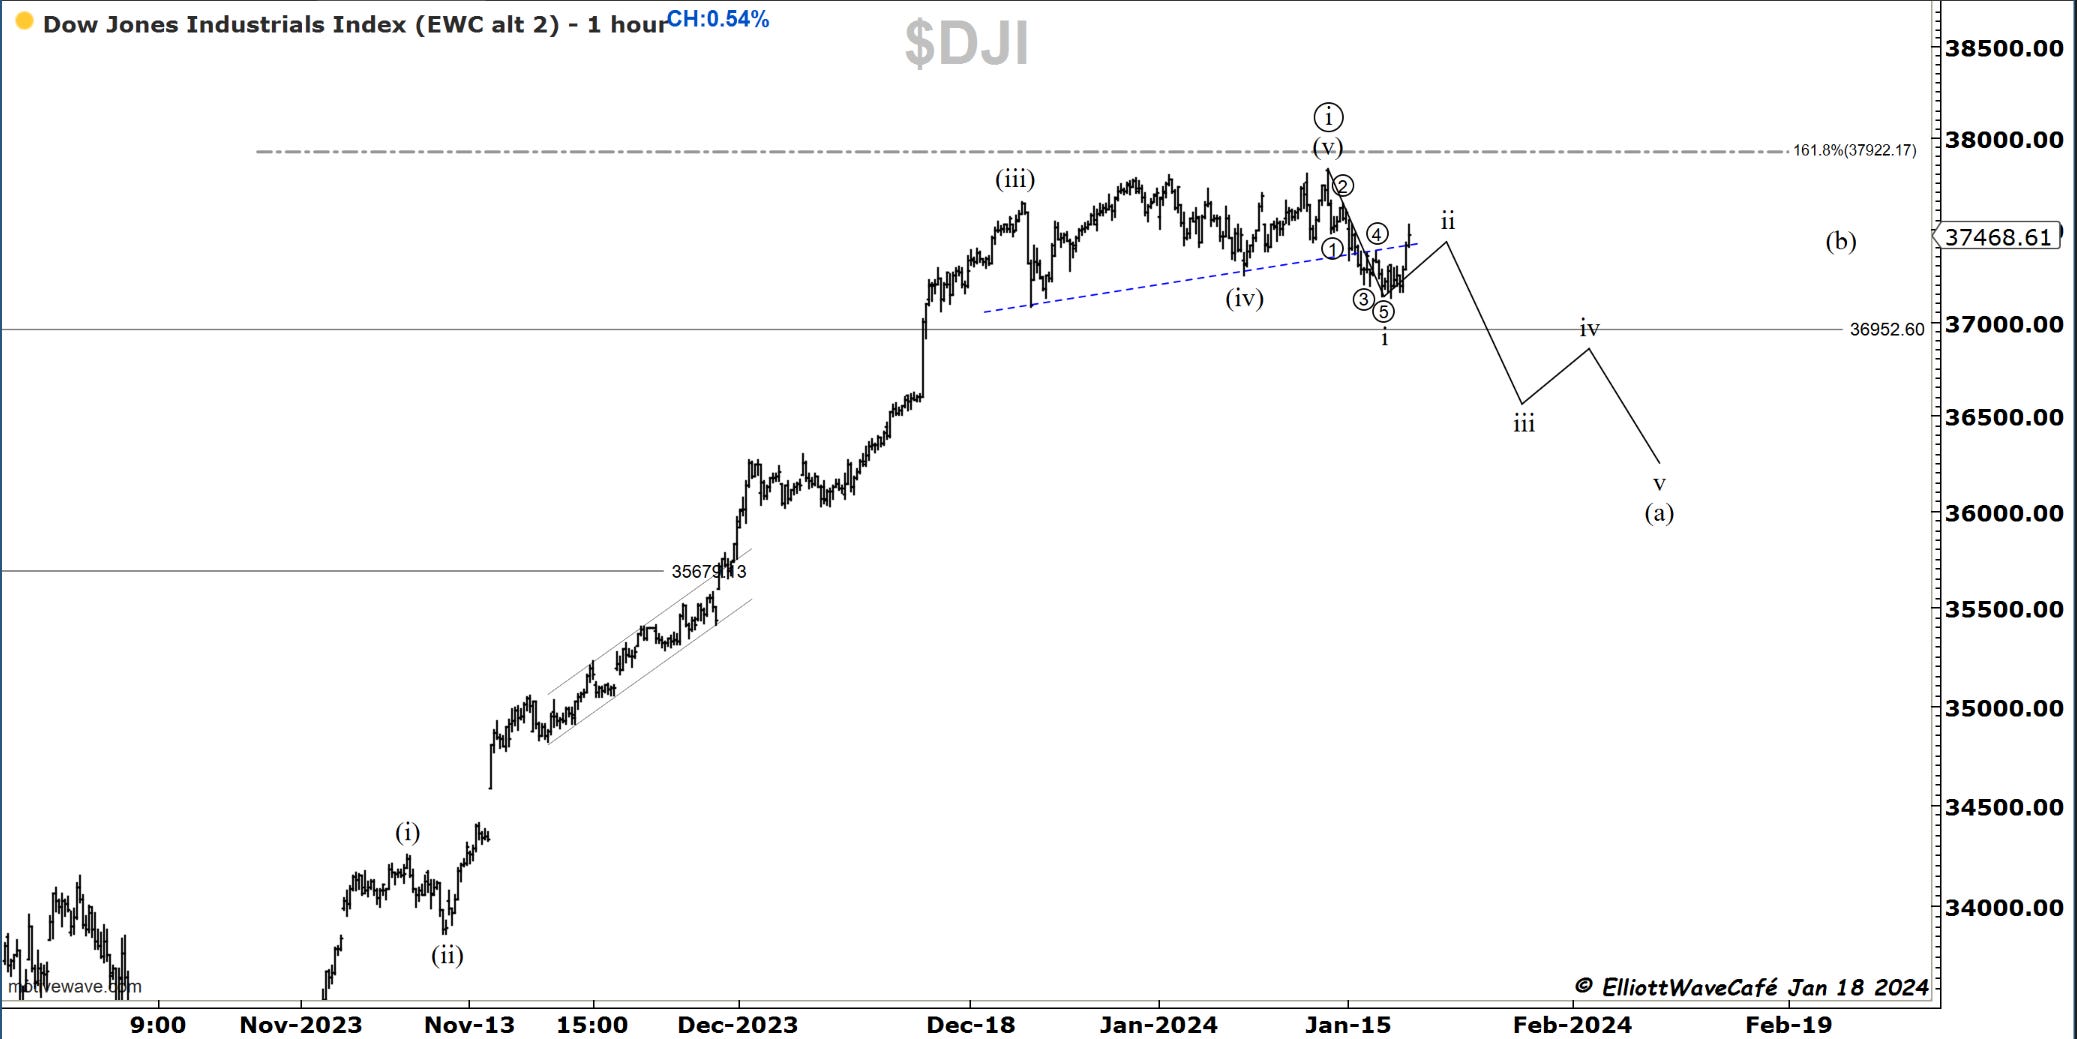
If this rally is a wave ii, we cannot make a new high, or we invalidate it. The backup count is below in the second chart, under which current drops were still part of the wave (iv).
The Dow count structure is the one that gives me confidence that a larger corrective move will be unfolding and the other indices won’t be able to trace higher on their own.
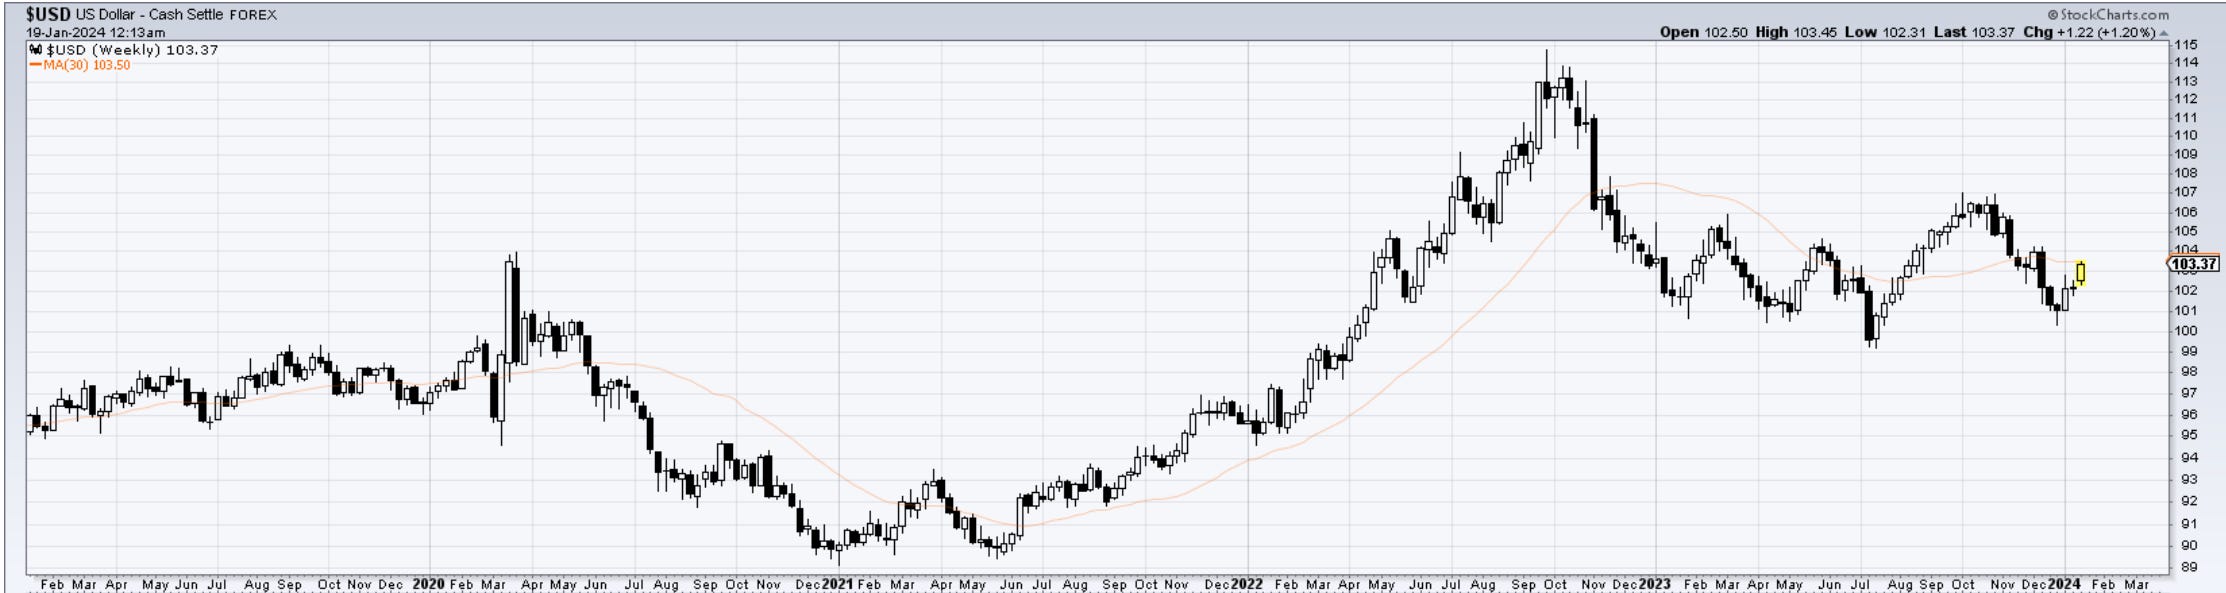
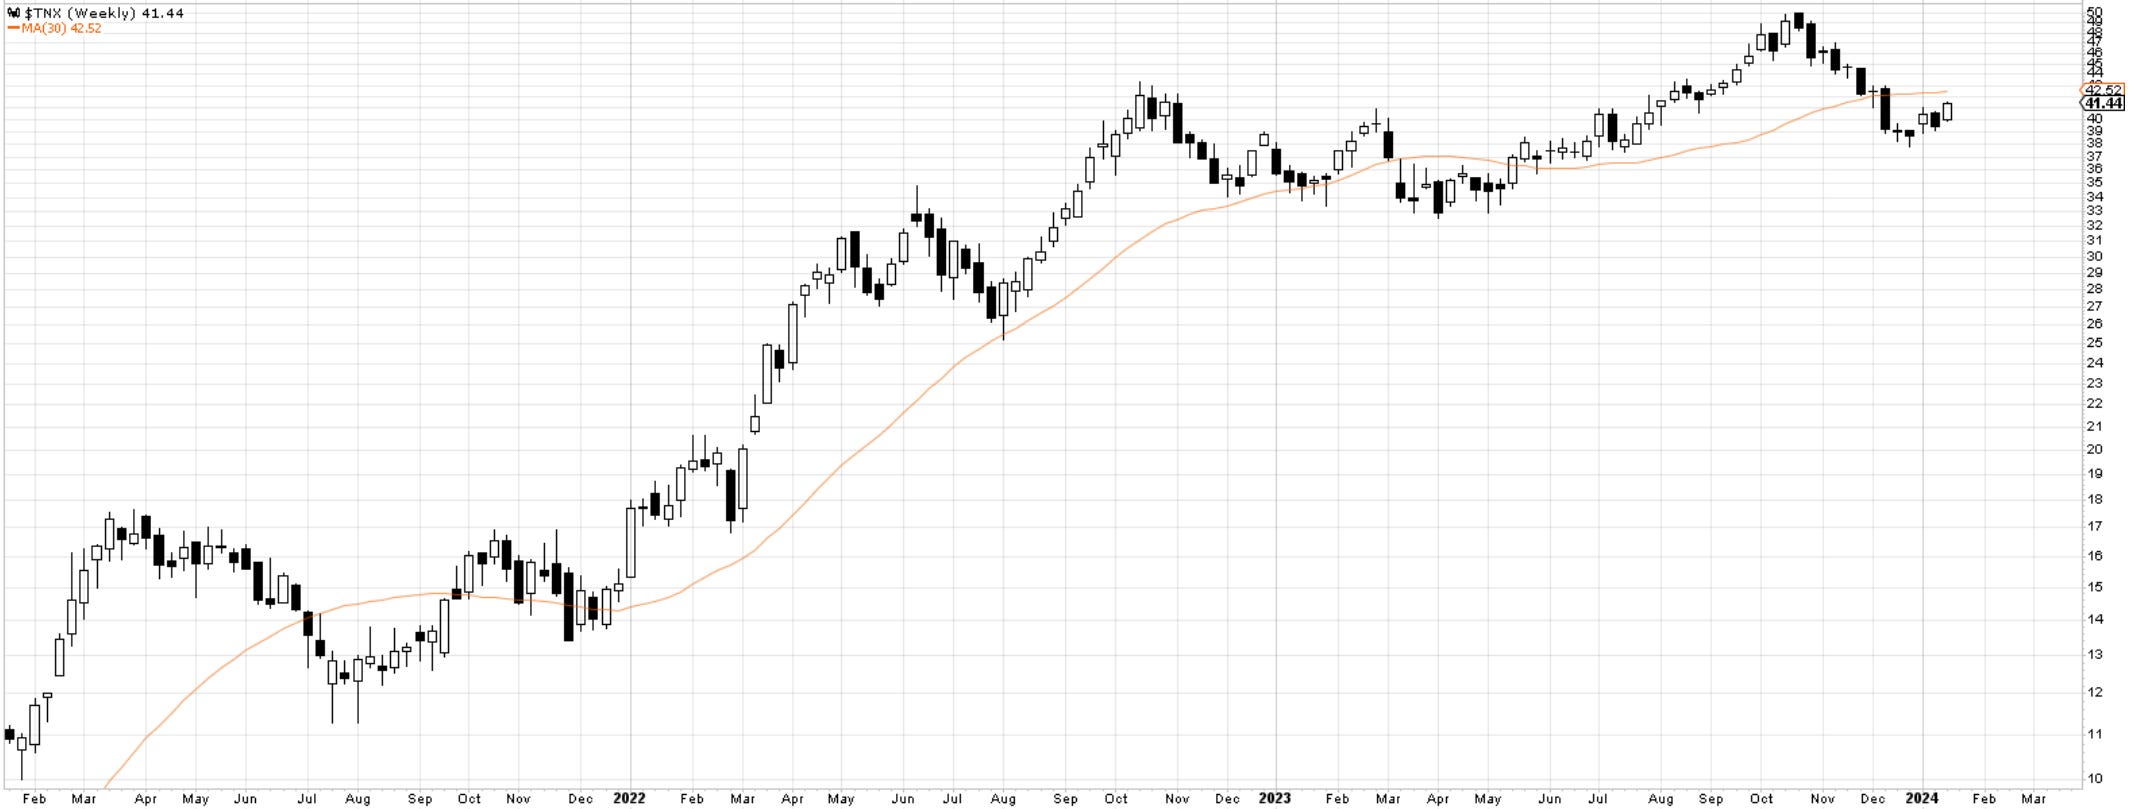
US Dollar and Yields
Both dollar and yields have been holding well to their gains, not really confirming in a major way the equities upswing today. I would continue to watch these two markets like a hawk as their continued strength should dampen risk on ambitions. Weekly charts are presented below. I have discussed the dollar in a bit more detail in last night’s video.
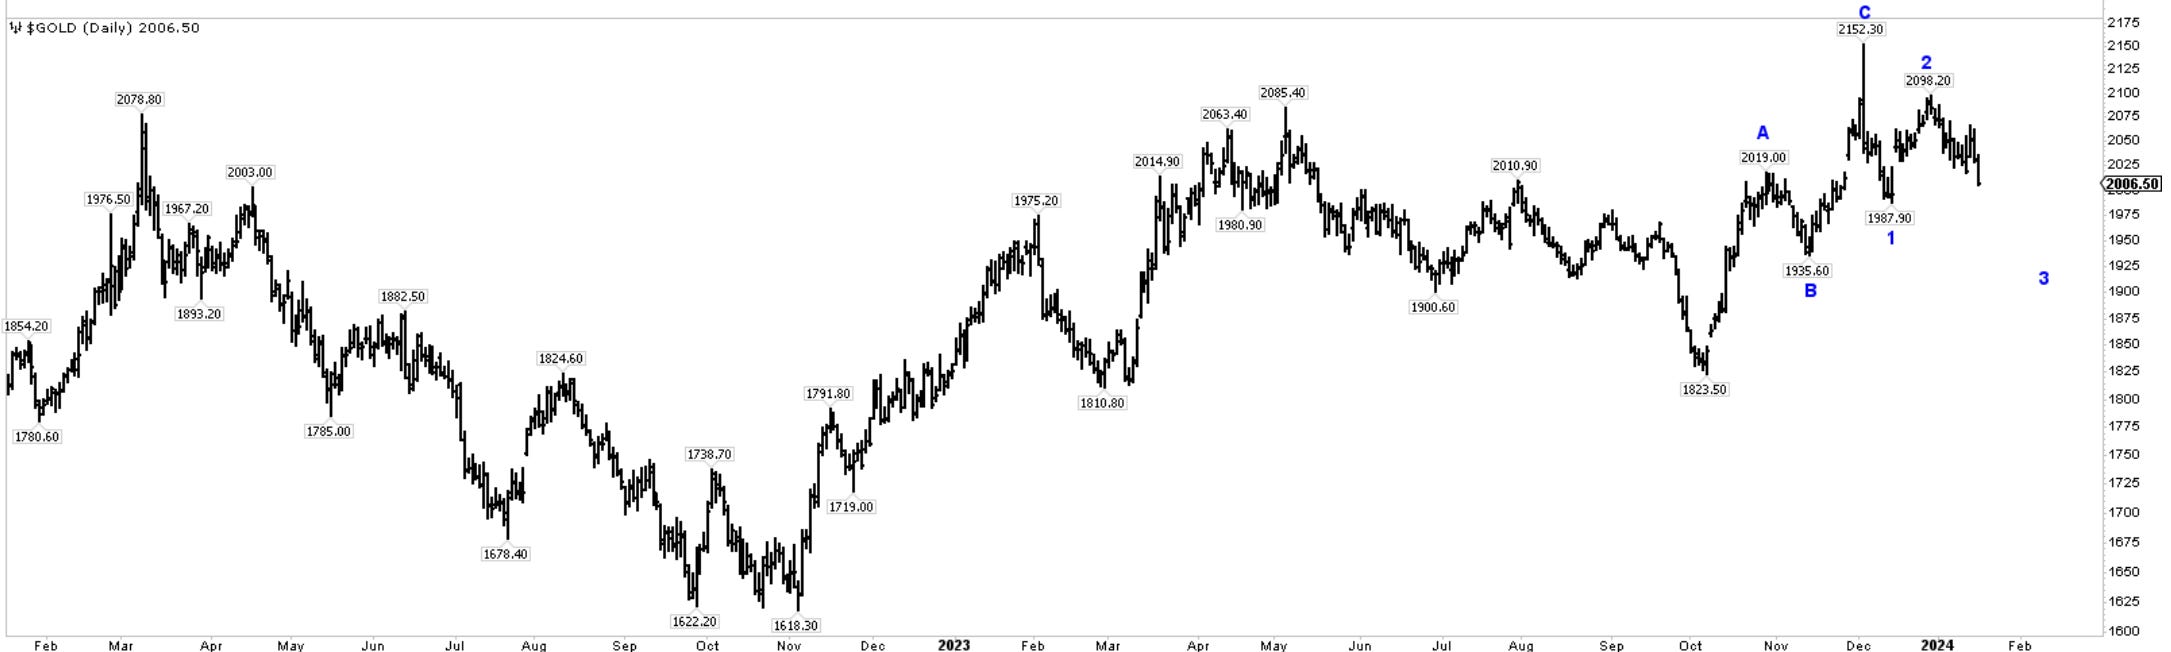
Gold
no changes in Gold- prior comments remain.
Gold has lost -1.17% today, getting closer yet to that prior swing low at 1987.90. A loss of that level will likely accelerate the downside. There was a premature, exciting move towards 2150 on FED cutting rates. I think we’re going through a period of repricing as those rate cuts are being pushed back. Plus, don’t forget money market funds yield nearly 5%, so holding a yellow metal with no yield does not make much sense for many.
Bitcoin
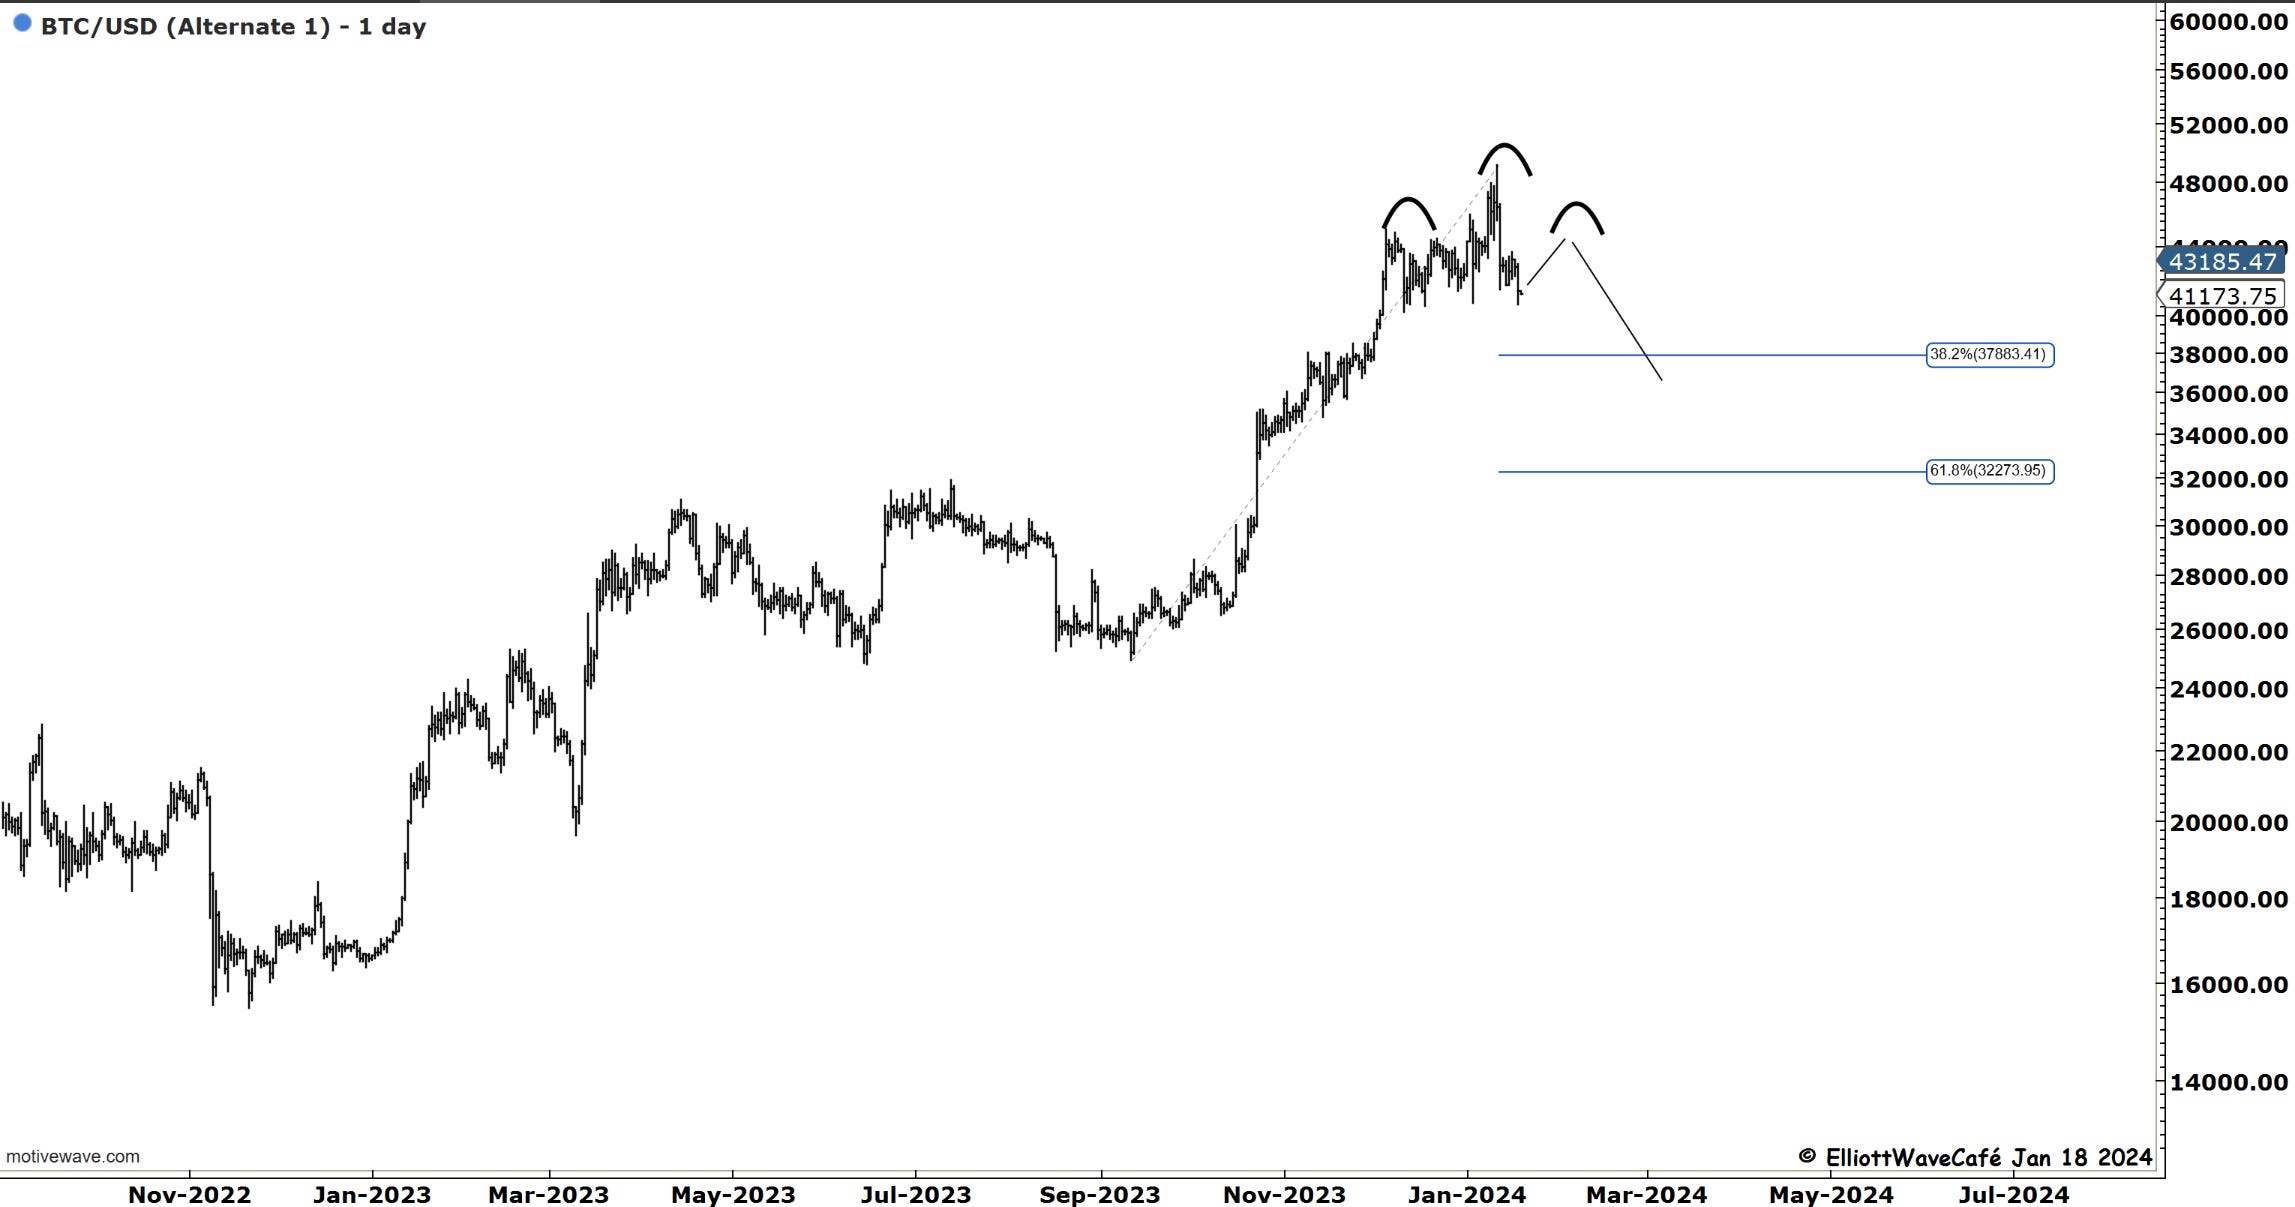
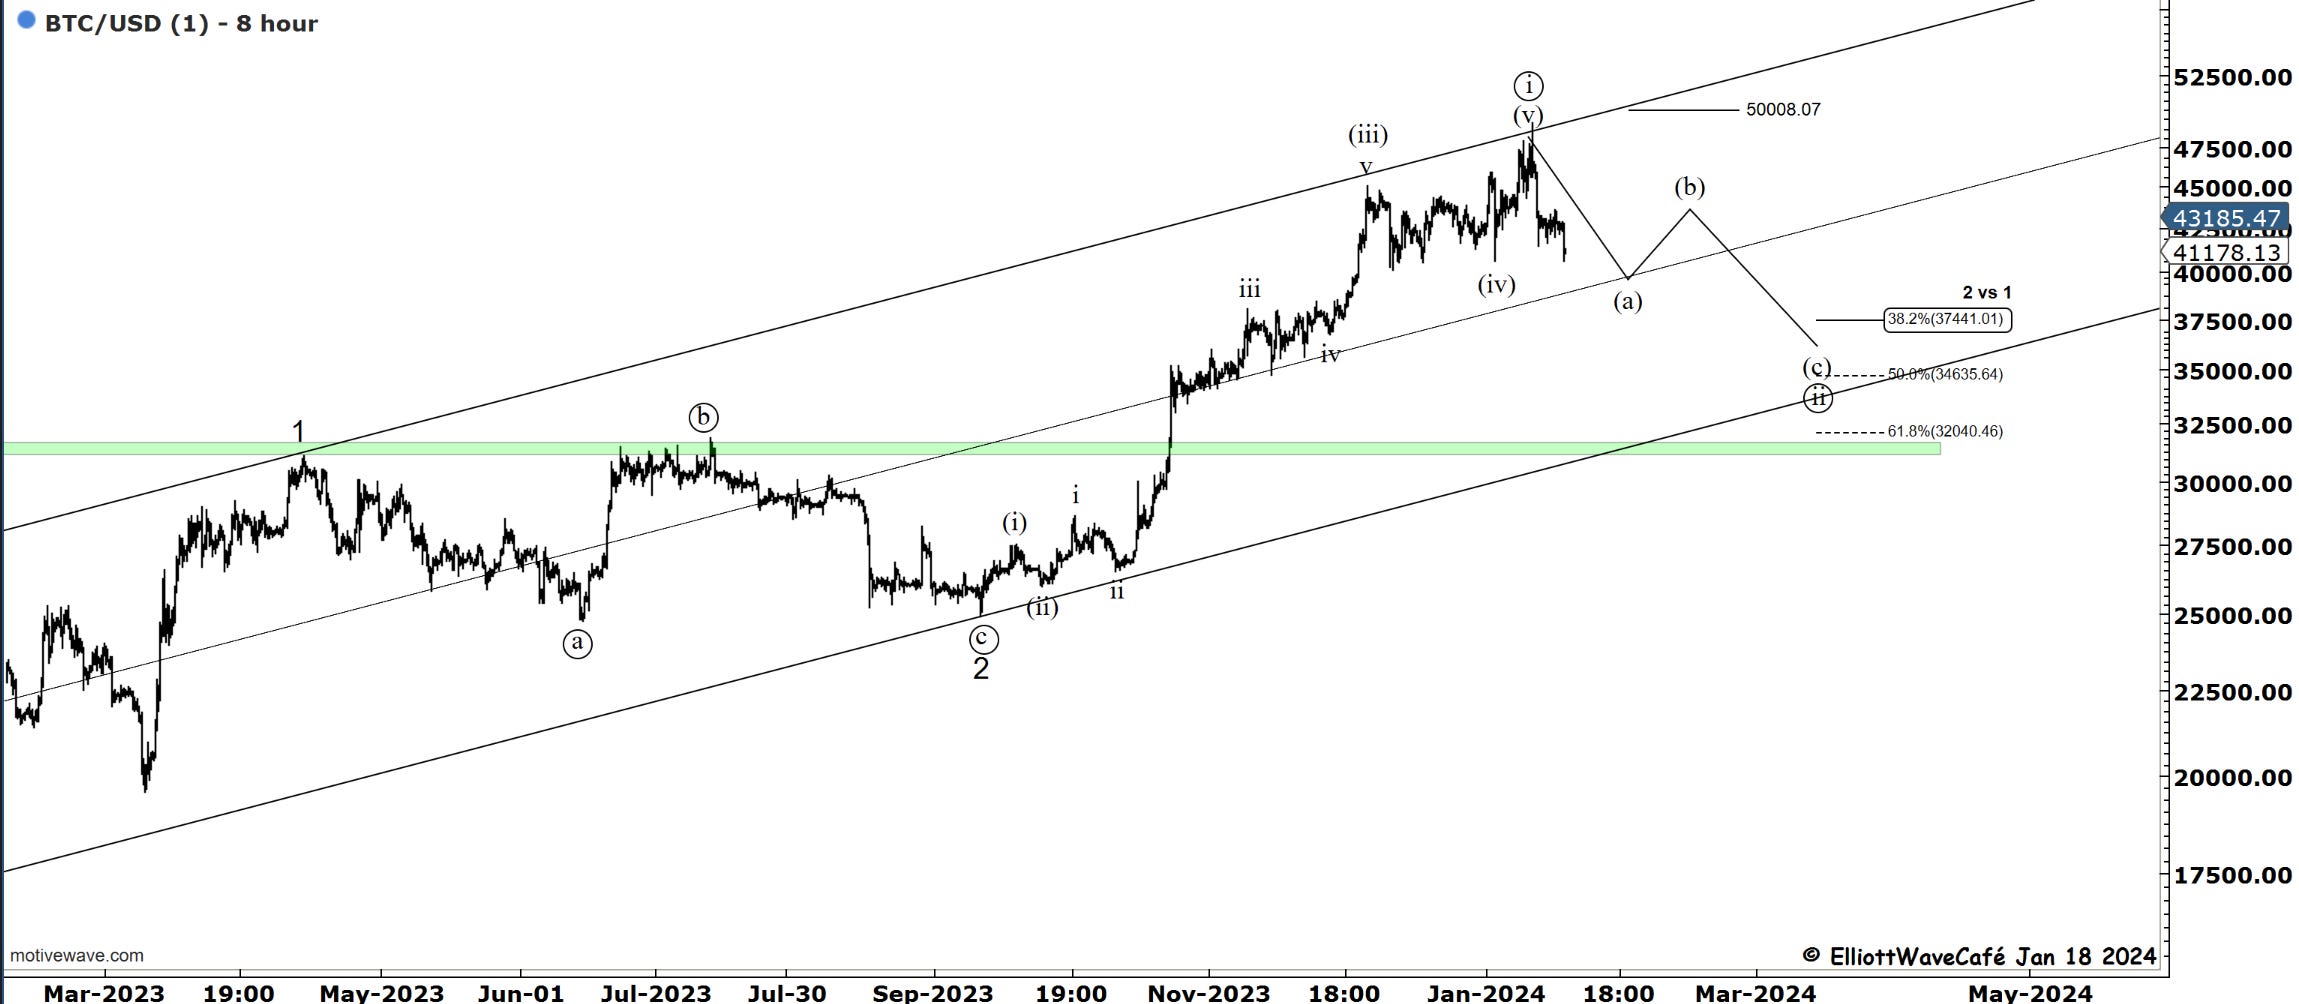
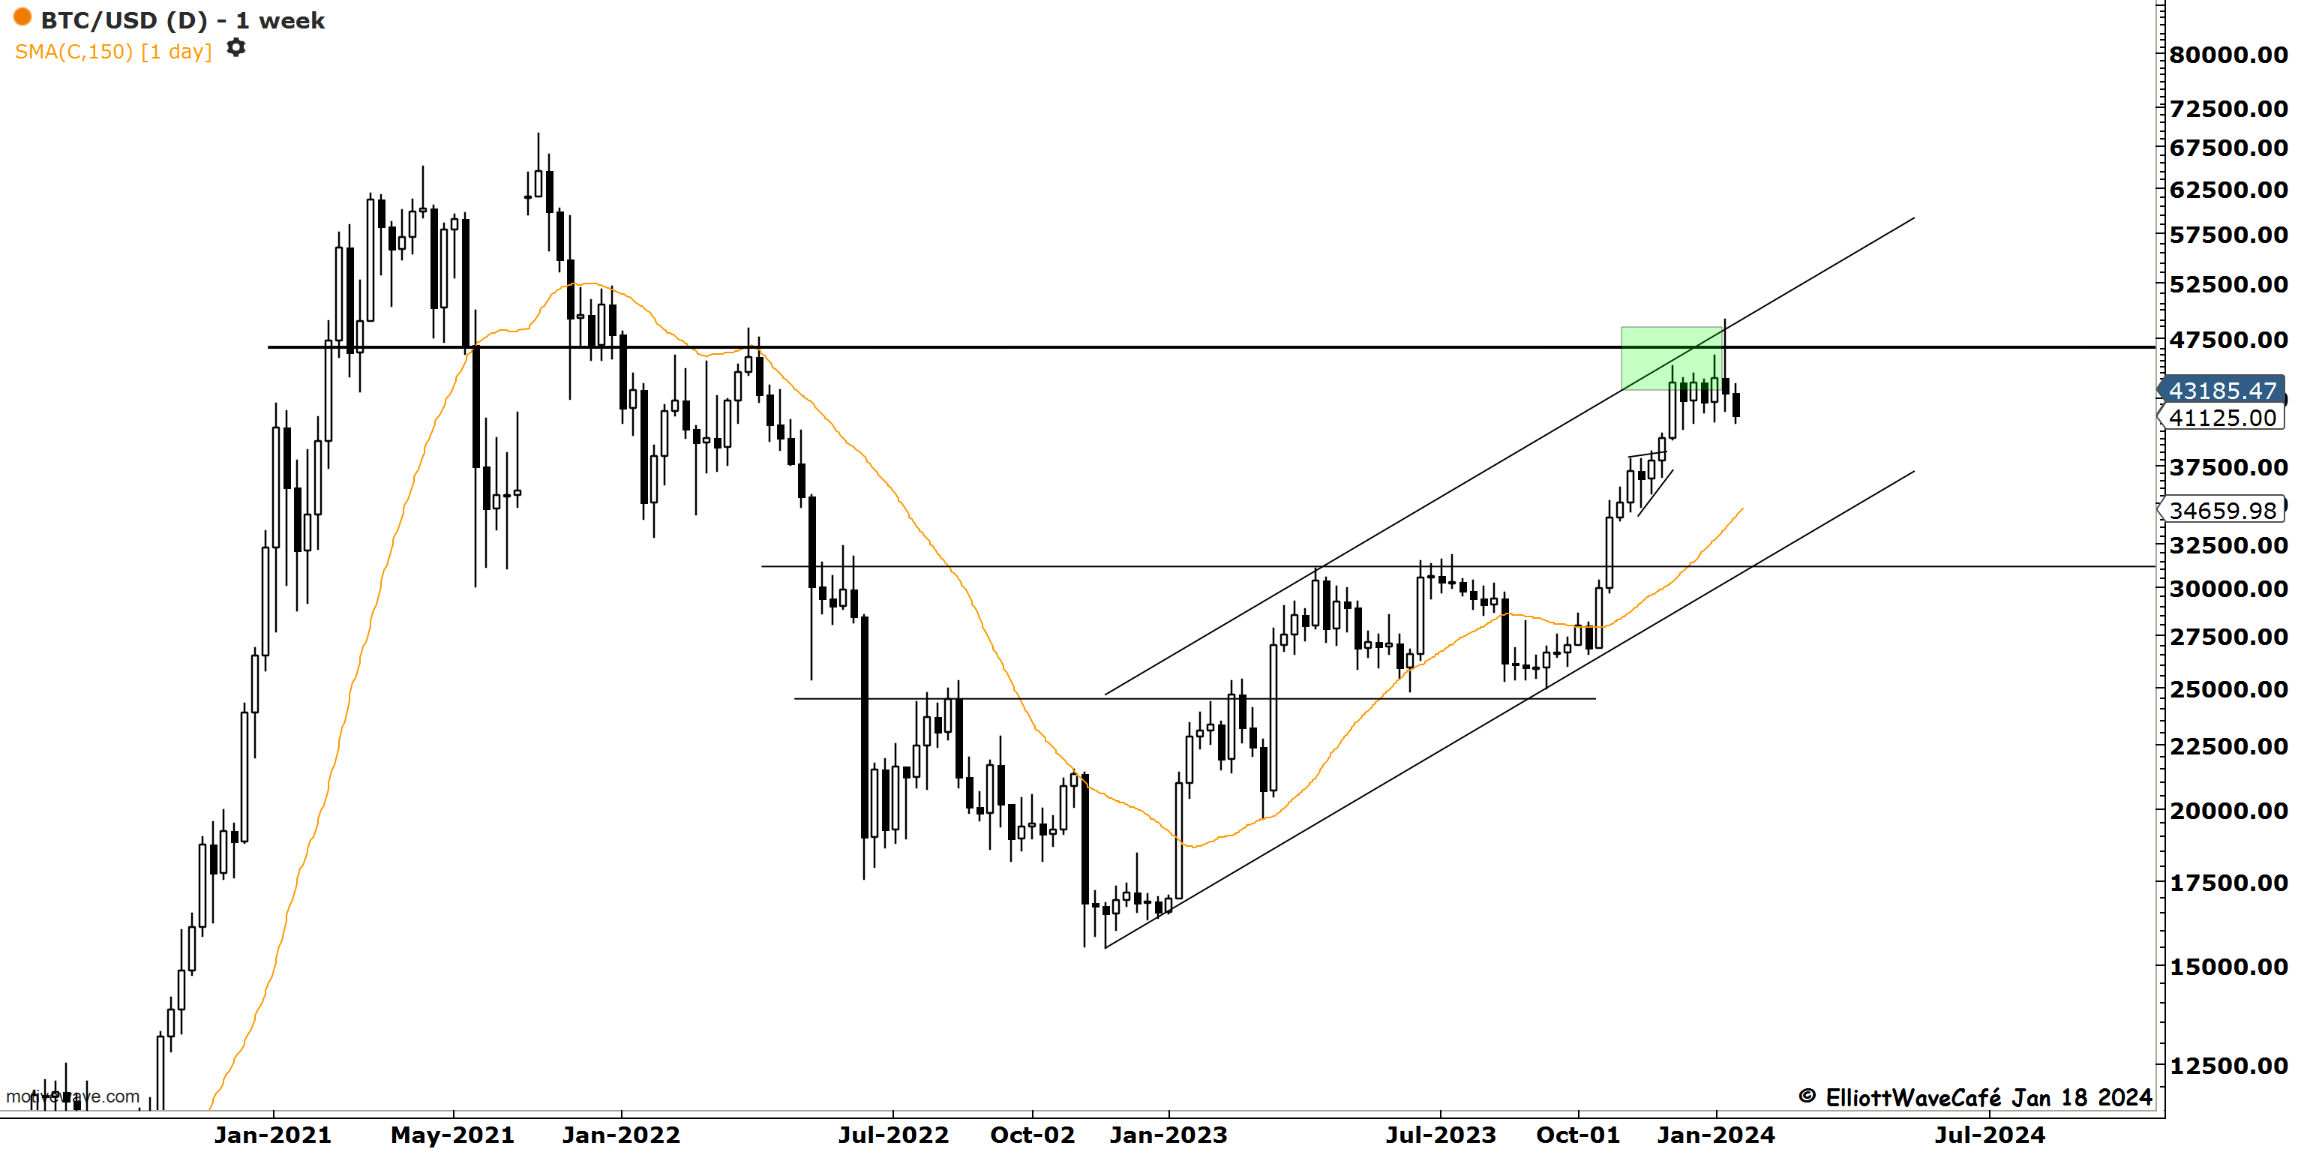
Bitcoin has started to accelerate to the downside after the expected failure at the top of the channel. Today, we have cracked below 41k, just above the larger support at 40,500. We do not have a fully developed right shoulder, but if BTC manages to stage a 3-wave rally, it would be the first thing that would come to mind. It would create a (b) wave ahead of a larger (c ) wave decline. The weekly charts below display the clear rejection and follow-through confirmation. 38k and 36k, eventually, are the expected targets.
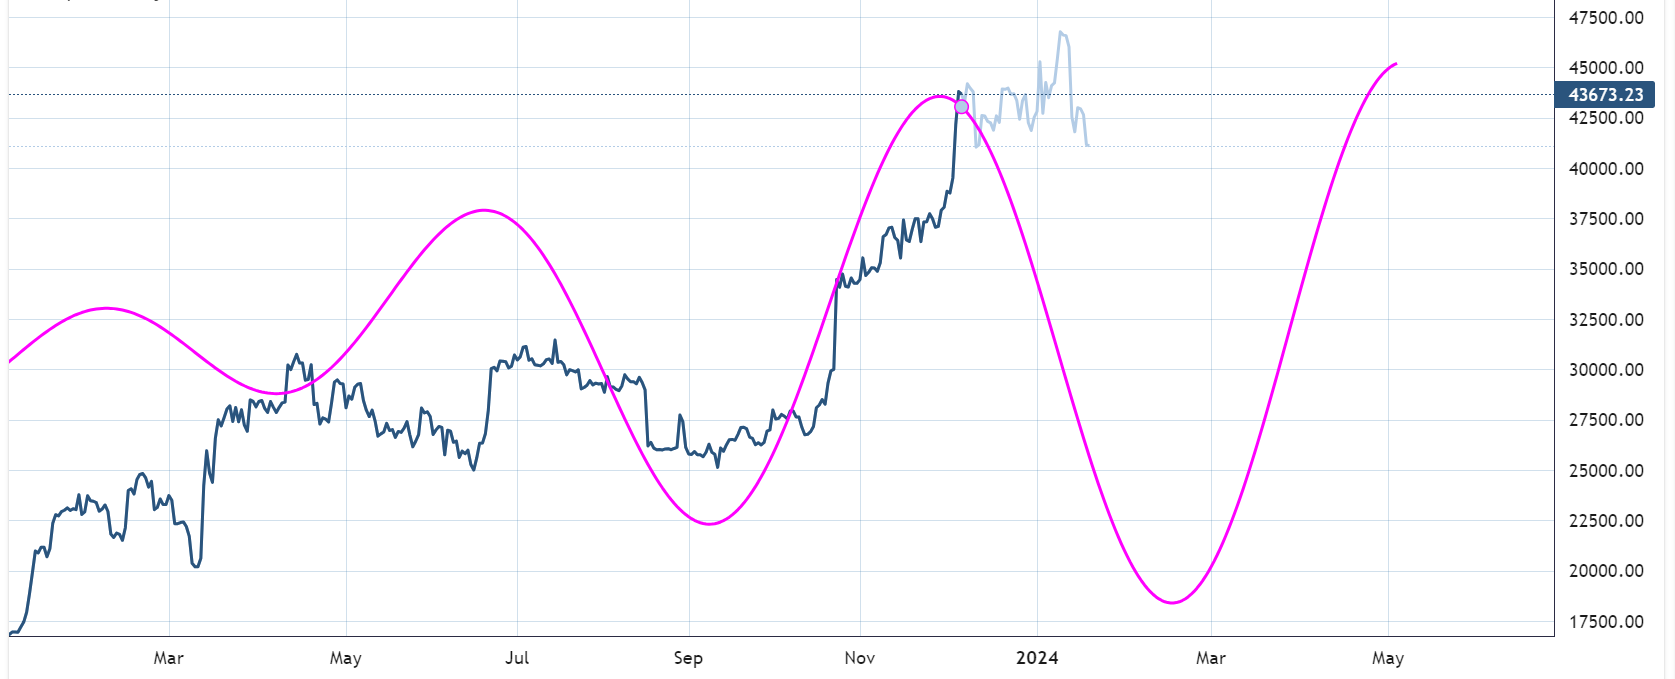
The 150-day cycle, presented in early December, continues to manifest itself.
“Double shot” Daily member video coming up next,
If you’re new to Elliott Wave or need to refresh, there is a 7-hour video course with downloadable slides under The Coarse tab on the website.
Have a great day wherever you are! - trade well, and don’t forget to subscribe and drop a like if this letter helps you in any way.
Cris
email: ewcafe@pm.me