
The Daily Drip
Markets review, strategy and analysis
Note: The EW counts on the right edge are real-time, and they are prone to adjustments as price action develops. Elliott Wave has a fluid approach, is evidence-based, and requires constant monitoring of certain thresholds.
In the counts below, this (( )) = circle on chart
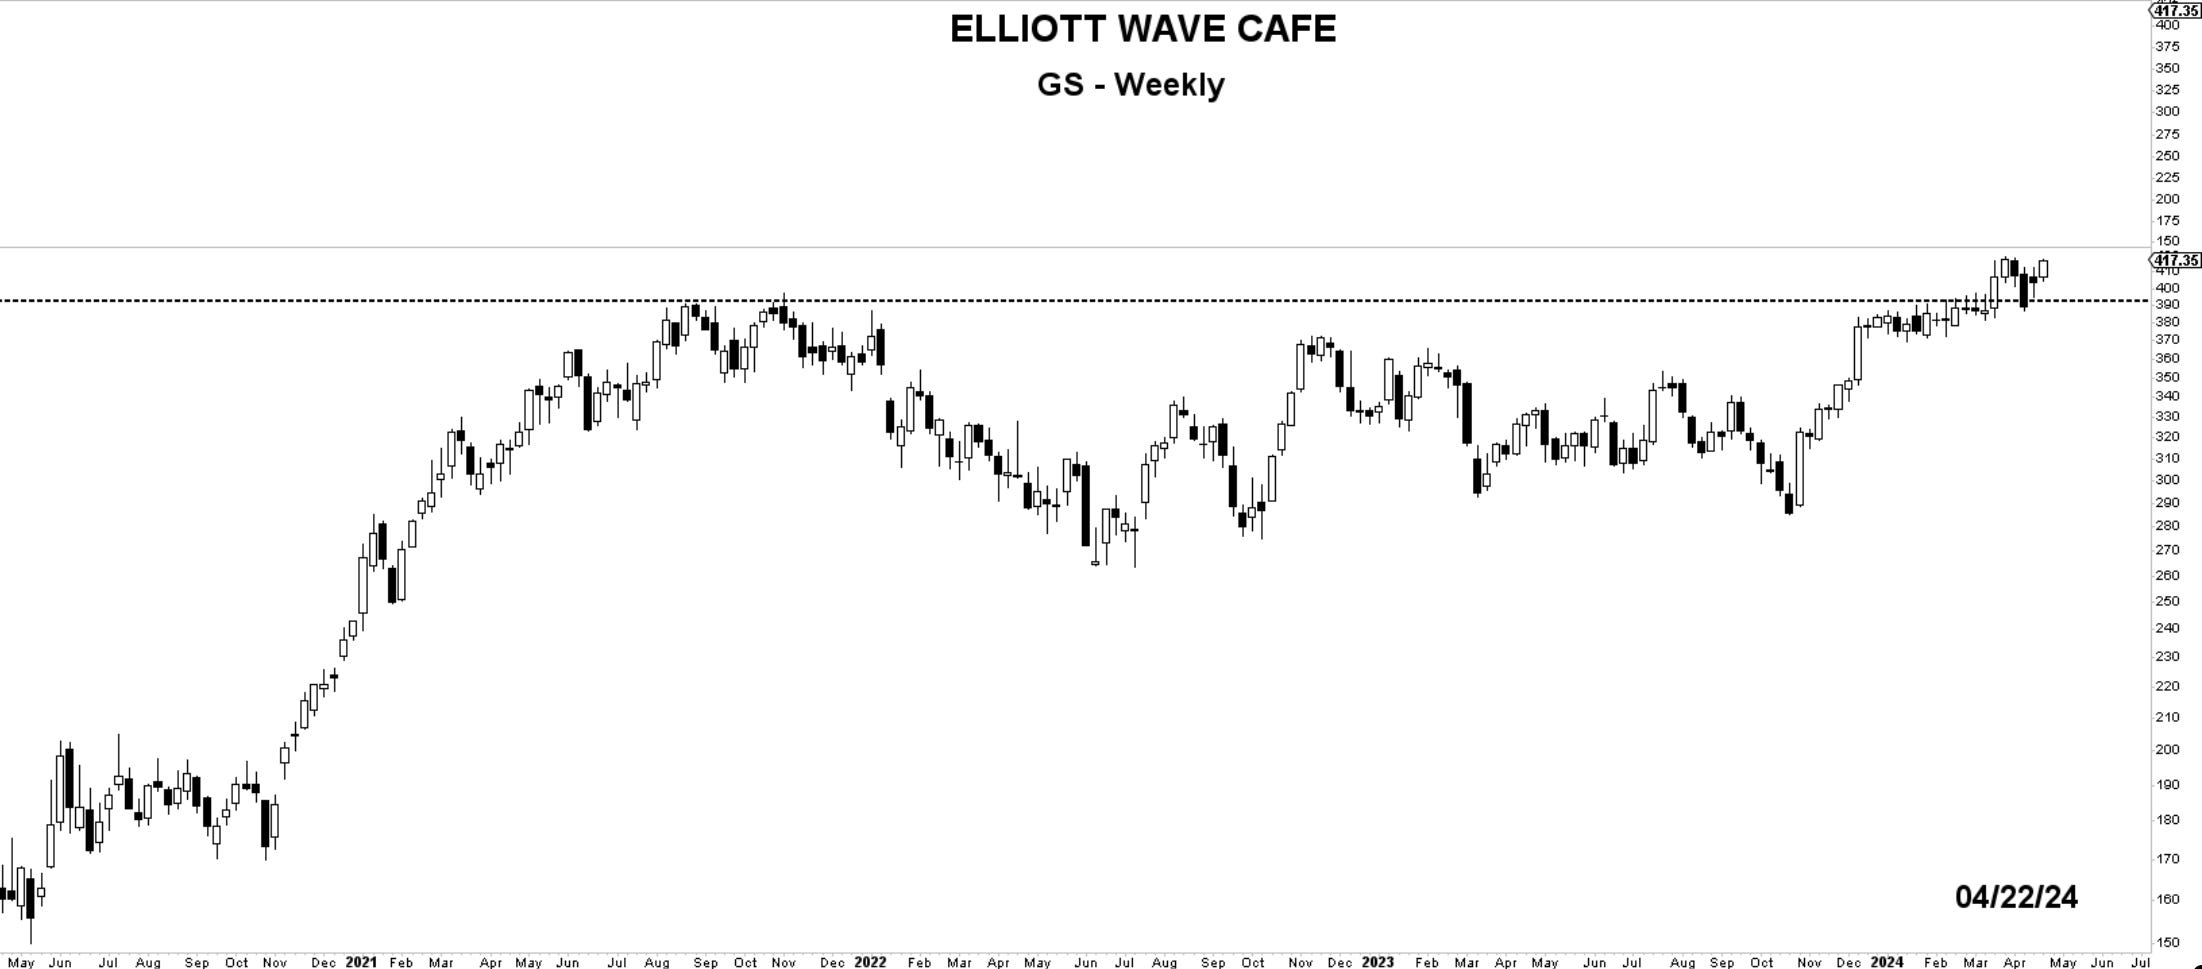
Chart of the Day—GS—Stocks that display absolute and relative strength during equities market corrections tend to be good performers going forward. Here is Goldman Sachs with a break and hold above the 390 resistance level. Using that level as a defense on a weekly closing basis, the path higher seems a sensible choice at the current juncture.
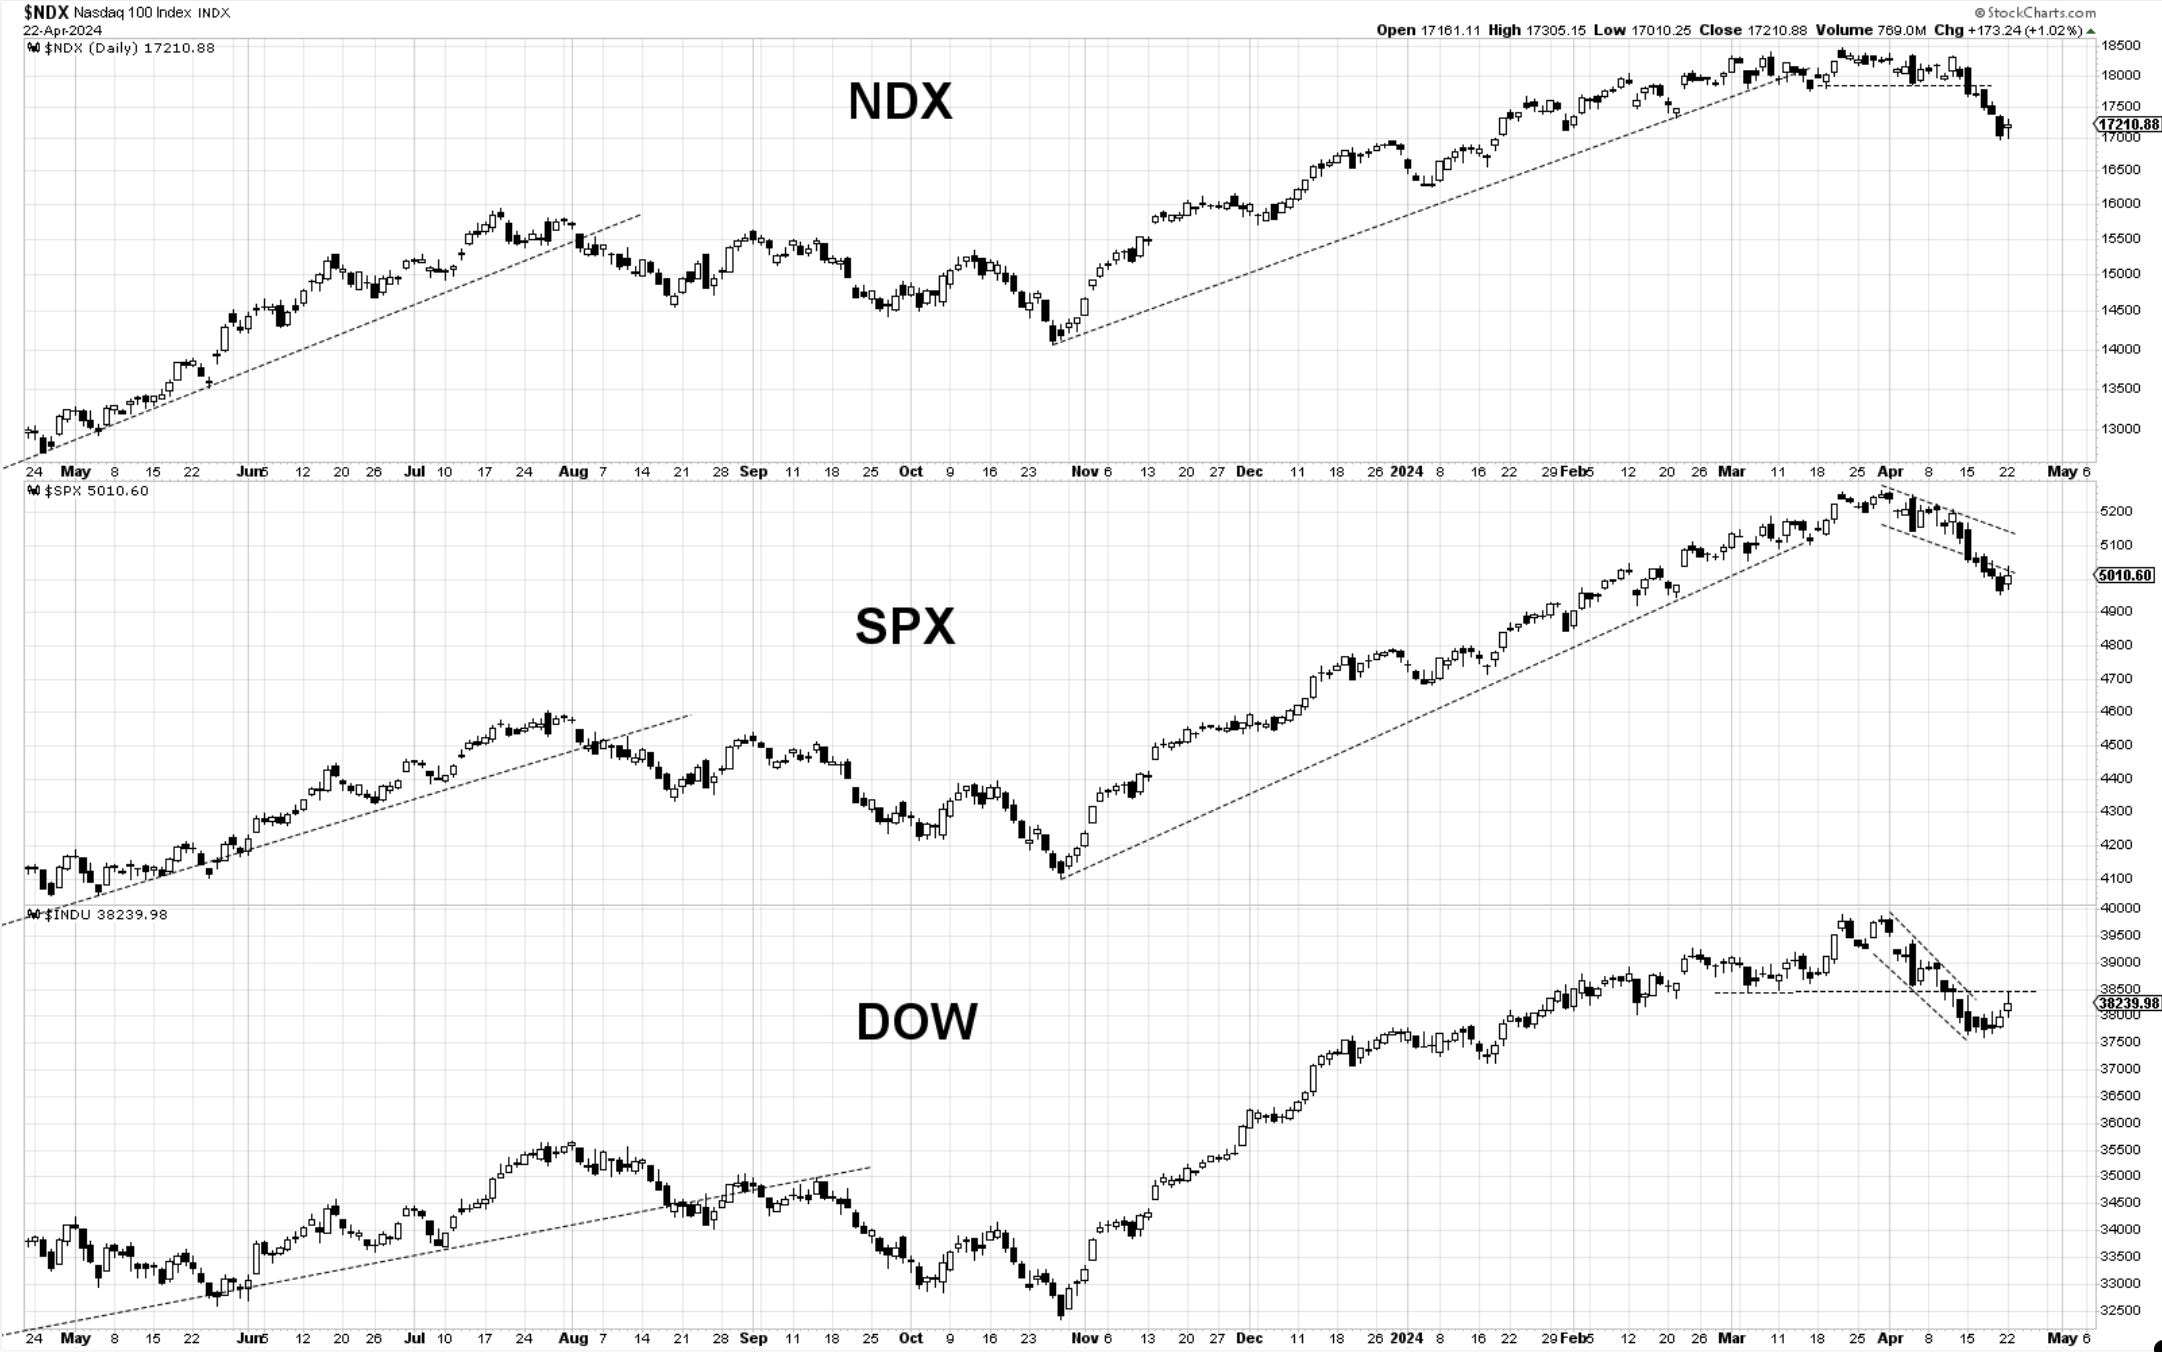
Bottom Line: One day does not make a trend. After Friday’s selloff, we’re witnessing a slight pause in the ongoing decline, but if a low has been found, there is more proof we need to see. Another couple of days of buying ideally with above 1% gains would be a welcoming sign. All 11 US sectors were positive today.
Let’s dive into charts and further analysis below…
