
The Daily Drip
Markets review, strategy and analysis
Note: The EW counts on the right edge are real-time, and they are prone to adjustments as price action develops. Elliott Wave has a fluid approach, is evidence-based, and requires constant monitoring of certain thresholds.
In the counts below, this (( )) = circle on chart
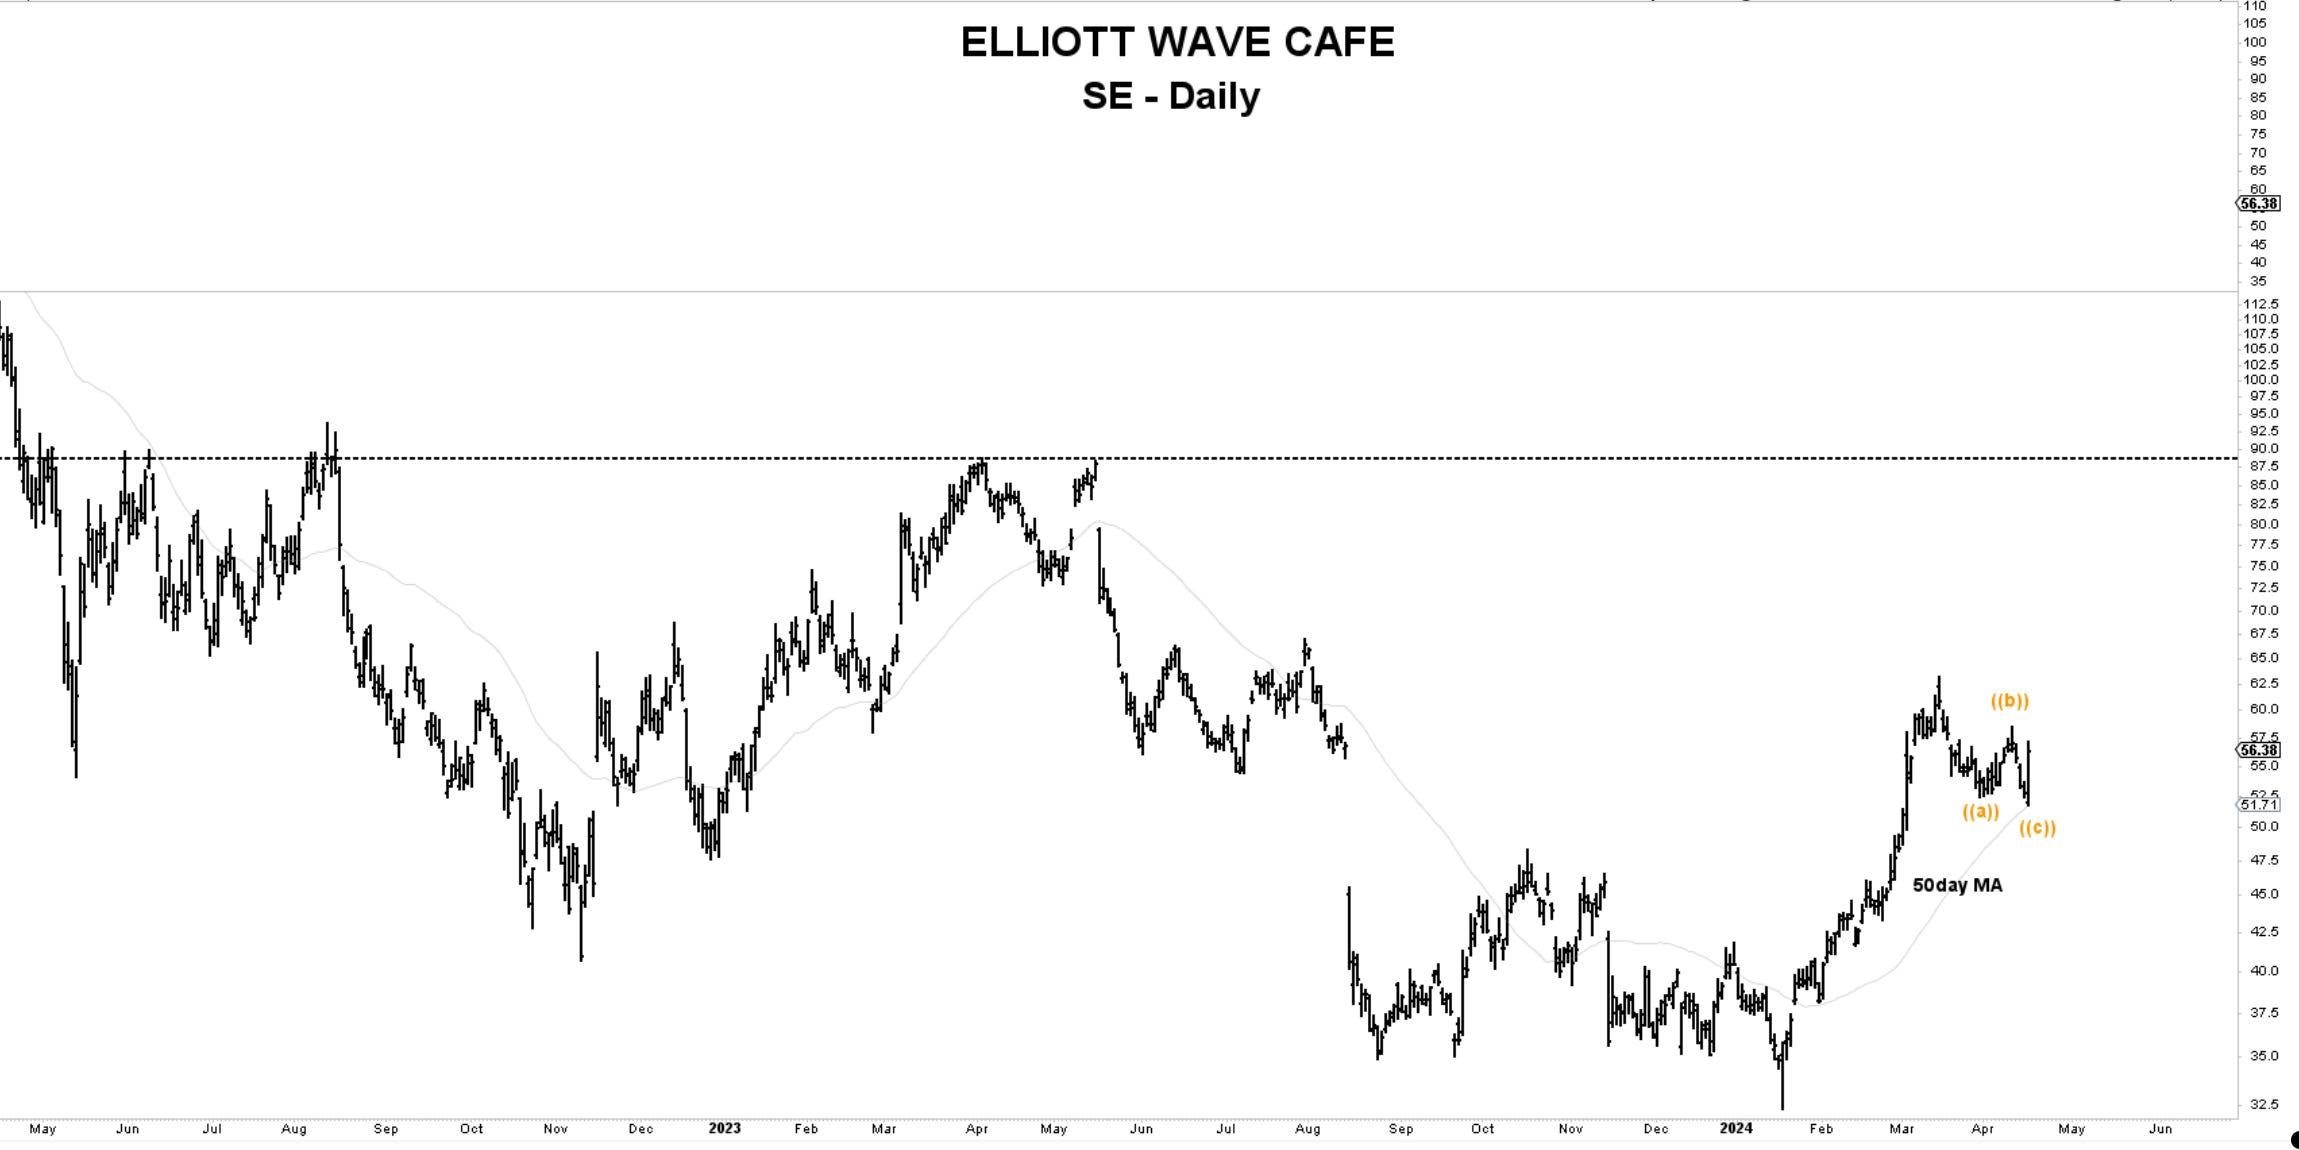
Chart of the Day—SE— Sea Limited here with what appears to be an ABC pullback to 50day MA. A setup I do not dislike as long as it breaks 58.70 first. A reversal below the wave ((c )) low changes the count and nullifies the current assumption.
Bottom Line: Today’s losses in the indices were minor, but the price action remains weak, and there is no visible reason to press the “increasing exposure” button. All markets are trading below their 50day MA. Caution, profit-taking, and position reduction are the name of the game as of right now. I will be discussing here once there is enough of a shift in chart structure to warrant a switch to increased bullish exposure.
Jay Powell is giving the market a cold shower with his comments on the rates remaining at current levels until inflation gets closer to 2%.
Let’s dive into charts and further commentary below…
