
The Daily Drip
Markets review, strategy and analysis
Note: The EW counts on the right edge are real-time, and they are prone to adjustments as price action develops. Elliott Wave has a fluid approach, is evidence-based, and requires constant monitoring of certain thresholds.
In the counts below, this (( )) = circle on chart
Chart of the Day—AMAT- The uptrend is in place, and the stock is coming back from lows and breaking above key averages. Entry points are 1(small) and 2 (add).
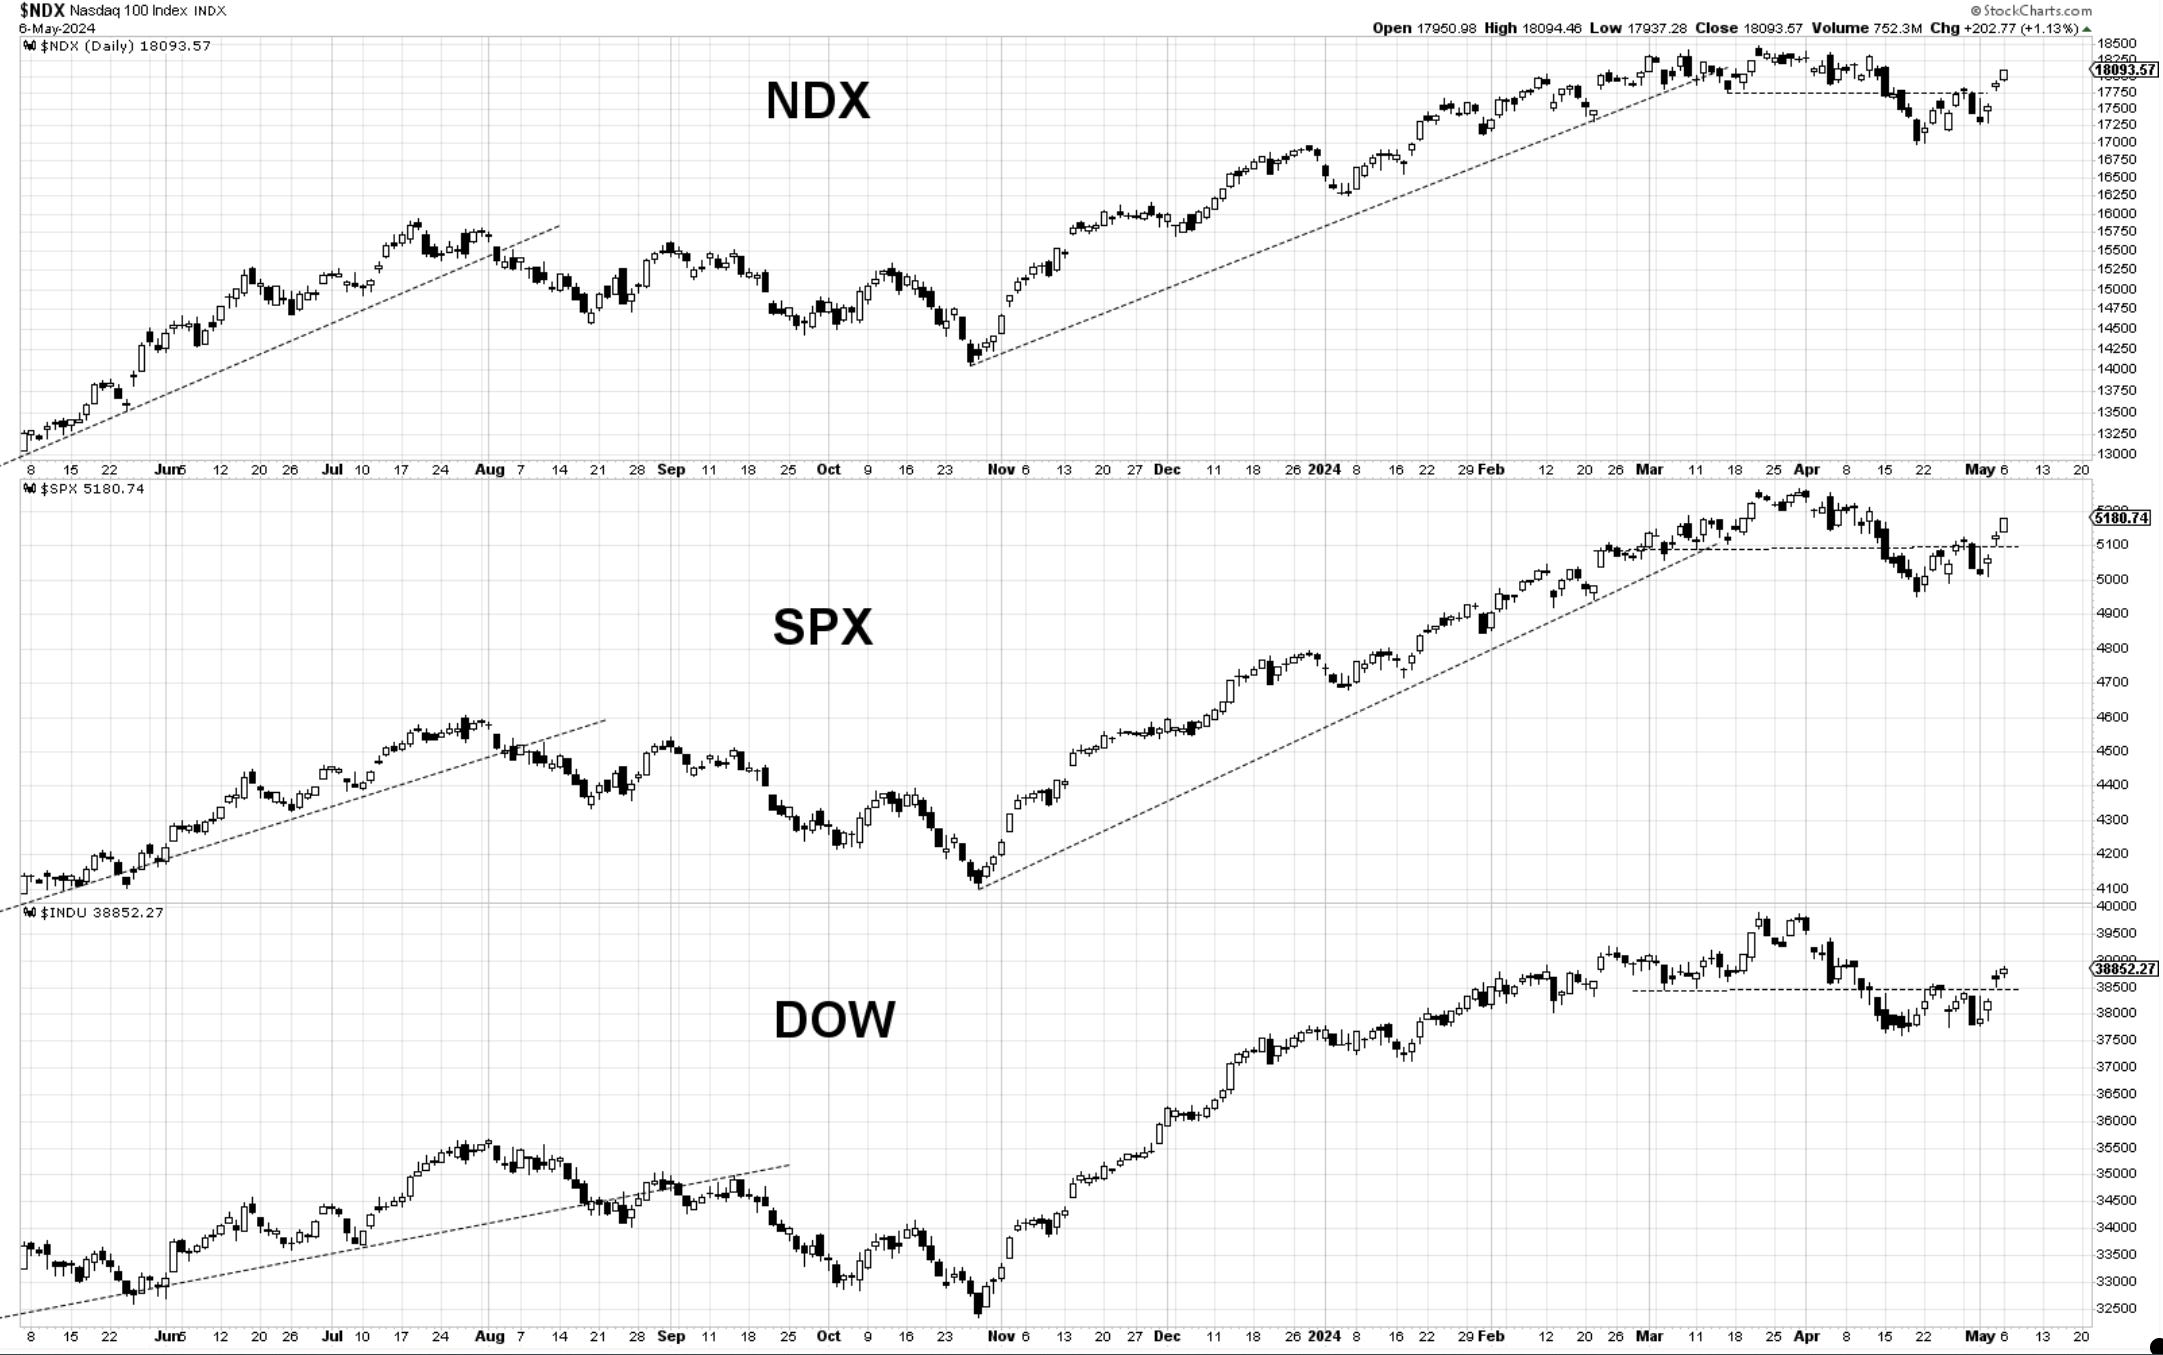
Bottom Line: Markets climbed back above dotted resistance levels. The uptrend is trying to reassert itself. As mentioned in the weekly update, increasing equity exposure is starting to make sense on the hunt for new ATH. The bears were unable to recapture the important bearish trigger from the April 25th lows.
Let’s now dive into charts and further analysis below… then the Double Shot daily video.
