
The Daily Drip
Core markets charts updates and commentary
Note: The counts on the right edge are real-time, and they are prone to adjustments as price action develops. Elliott Wave has a fluid approach, is evidence-based, and requires constant monitoring of certain thresholds.
In the counts below, this (( )) = circle on chart
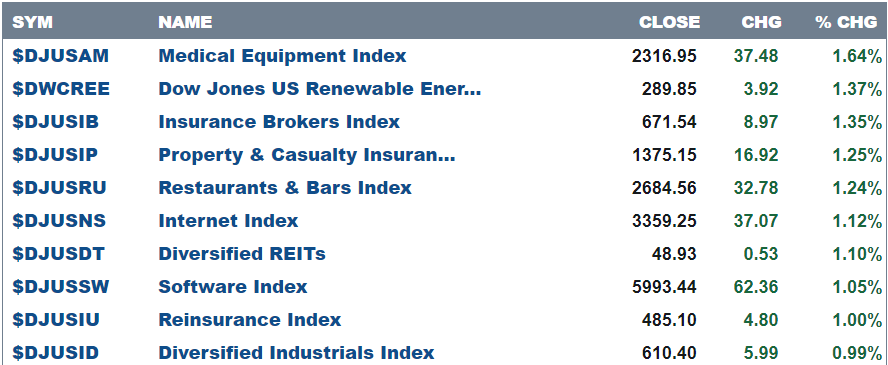
Here are today’s top 10 best performers out of 104 industries.
43 positive closes and 61 negative.
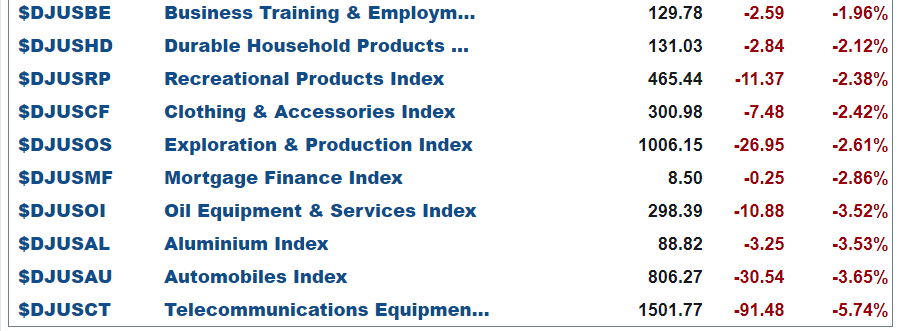
and bottom 10 …
SP500
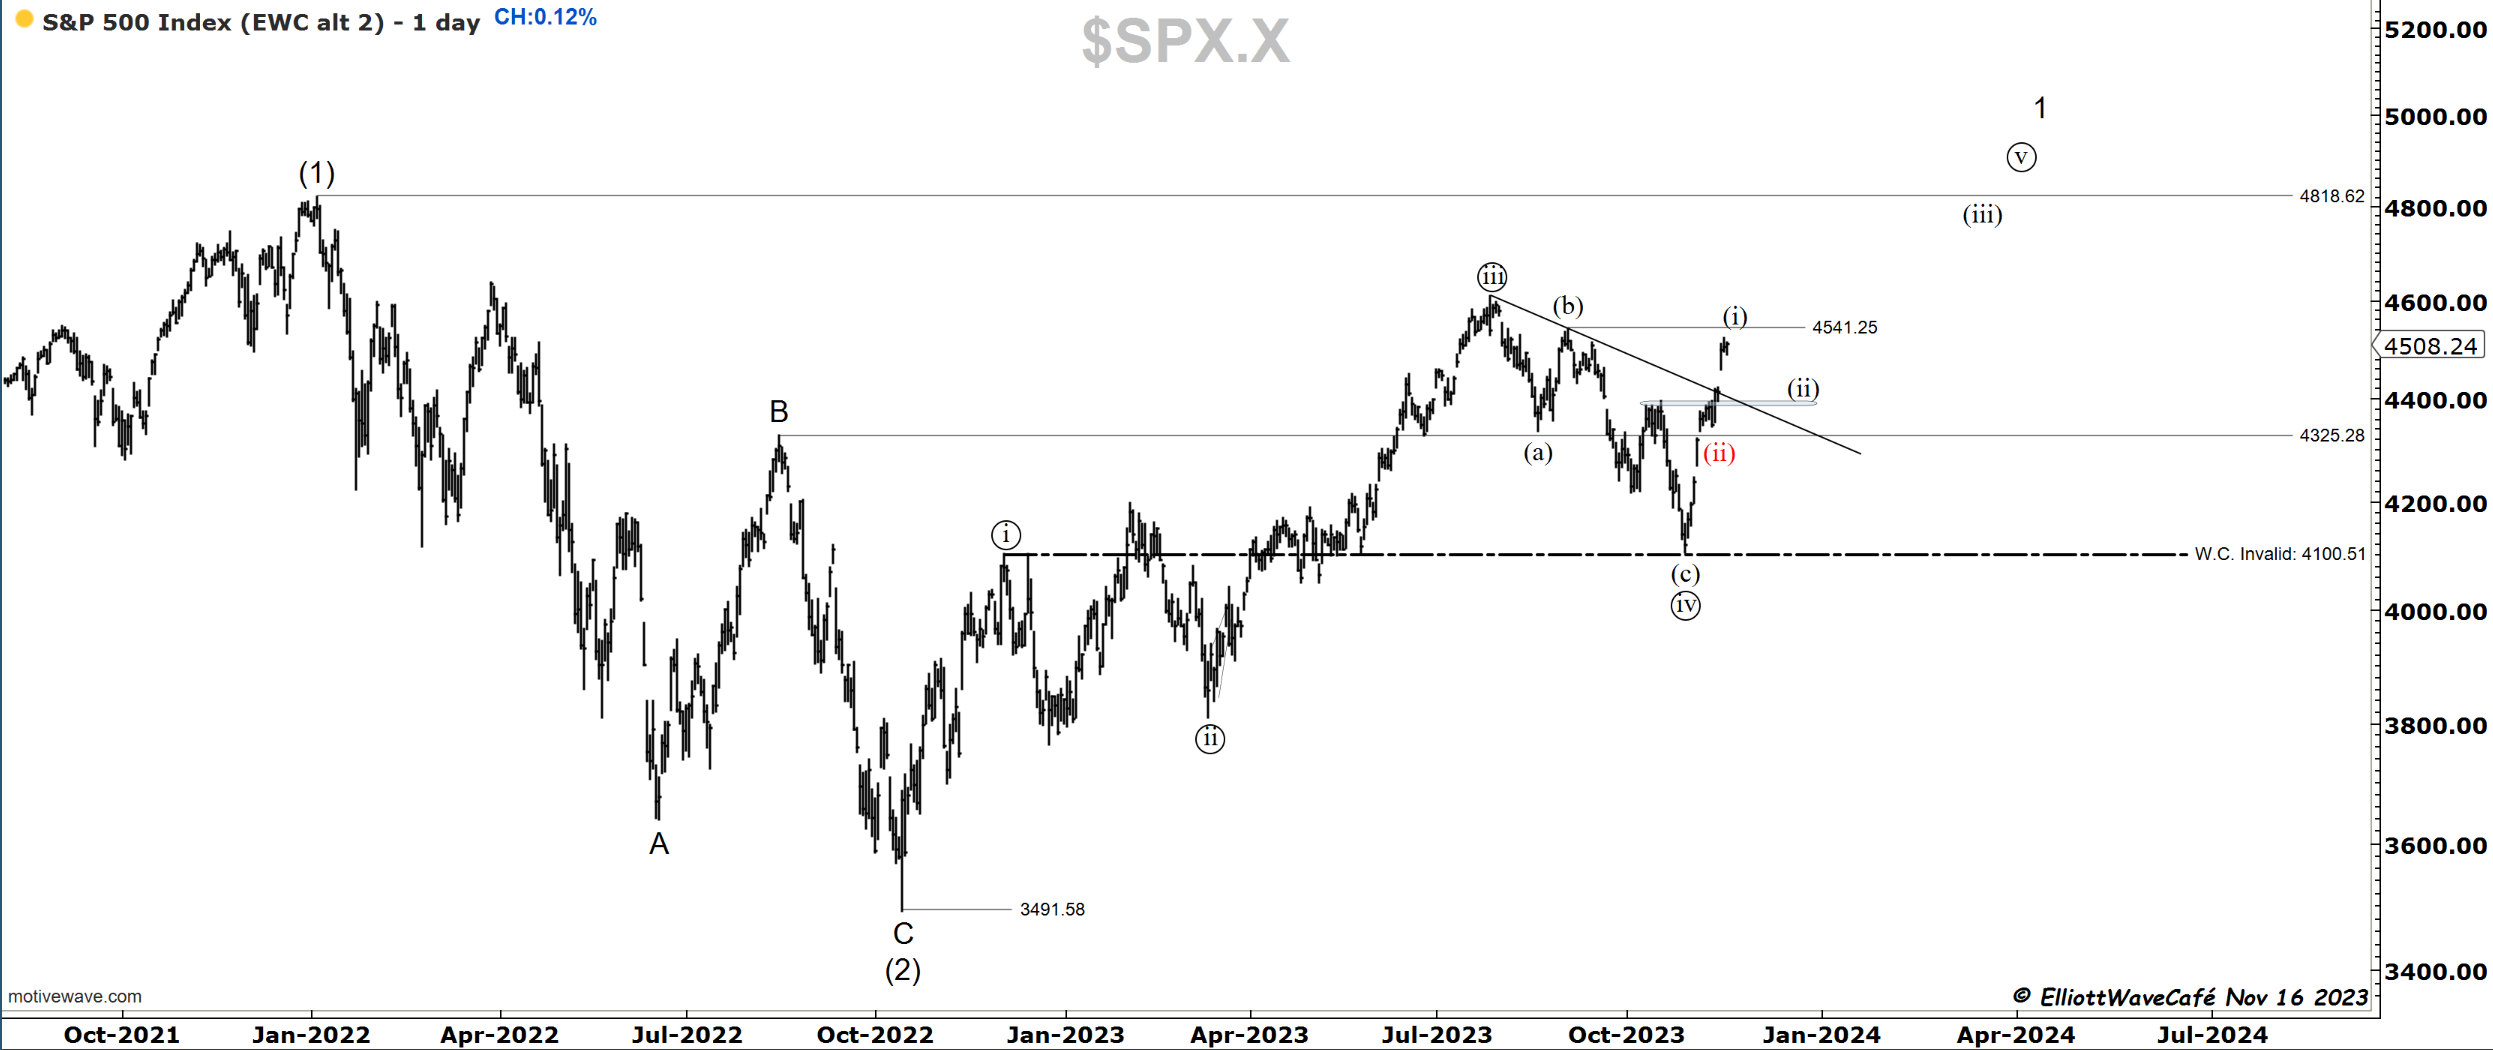
This is the last note of the week, so I will keep it light and simple. Large option expirations day tomorrow.
My primary count remains that a wave ((iv)) low was established on Oct 27th at 4103.78. The current rally is an impulse wave (i). A wave (ii) pullback would revisit the broken trendline and retest the 4400 breakout line.
Here is the same chart without labels and just a proposed inverted head and shoulder that could lead to a continuation higher to new ATH.
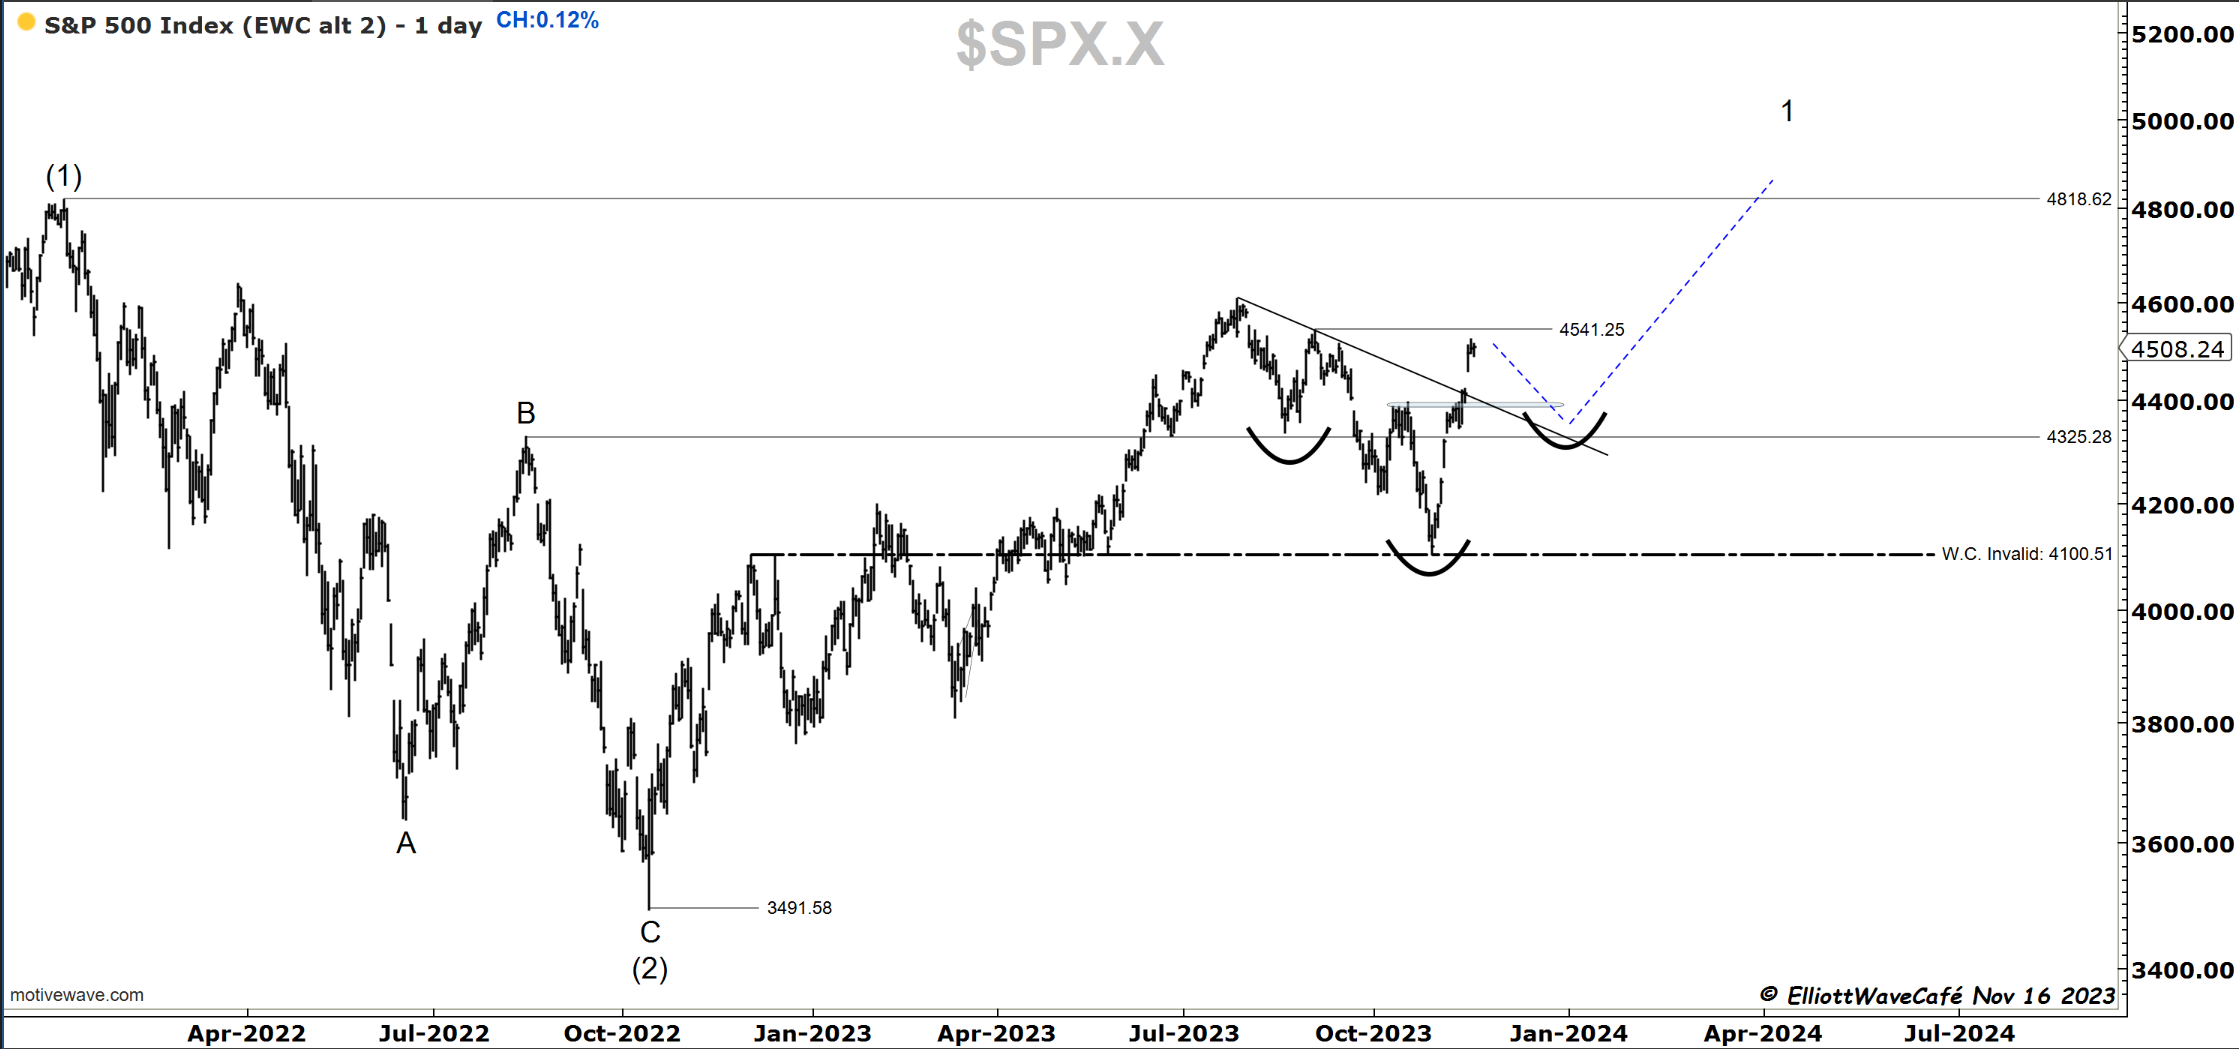
In today’s video, I will discuss the bearish versions of this chart and updates.
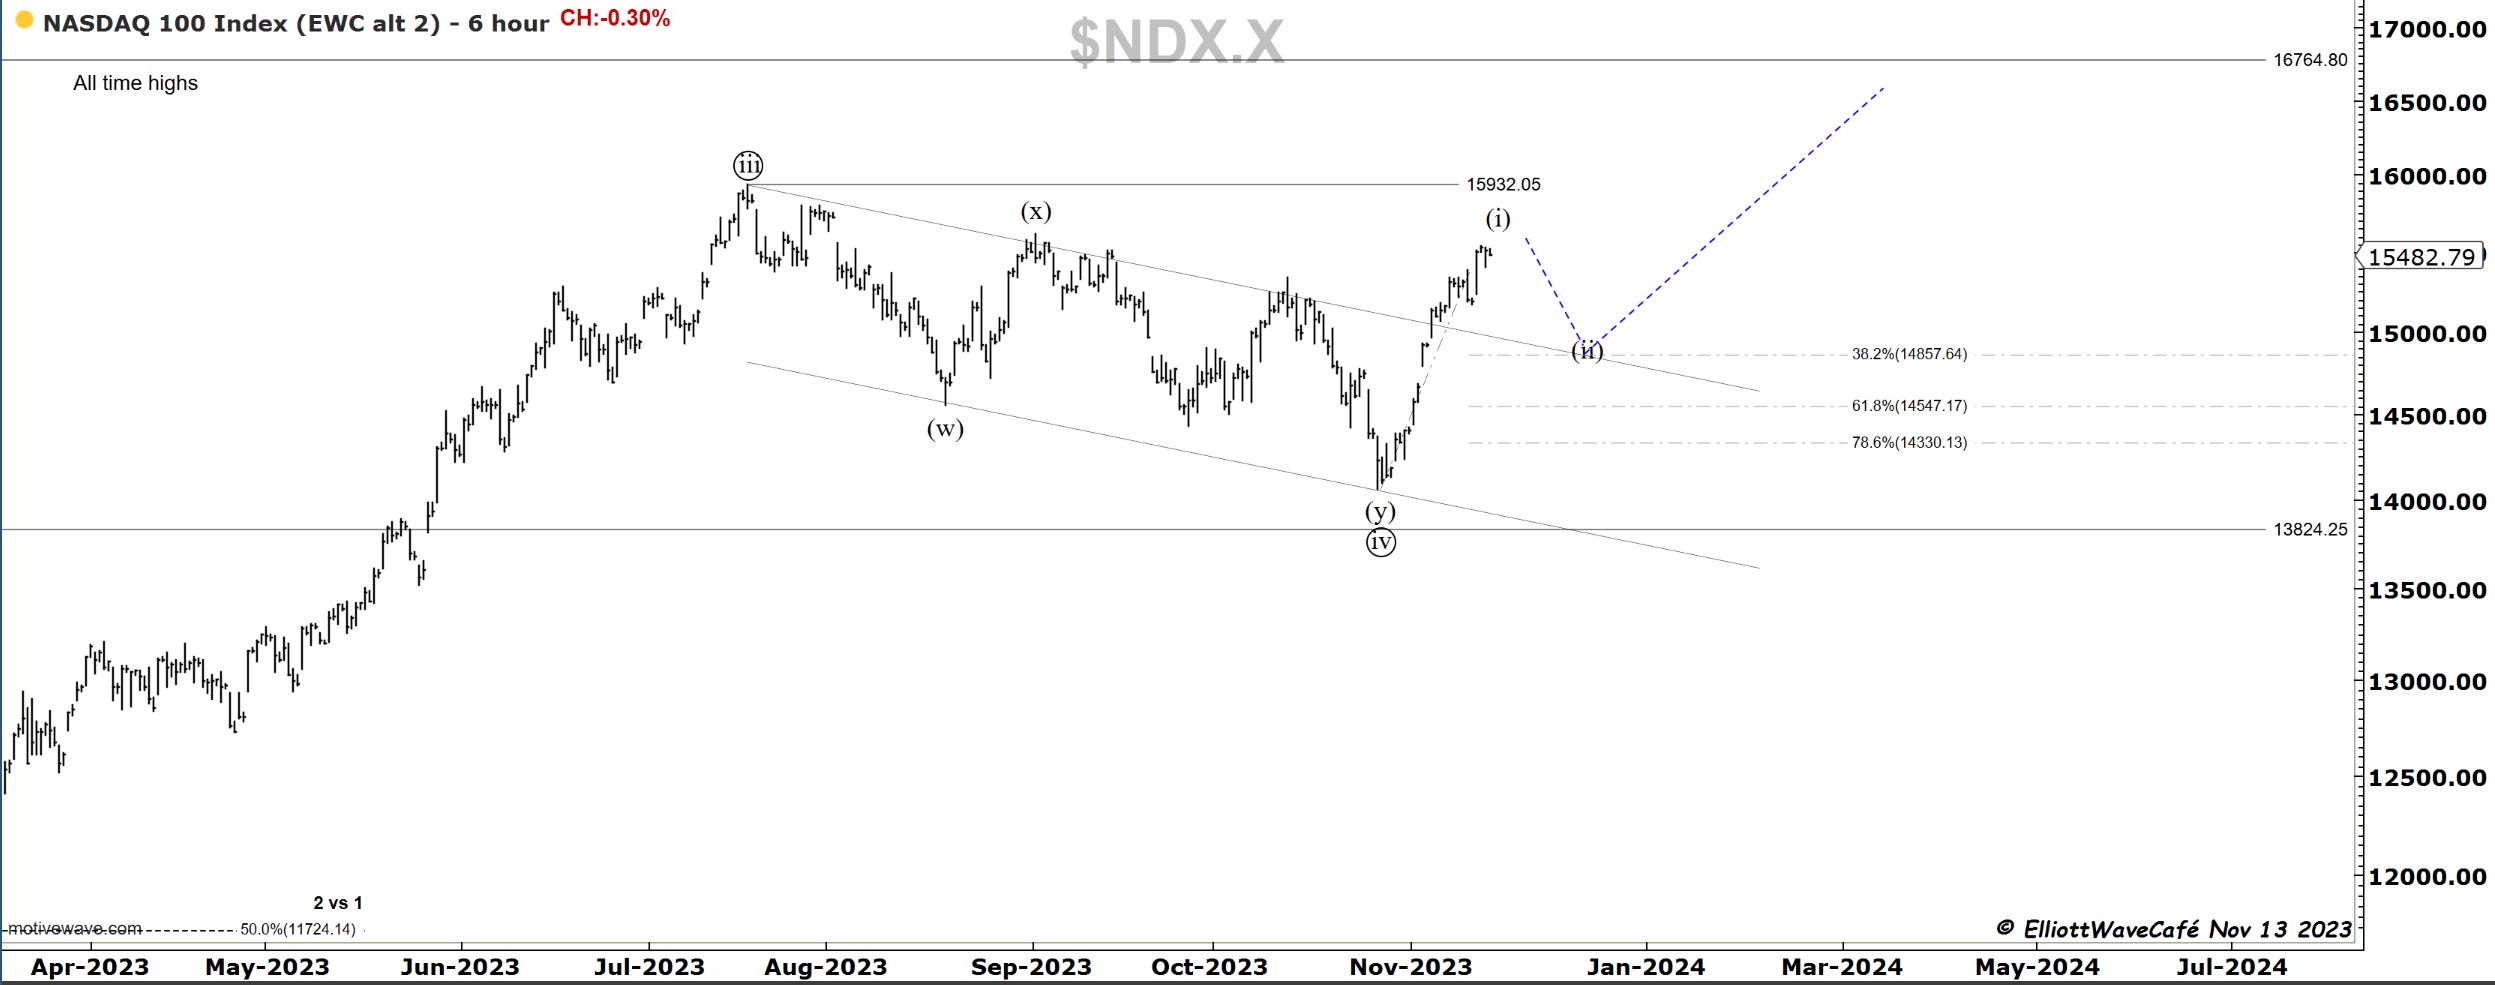
Nasdaq100
Here is another view on the NDX100 that I have been thinking about based on this latest move. What if this rally is already wave ((v)) of 3 instead of wave (i) of ((v)) of 3 like in the second chart? If that’s the case wave 4 will start next. Still down like originally proposed but at a higher degree.
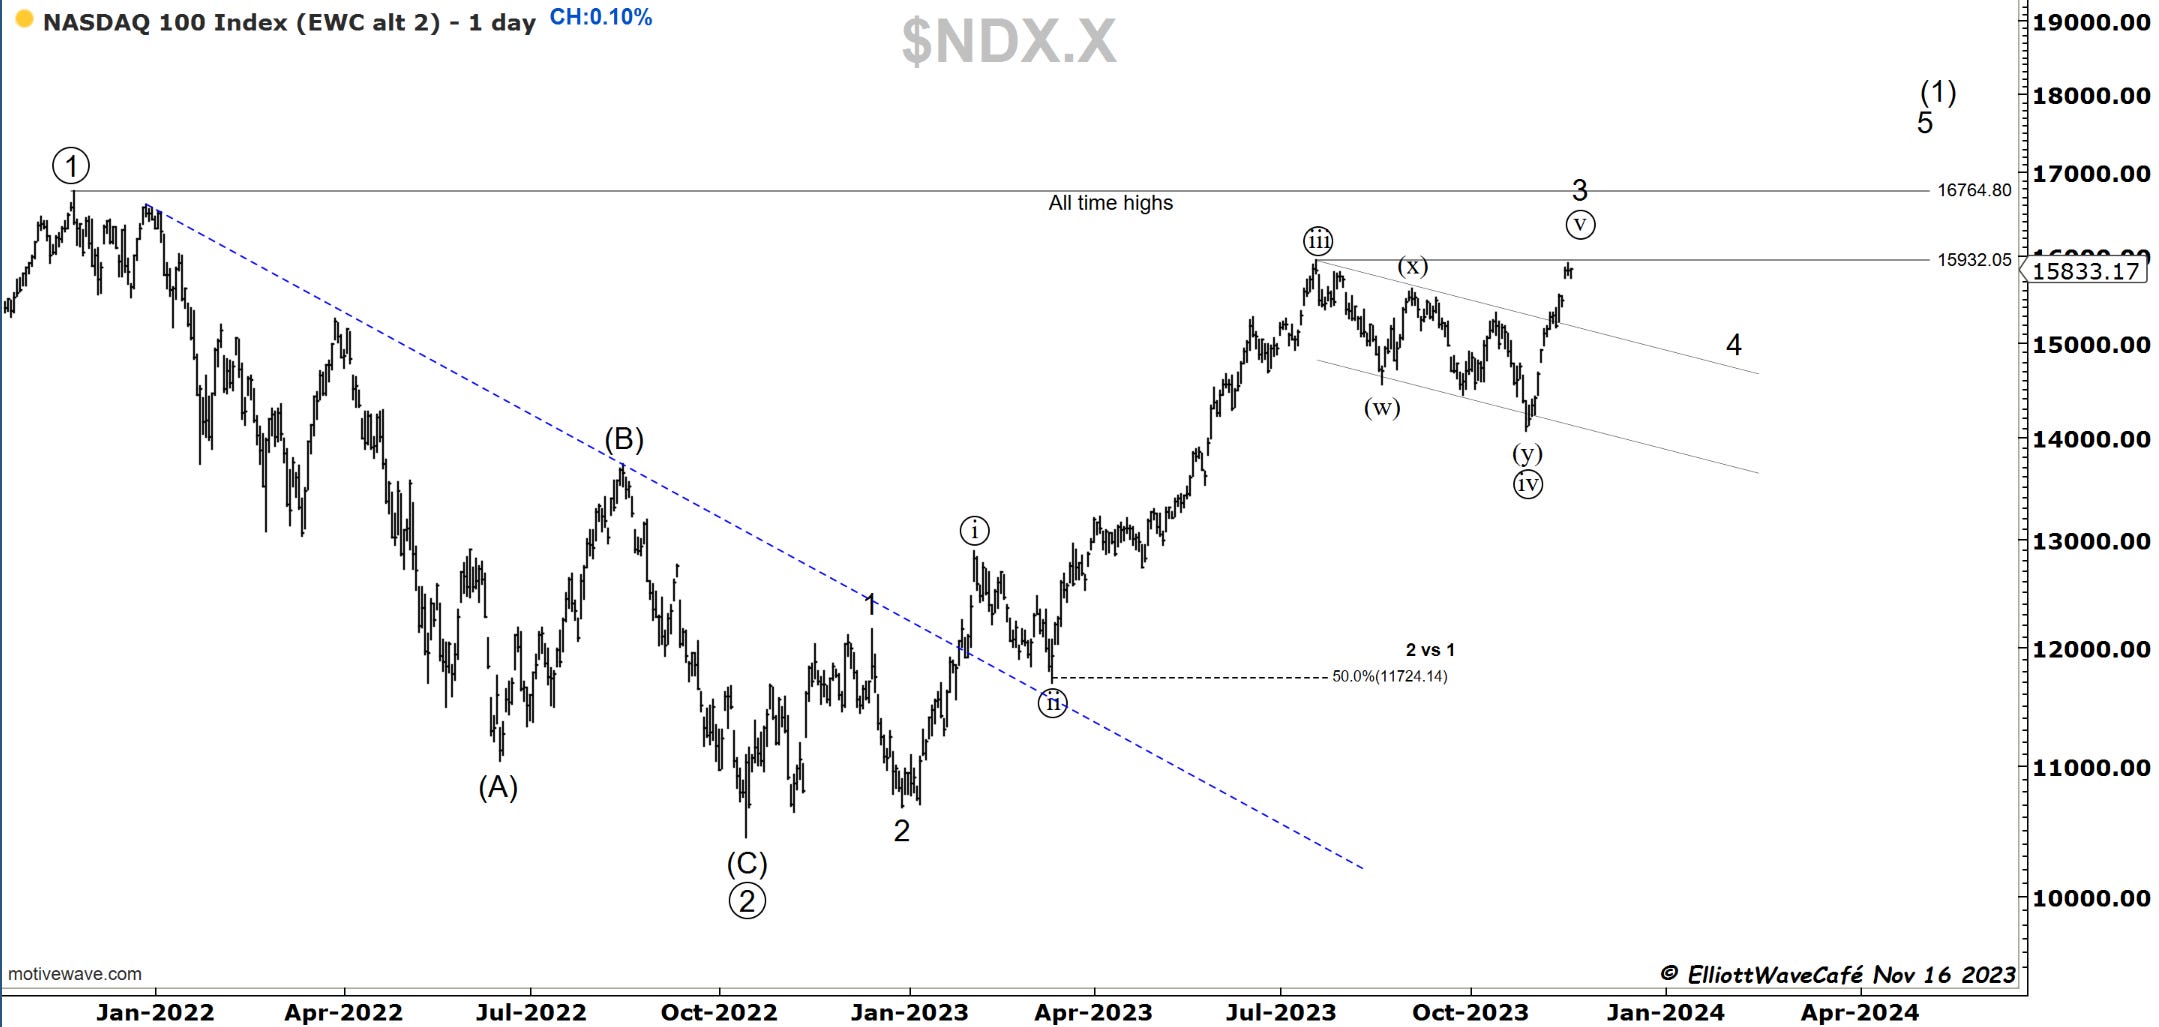
Below you can still see the original idea for a wave (ii) of ((v)) pullback.
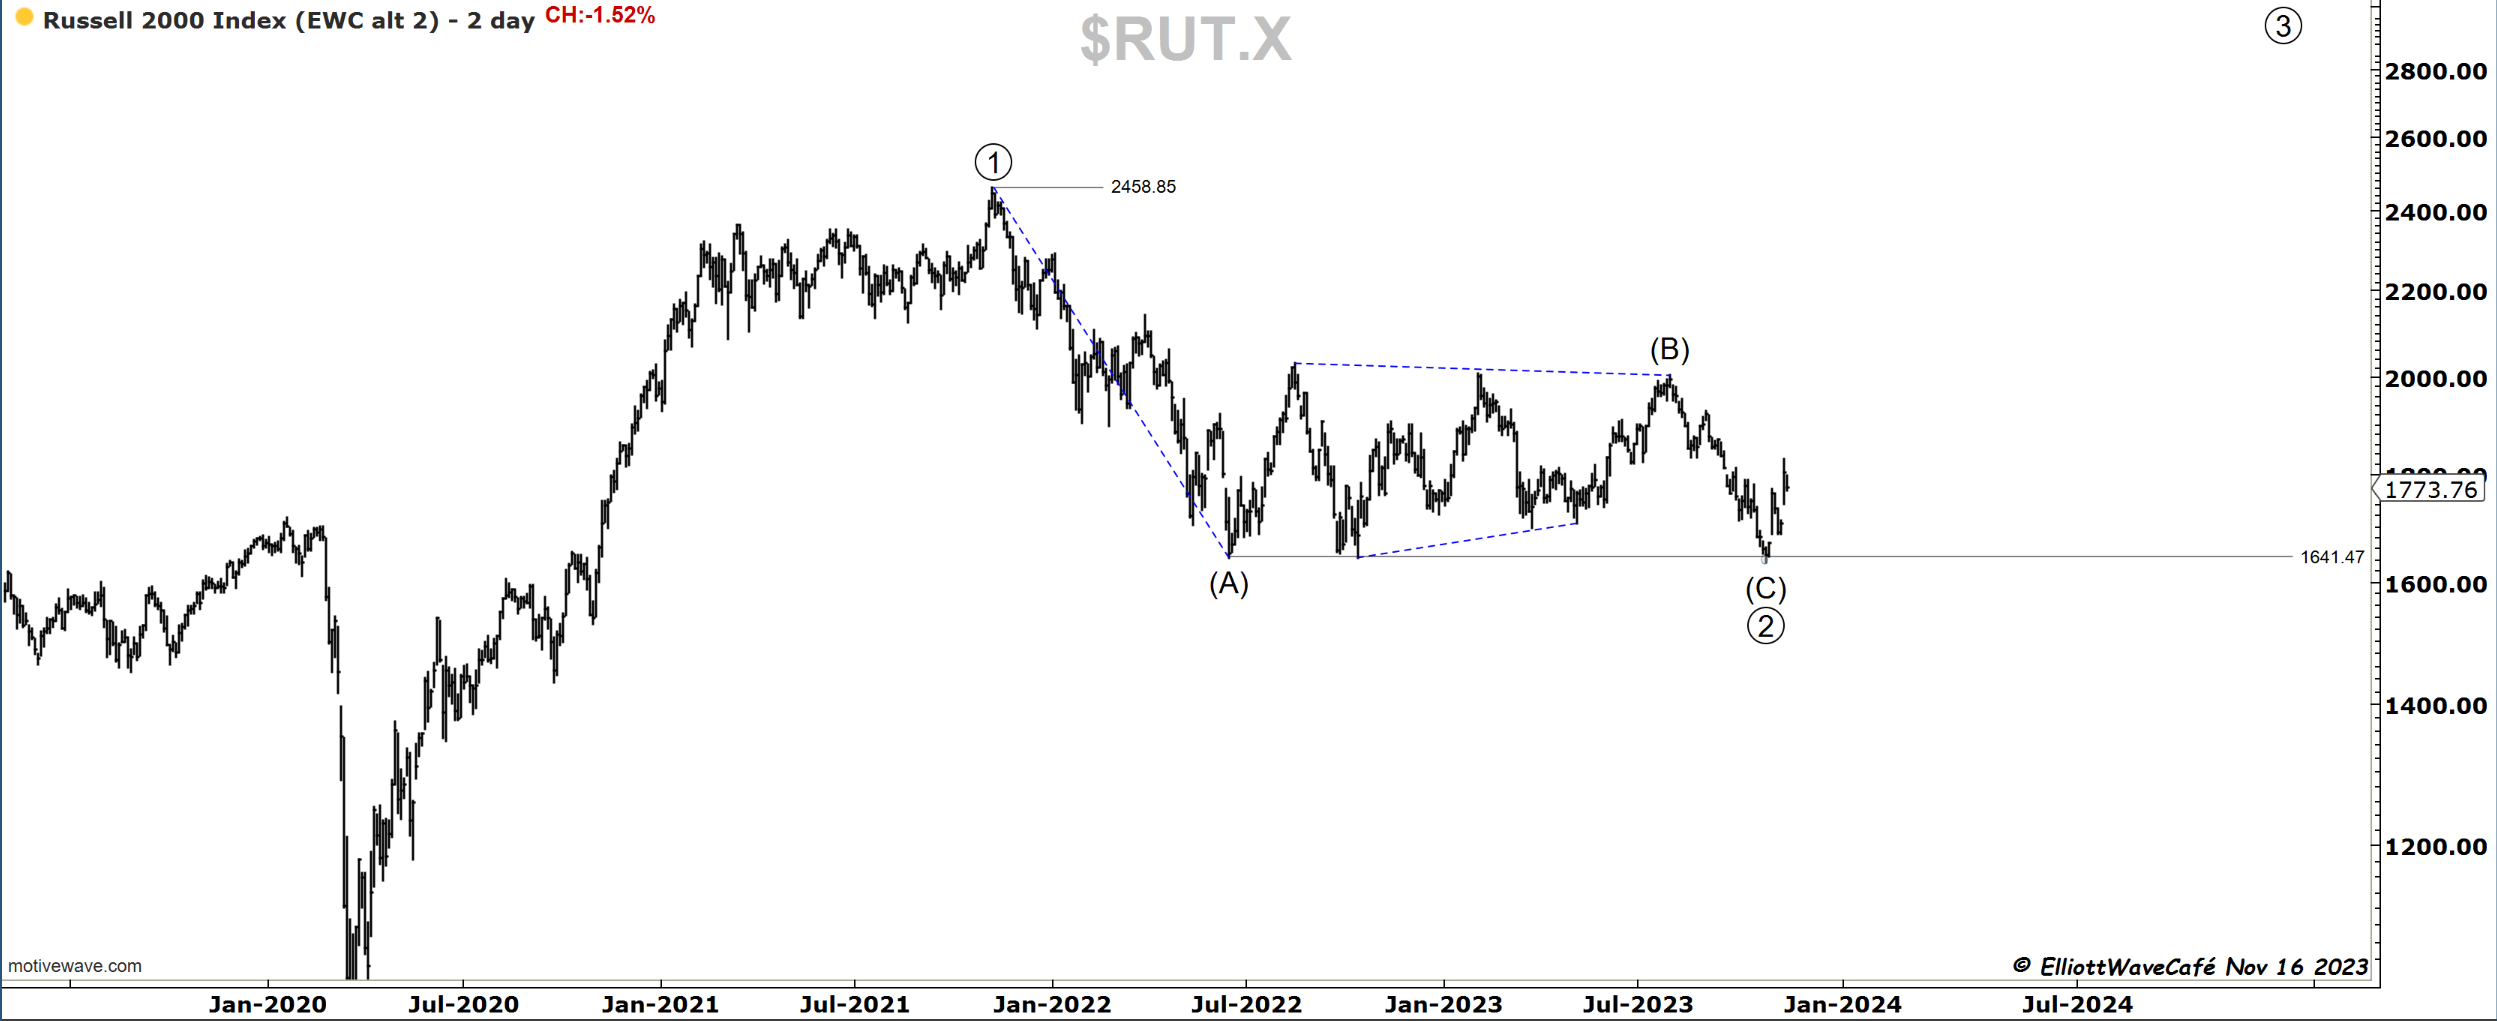
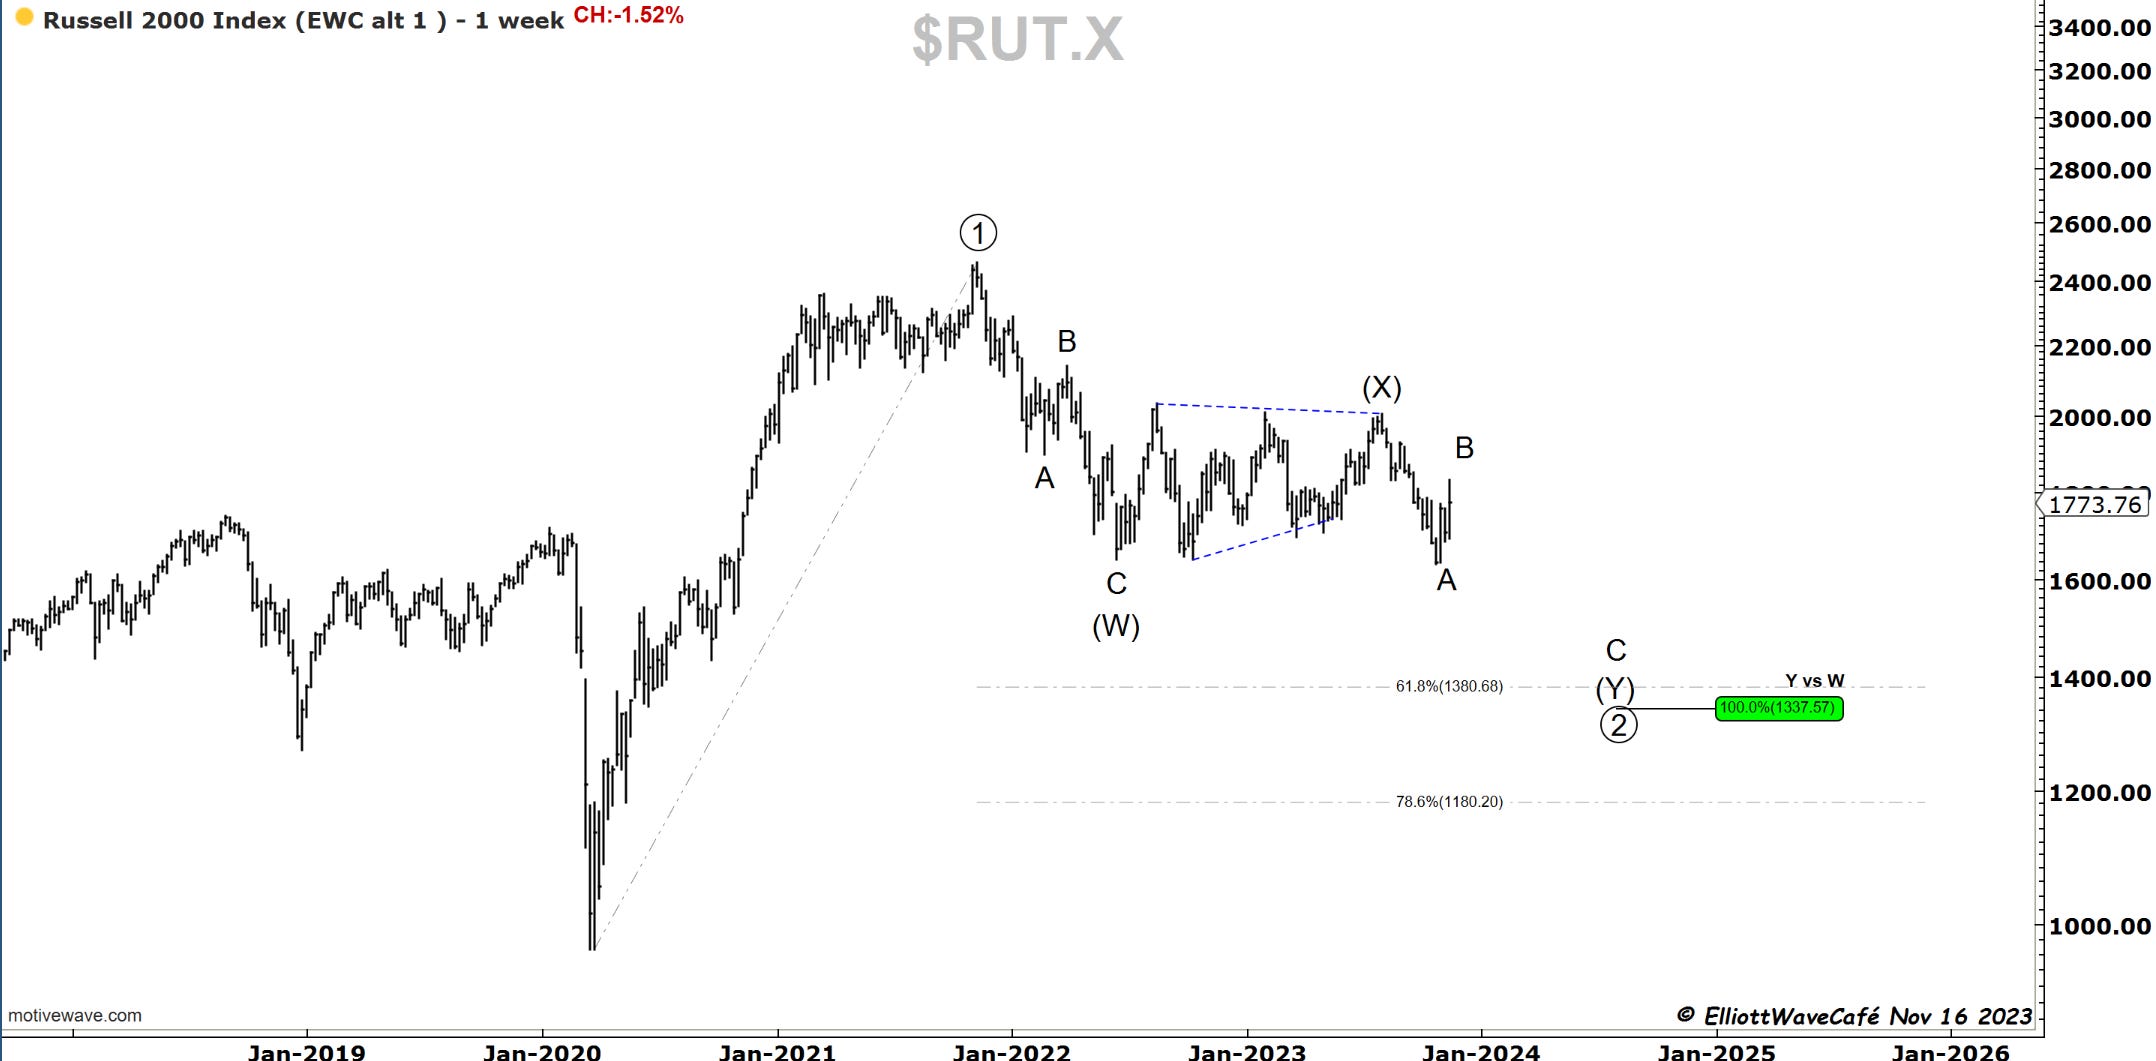
RUSSELL 2000
Two simple charts here on small caps. First one with a completed wave ((2)) followed by a possible 1,2 1,2 from Oct lows. Notice waves (C) and (A) quite disproportionate. Not looking great but the required drop below (A) was satisfied.
This chart shows what proportionality would look like if waves (Y) and (W) were equal. That will arrive at nearly 1400 in the Russell at a 61.8% confluence. In this scenario, the current 3-wave rally in B would make sense.

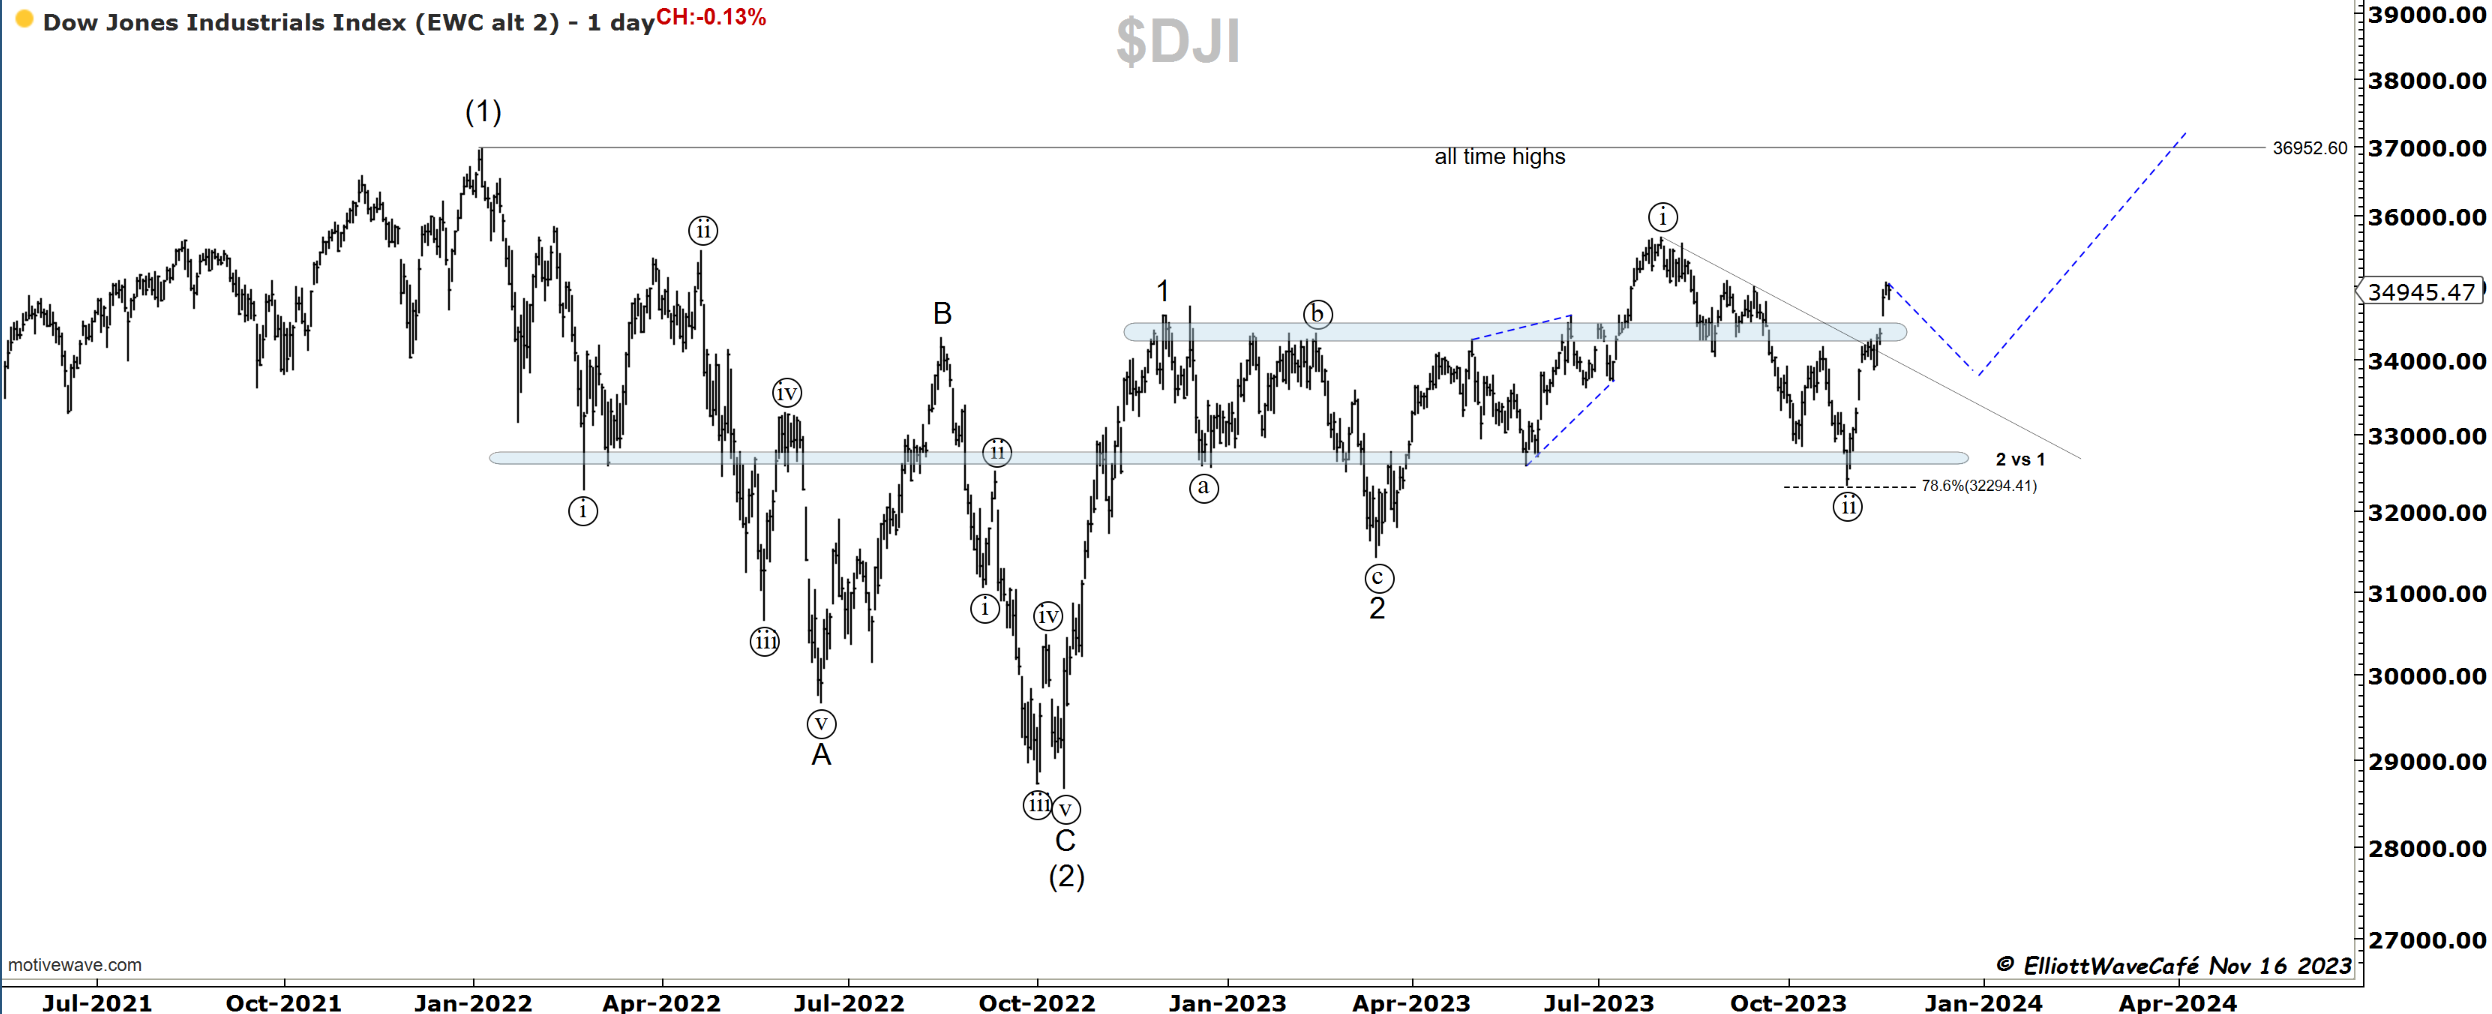
Dow30
My base bullish count on the Dow. It needs a setback to recharge for a larger explosion higher.
I will be discussing the bearish version in today’s video.
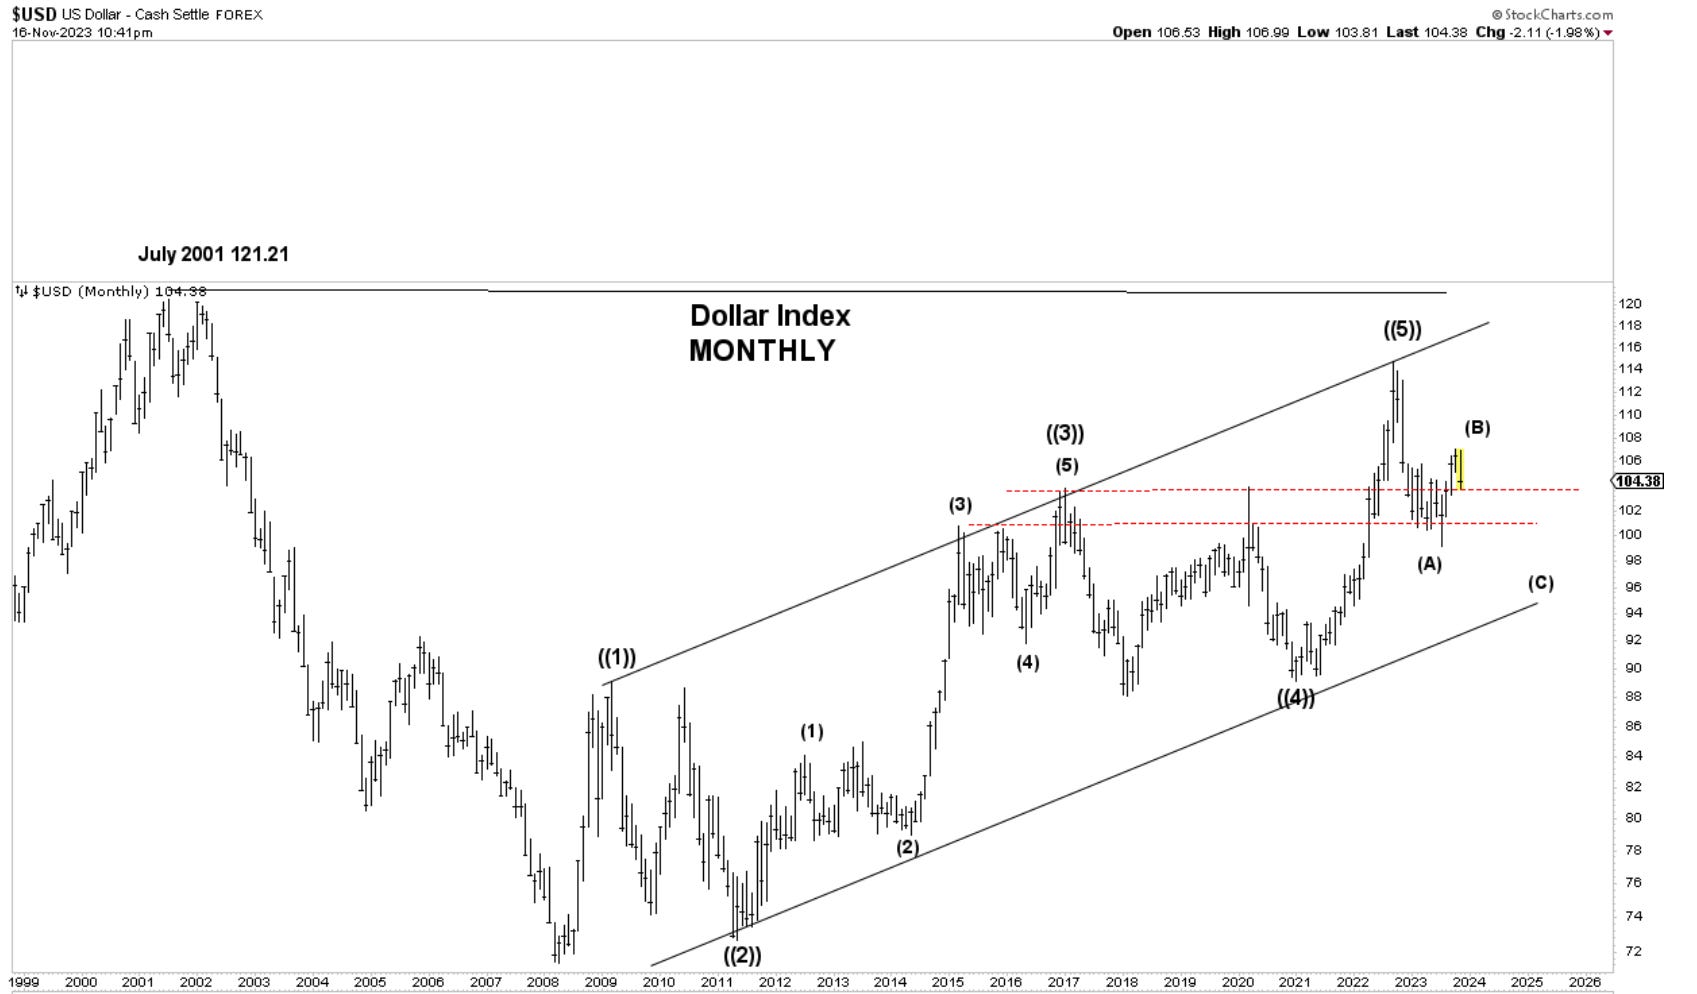
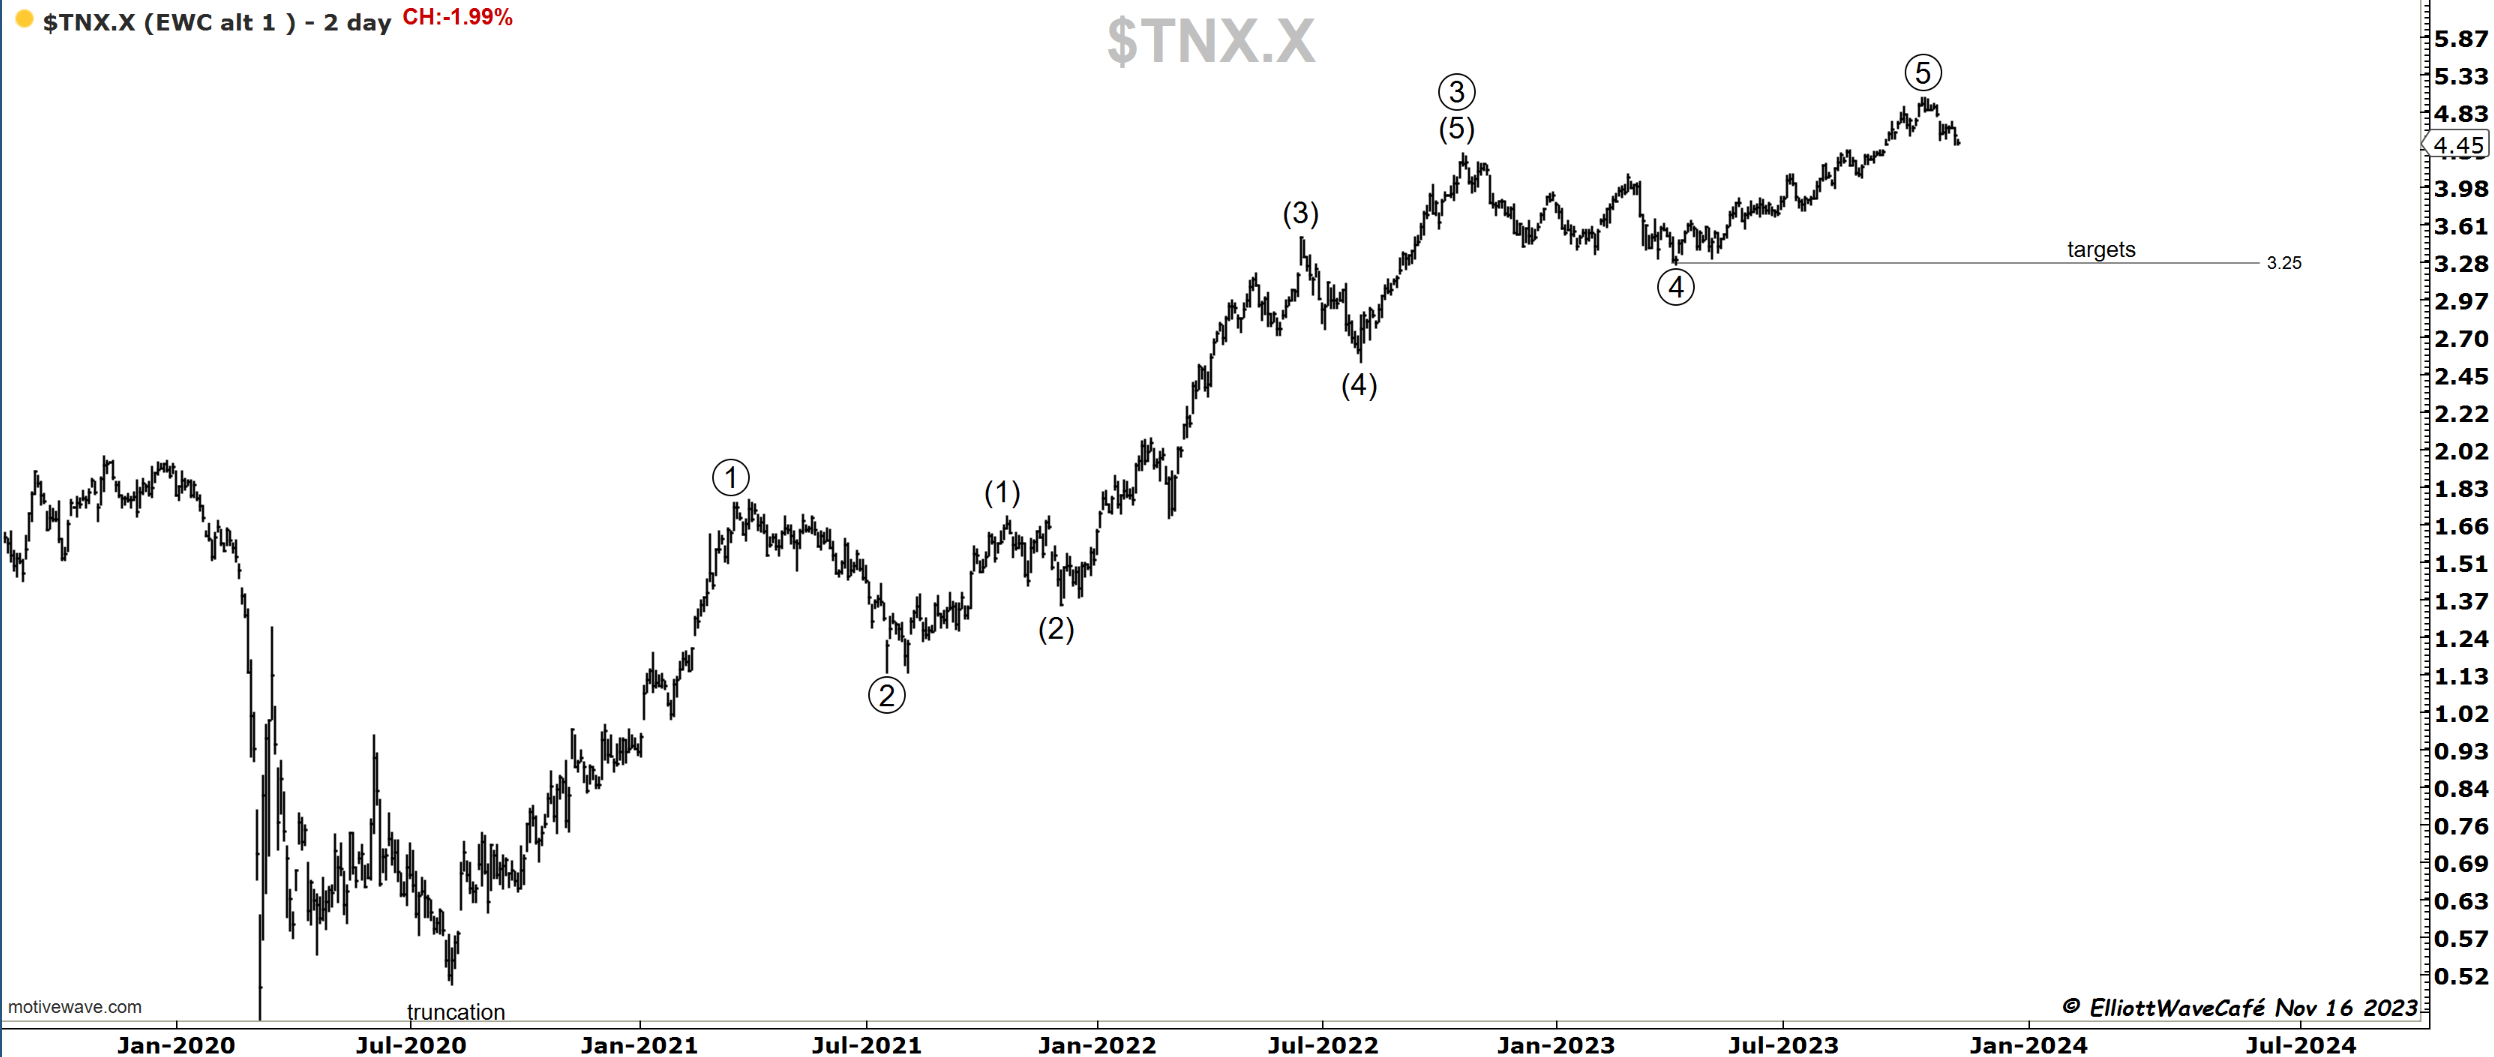
US Dollar and Yields
I will give you my monthly DXY count. If we have a 5-wave sequence completed, the next move lower should be a correction. We need to remember that this asset does not trend on a larger time frame, but goes through cycles. So it’s not fair to be applying trending EW to this chart. We will go with an (A) (B) (C) from the 2022 top and improve from there. That (B) wave cannot be secured until we break the (A) wave low.
Pending any explosion on further CPI or a Fed that’s stubborn into raising rates, this cycle might be completed. A target of 3.25% for the 10-year yields becomes obvious.
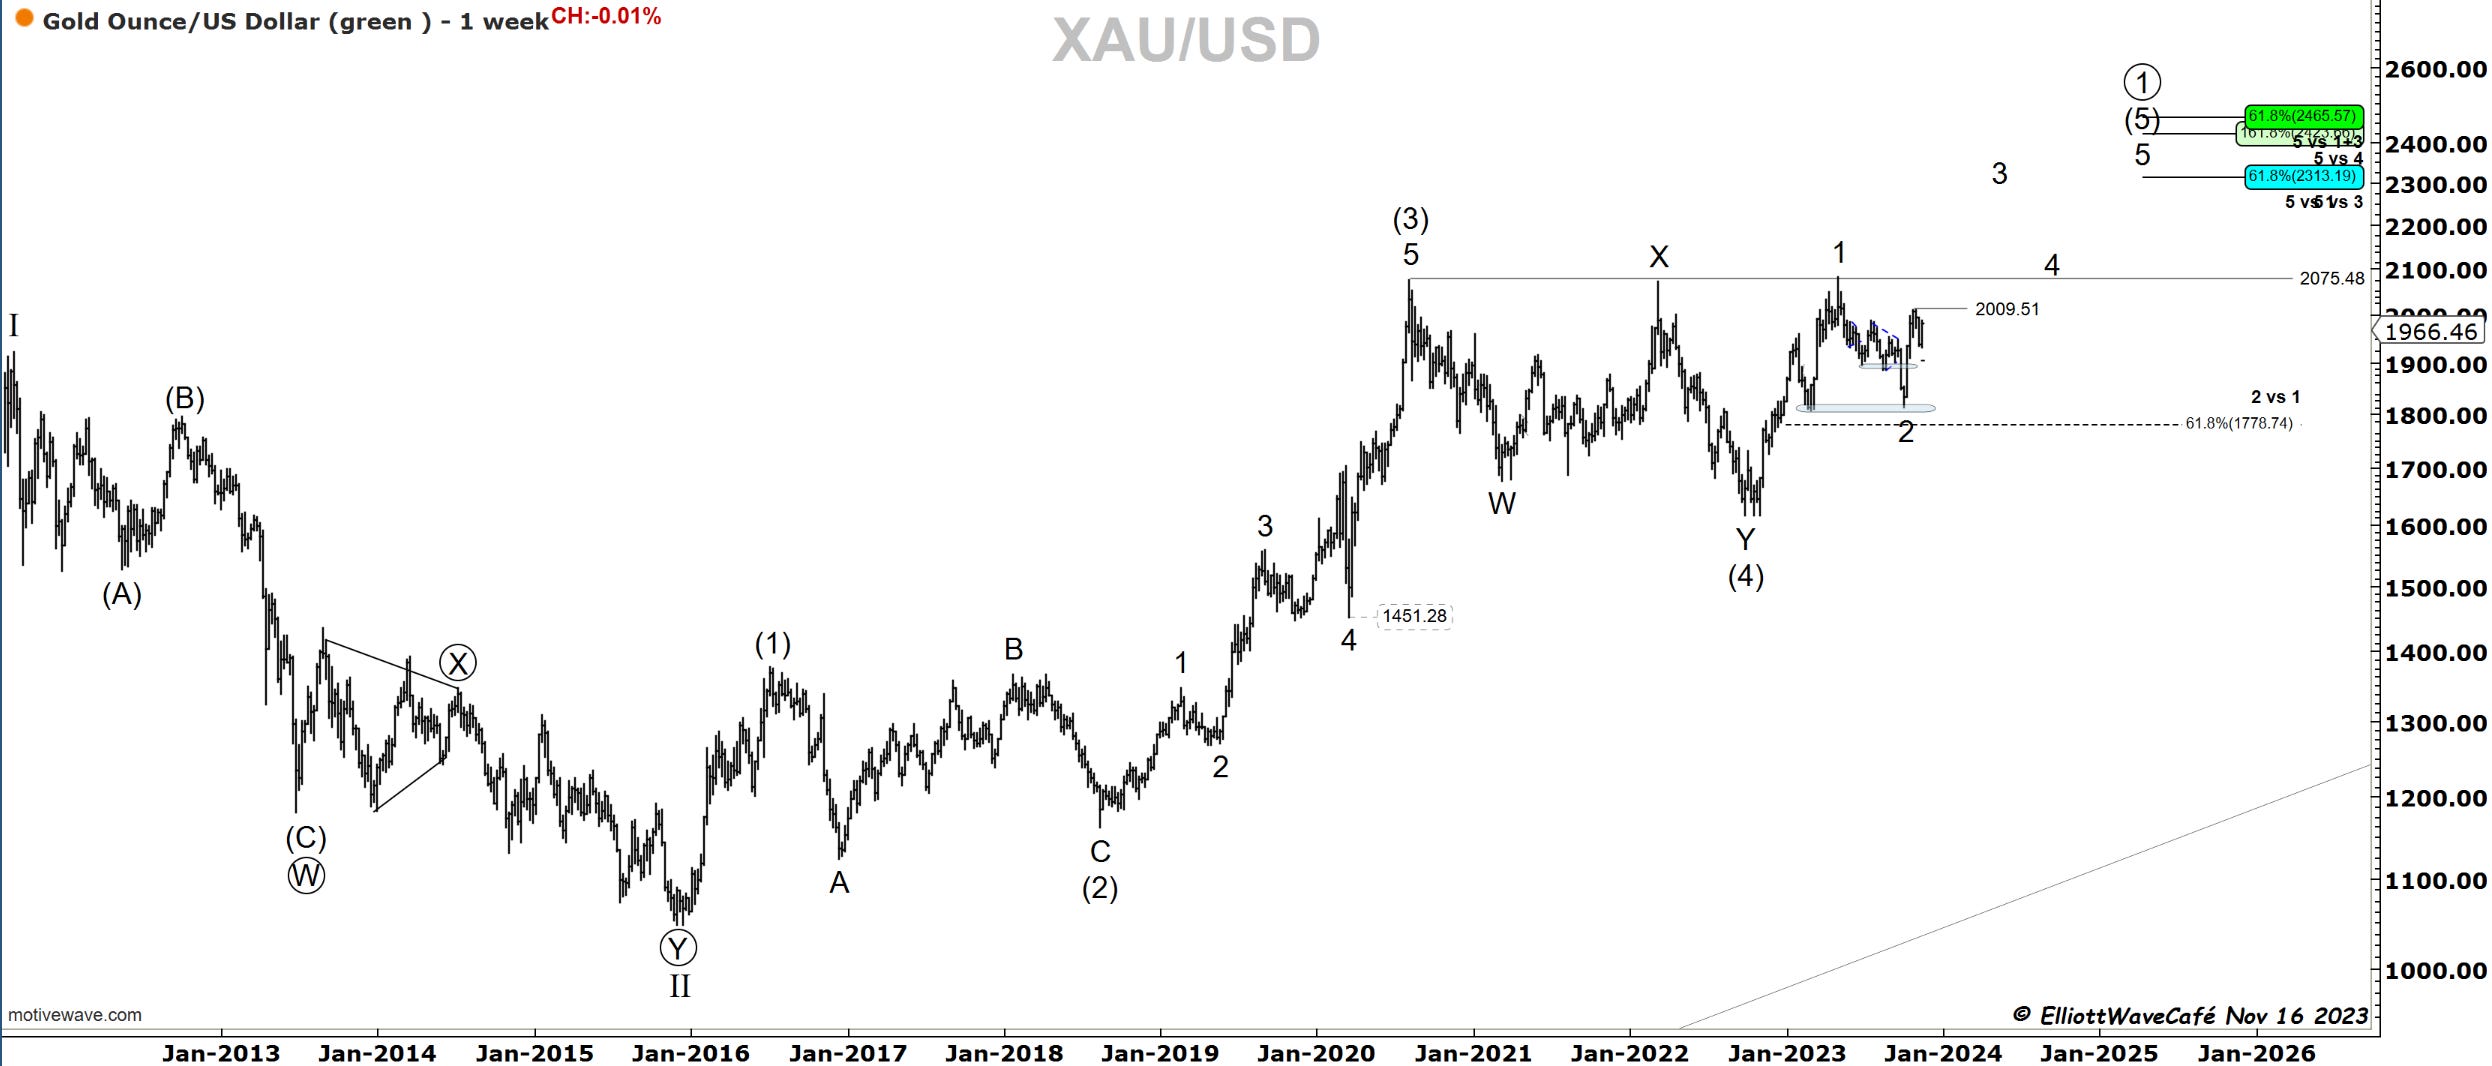
Gold
Gold on weeklies. From previous posts, you can dig down to lower time frames, where we’re looking at initial moves of a larger wave 3. Gold targets at least 2500 under these conditions.
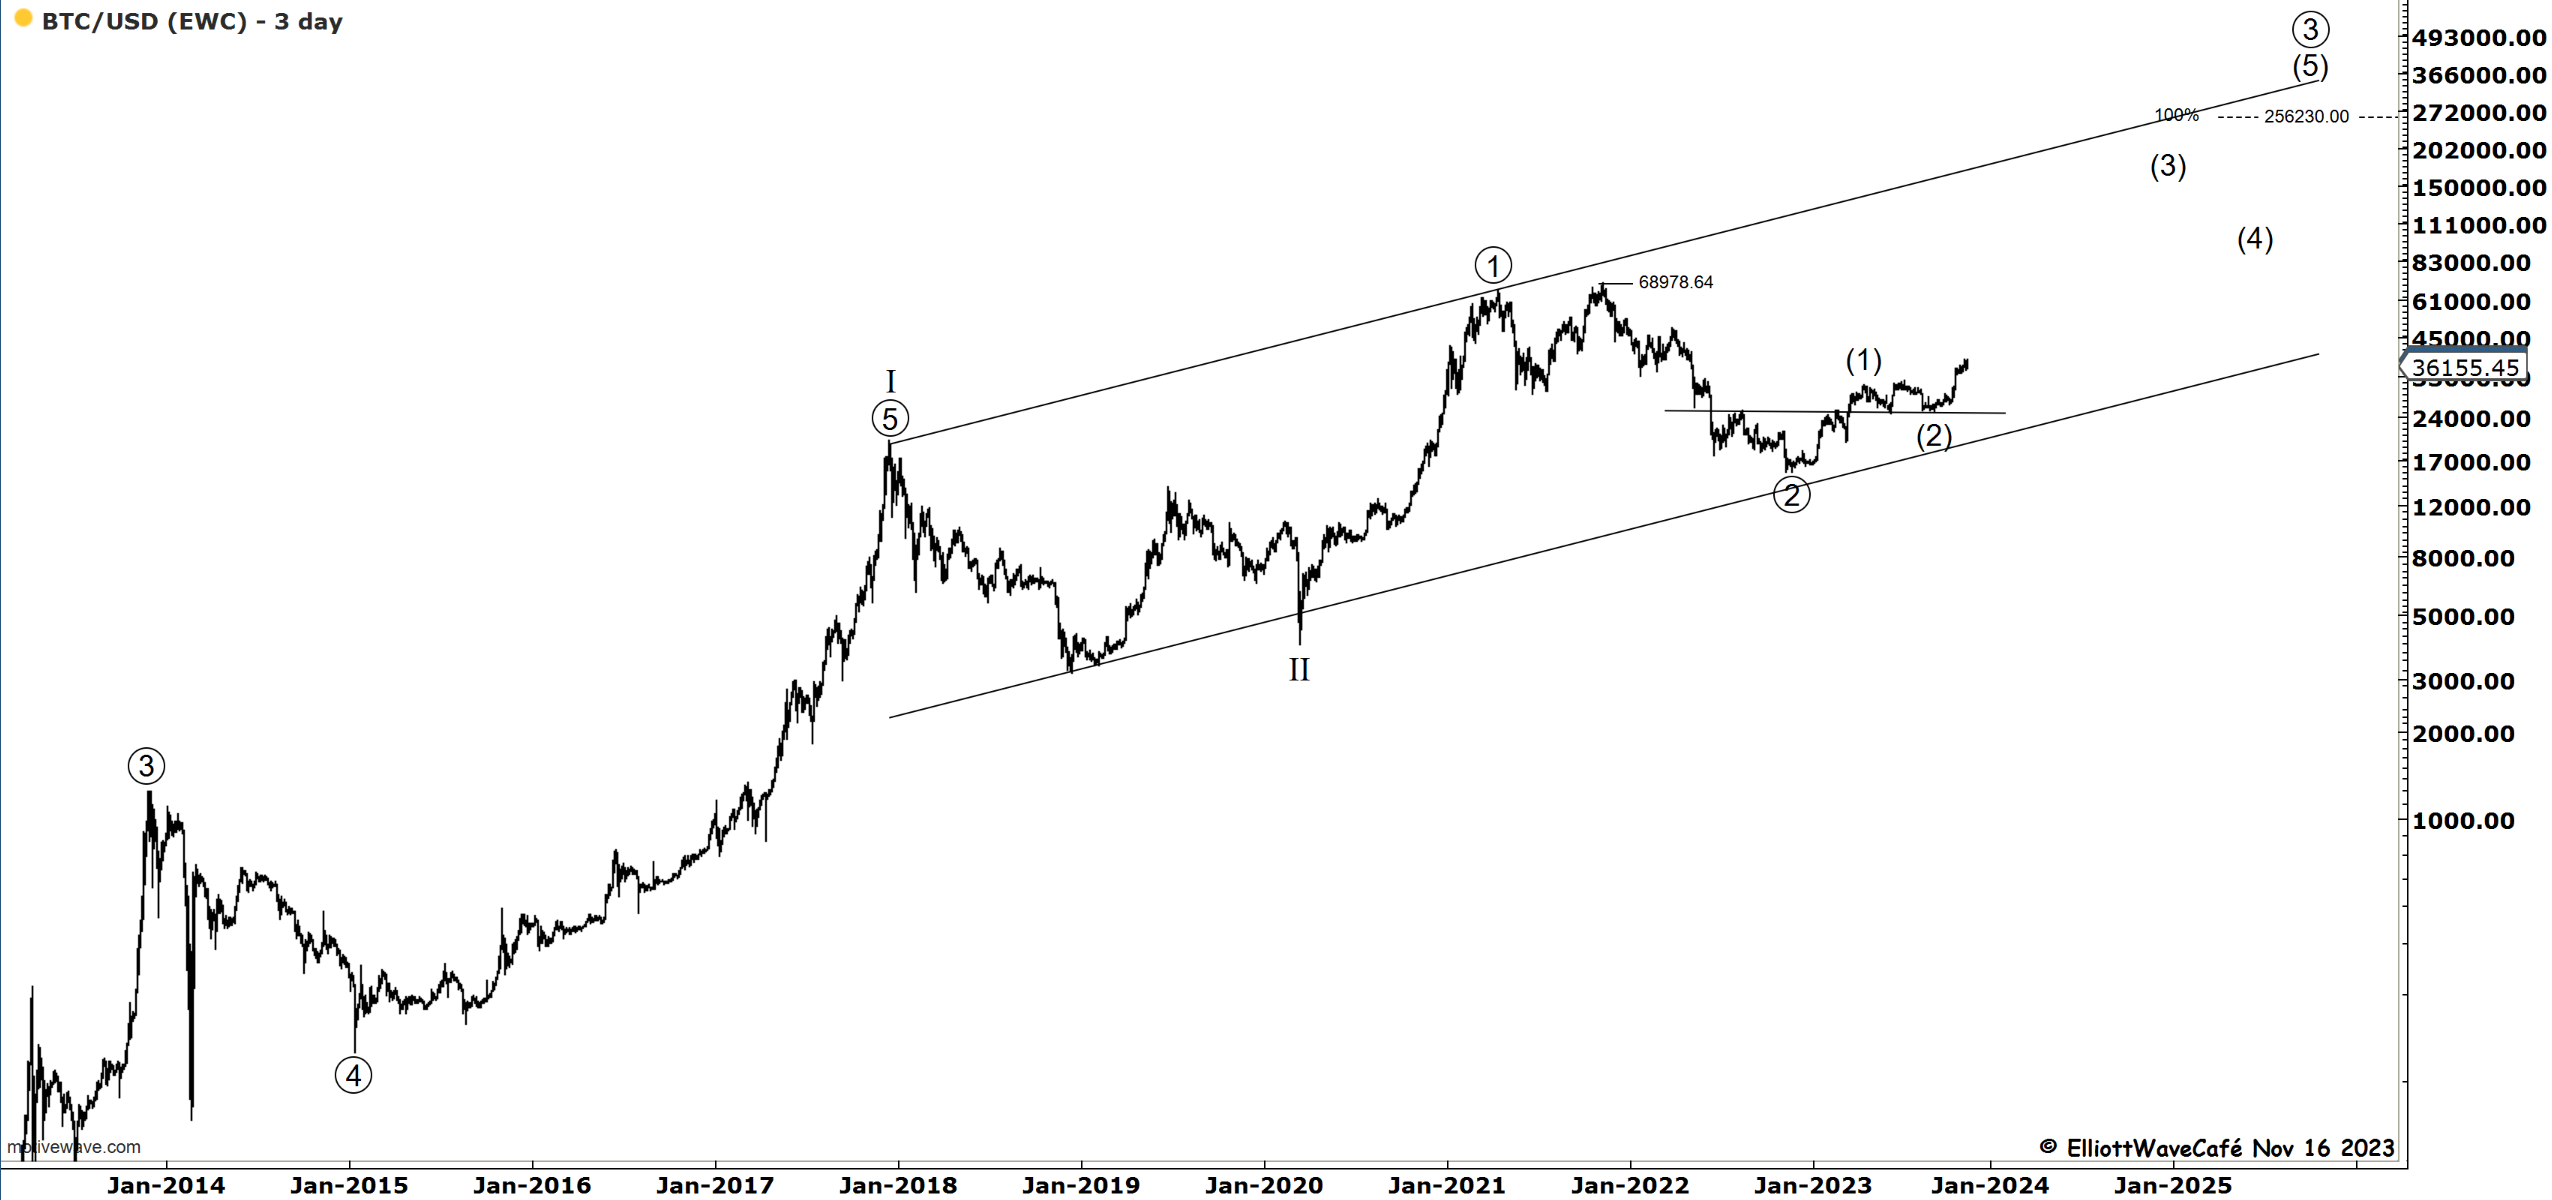
Bitcoin
Not showing often the longer-term count but here it is. Wave ((3)) would reach equality with wave ((1)) at $256.230. The smaller degree counts stand as discussed in previous posts. There are slight variations that can be made to the I II and ((1)) ((2)), but would not significantly change the picture.
Daily video coming up next for members,
Have a great weekend wherever you are! - trade well, and don’t forget to subscribe and drop a like if this letter helps you in any way.
Cris
email: ewcafe@pm.me
Whats the subscribers prices? Inbox me plz.