
The Daily Drip
Markets review, strategy and analysis
Note: The EW counts on the right edge are real-time, and they are prone to adjustments as price action develops. Elliott Wave has a fluid approach, is evidence-based, and requires constant monitoring of certain thresholds.
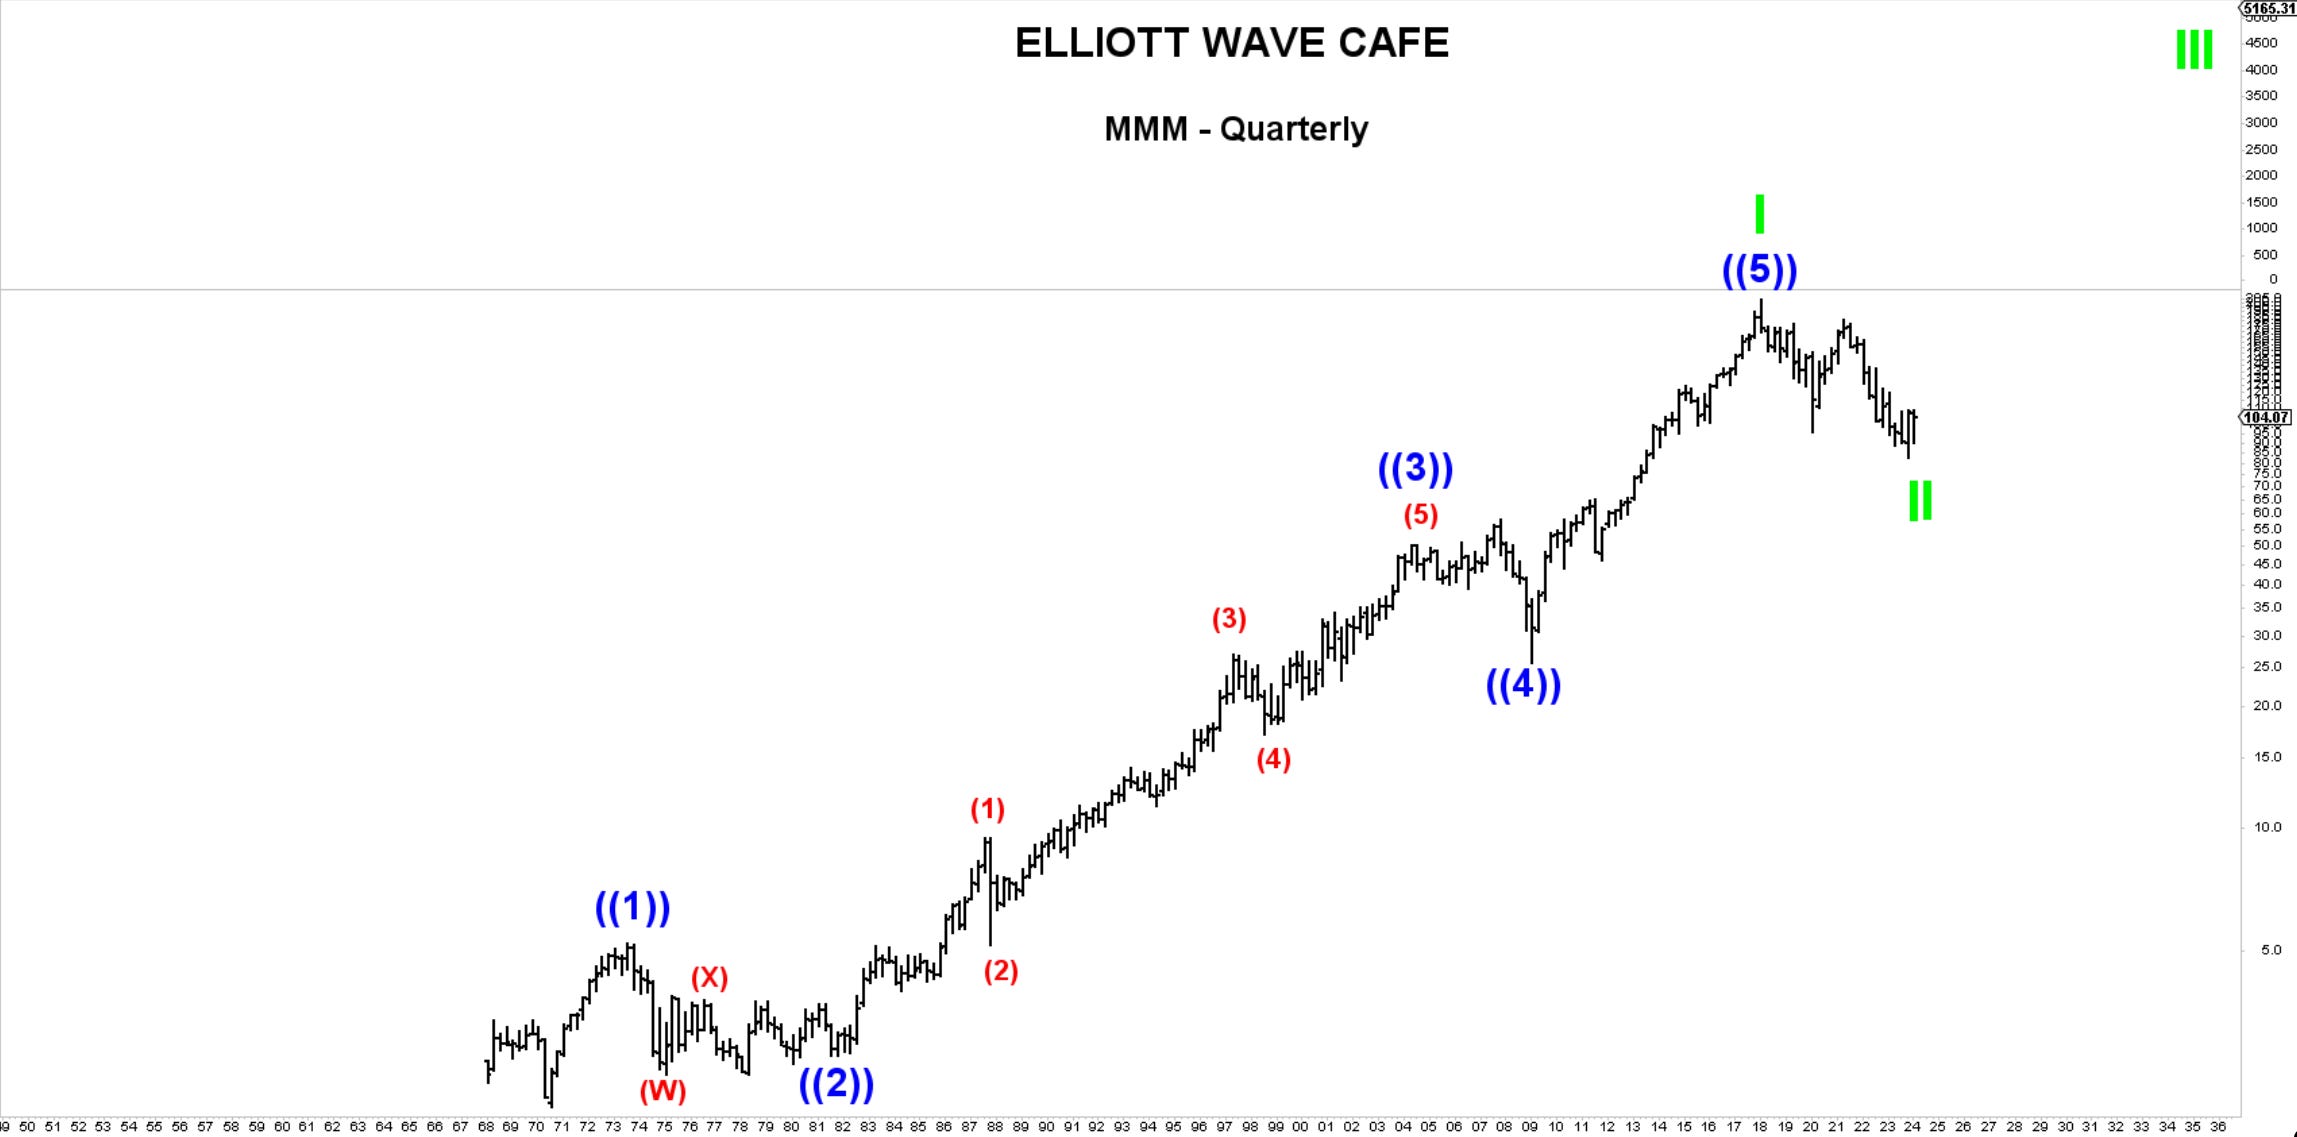
In the counts below, this (( )) = circle on chart
Chart of the Day—MMM—A rare display and analysis of a quarterly chart shows the beautiful wave sequences in this stock. Wave ((2)) is also quite rare (w) (x) and triangle in (y). Since we have a log scale and this stock has corrected 61.8% arithmetic from its low in the 1970s, I am labeling the current decline as wave cycle II. This should be followed by the next wave higher in III over the years, decades ahead.
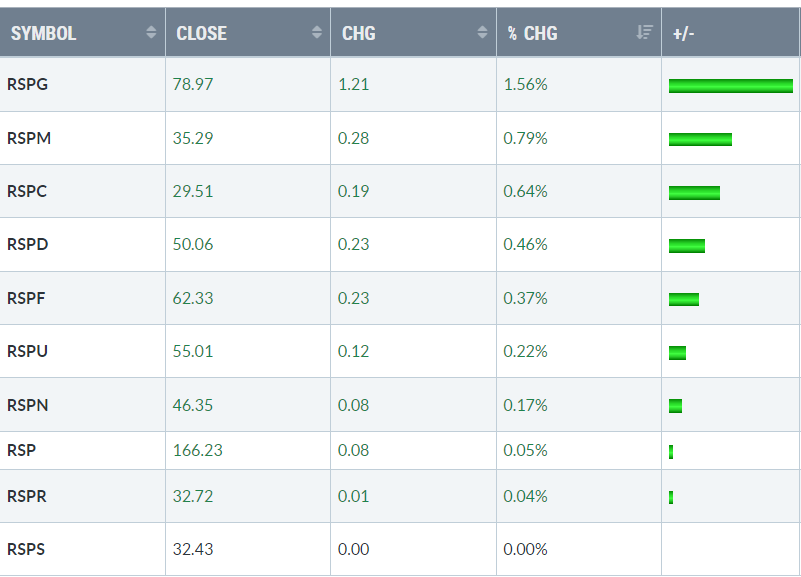
One way to analyze market breadth and participation is to look at the equal-weighted sectors and see how they behave in comparison with the tech, financial, and healthcare-heavy SP500. Today, 9 out of 11 sectors have outperformed the RSP (ew sp500).
In yesterday’s written note, I presented multiple Fibonacci projections in the core markets we follow and identified clusters of zones that are more likely to attract prices.
In the video, we discussed core trends and reactions after the CPI, 120-year charts in DOW and SP500, and a Review of fib projections and targets.
I have also sent out a quick PayPal note with charts here.
In today’s video, I will review TSLA, PYPL, and MMM charts from an Elliott wave perspective and examine the complex corrections.
The note below will continue with coverage of core markets on smaller time frames, Bitcoin behavior, and actionable levels for trades.
A free trial will get you 7-day access!
