
The Daily Drip
Core markets charts updates and commentary
Note: The counts on the right edge are real-time, and they are prone to adjustments as price action develops. Elliott Wave has a fluid approach, is evidence-based, and requires constant monitoring of certain thresholds.
In the counts below, this (( )) = circle on chart
SP500
A loss of nearly 1% on increasing volume is sending the sp500 below its 150-day MA. A heavy close at these levels requires a day of buying tomorrow if we’re to hold this fib zone throwback.
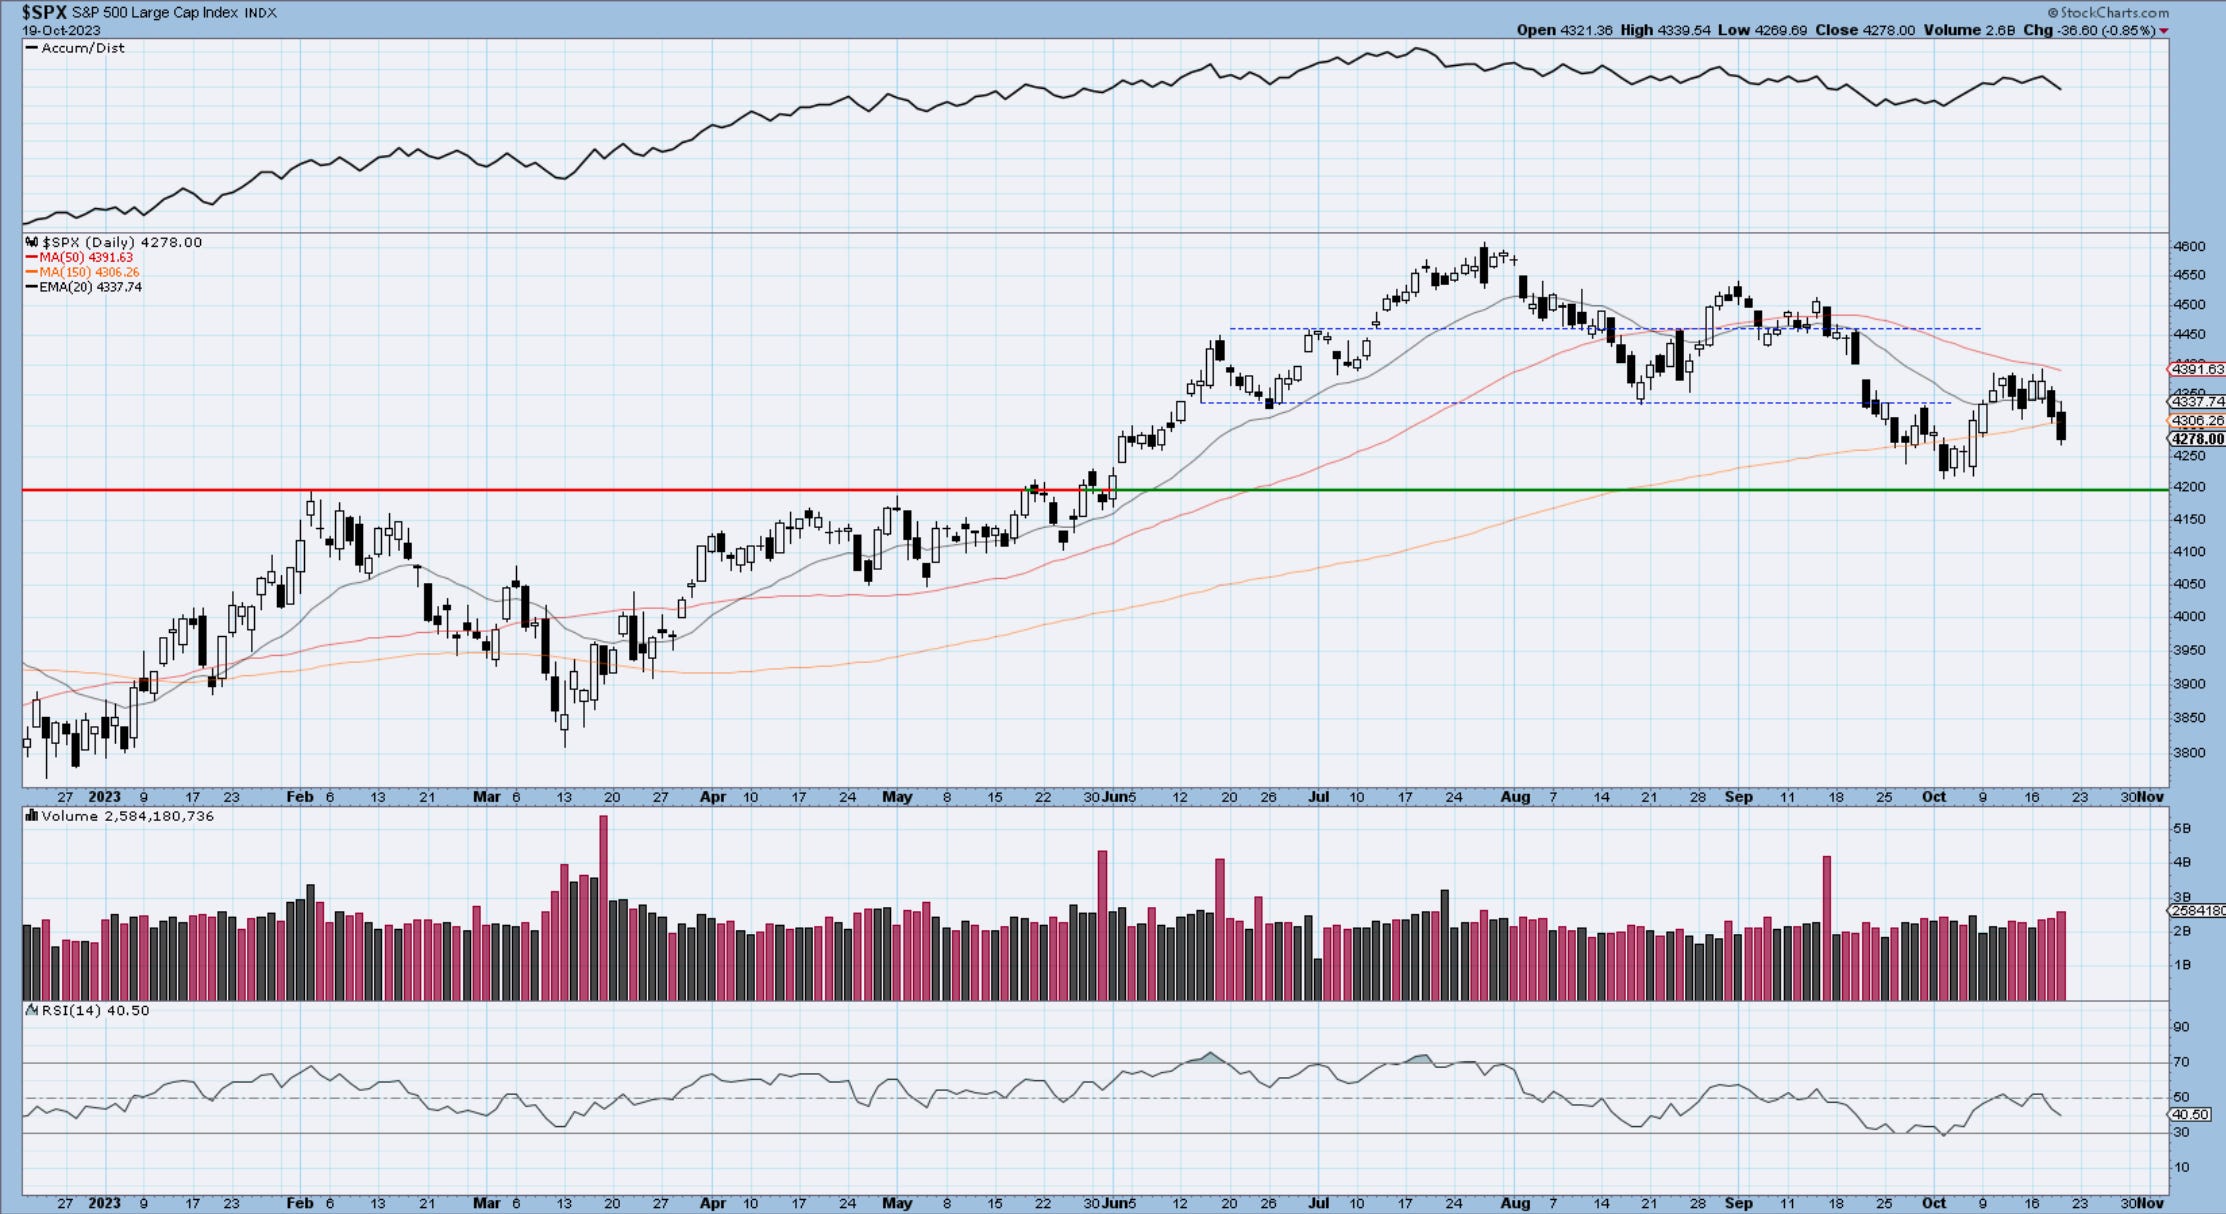
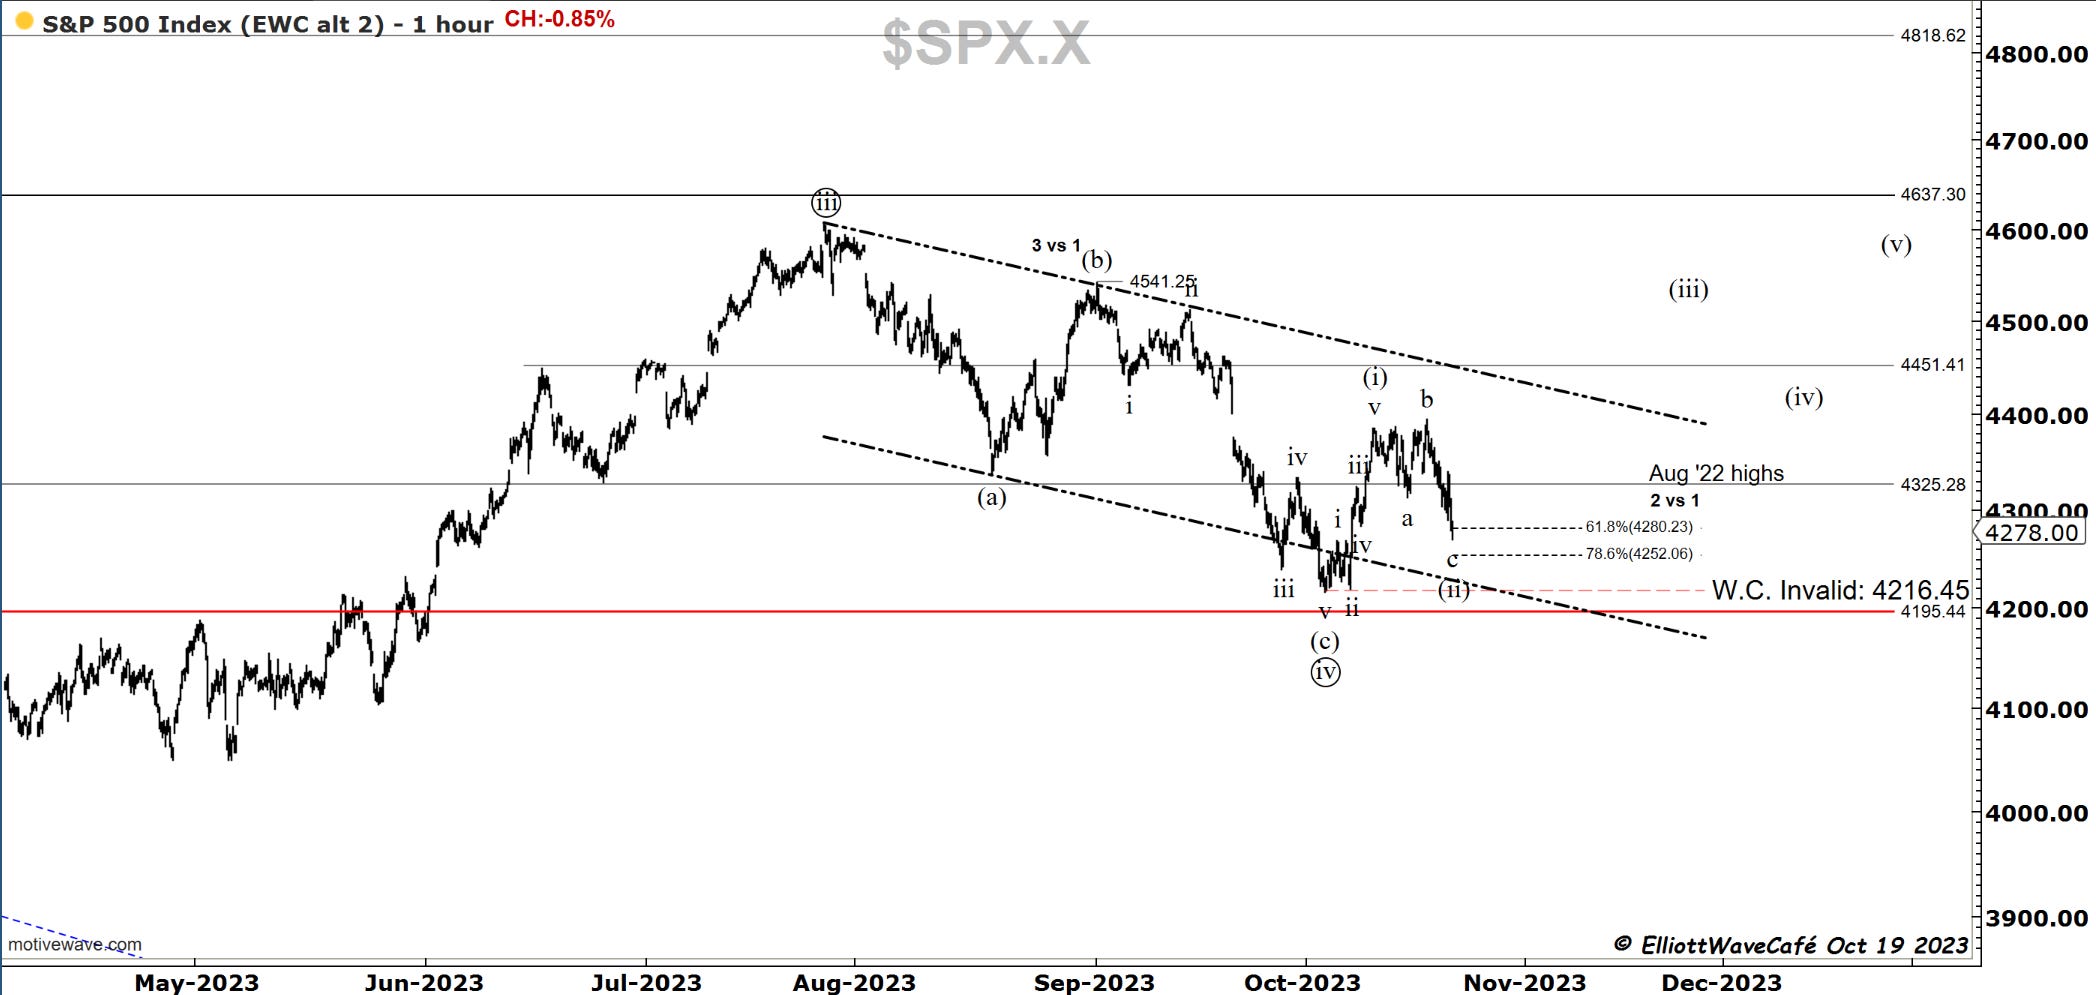
I mentioned 4280 yesterday, we closed at 4278 today. Between here and .786 the Bulls have a decent fighting chance, but they really need to show some presence. The way we closed does not really inspire a whole lot of confidence. With any move below 4216, the pattern from the highs will get skewed toward motive waves instead of corrective, which means an accelerating downside.
If we look at sectors it seems that the communication service held its own but it was basically due to Netflix's 16% up day.
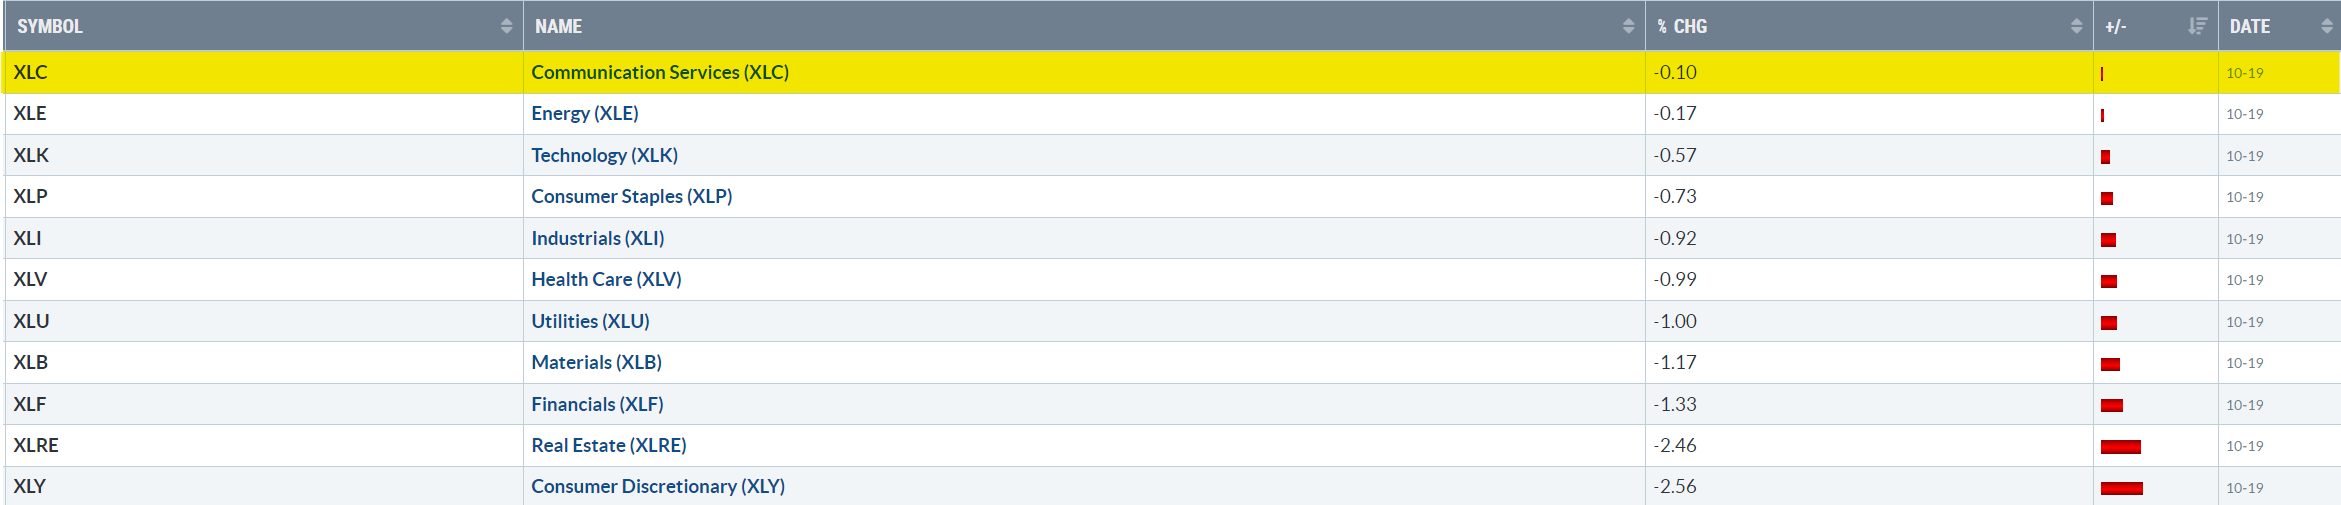
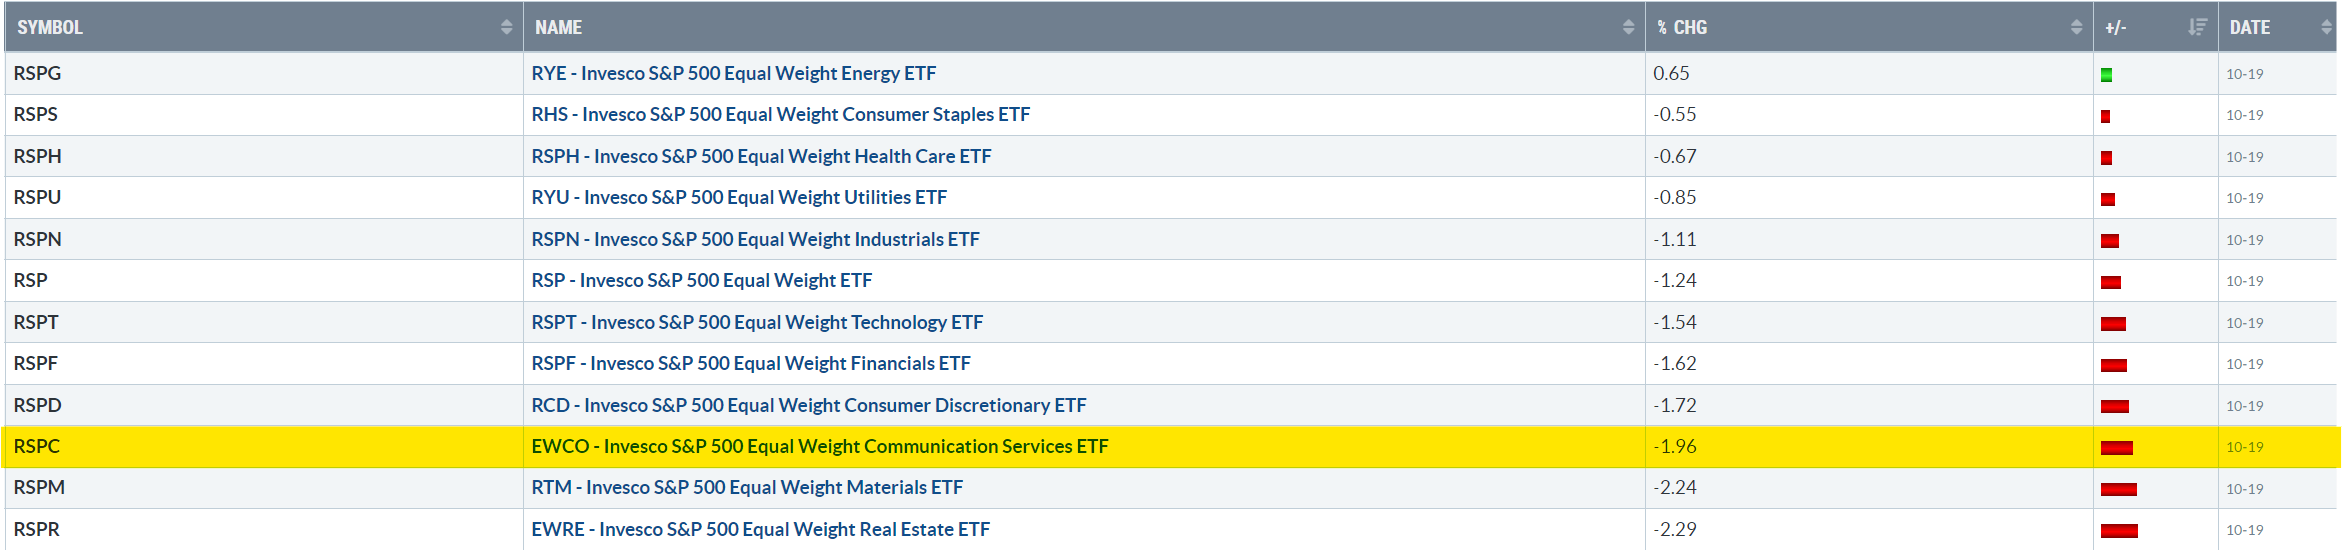
On an equal weight basis communications actually lost nearly 2%, with energy and staples once again on the defensive side.
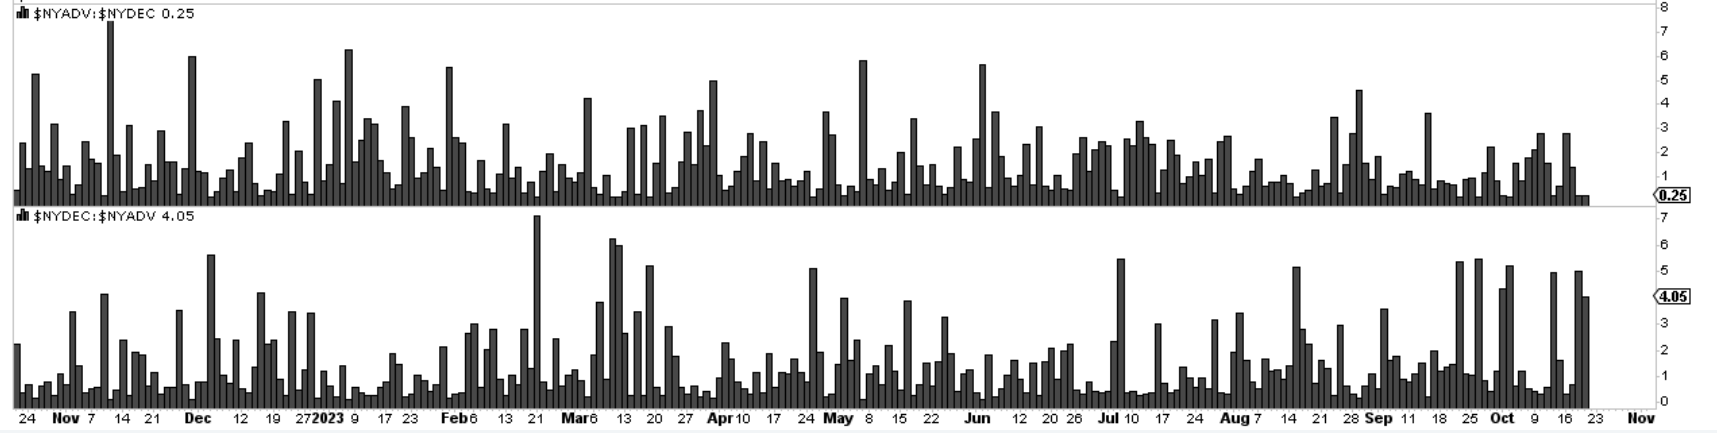
To really drive the point home there were 4 and 5 times as many declining stocks as advances in the last couple of days alone on the NYSE. A heavy market spooked by let’s say interest rates near 5% on the 10yr.
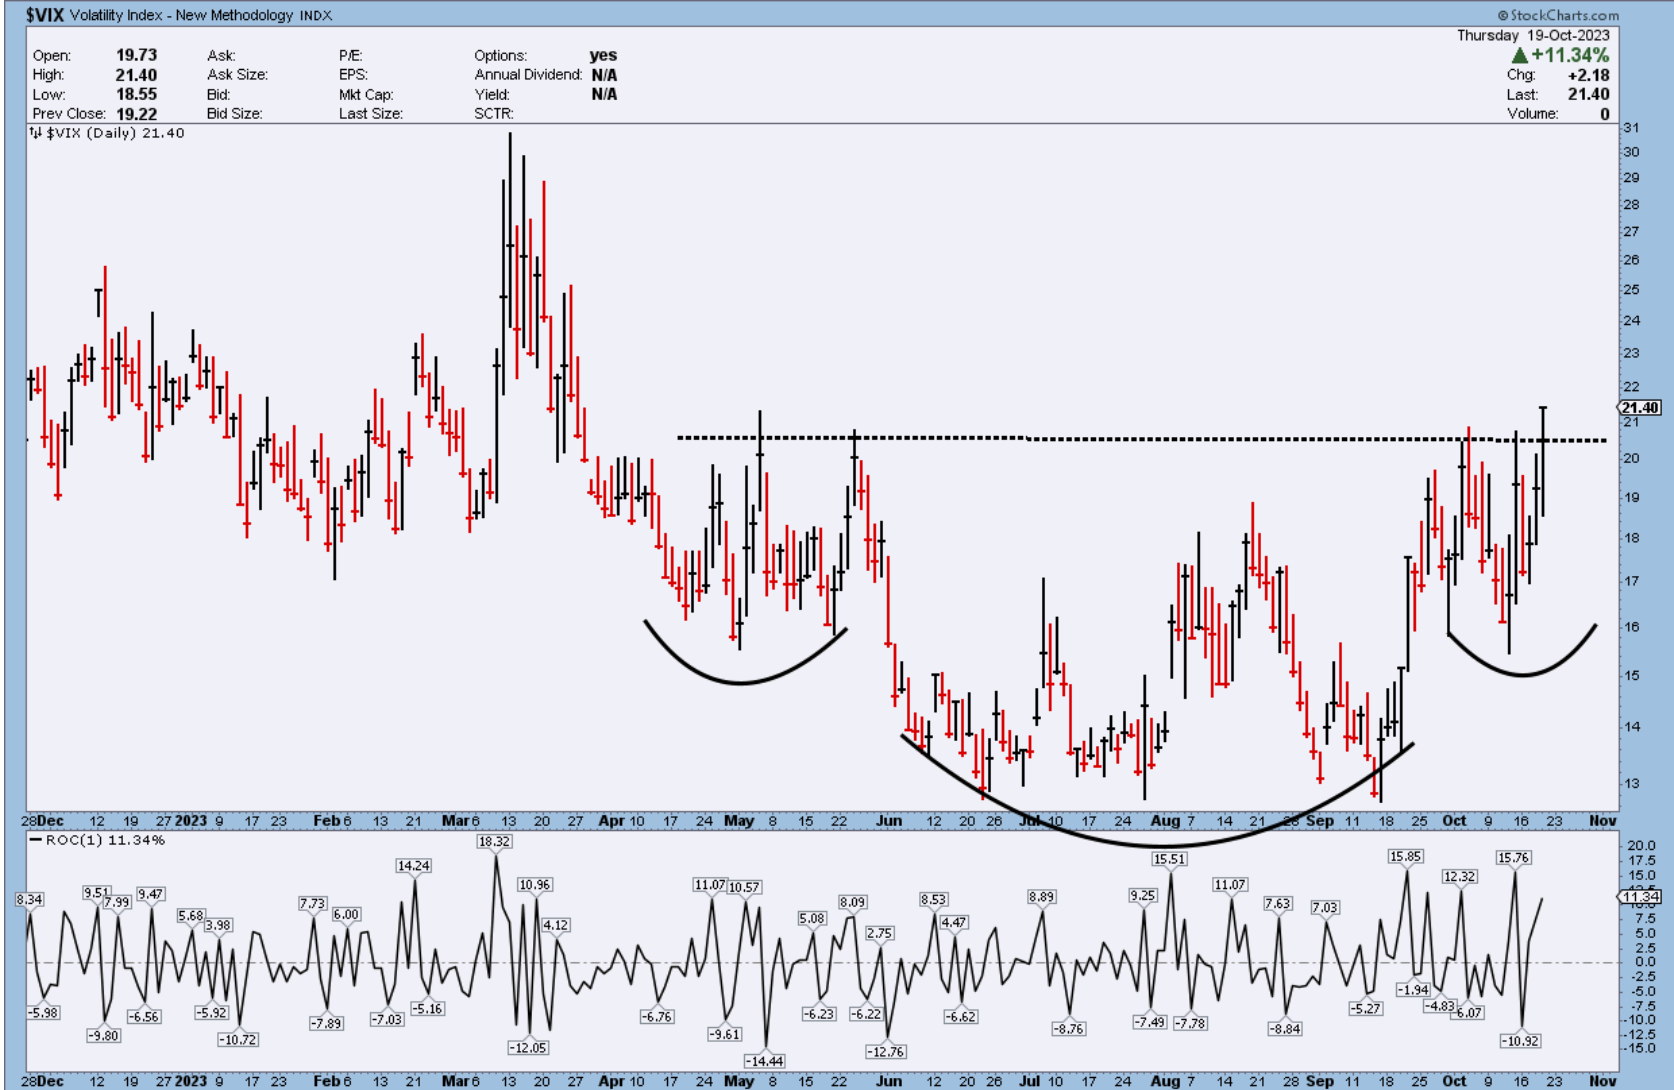
The VIX has the inverted look now with a brief break above the neckline. A basic measurement should send it towards 30 handle. At 30 VIX we can get some wild swings in the market. Next week is historically a bad week for equities so if something bad is to happen it should be from now to the end of next week.
As constructive as I am trying to remain on equities, these are the signals that the market is flashing. It will be a big test if we can hold 4200 in the S&P.
To sum it up, the sentiment has been quite bearish and in Fear territory since about Sept 20th. Next week is a heavy earnings week from the tech sector. It has the potential to be wild. I would reduce exposure or try to hedge with short positions in stocks that flash signs of weakness. I have added a few over the past several days. If we can get 100 handles higher from this market, I think the baton gets passed to the bullish side with conviction. I remain bullish overall but I have my helmet and seatbelt on for turbulence.
Nasdaq100
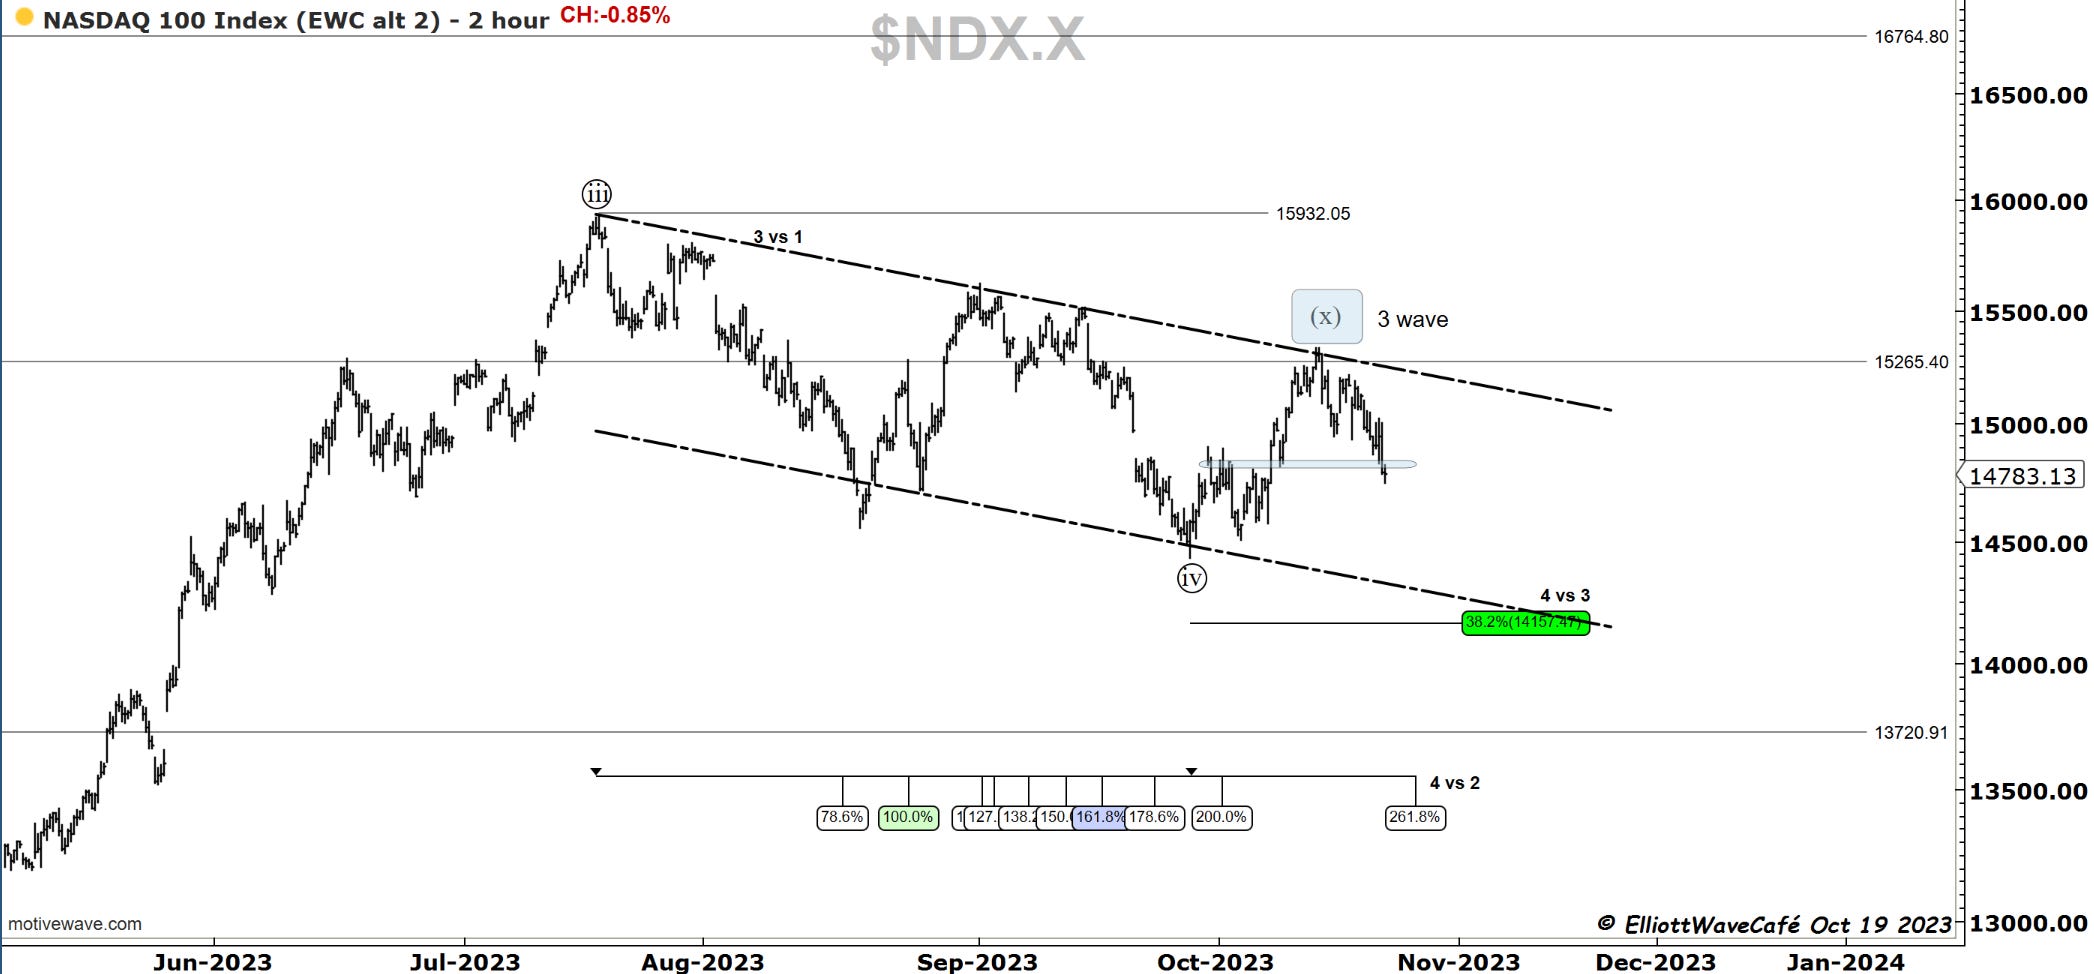
Today’s drop violated the previous attempted count. Elliott Wave guides us now into assuming that the rally from Sept 27th was only a 3-wave move or as depicted an (x) wave. These waves connect two corrective patterns. The first one was completed on Sept 27th, the other is underway. That is what I was talking about yesterday when I mentioned that wave ((iv)) can become more complex and extended. To eliminate this view , the index would need to rally above 15,335 at which point we can start to work with the assumption of a completed correction. It is a constant read of current market conditions and the likely paths.
As I said in the last update, the larger degree remains quite healthy and there is room for this 4th wave to unfold without threatening the larger count.
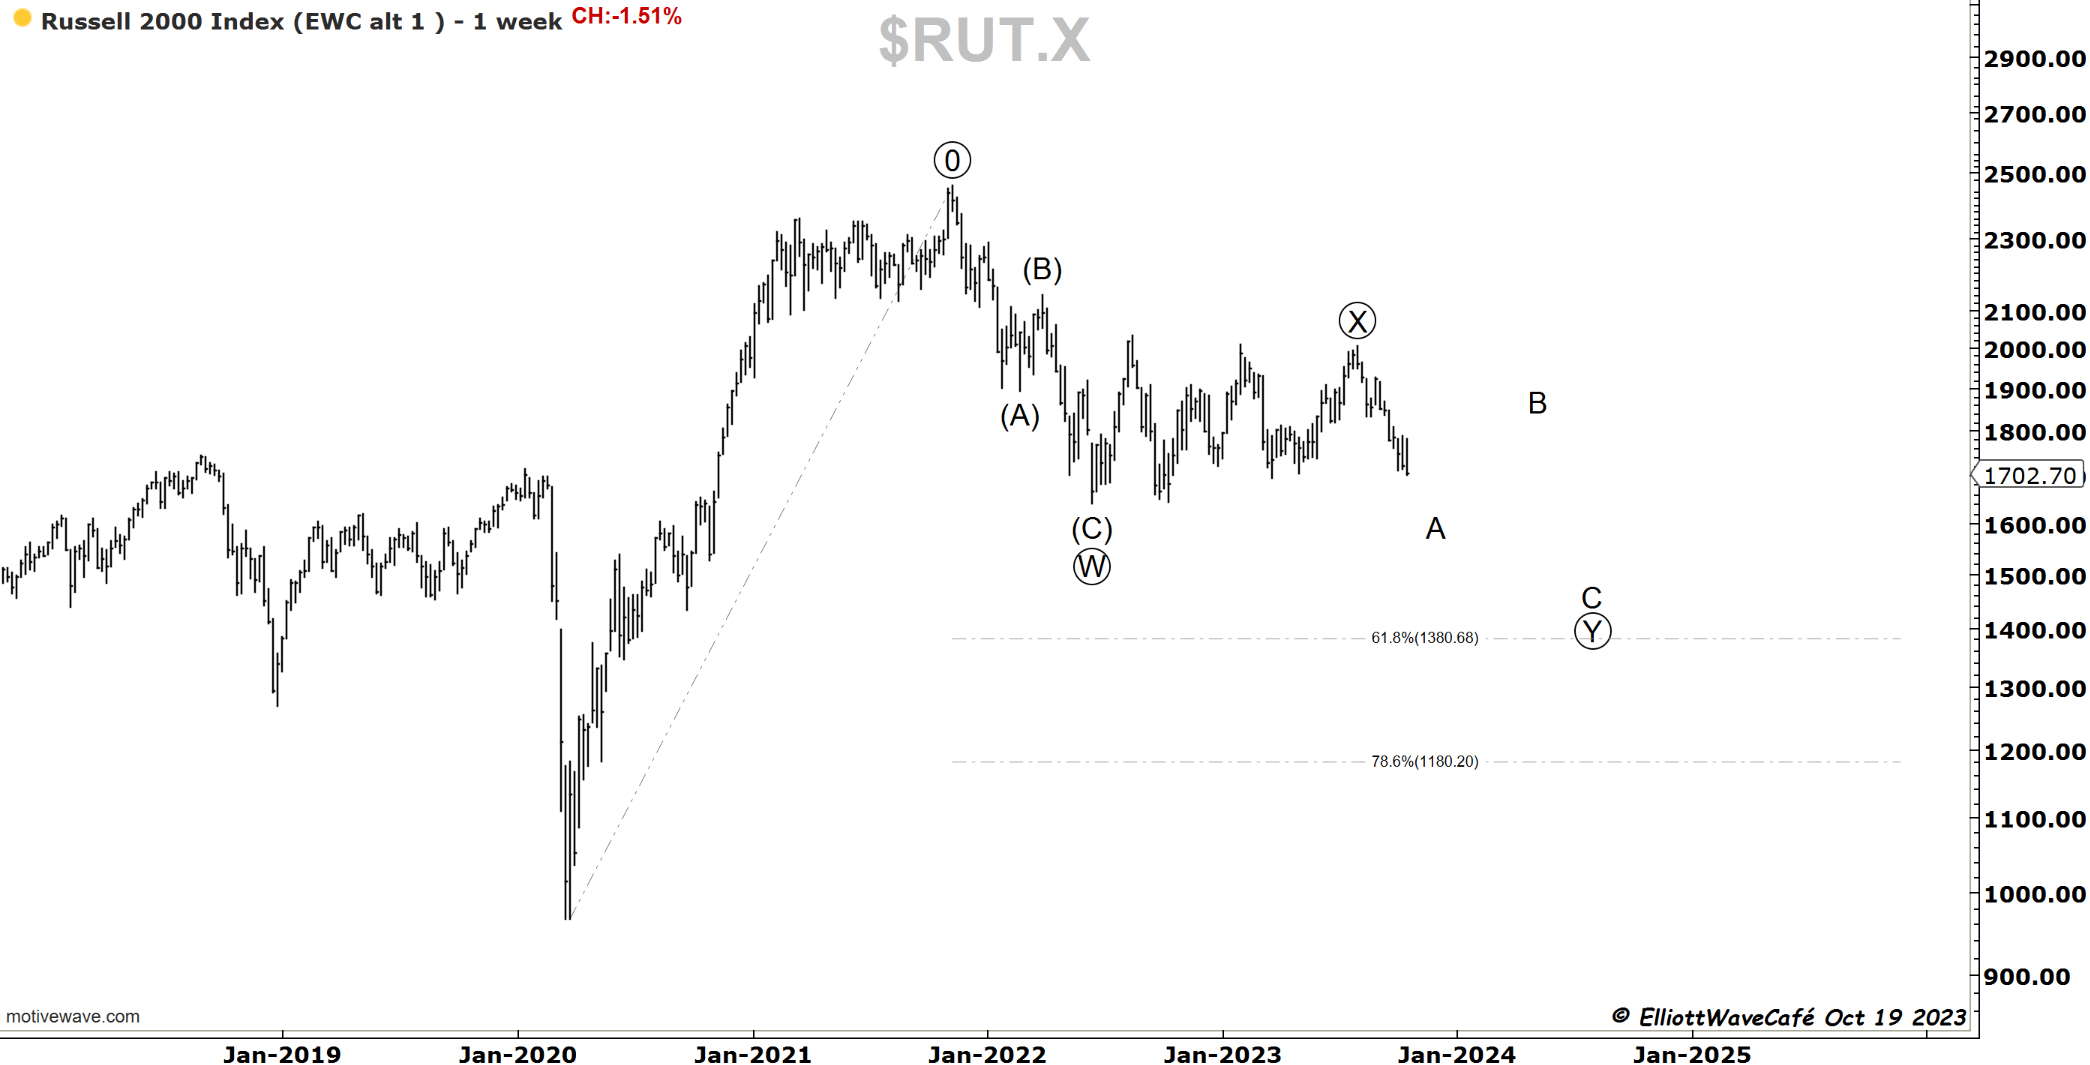
RUSSELL 2000
The larger problem appears in the Russell where there is a threat of a break of the corrective pattern since last year’s summer. We are right into support and if 1641 gives way, we should assume the wave (C) is being formed. The length of it is unknown ( we can discuss equality with (A)), but it looks that we have a 5 wave decline already in final stages. The wave (C) can be very short and would satisfy the conditions for a zigzag.
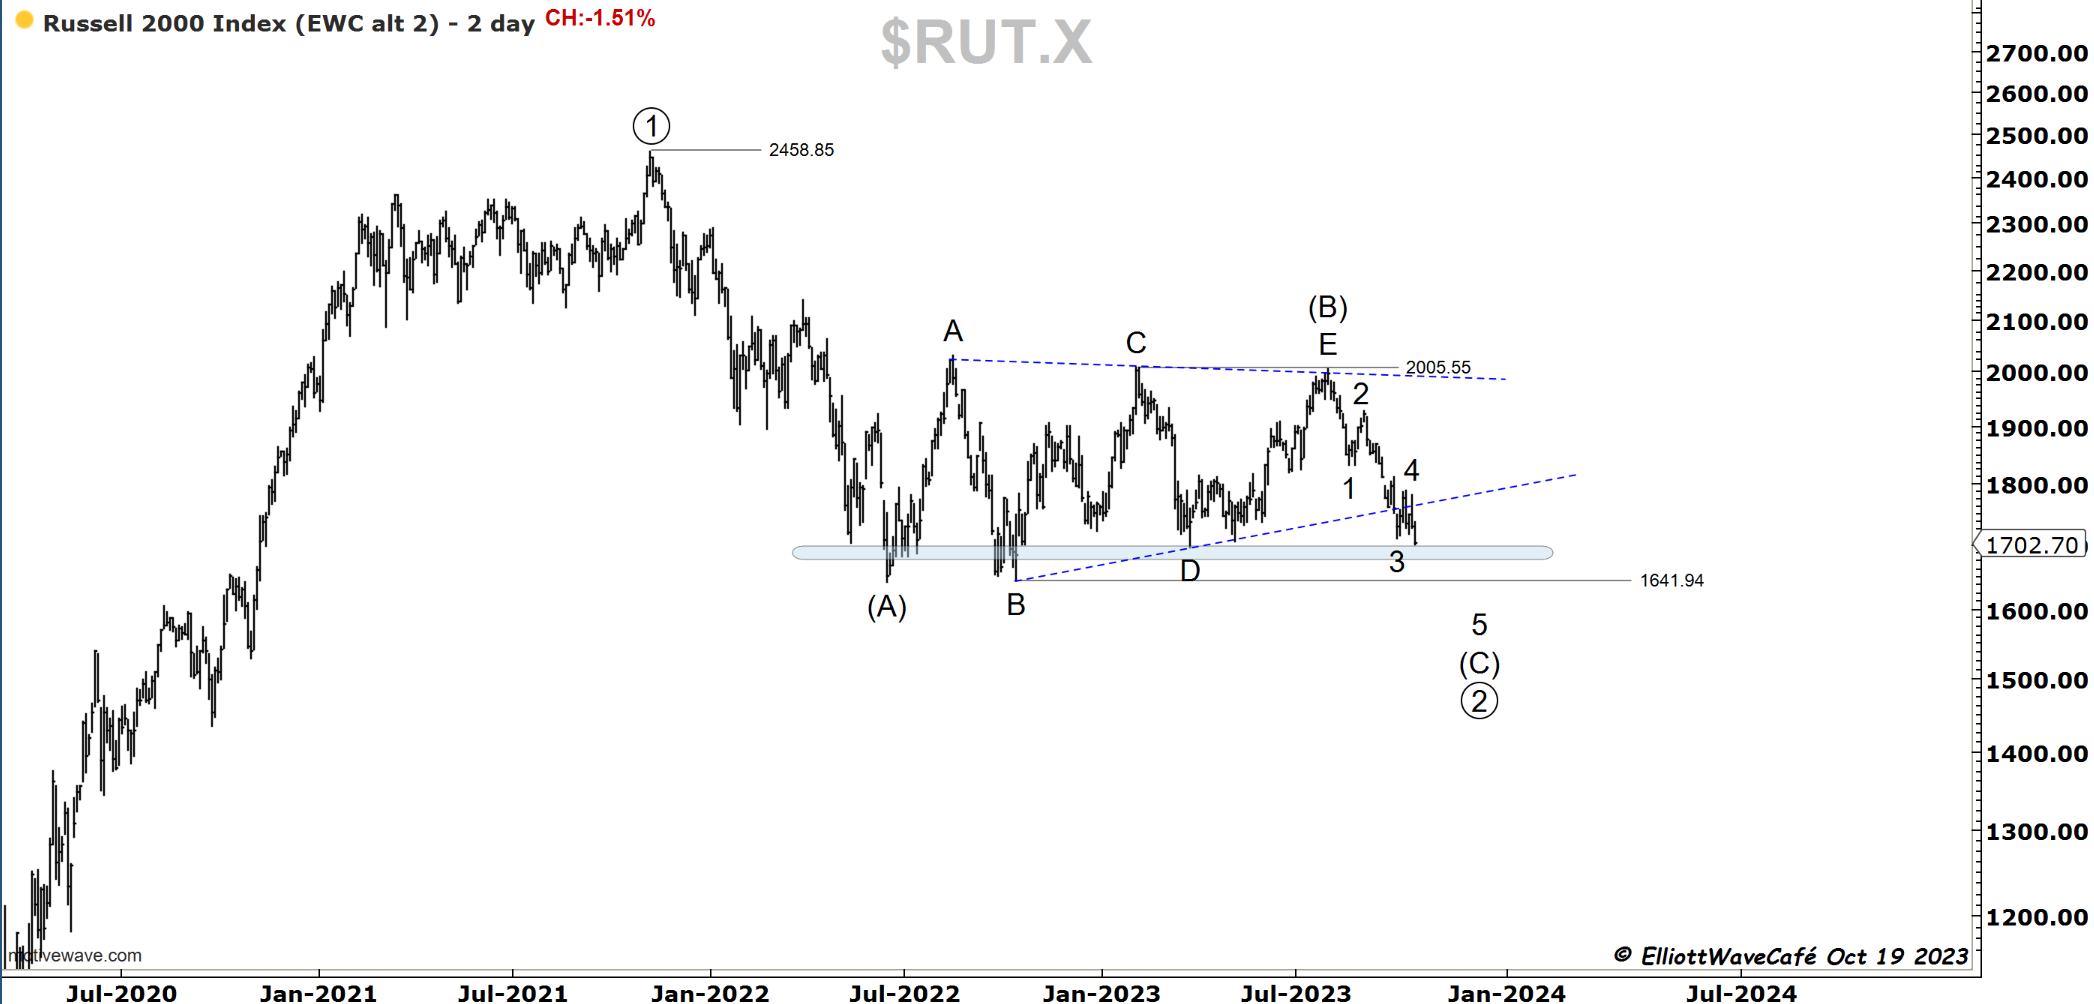
This chart presents the alternate WXY. Wave A should be near completion, wave B will be a rally, then another drop in C. With a 5 wave underway and testing support it’s not generally a healthy idea to be short this index right now from a risk/reward perspective.
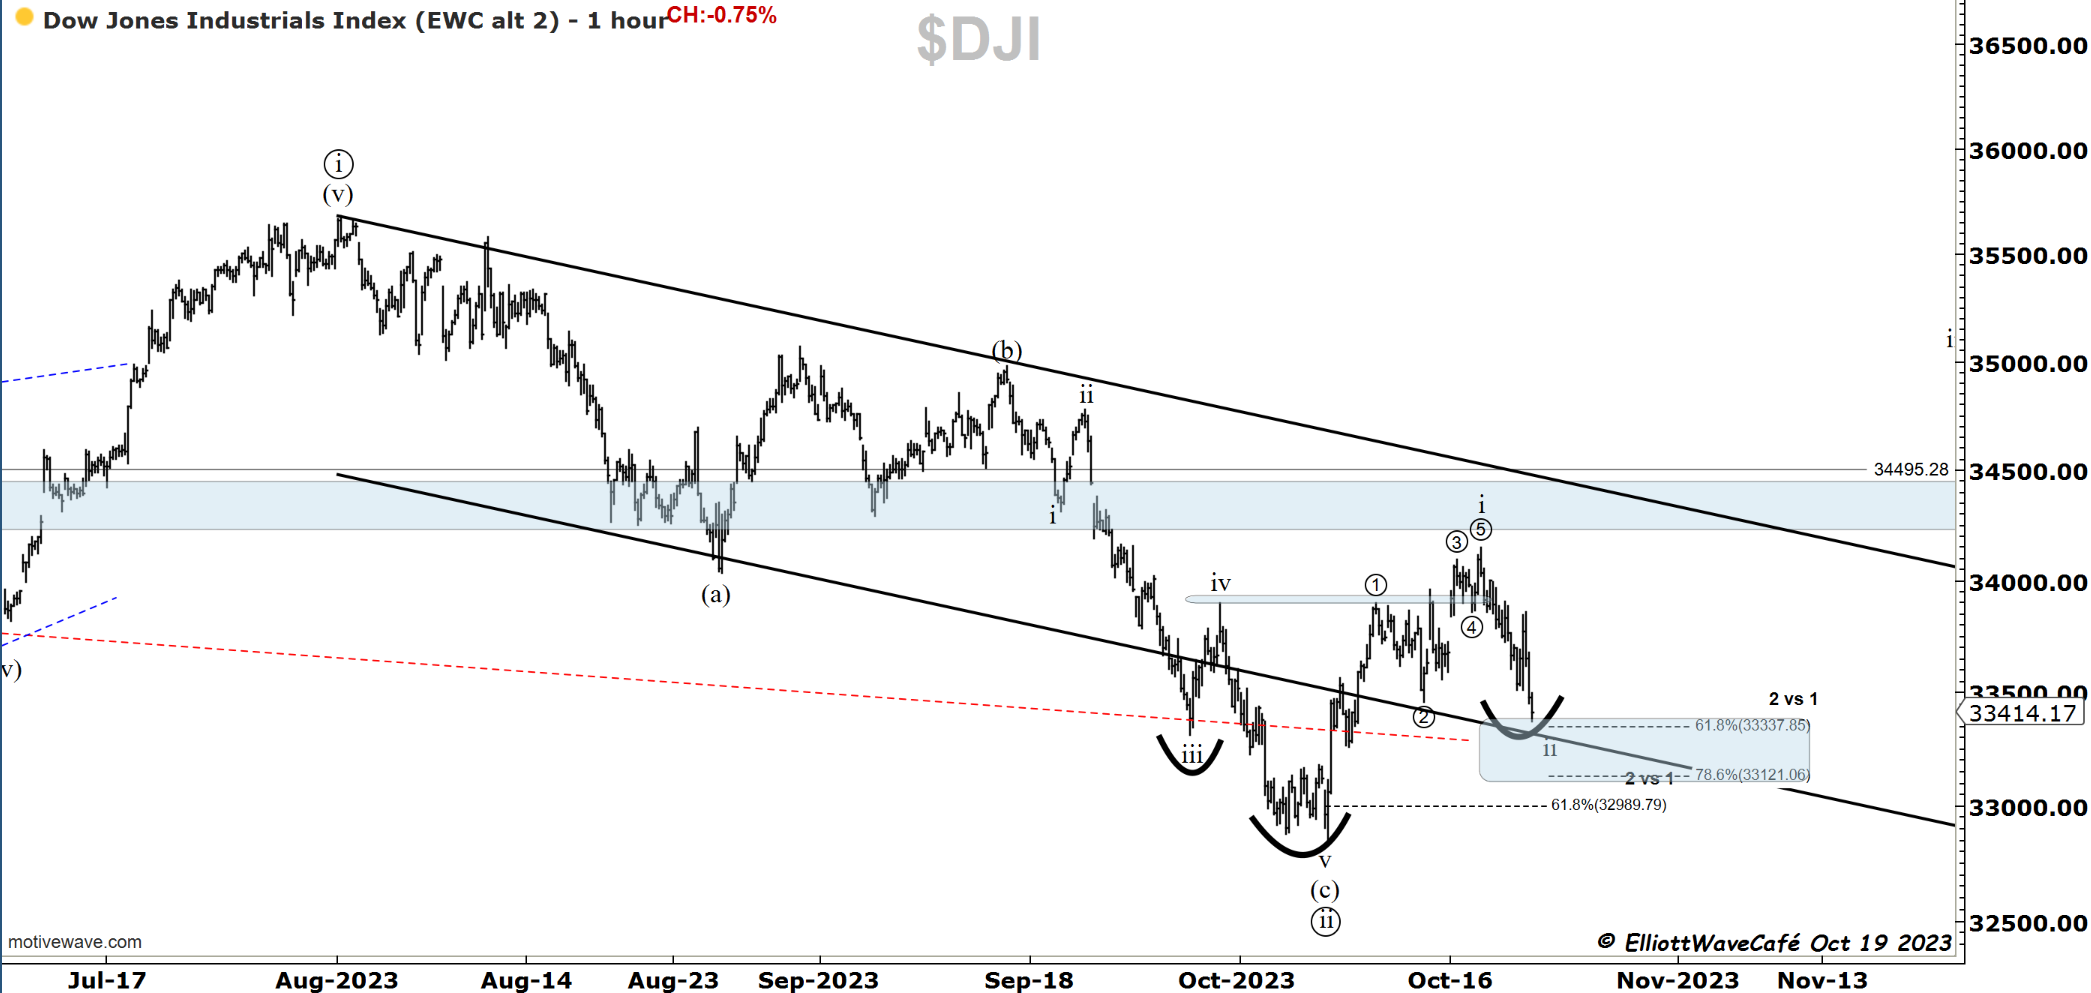
Dow30
Has gotten close to the 61.8 golden fib. Let’s see what she does here.
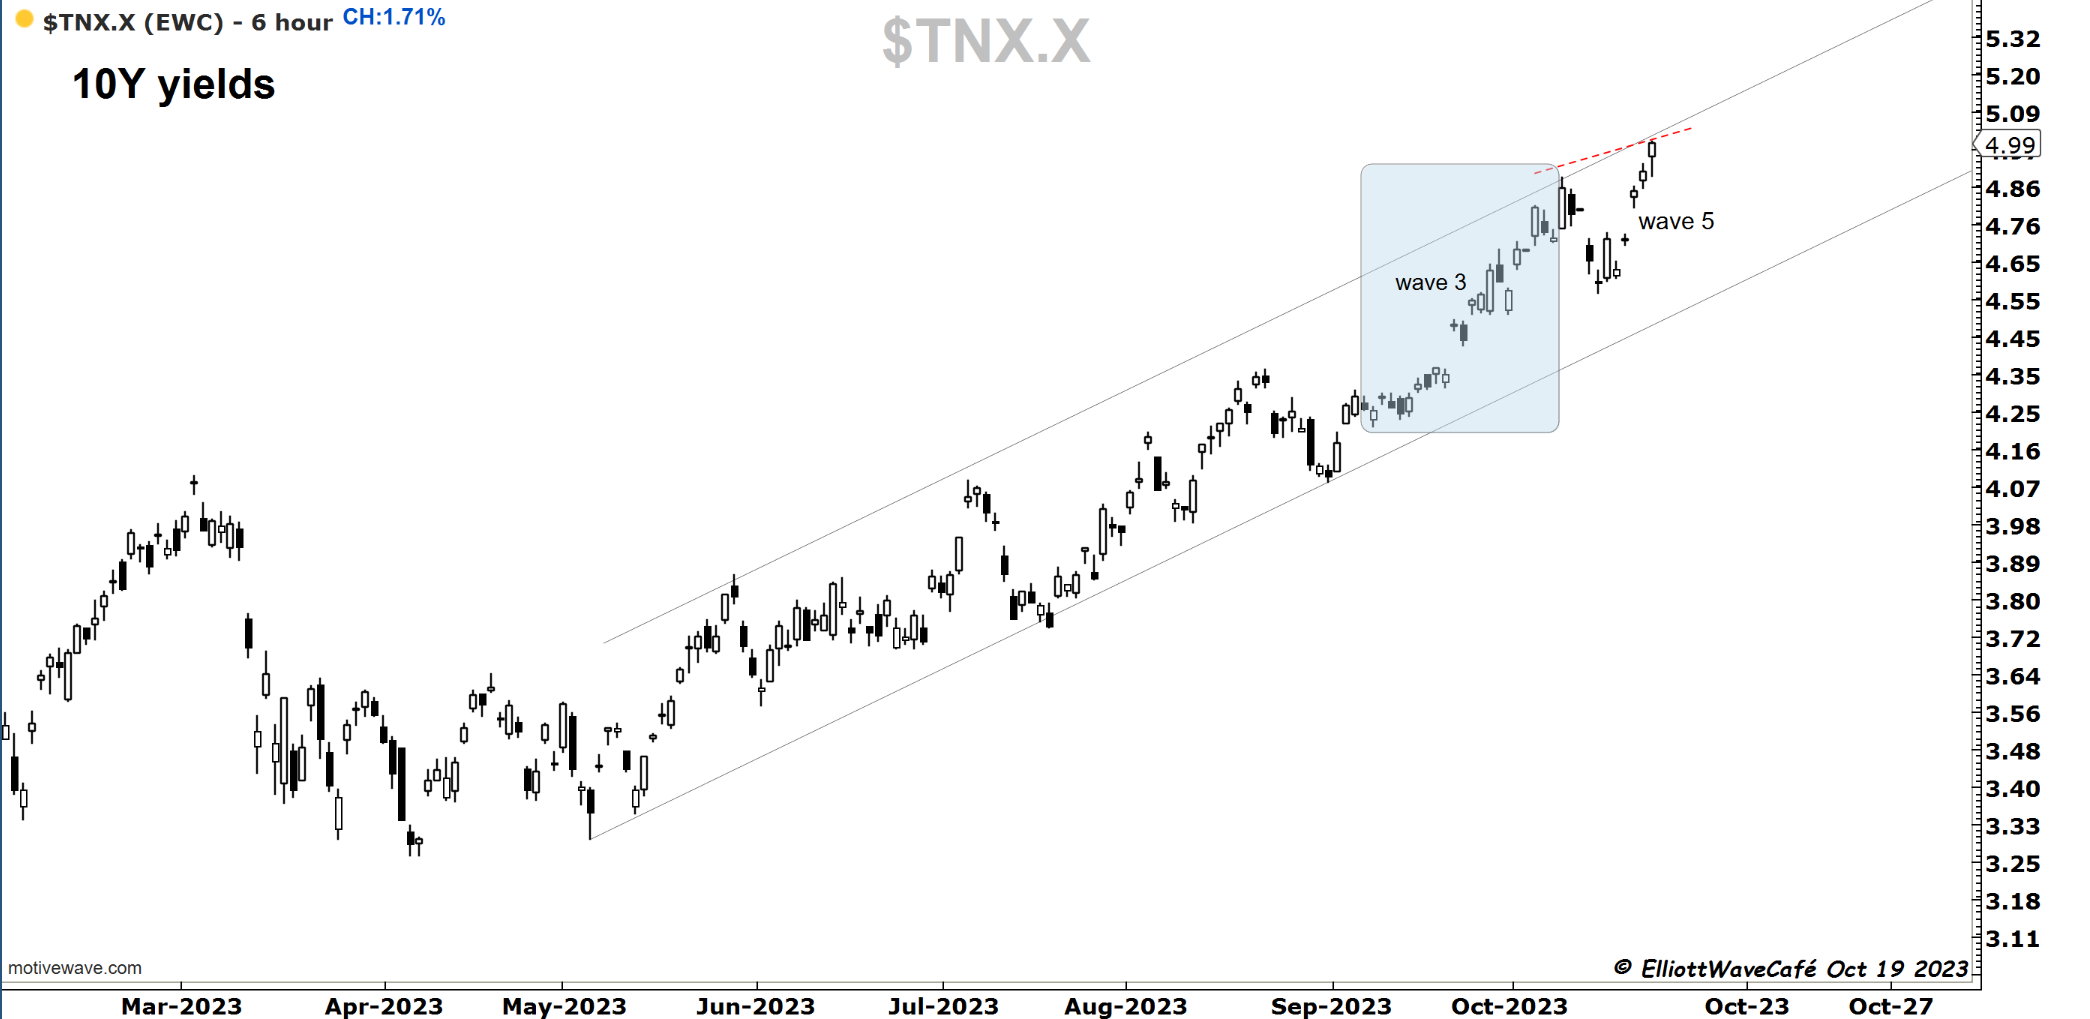
US Dollar and Yields
Yesterday I discussed the relationship dollar, yields. The fact that the dollar is not ripping with rates near 5% is quite surprising. I would have guessed we will see 108. Maybe its delayed for whatever reason. Or maybe its flashing warning signals for yields topping.
The 10-year looks to be in a wave 5 following a larger 3rd. I did not count the larger structure, I will do some work over the weekend on this. But from a quick glance, this looks terminal near term.
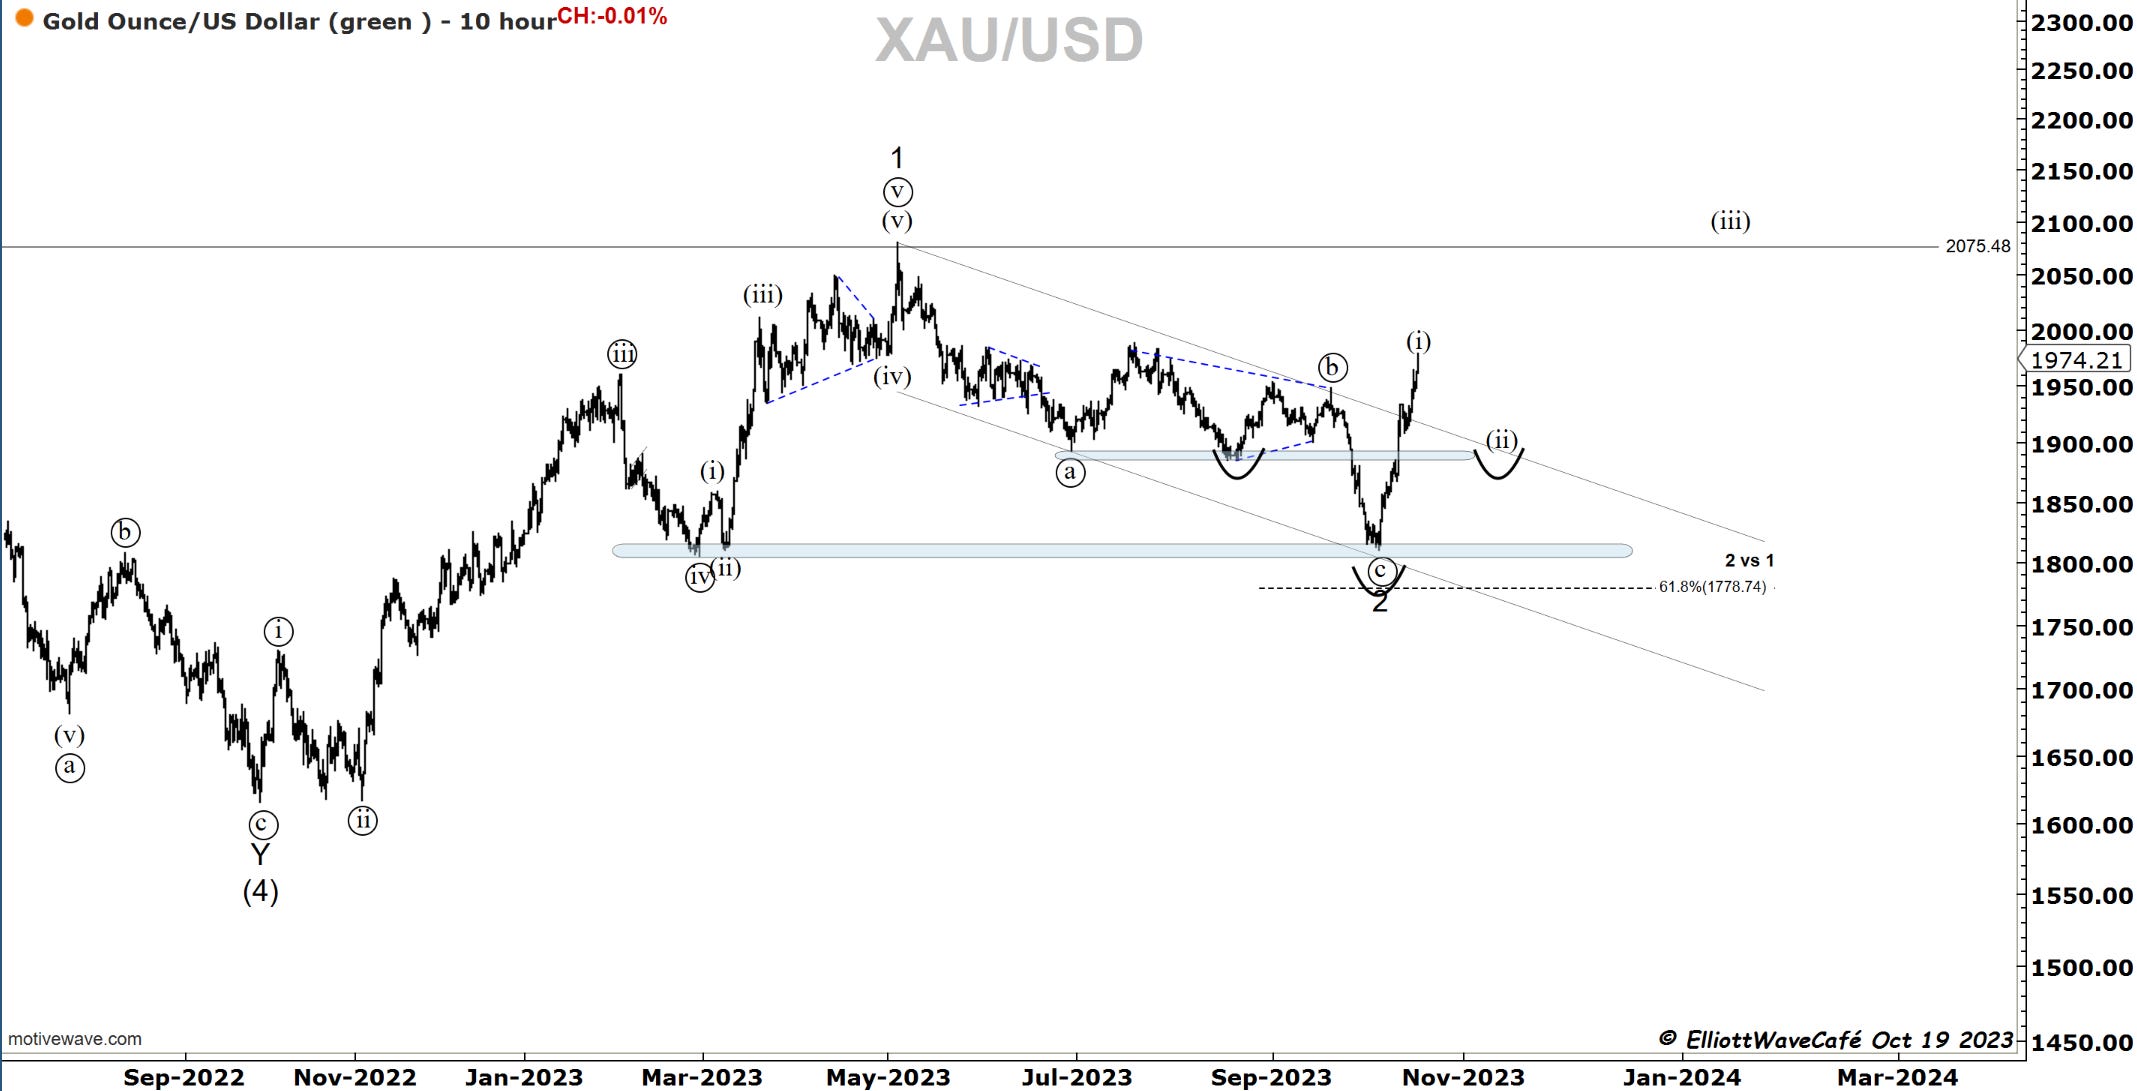
Gold
Another push in Gold but I can’t touch it unless we come back and retest the broken channel and gives me some sort of an entry point. It’s behaving very bullish. It’s pricing in something, not sure what yet. If it’s just another X wave, the selloff will be quite dramatic. It does not look like it’s an X-wave. If wave 3 is underway, there is plenty of time to join this trend.
Bitcoin
Not much to add on BTC, previous comments stand, I would watch the .618 at 27,800 for reactions. It seems to coincide with the channel bottom. Once again, quite resilient in the face of equity selloff. You would think that if traders would want to de-risk, they would reduce exposure to crypto. Maybe BTC is solidifying as more of a safety play, or it could be that anyone that wanted to sell already did so. That would be bullish. There could be many variables, but what’s clear to me is that we need to hold above 26,500. As long as we do, staying the long course is right.
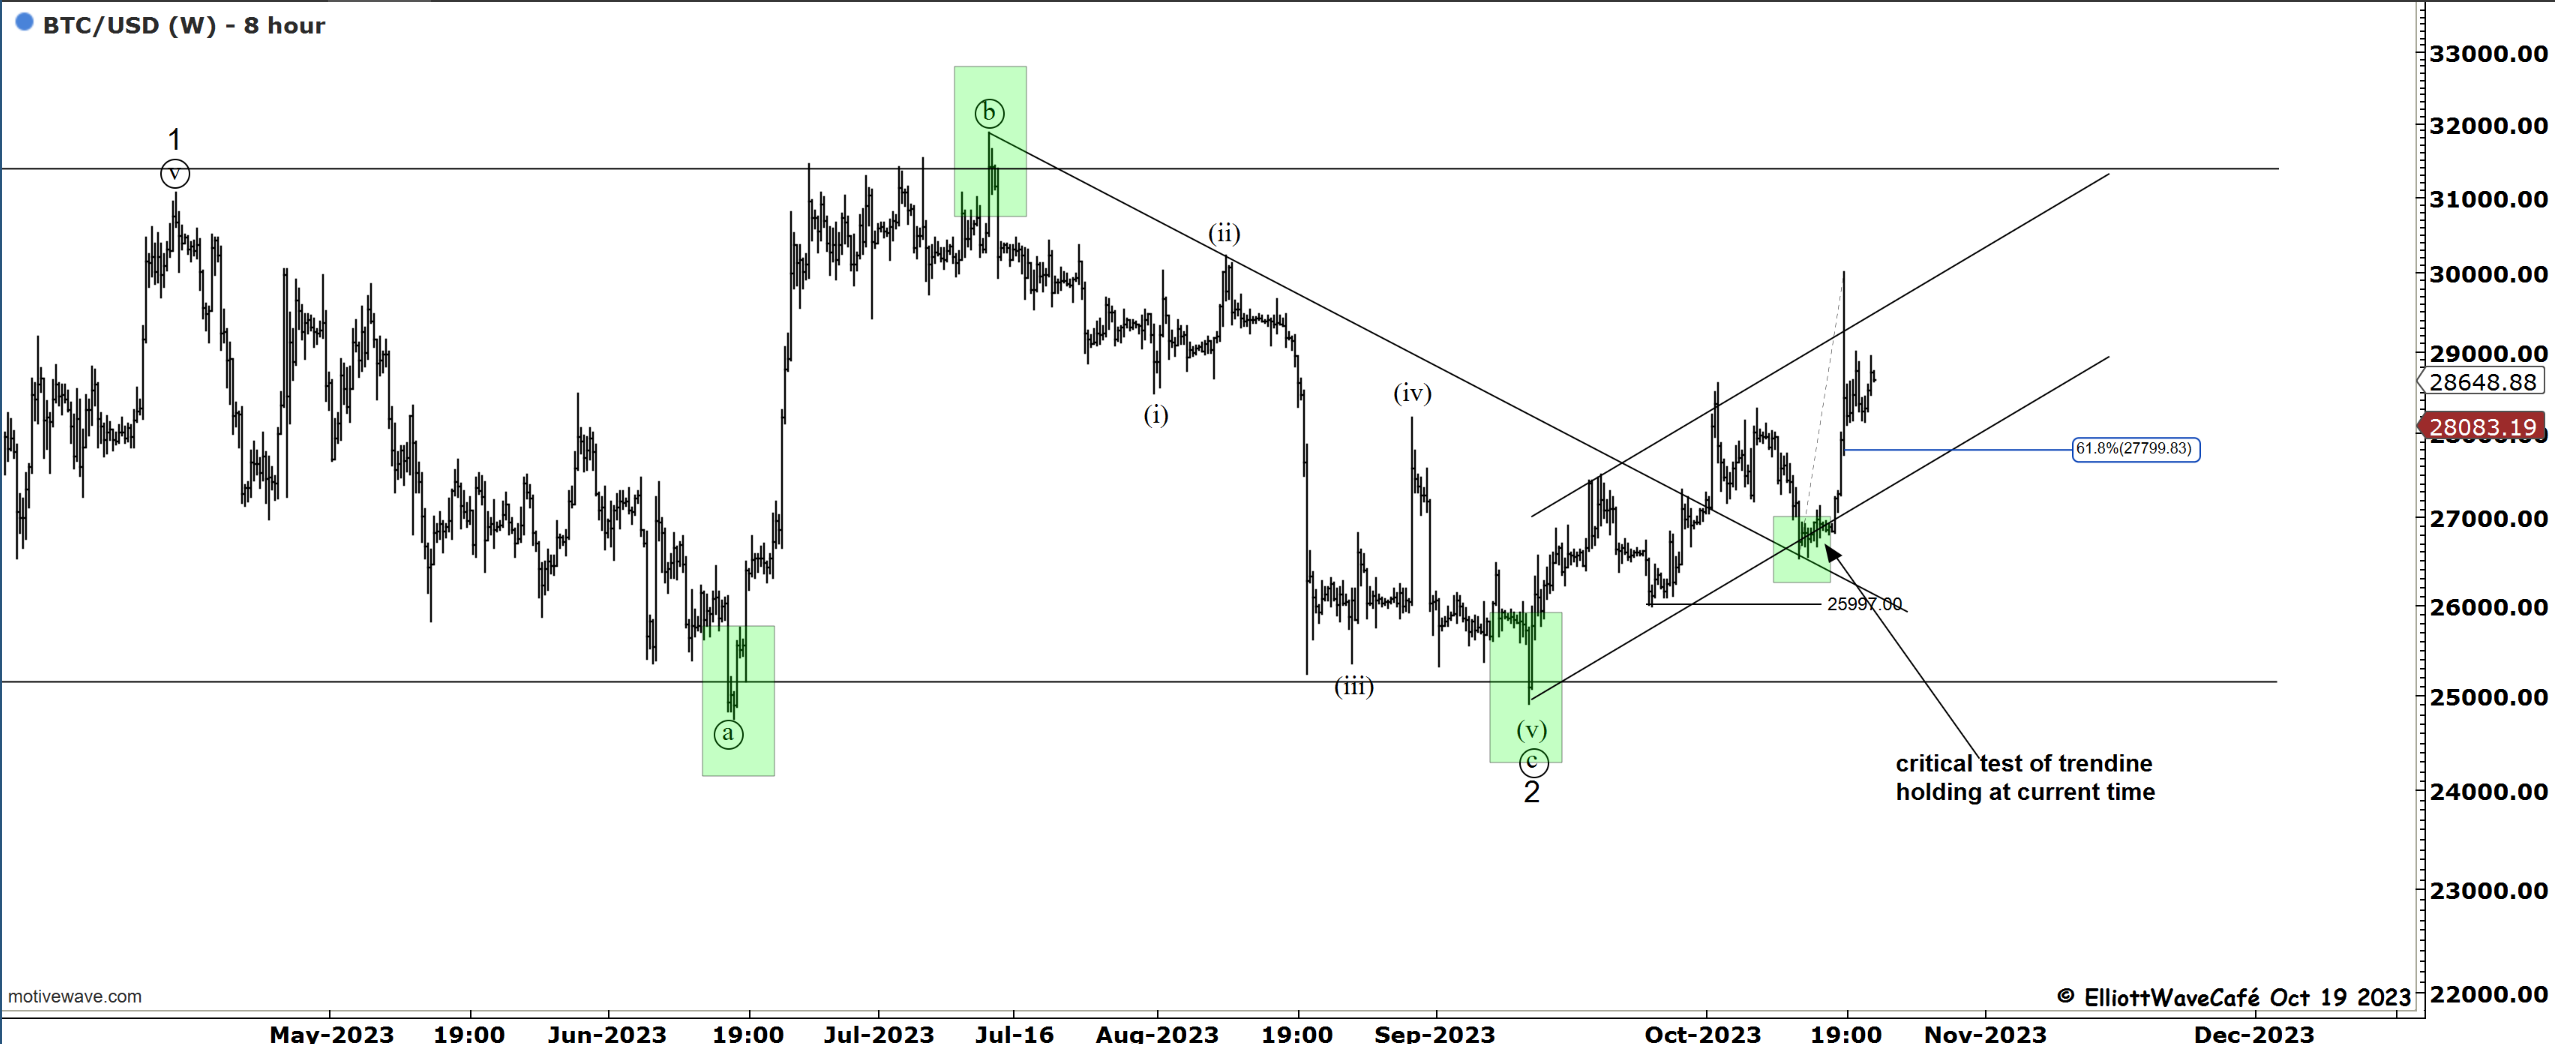
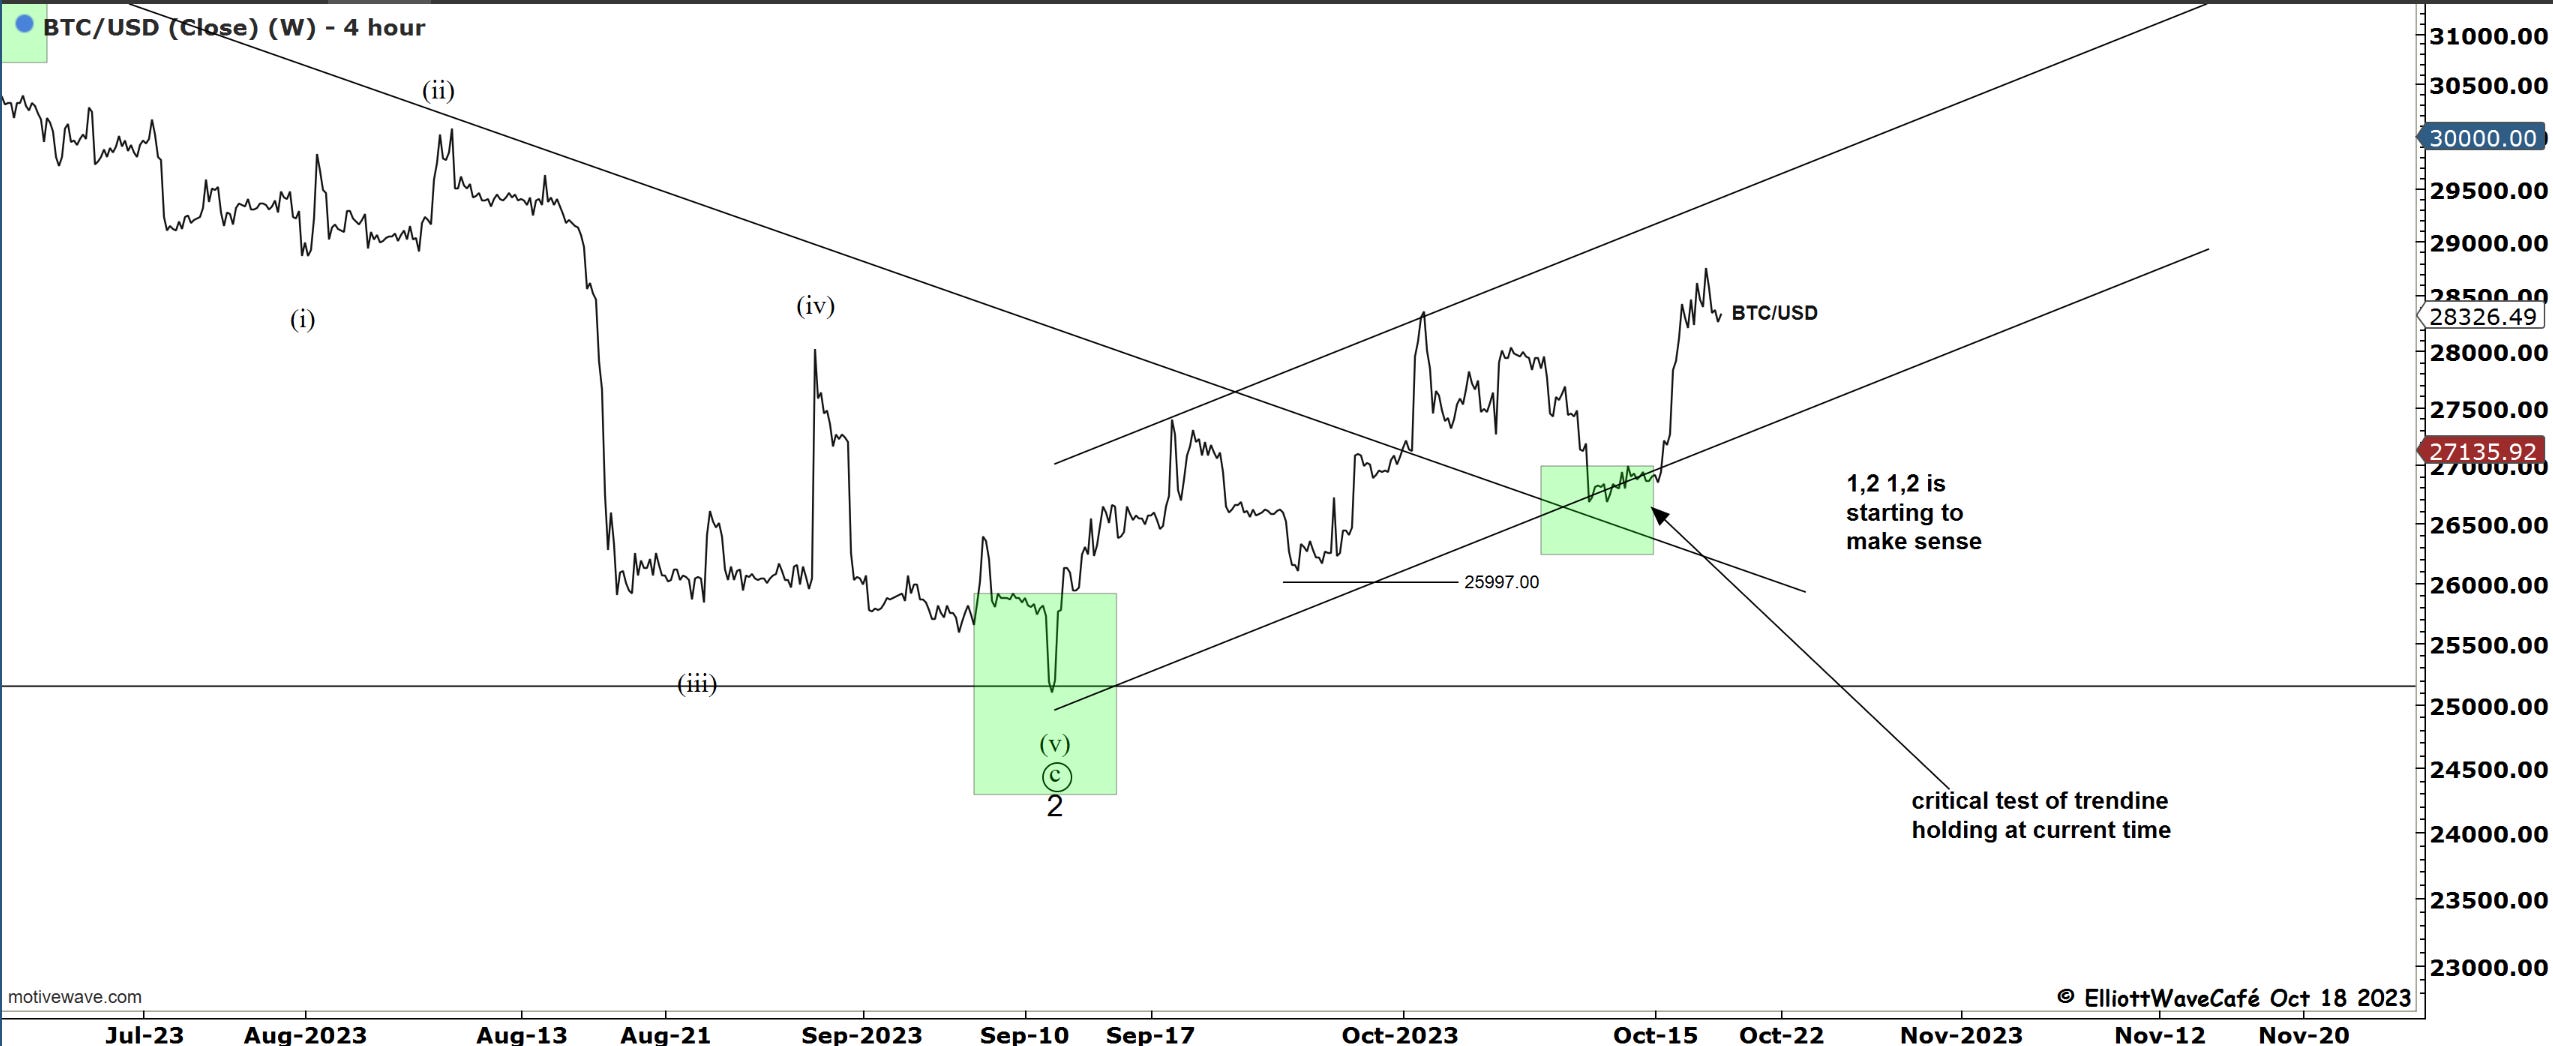
from yesterday….
Bitcoin remains in a decent uptrending channel and if we switch to a line chart to eliminate the news spike, things look a bit cleaner. Again it’s been quite resilient on a day when equities were lower. As long as we stay above that lower boundary line, one has good reasons to remain bullish. It’s a tough tradable market right here and now, but overall we behave fairly well and we’re above all key moving averages.
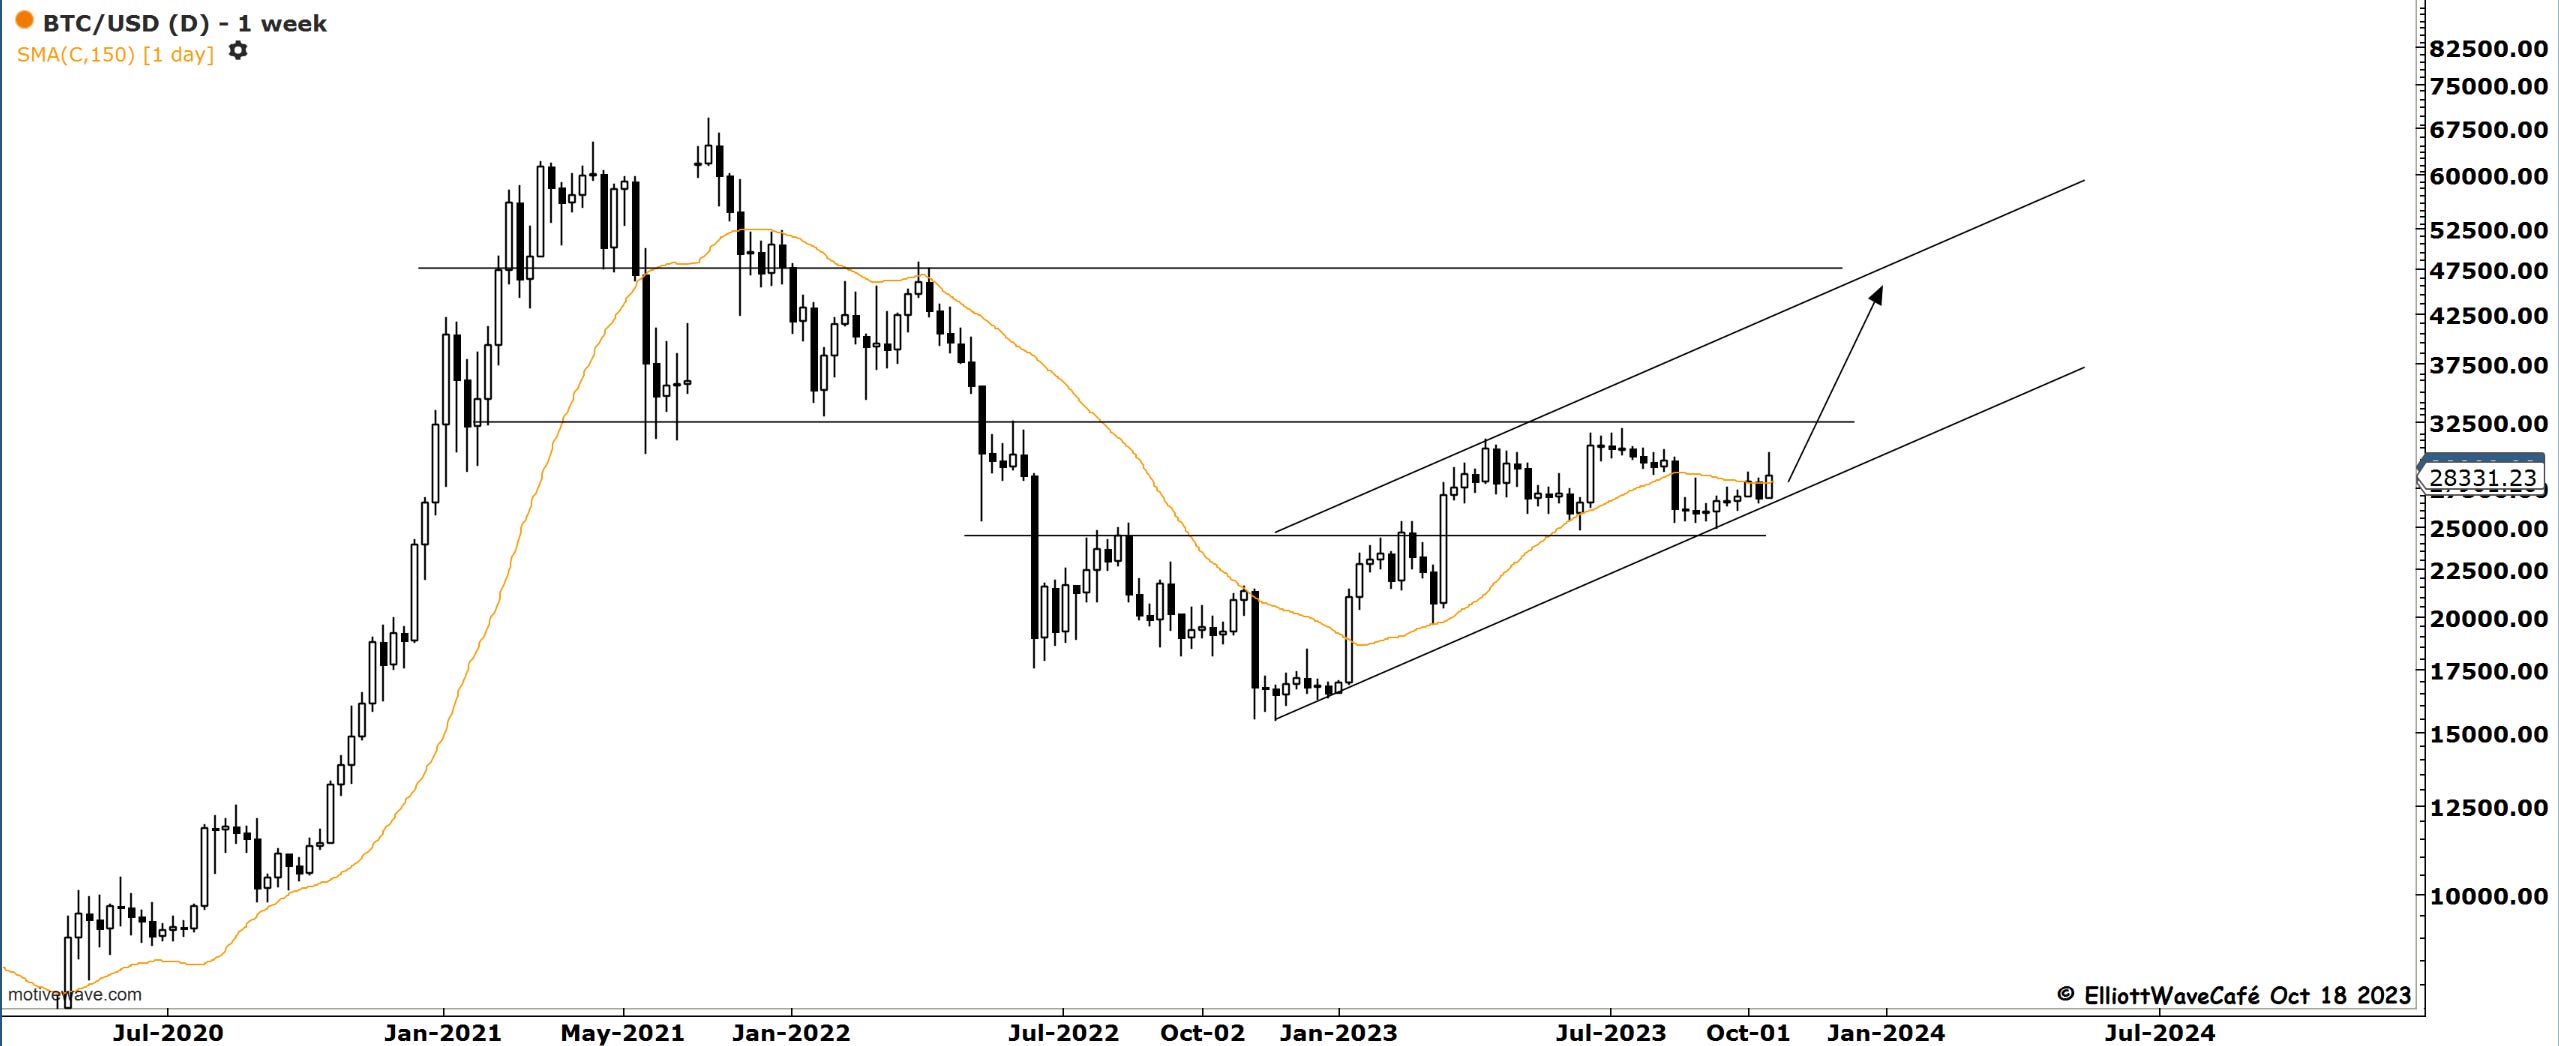
A basic upward channel can target 47,500 by mid-next year. If Gold breaks out why wouldn’t Bitcoin? If we close above 31k on a weekly basis, I think its Game On.
Here is the correlation with the SP500 as a risk proxy. Mostly in the green with slight areas of inverse correlation.
Daily video coming up next,
See you next week - trade well,
Cris
email: ewcafe@pm.me