
The Daily Drip
Markets review, strategy and analysis
Note: The EW counts on the right edge are real-time, and they are prone to adjustments as price action develops. Elliott Wave has a fluid approach, is evidence-based, and requires constant monitoring of certain thresholds.
In the counts below, this (( )) = circle on chart
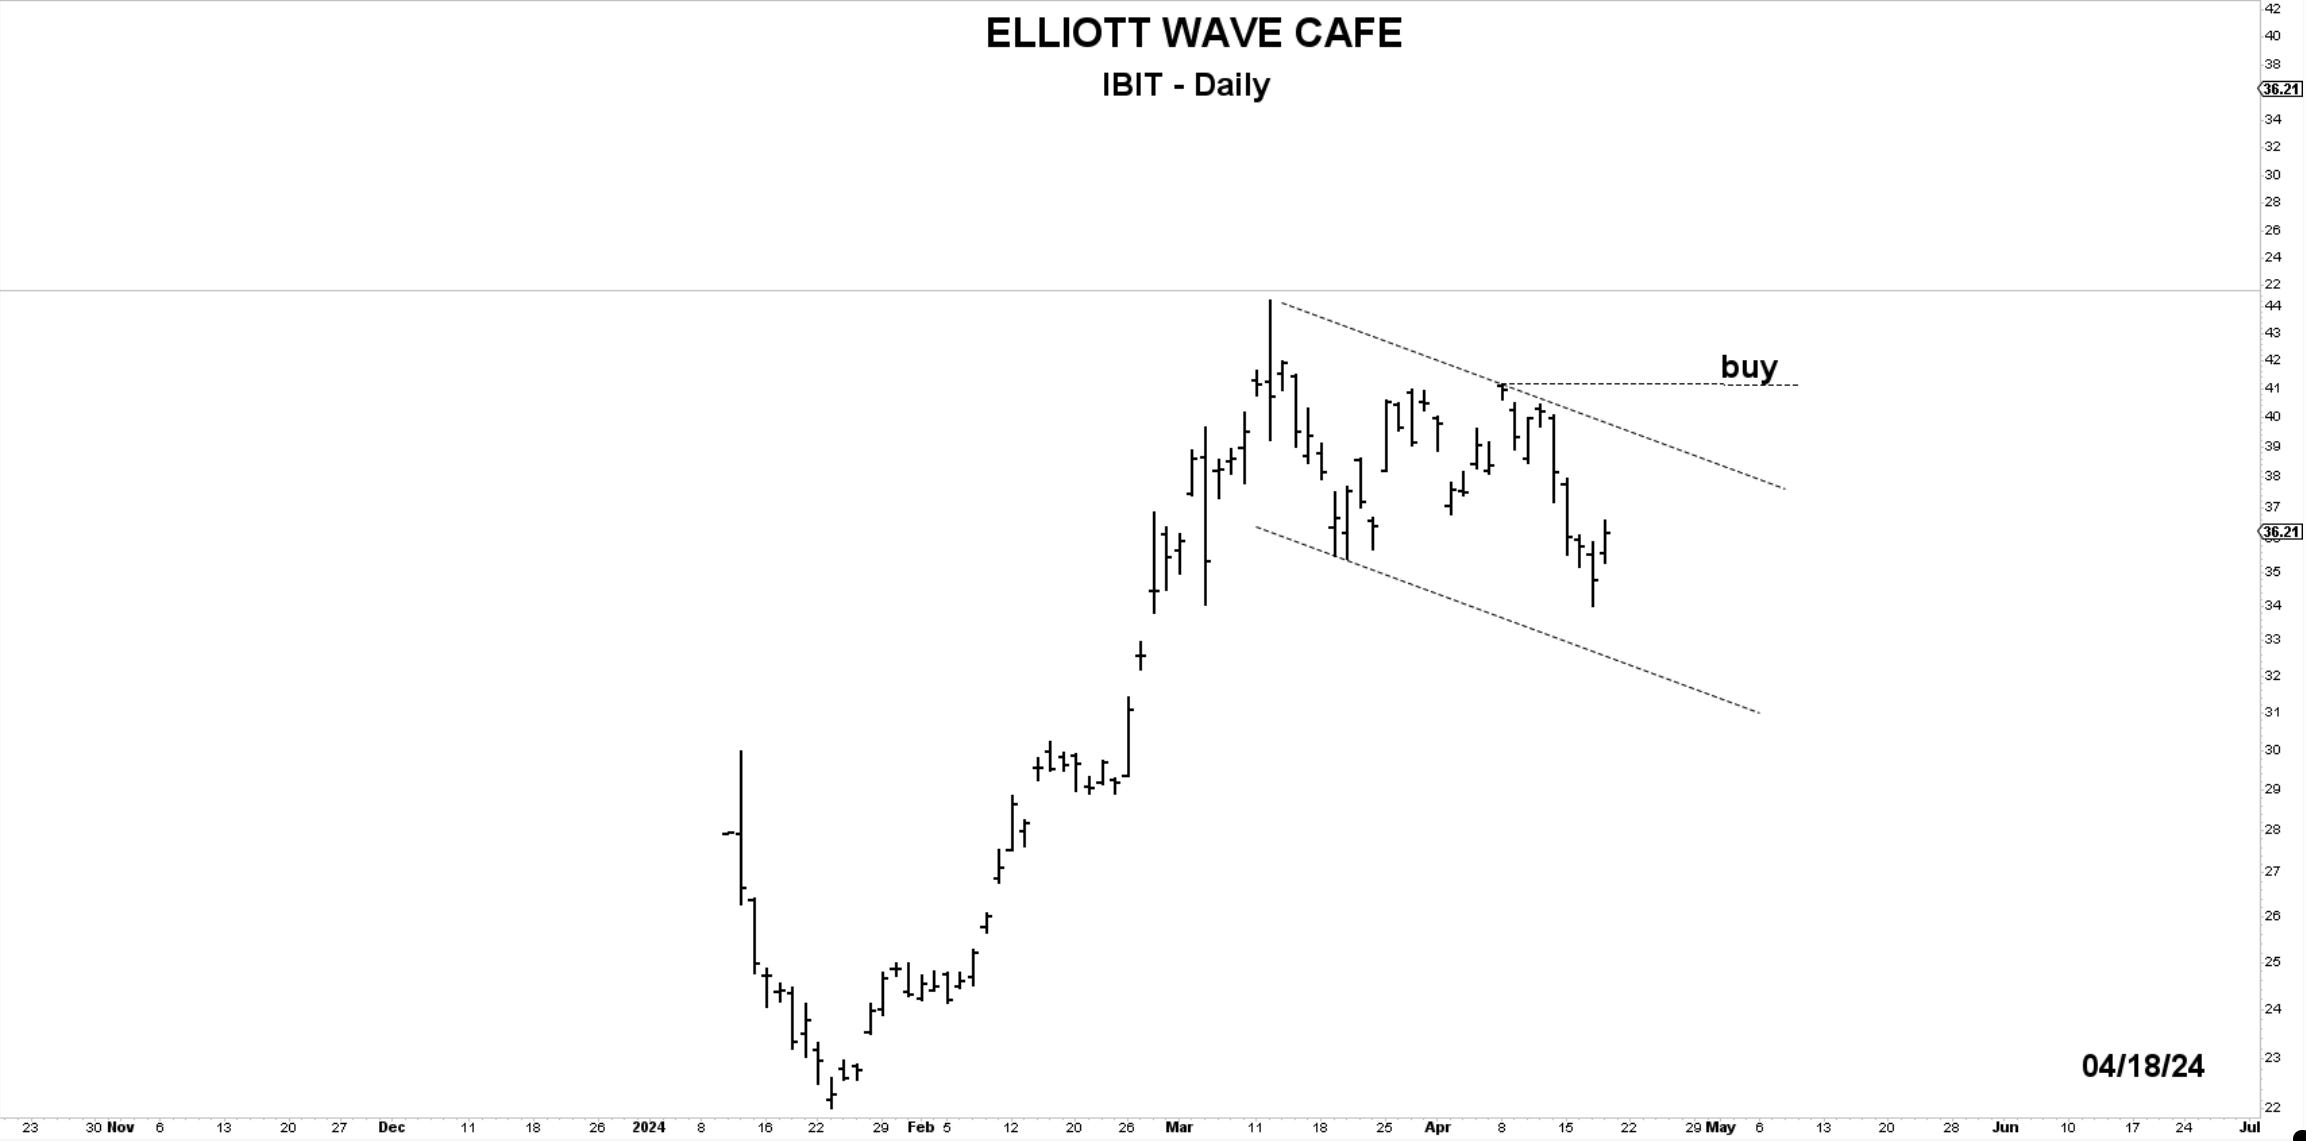
Chart of the Day—IBIT—Considering the first move of the lows as an impulsive structure, what appears to be forming is a corrective decline. We can’t tell where it will finish, but we can tell what level we want to be surpassed to increase the odds of its completion. That level is 41.20. If the market trades above there and BTC cash volume picks up, a reasonable assumption can be made that we will travel to new highs in price.
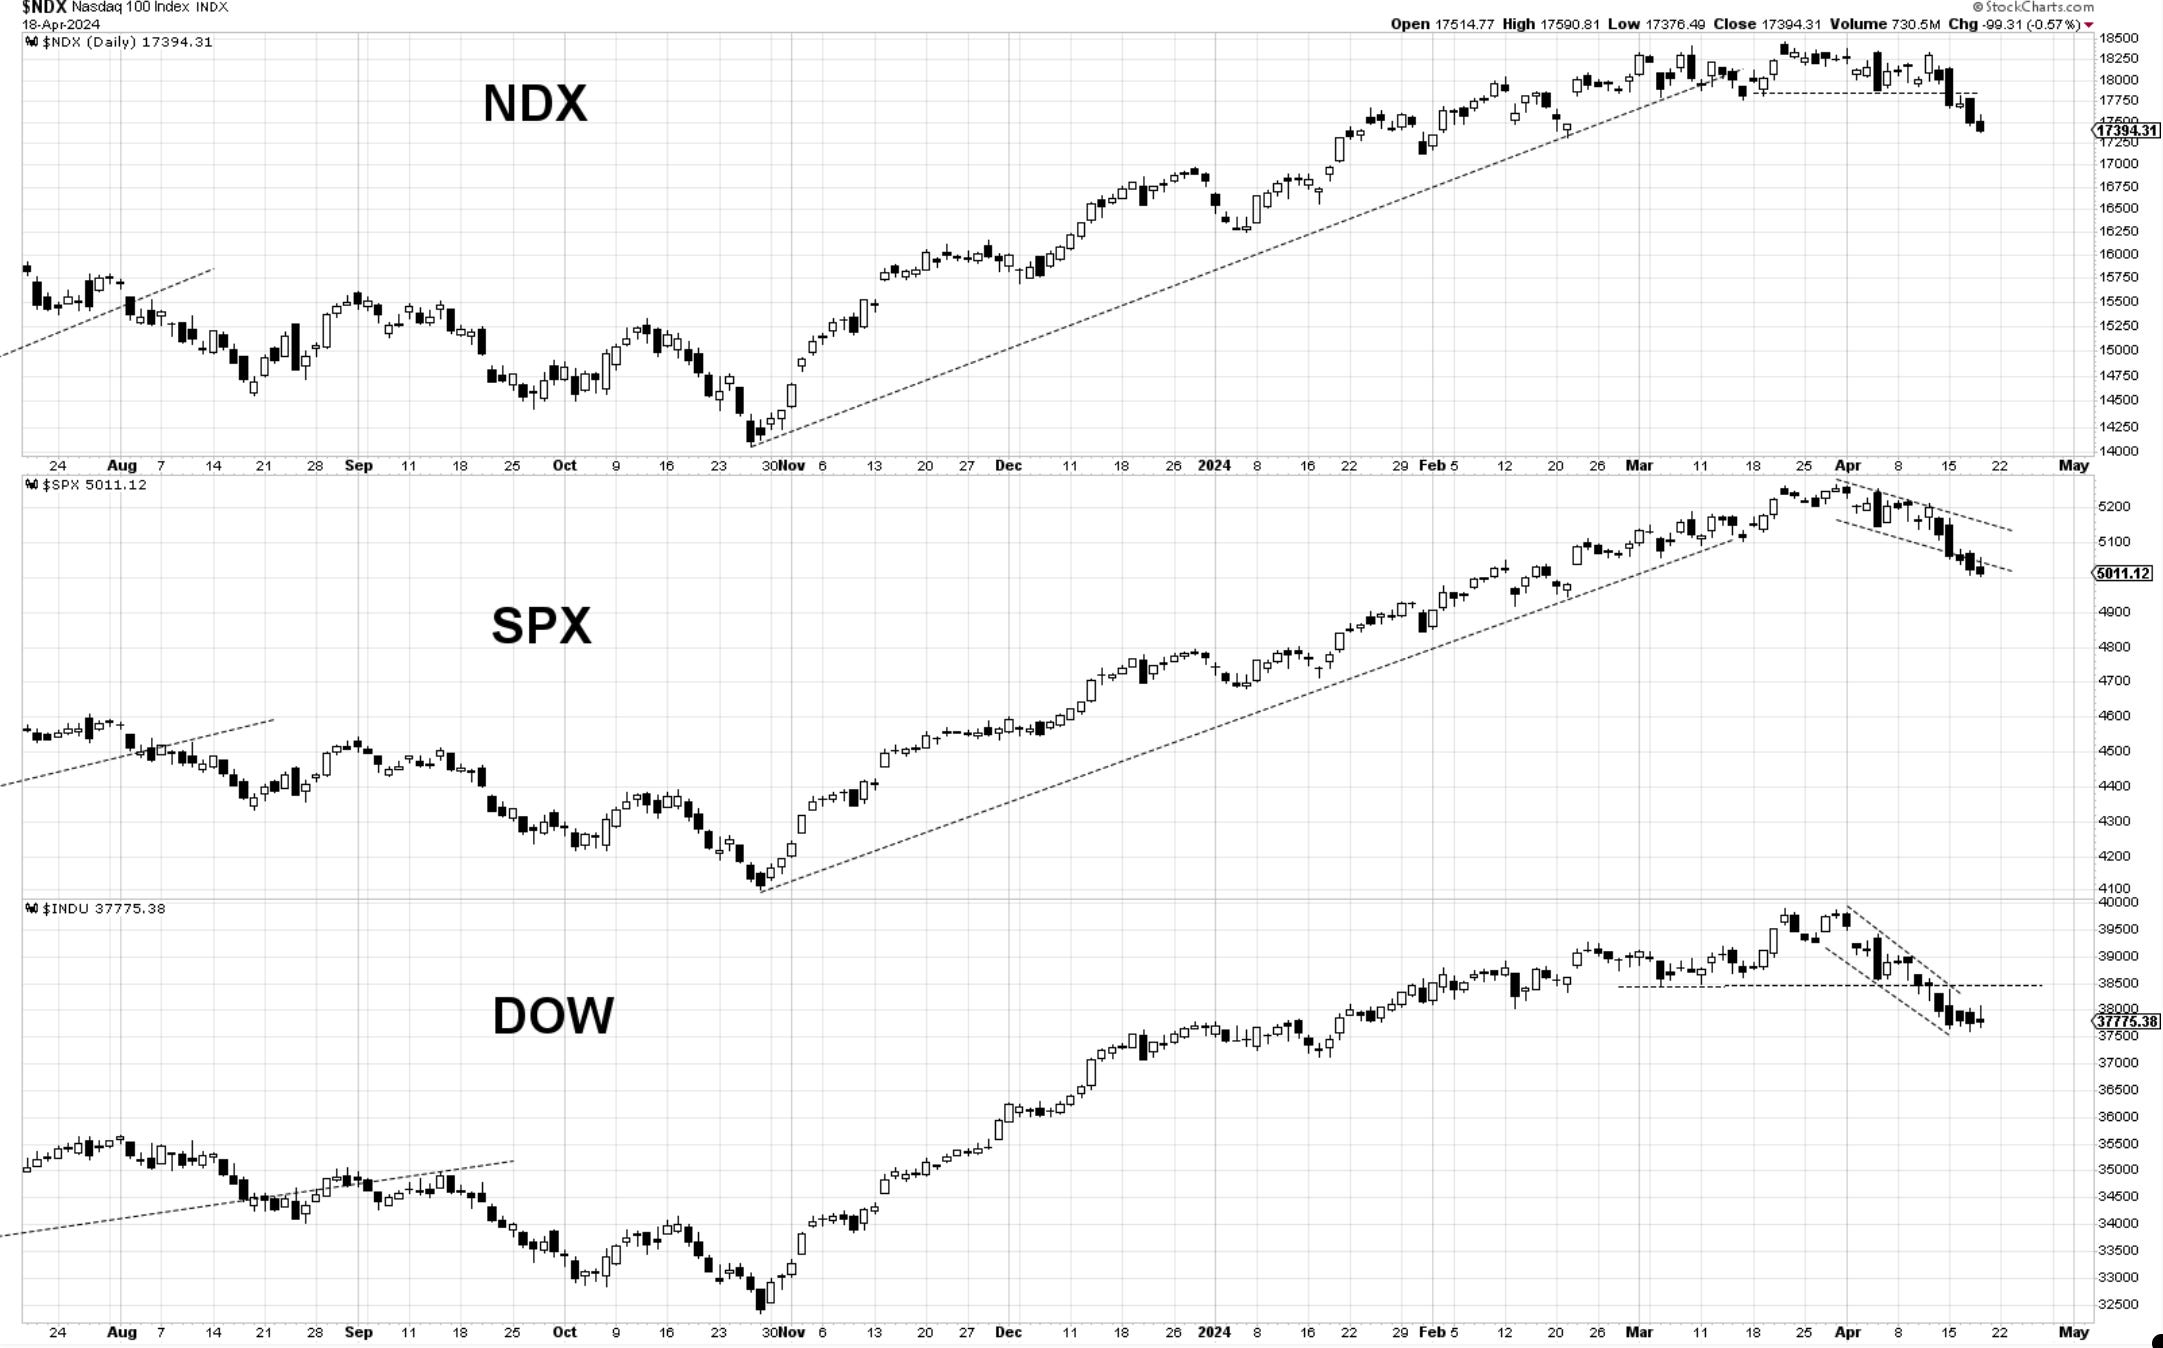
Bottom Line: The market continues to play defense, and any attempts to rally intraday are being met with sellers. Its character has shifted from a “buy the dip” mentality to a “sell the rally” mentality. Semiconductors were heavy today, which played a large part in NDX's decline. Momentum in SPX and DOW slowed, but evidence of lows being found is still absent. Until those start sprouting, reduced market exposure and cash on hand are the preferred methods.
Let’s dive into charts and further analysis below…
