
The Daily Drip
Core markets charts updates and commentary
Note: The counts on the right edge are real-time, and they are prone to adjustments as price action develops. Elliott Wave has a fluid approach, is evidence-based, and requires constant monitoring of certain thresholds.
In the counts below, this (( )) = circle on chart
This is the last report of the week. Have a great weekend!
SP500
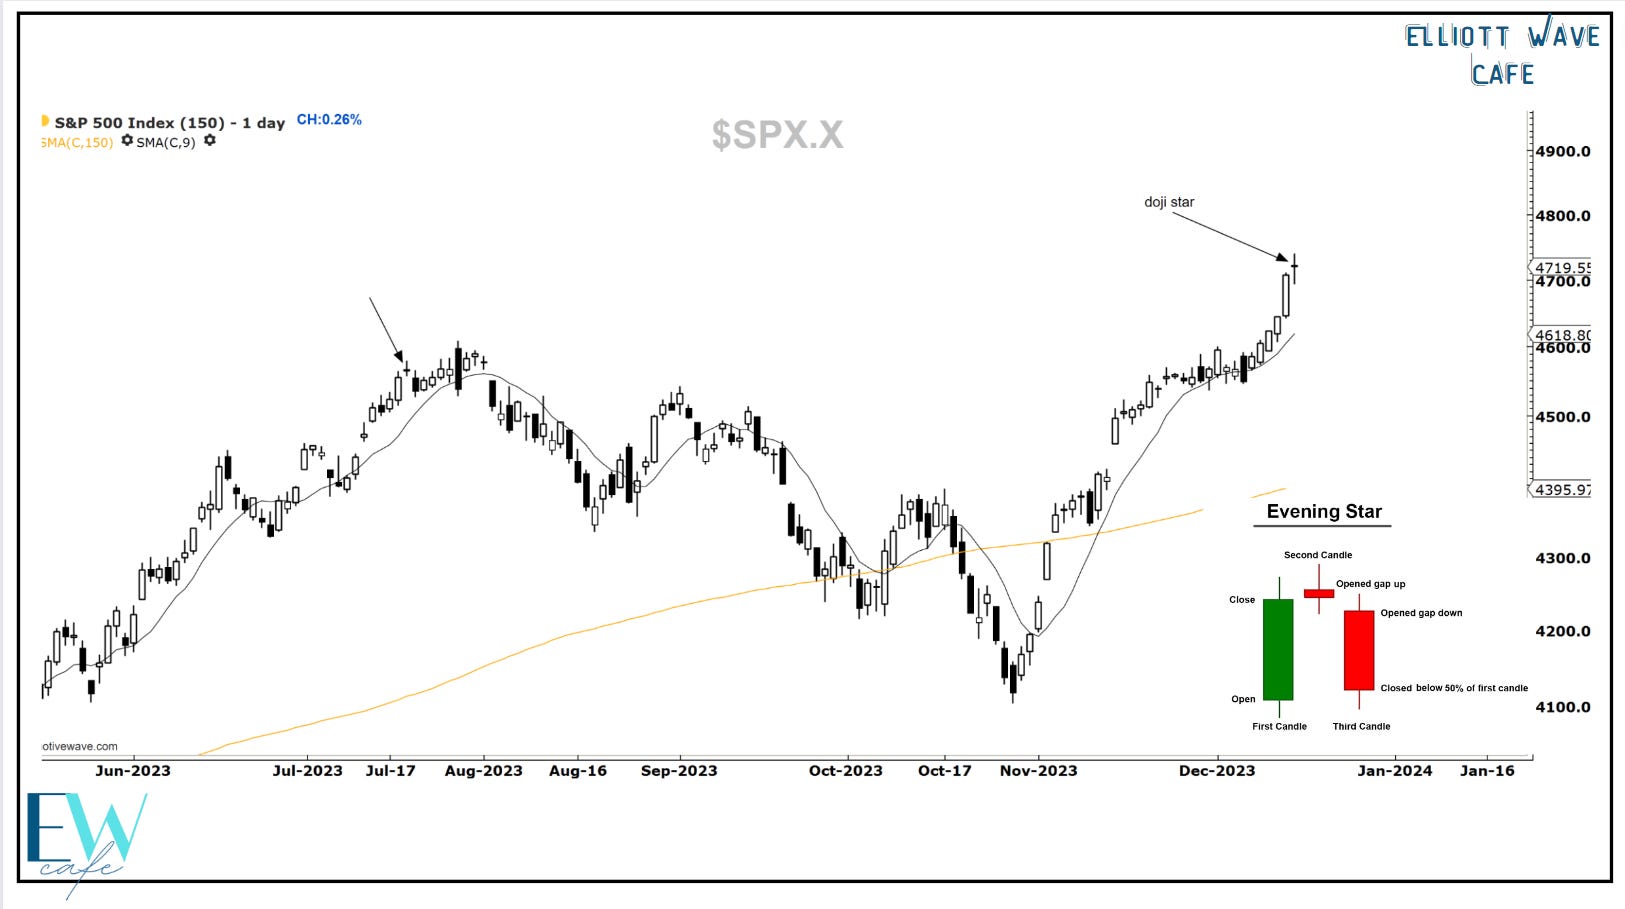
A gap higher today with an open and close tight together. The Open was 4721 and we closed at 4719. What this does is create a doji candle on the daily charts. By itself, all it says is that the market has reached a bit of equilibrium after a strong move. If it is followed by a down day that closes at least 50% lower than the day before the doji appeared, then we will have what is called an “evening doji star” formation, which suggests a top is likely in place for a while, and prices reverse. Tomorrow will be closely followed since it is also a monthly options expiration day.
The count suggests that we could have another attempt at the highs, but even if we do, it will likely be short-lived, and a retracement process will begin.
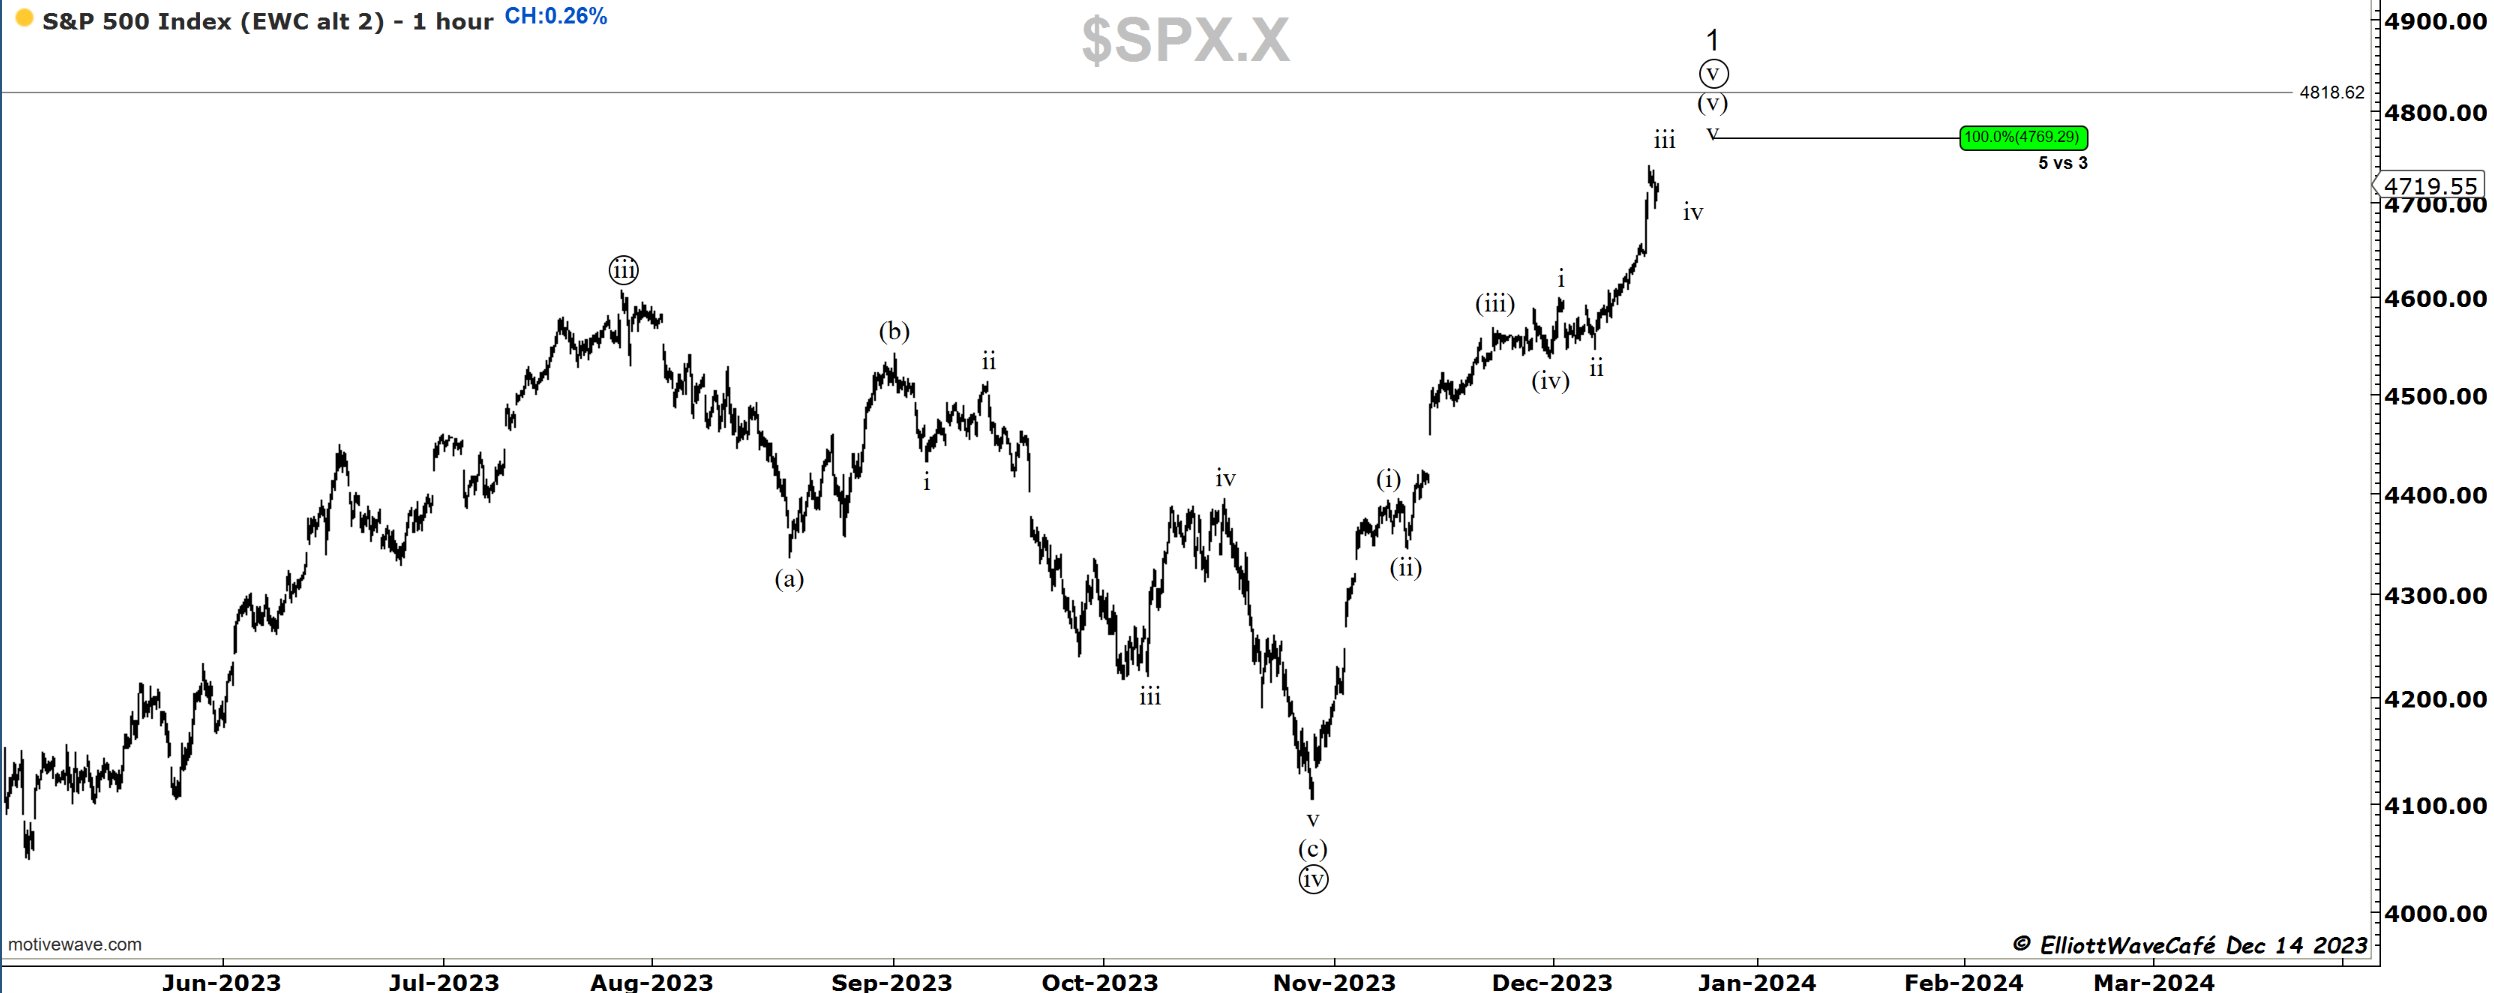
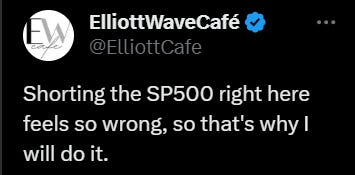
I said this on X this morning at the day’s high.
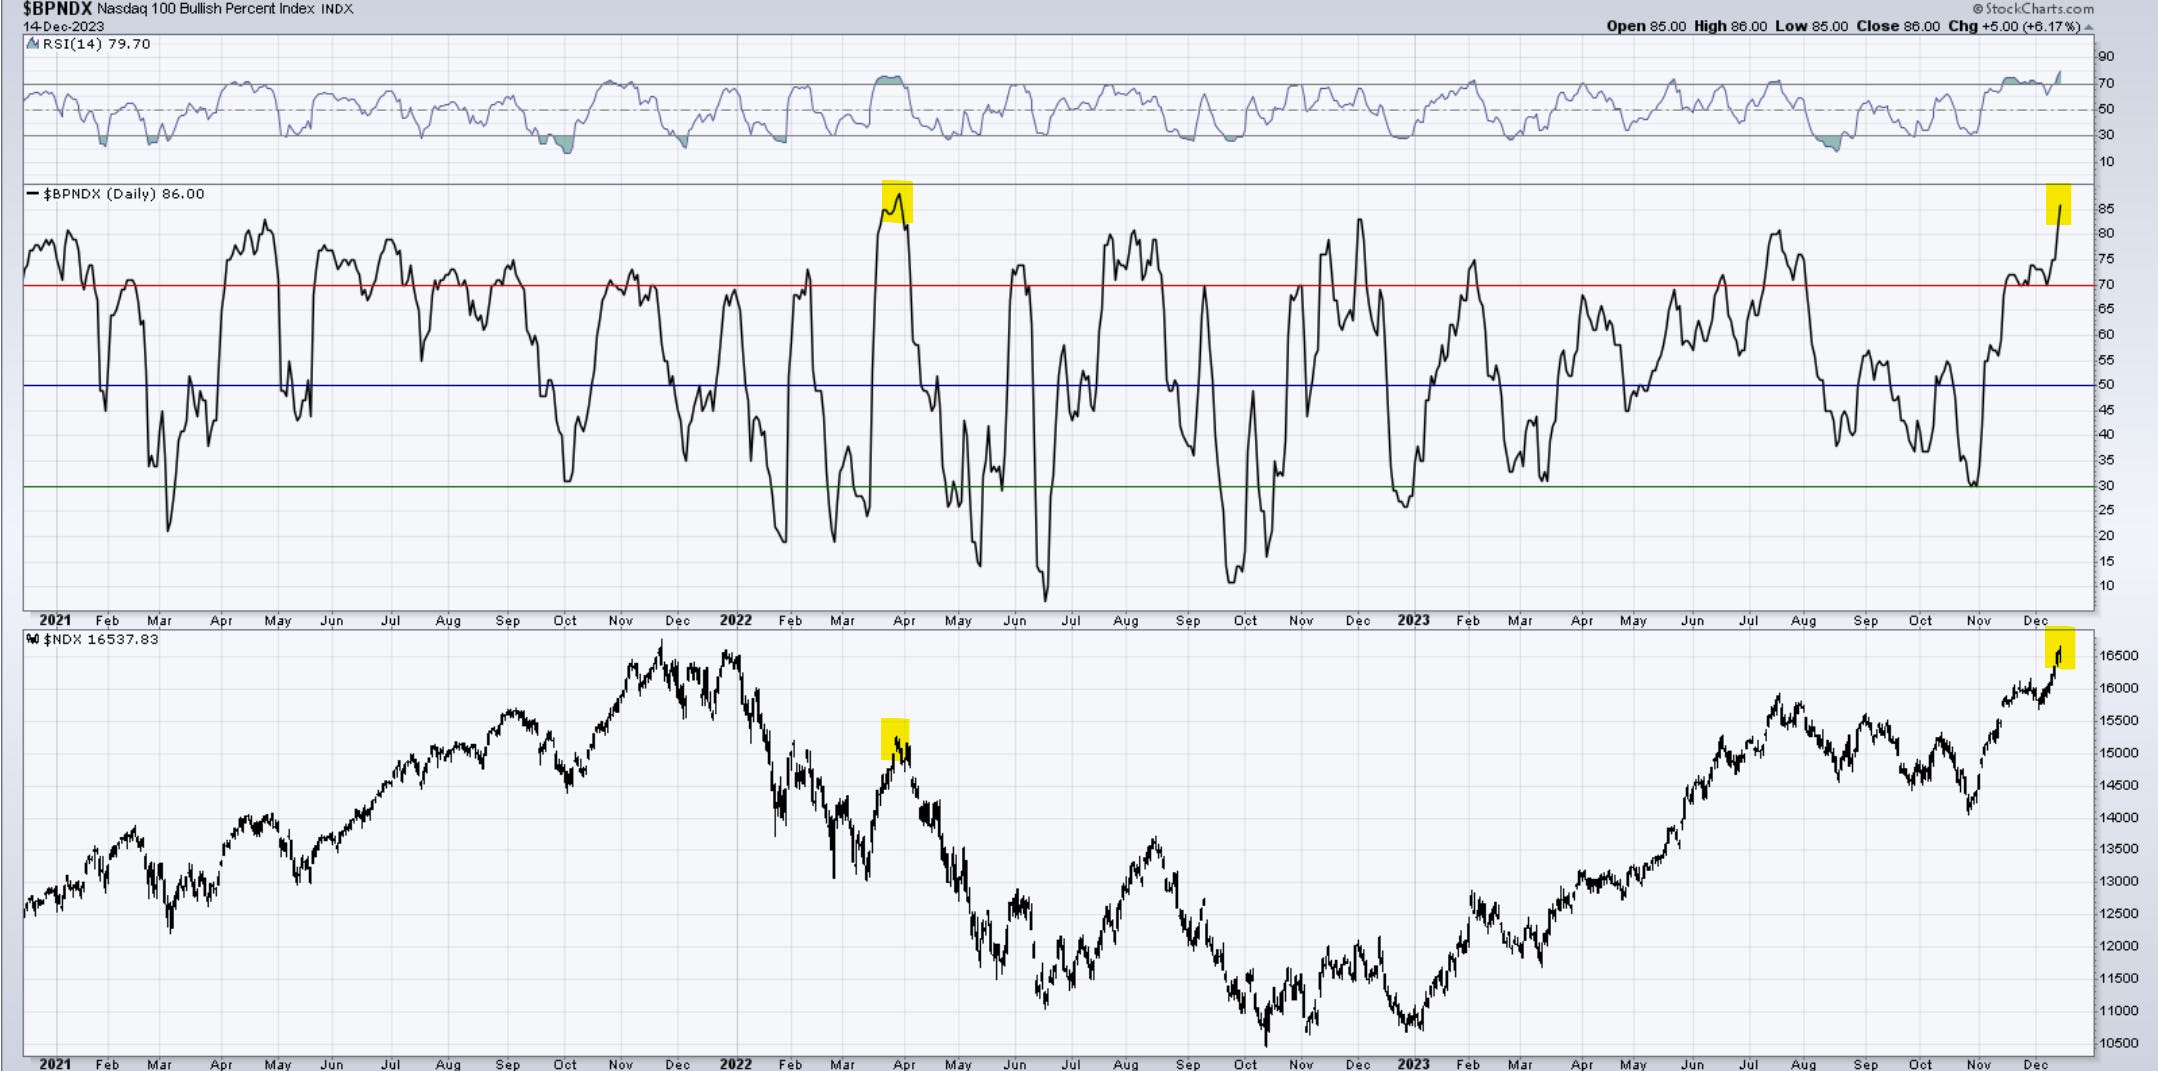
Nasdaq100
The Nasdaq had its first negative day in five days. One more push would be required to complete the sequence, but I would not be a stickler for that last little piece. If we drop below 16,357 without going higher first, that’s a major signal we have completed the upmove.
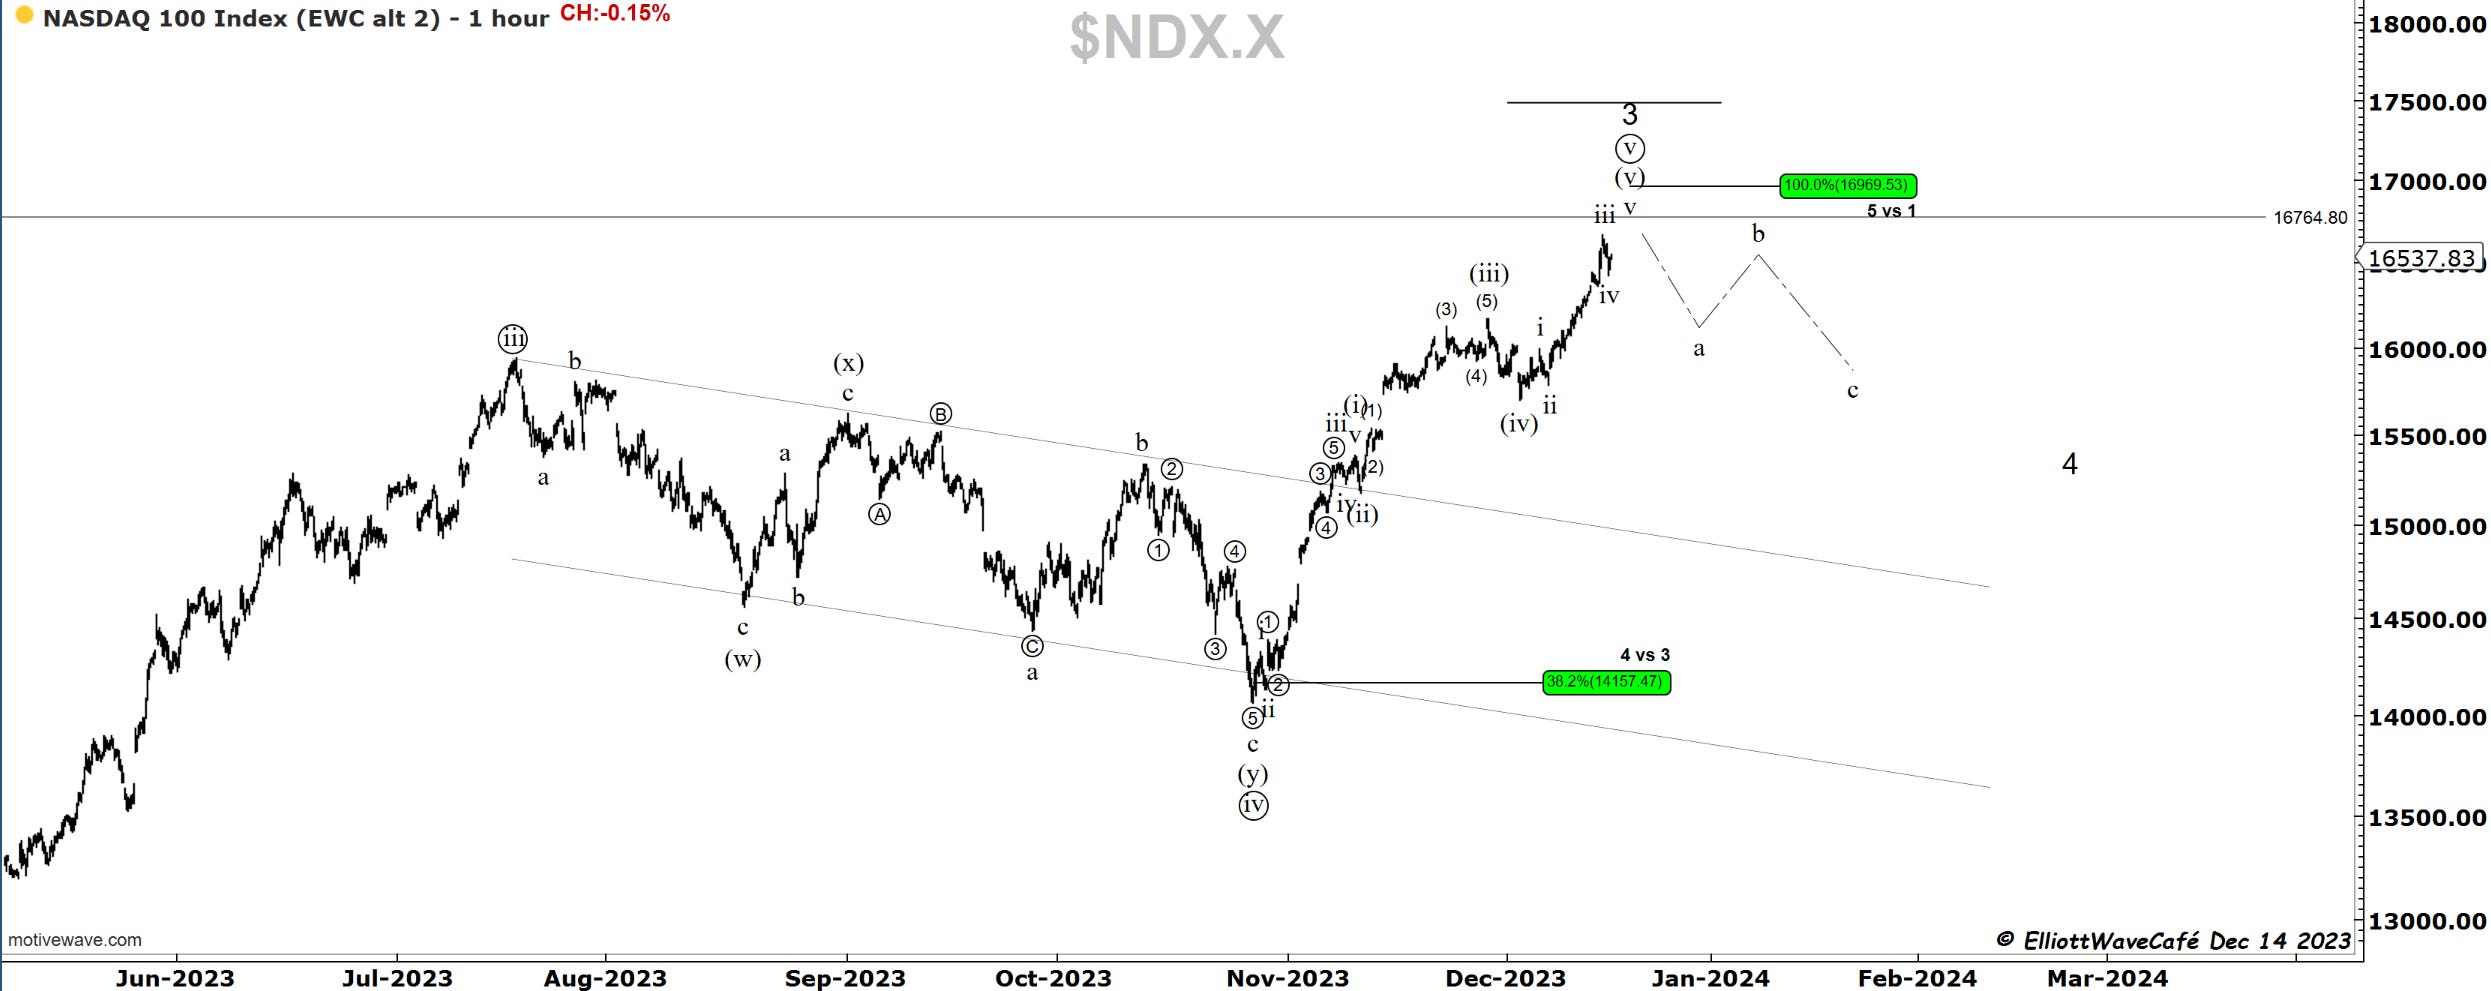
This is now quite a stretch. Check out the BPI in a territory that we have not seen since March 2022. I don’t think this is sustainable, and I would be on high alert for reversals.
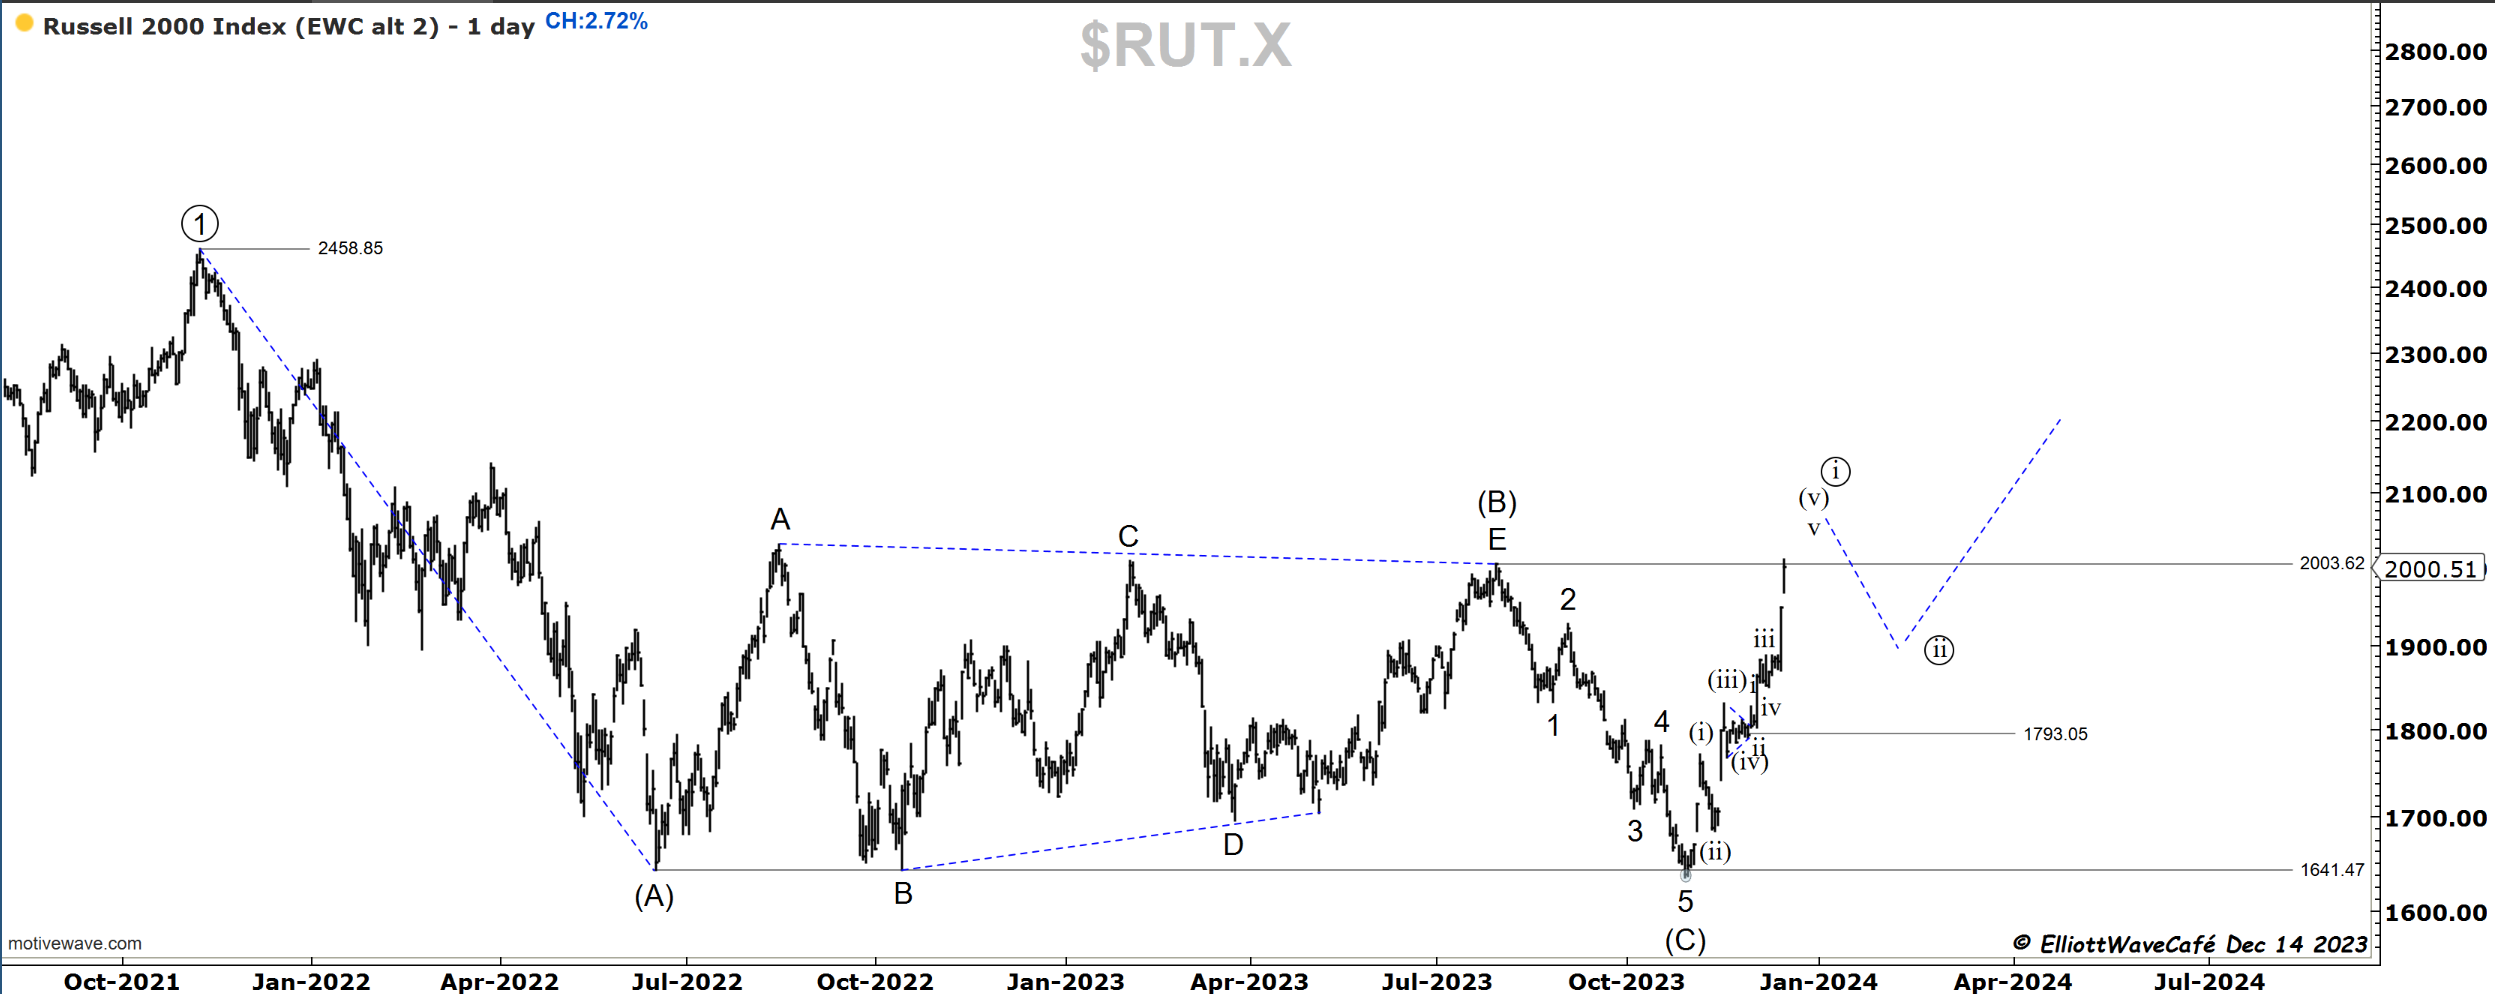
RUSSELL 2000
Small caps not kidding around. The Revenge of the Small Caps. This sector was so bad during the last 2 years that it is finally enjoying some well-deserved sunshine. There could still be a bit of gas left in the tank.
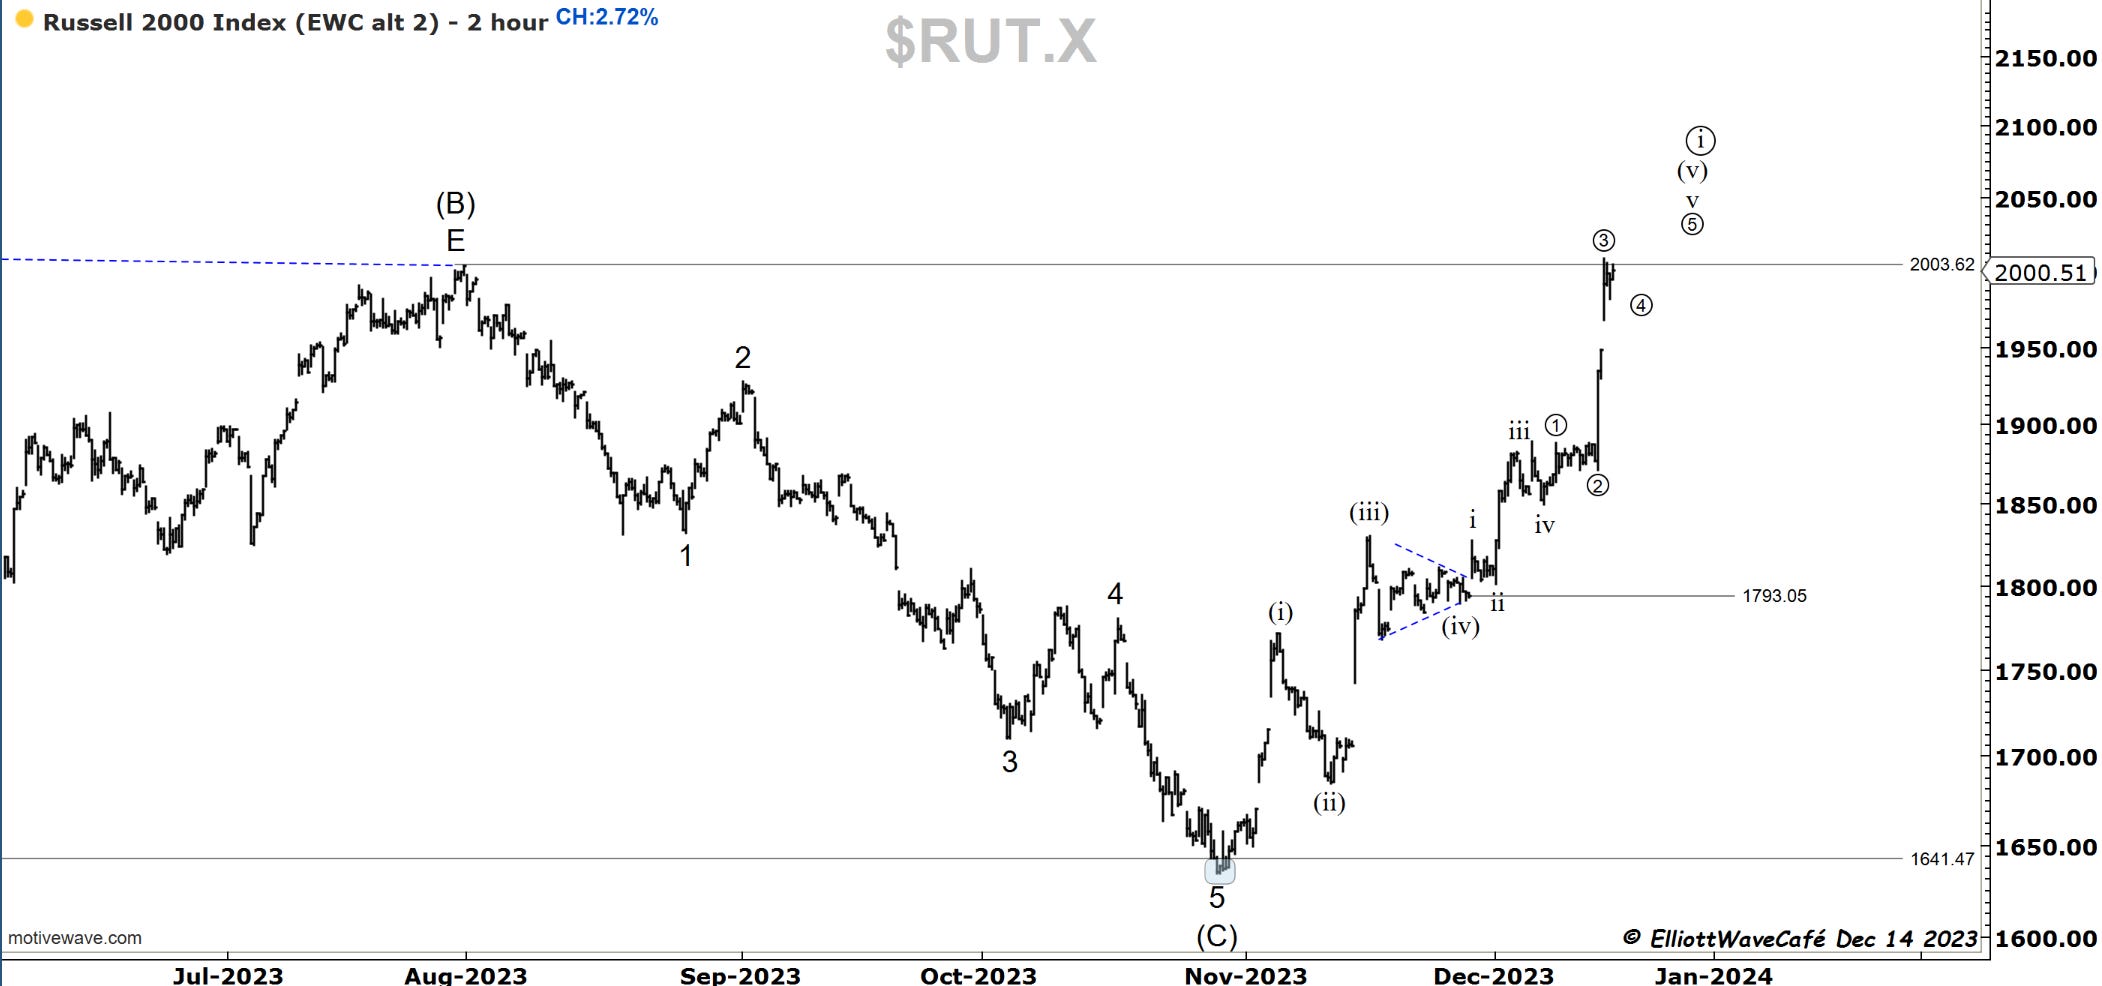
The challenge of the (B) wave highs is important. It suggests a correction (A) (B) (C) is complete. I do expect the correction in wave ((ii)) to lead to the next opportunity for longs.

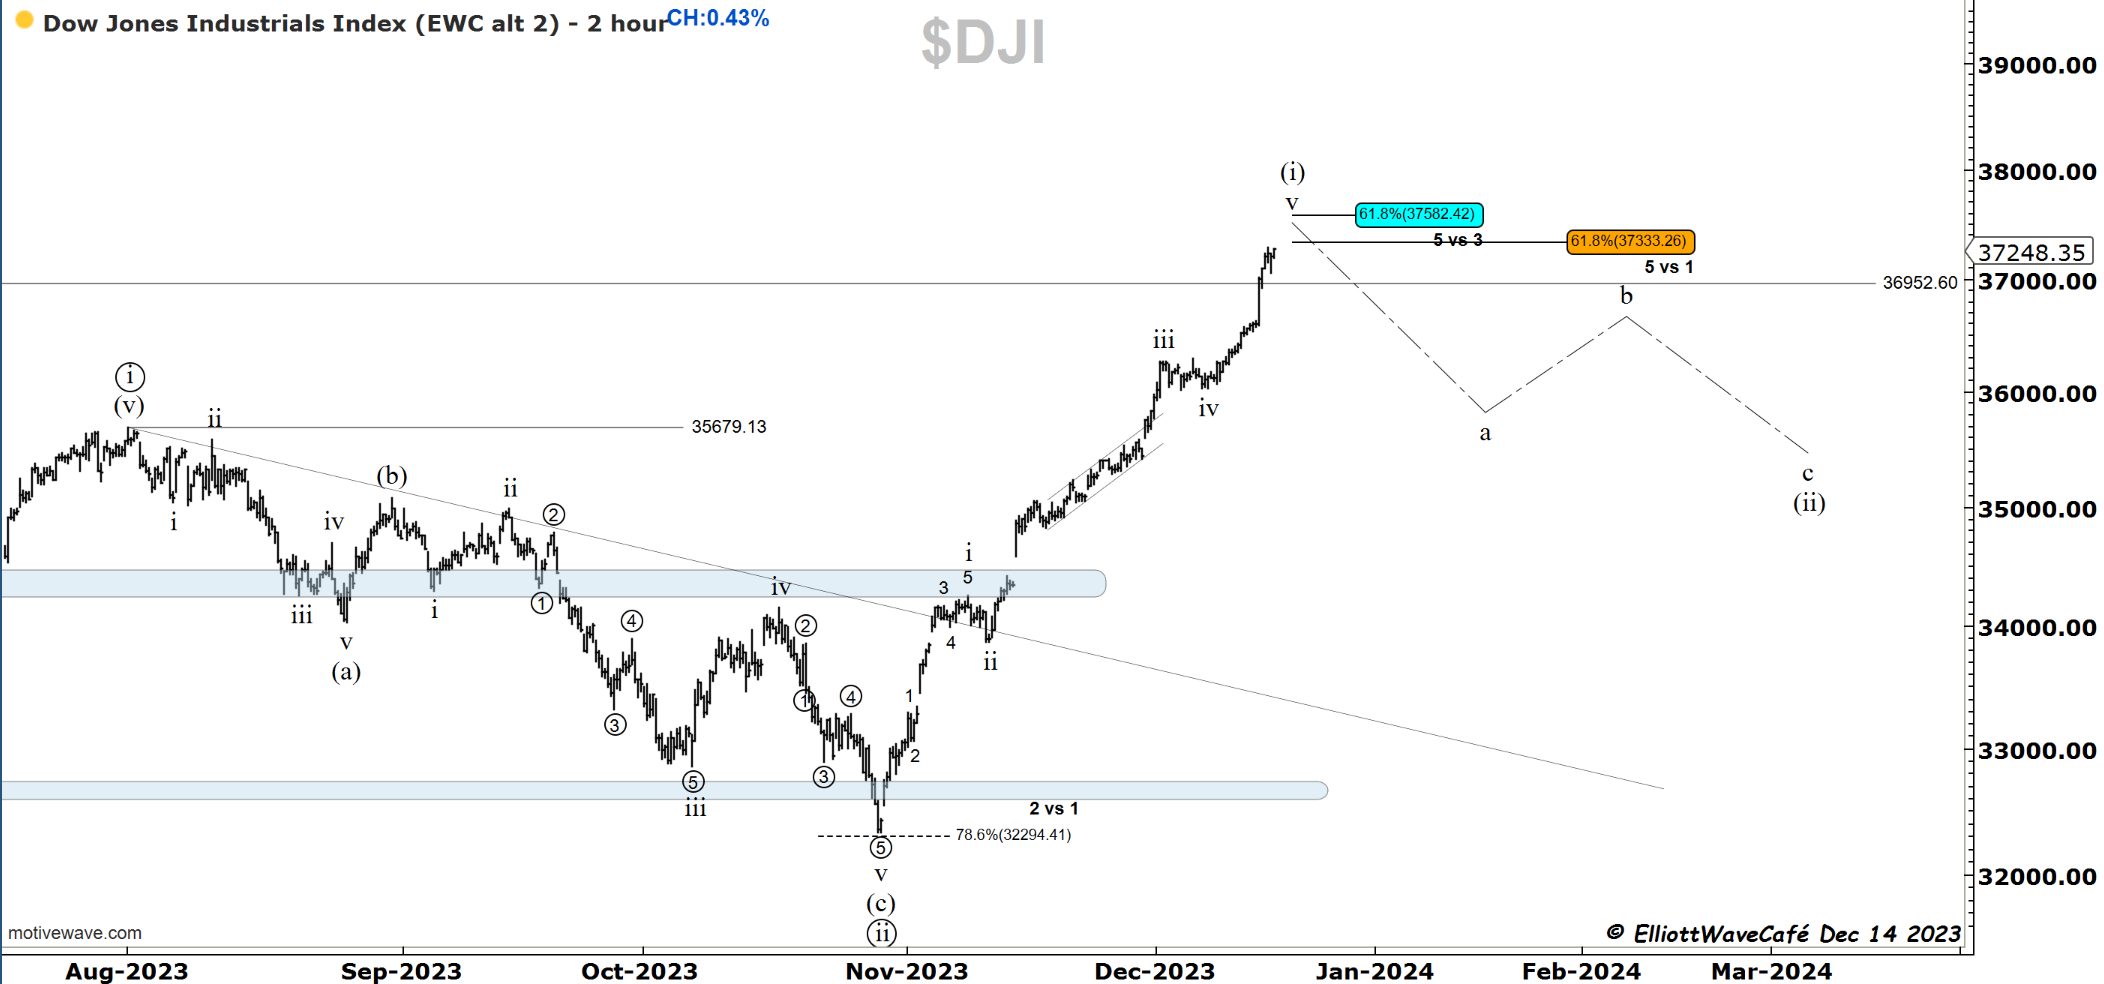
Dow30
I have placed the confluence zones for wave v. You can see how both 5 vs. 1 and 5 vs. 3 come in very close to each other. The market tends to respect fibs that come in the same areas. I remain on high alert for an appropriate correction.
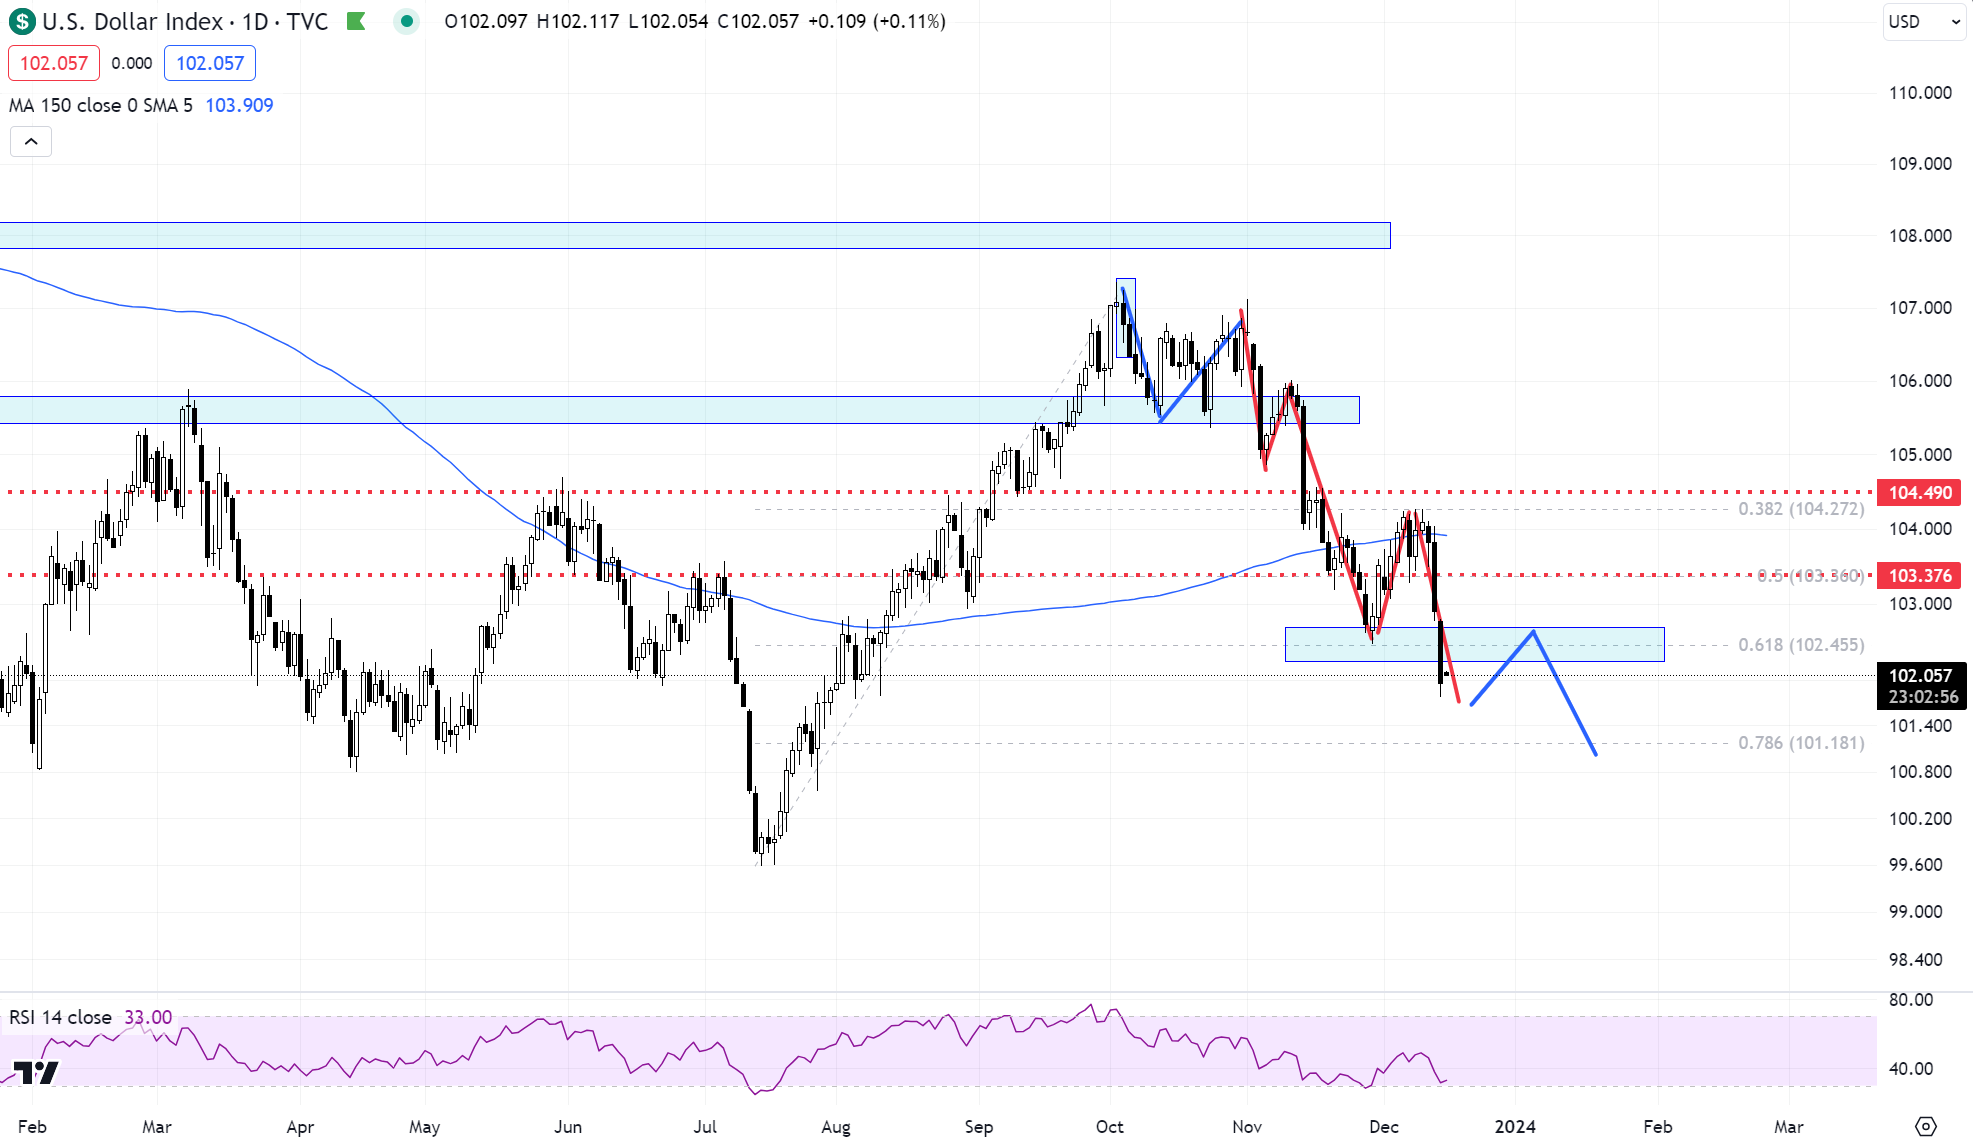
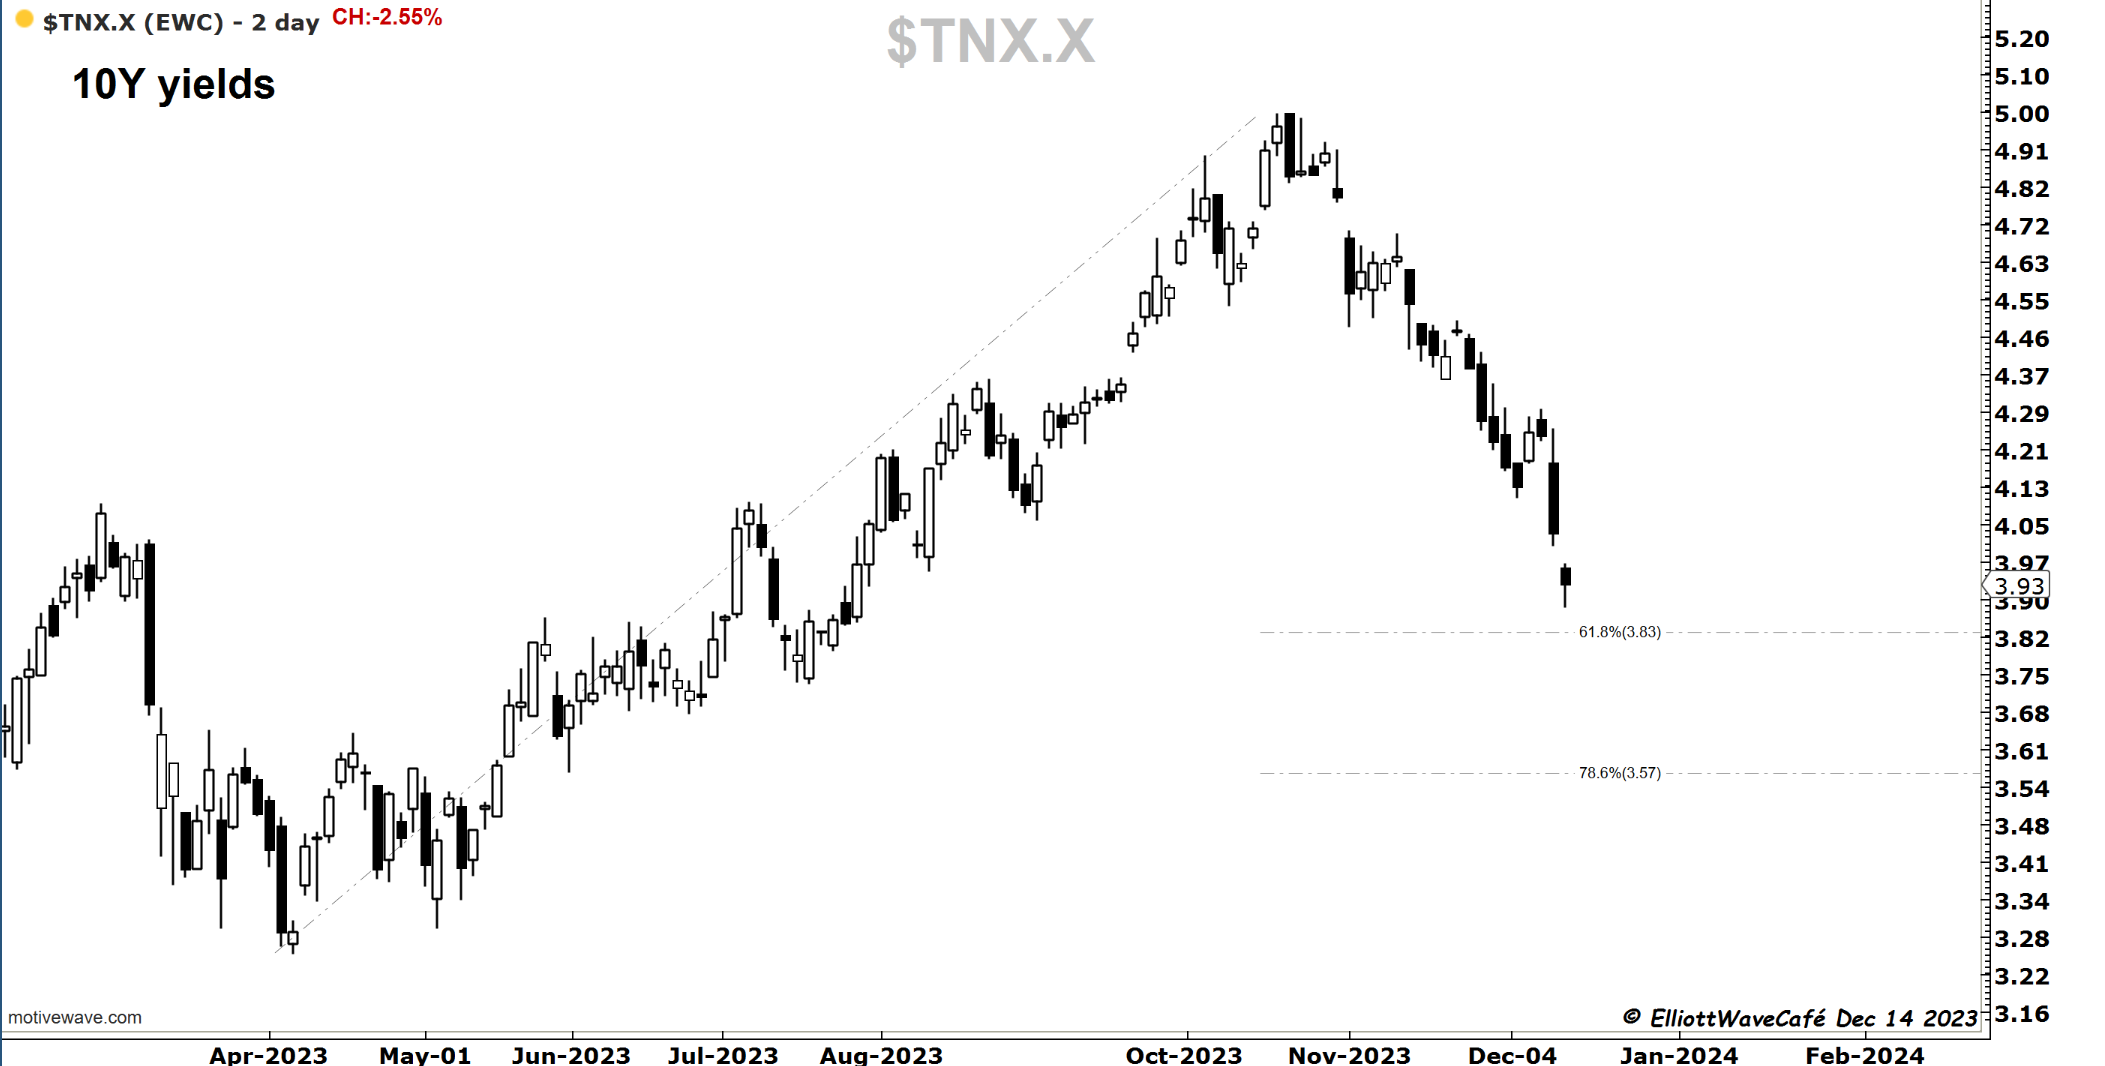
US Dollar and Yields
The dollar continued to fall out of bed with the drop in yields. A 5 wave can be counted in red inside the larger blue wave. Big levels are coming in just above 100.
Looks like it did not take that long to get to 61.8%. I have high confidence that the market will pay attention to these levels in yields. A move back above 4%, even towards 4.3, is cooking in the oven.
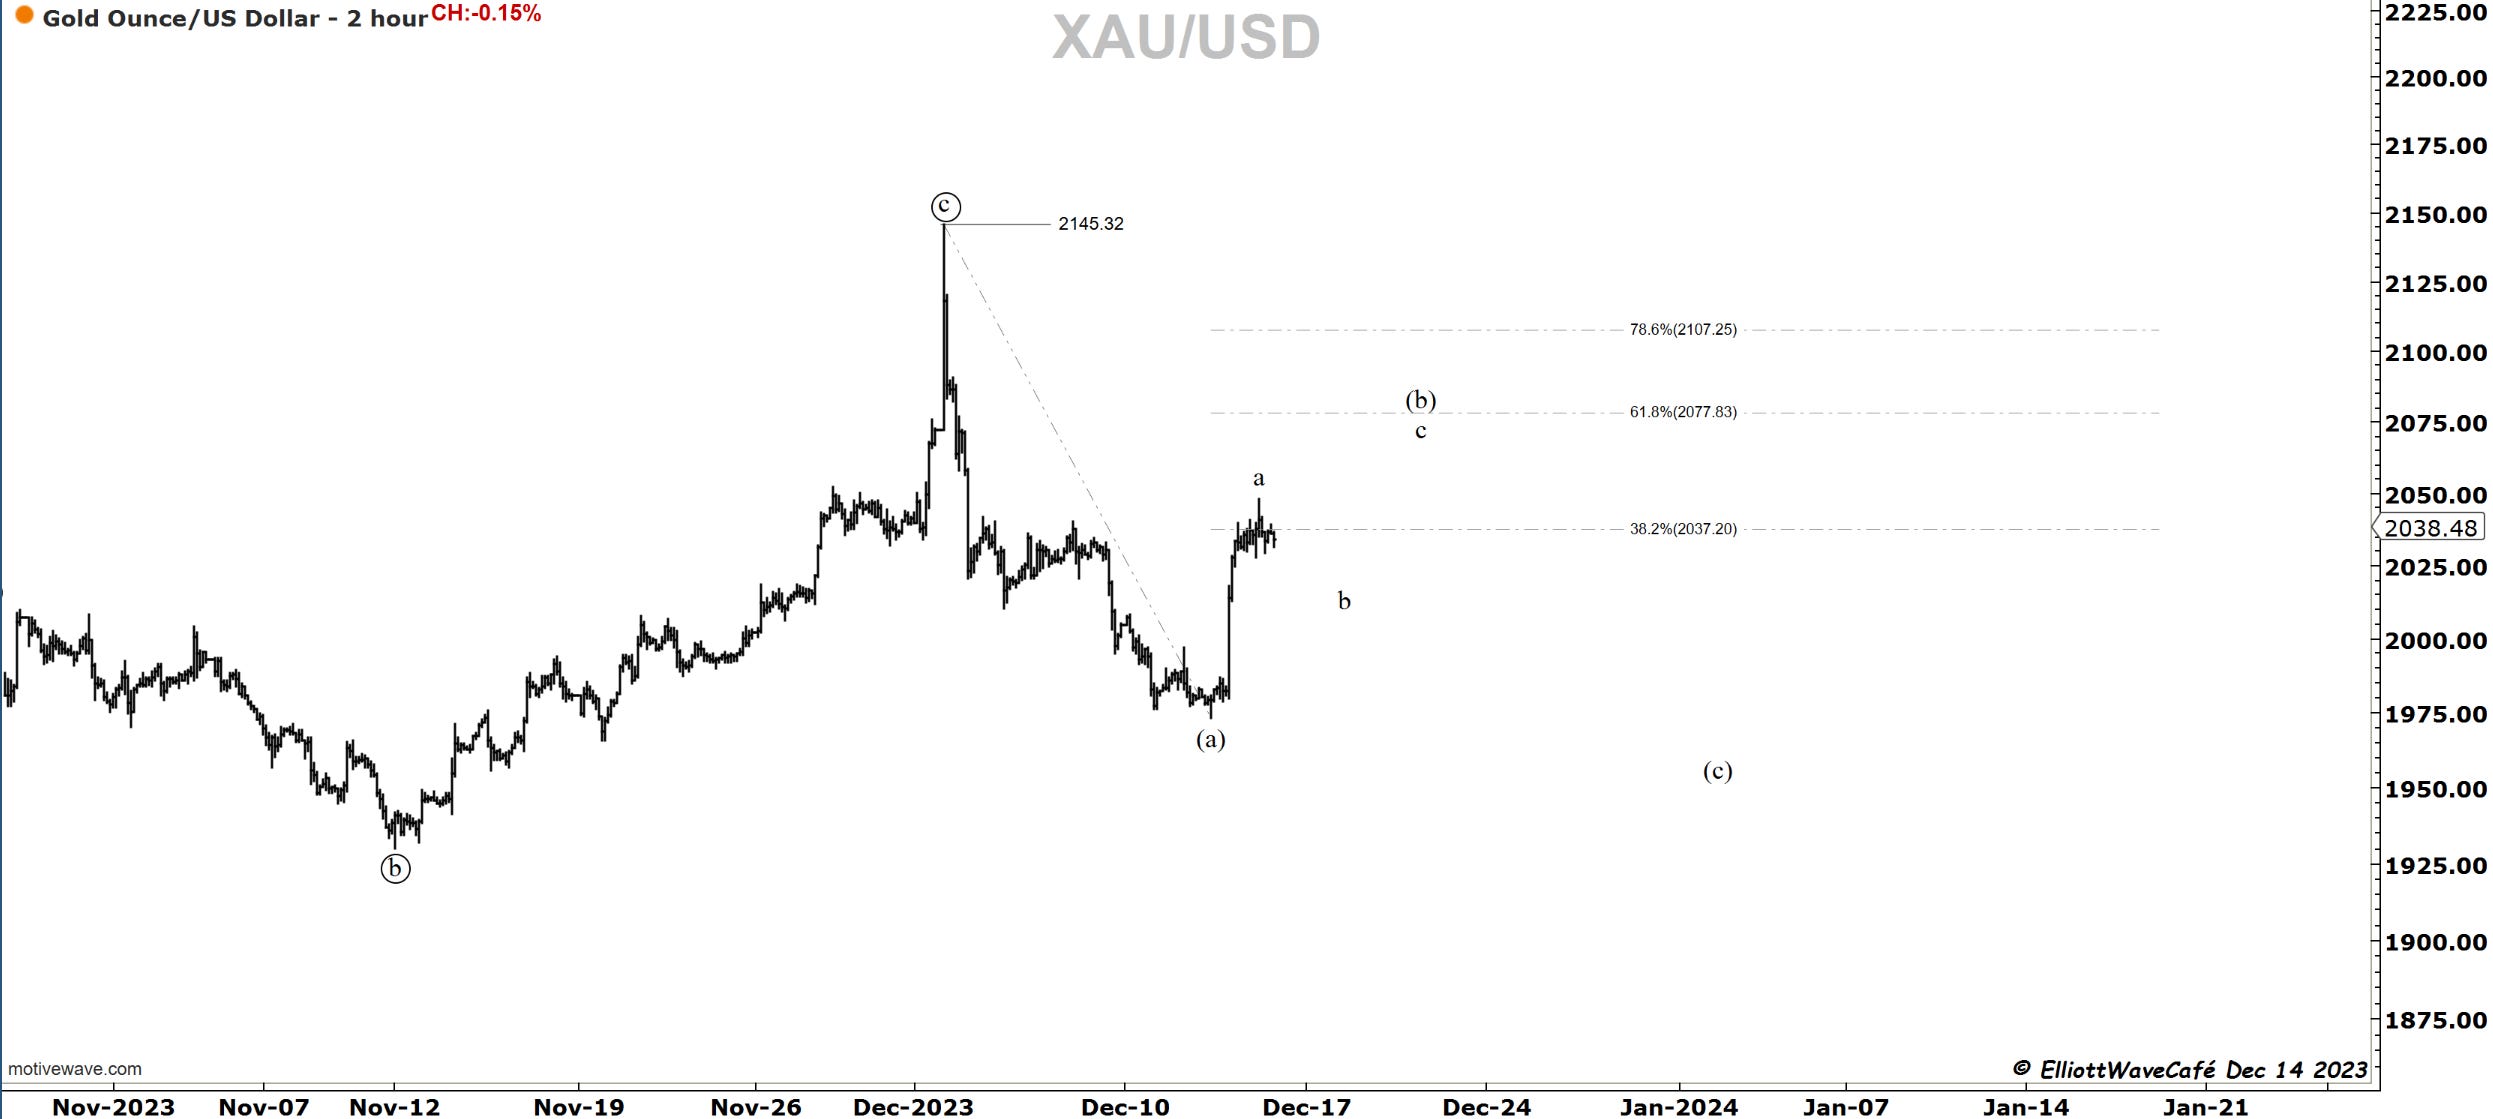
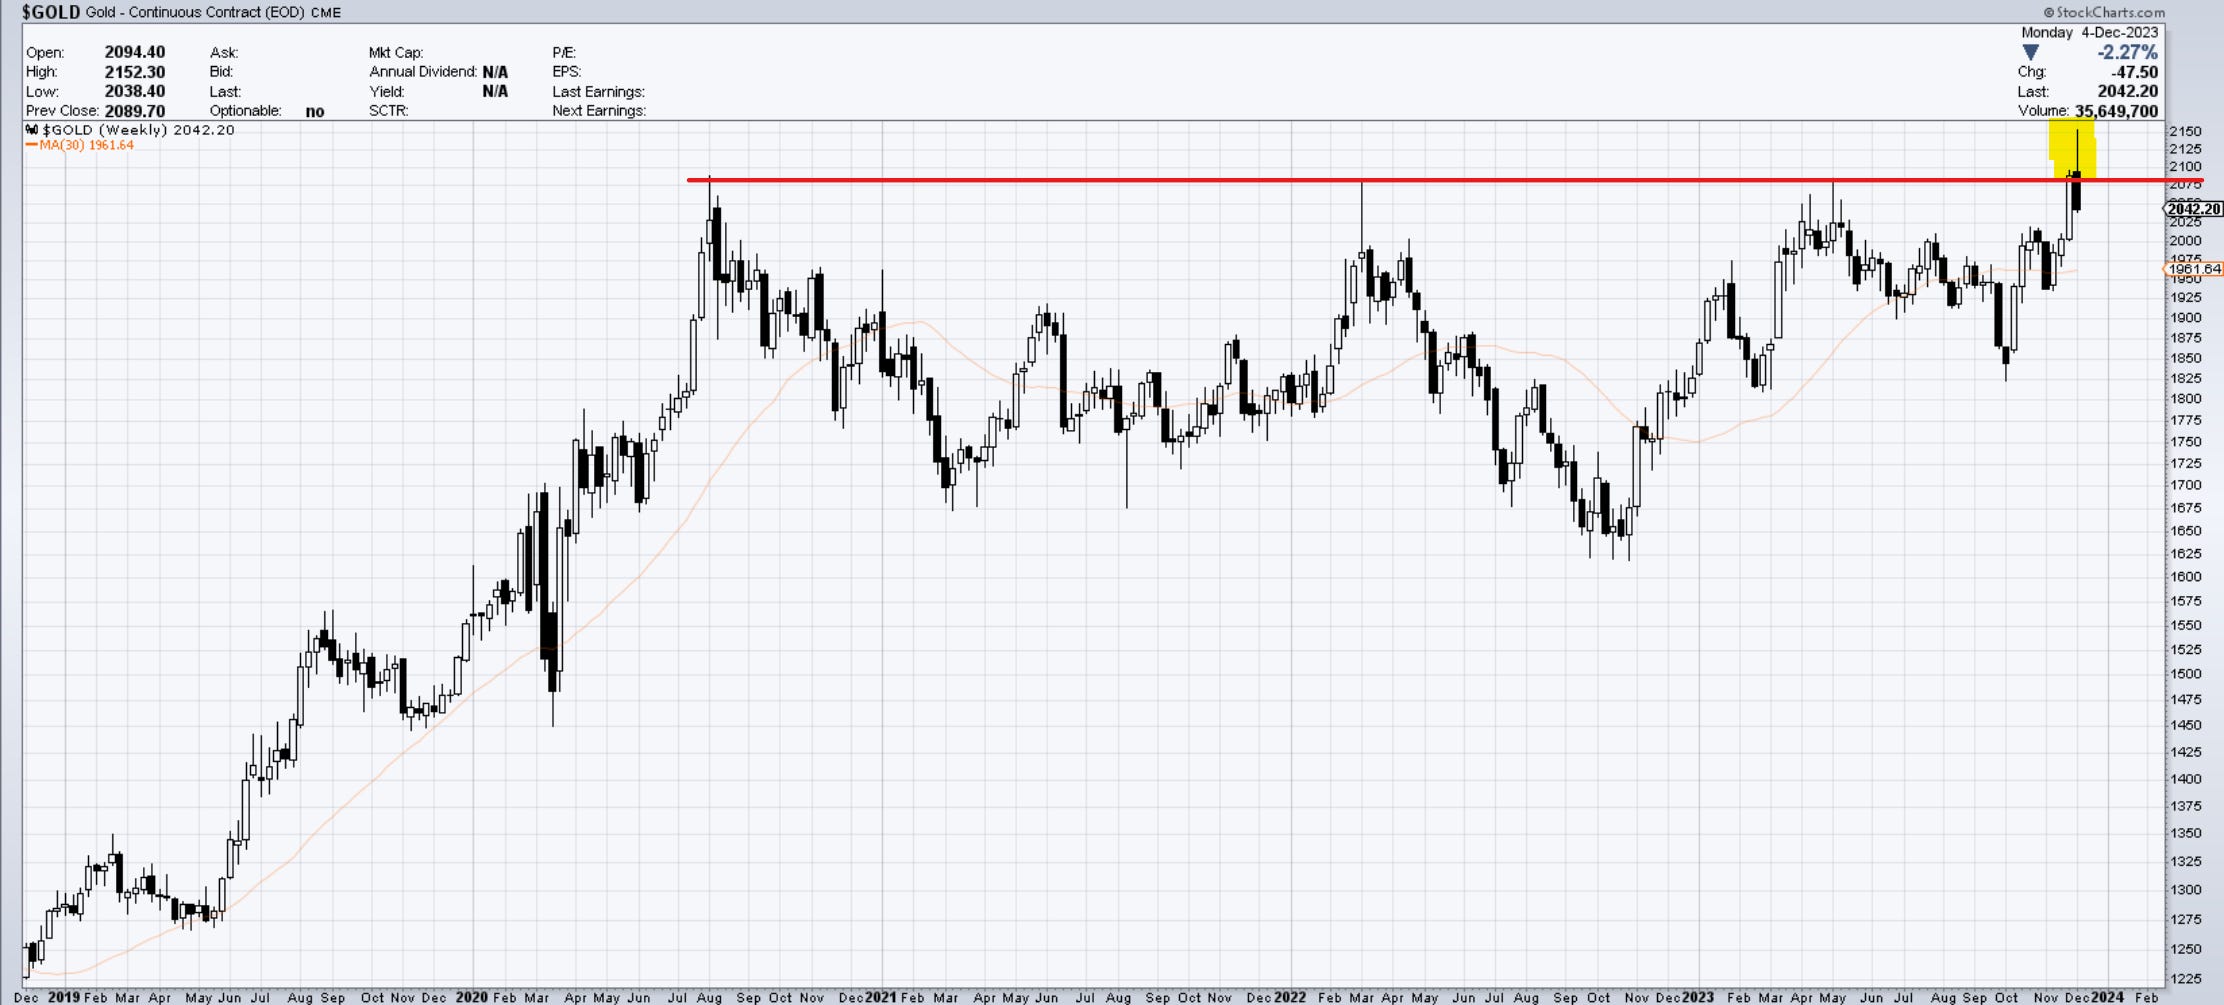
Gold
I will keep an eye on gold on the short-term variations for now since the larger picture has muddied with the failed breakout on weekly. After an impulsive decline, we seem to be correcting higher. An impulse of the lows is wave a. Let’s see if it gives us a zigzag.
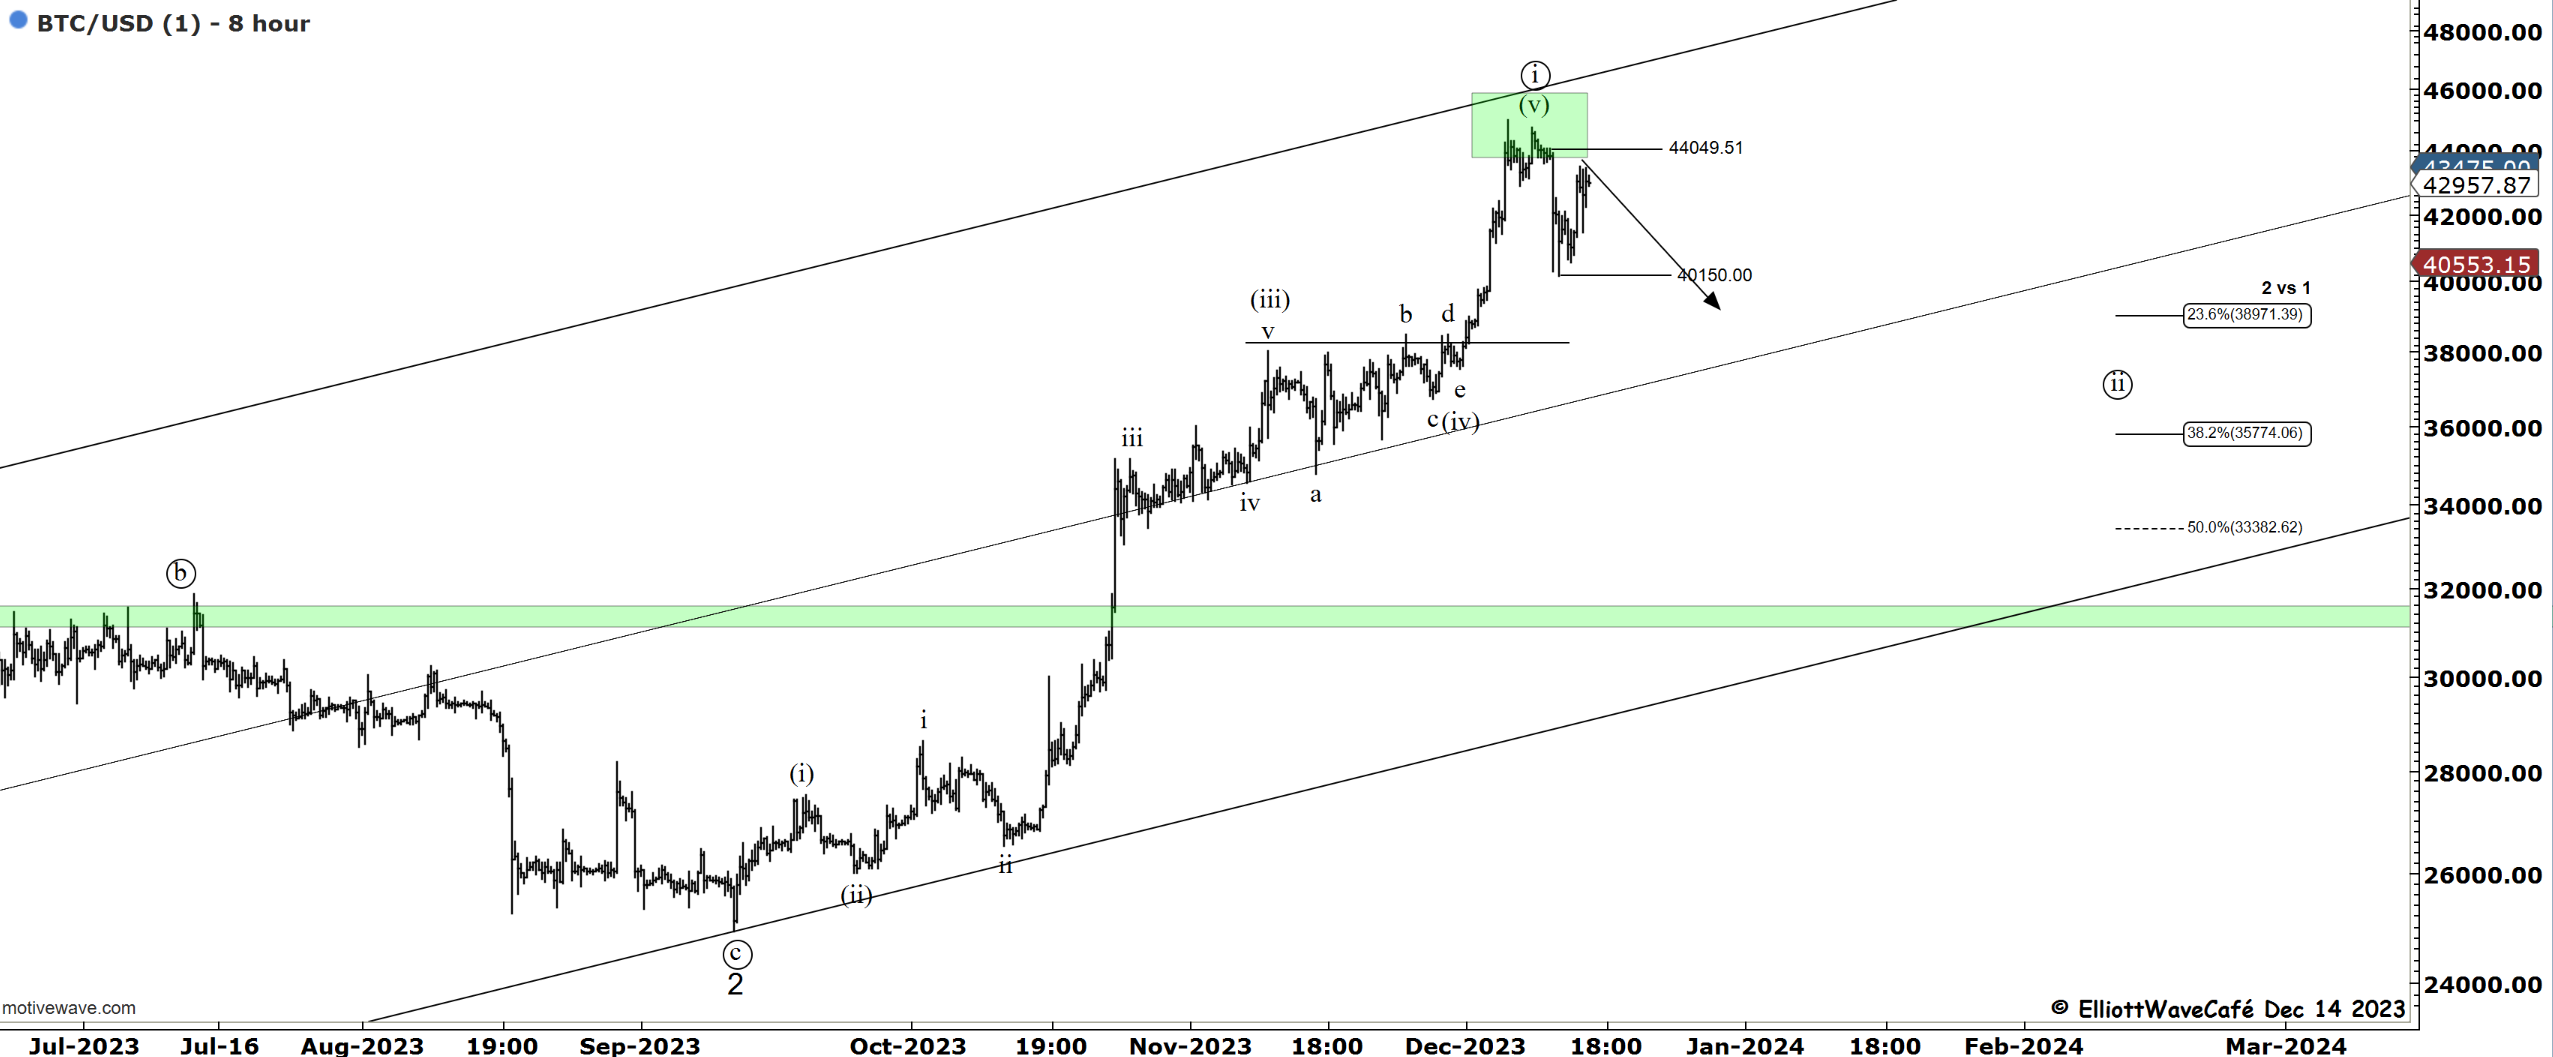
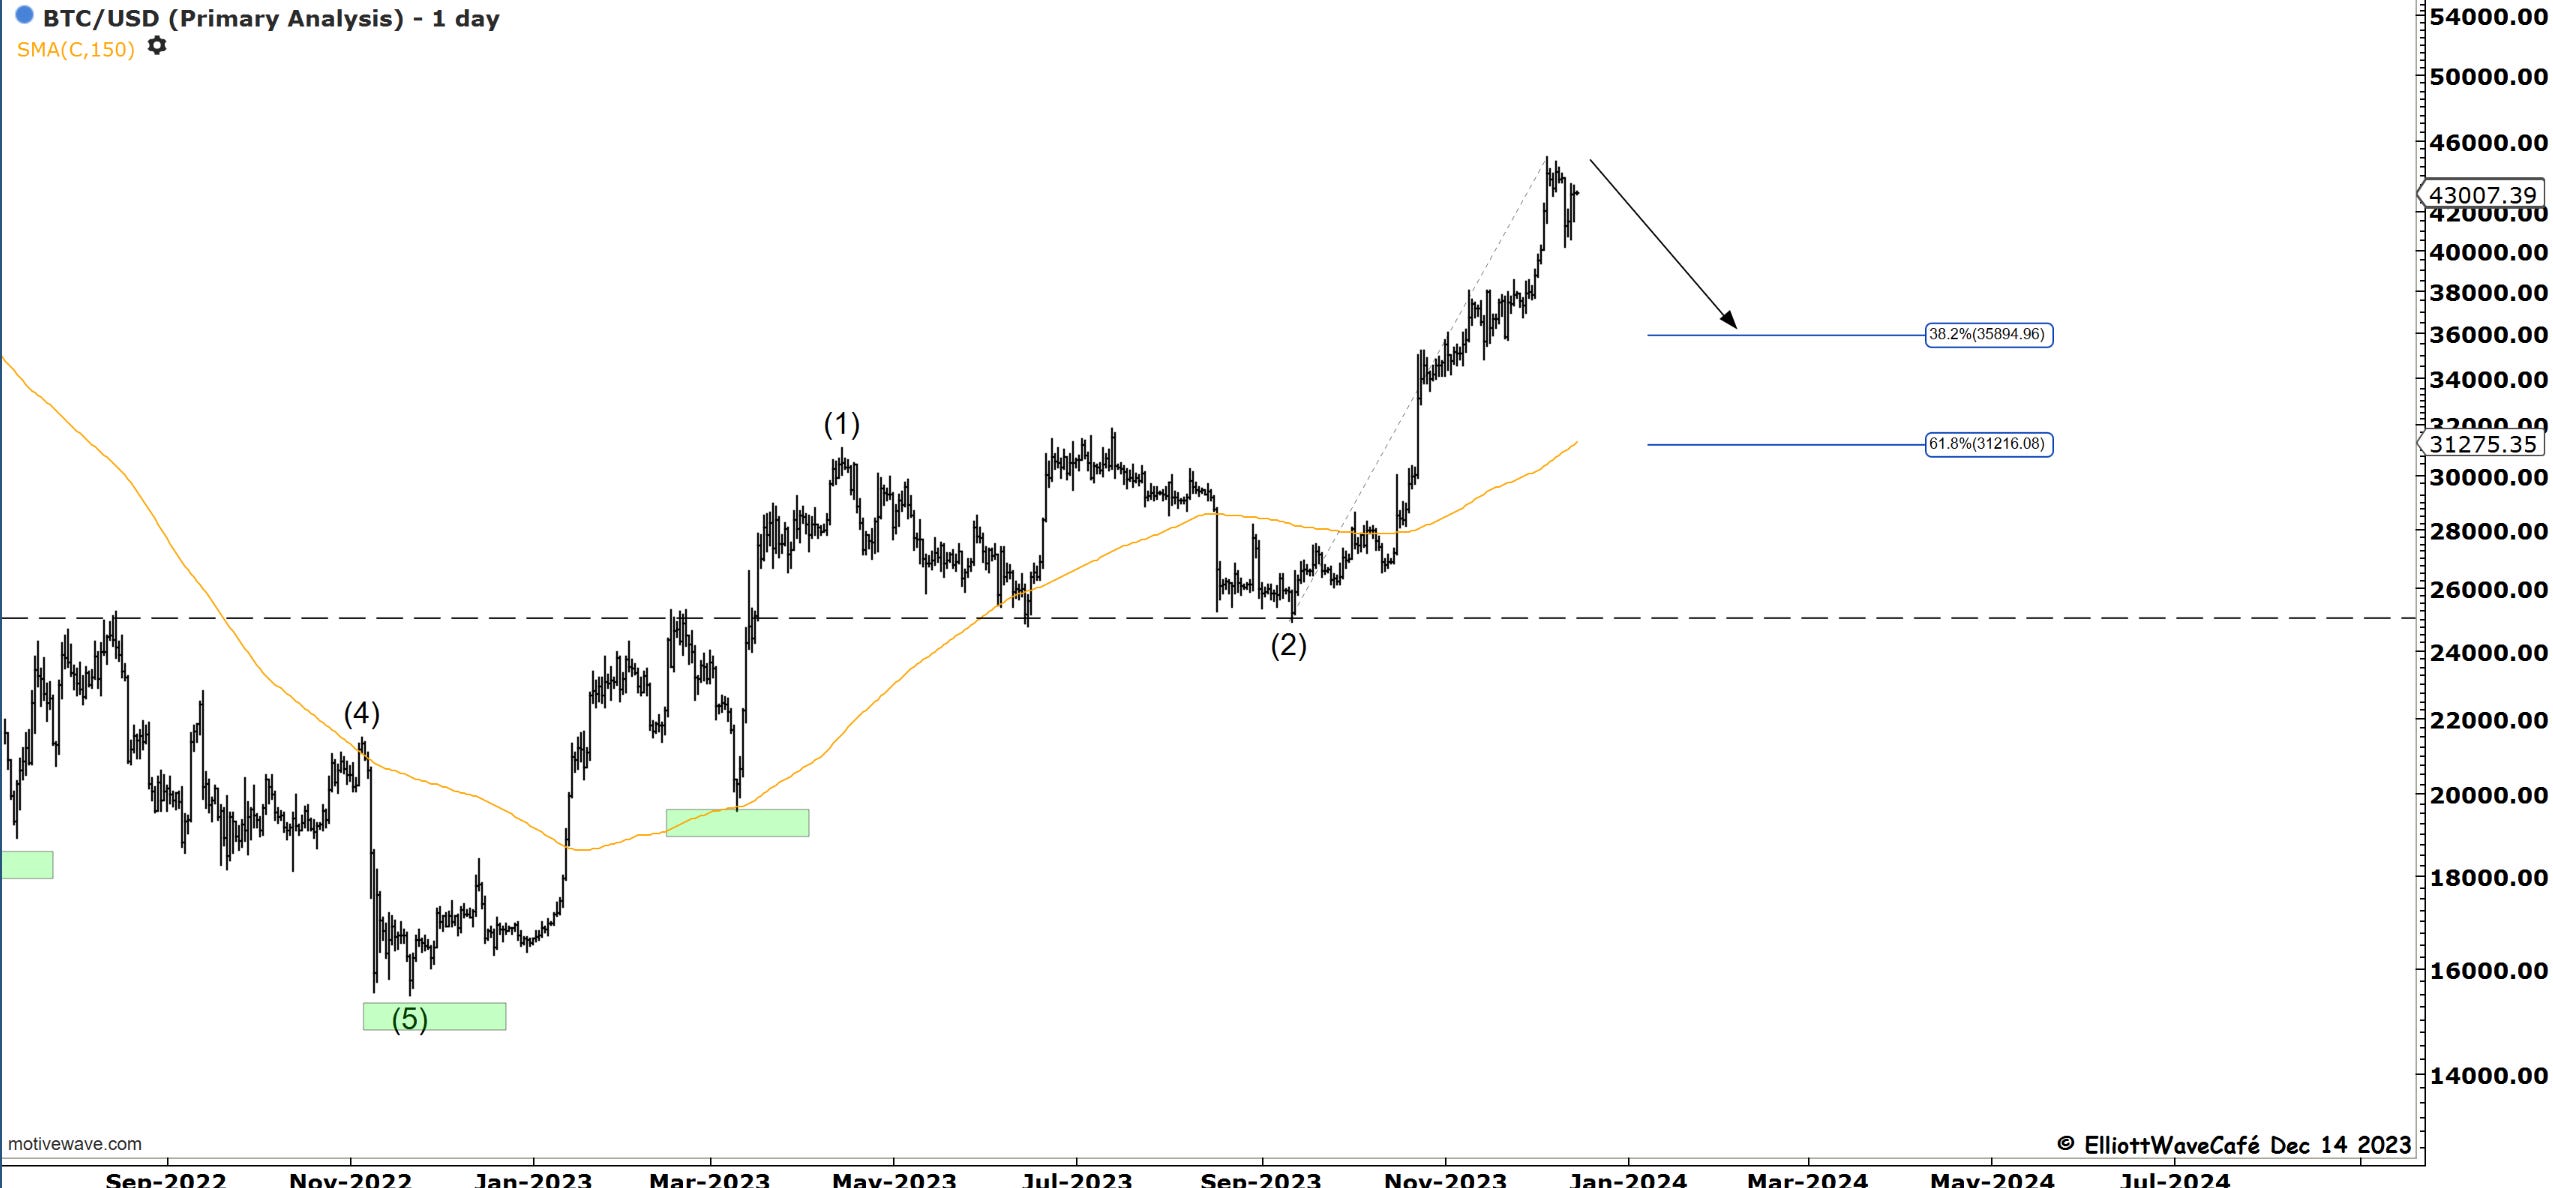
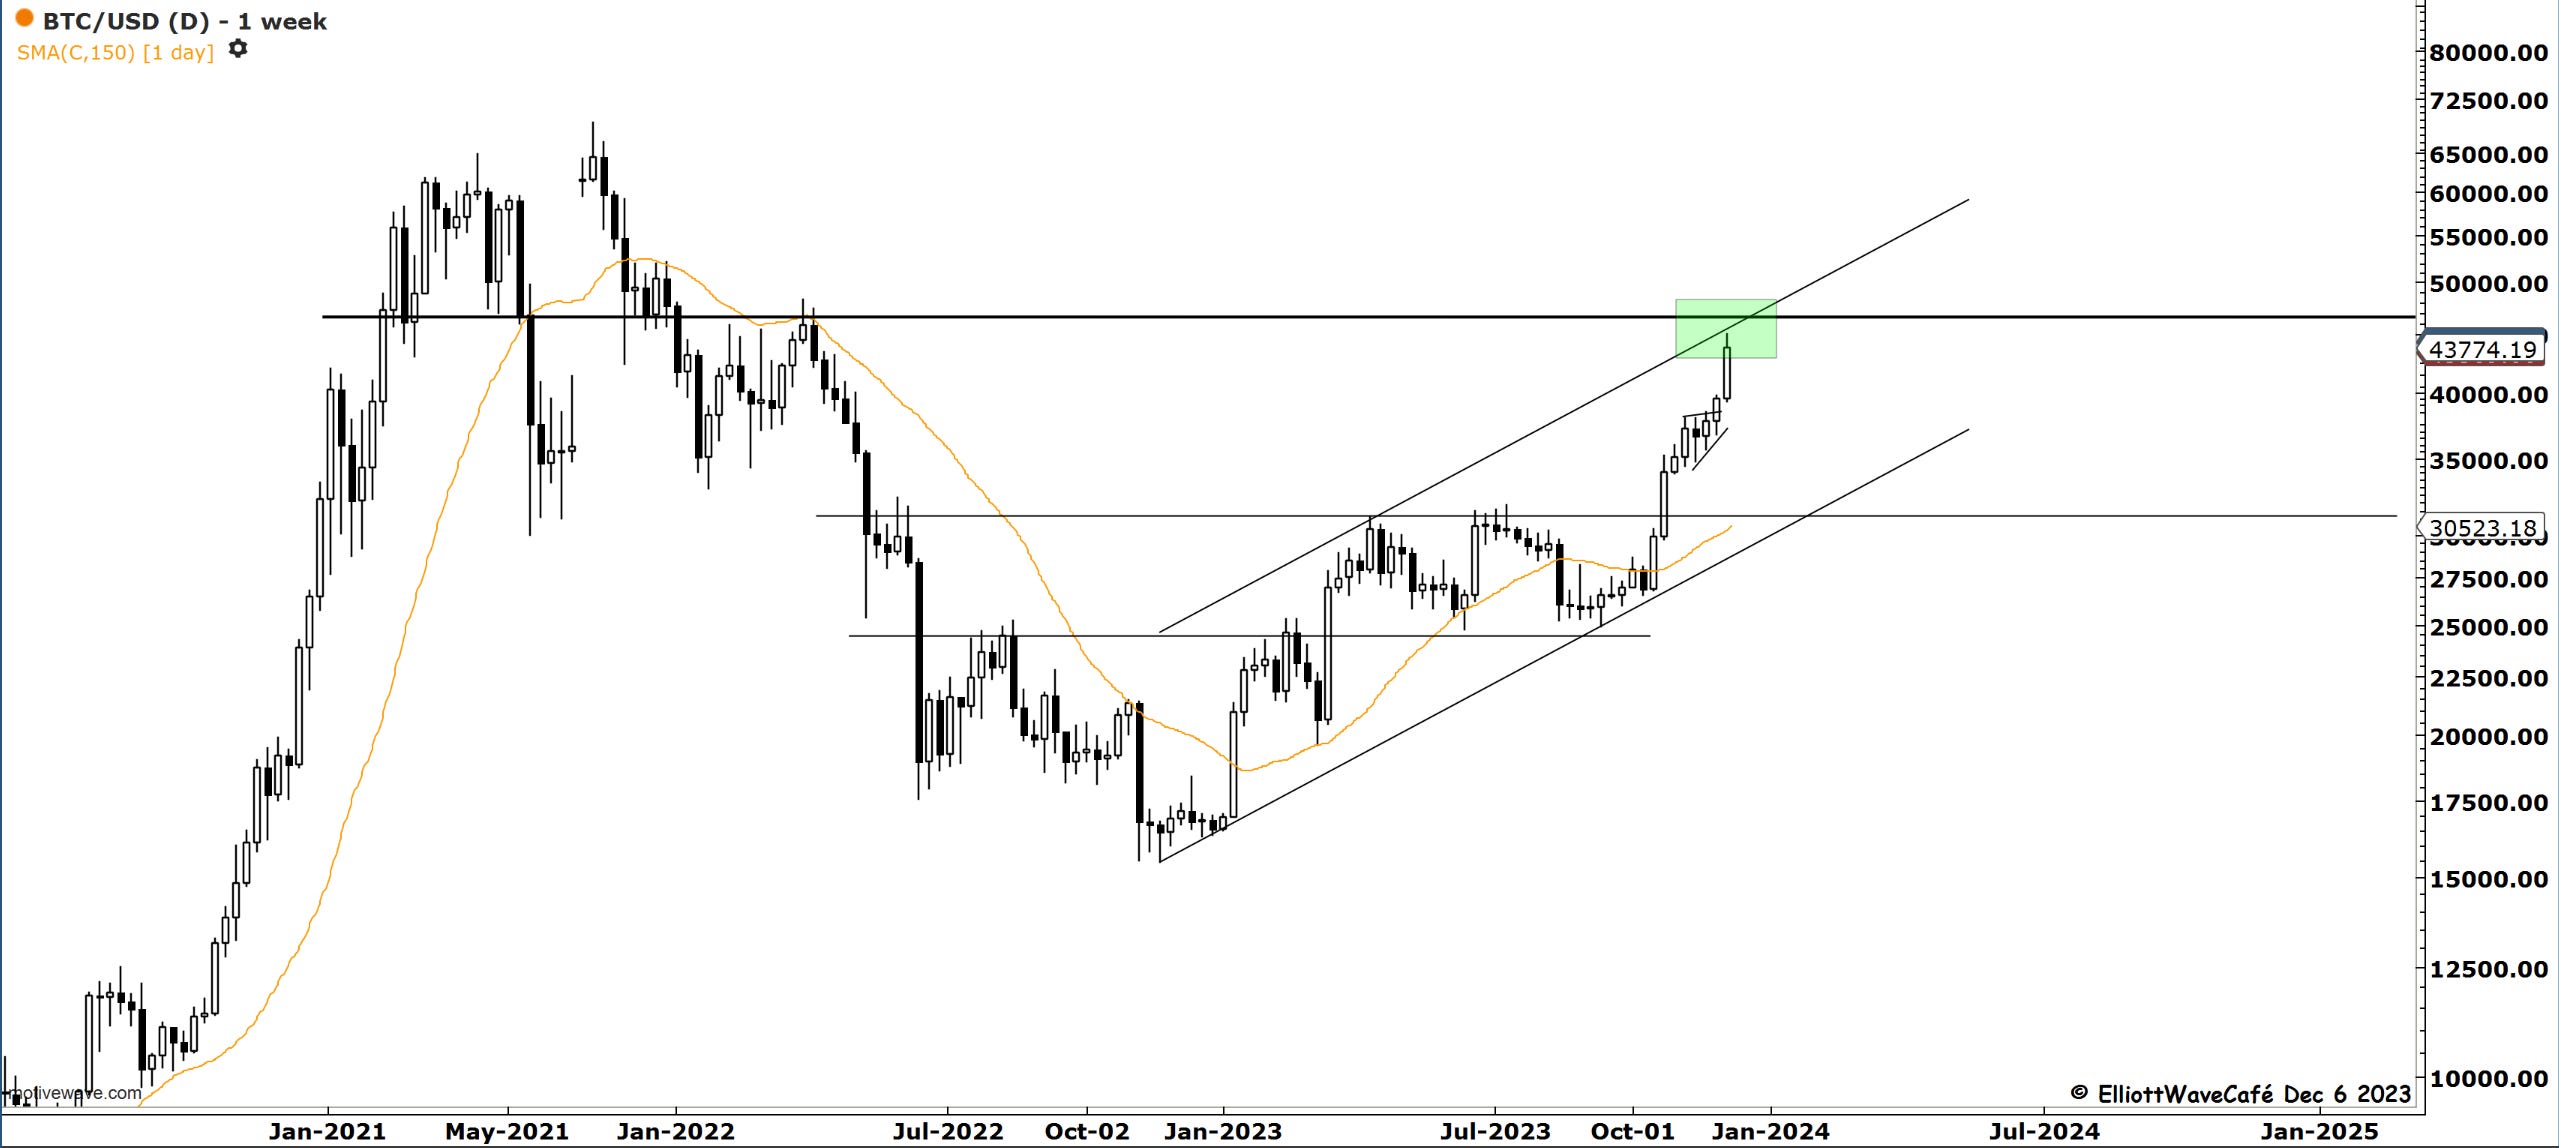
Bitcoin
This asset continues to struggle to keep the flow going. My view remains that a period of correction has started to take place. Once we have better counting clarity internally, I will also show shorter time frames.
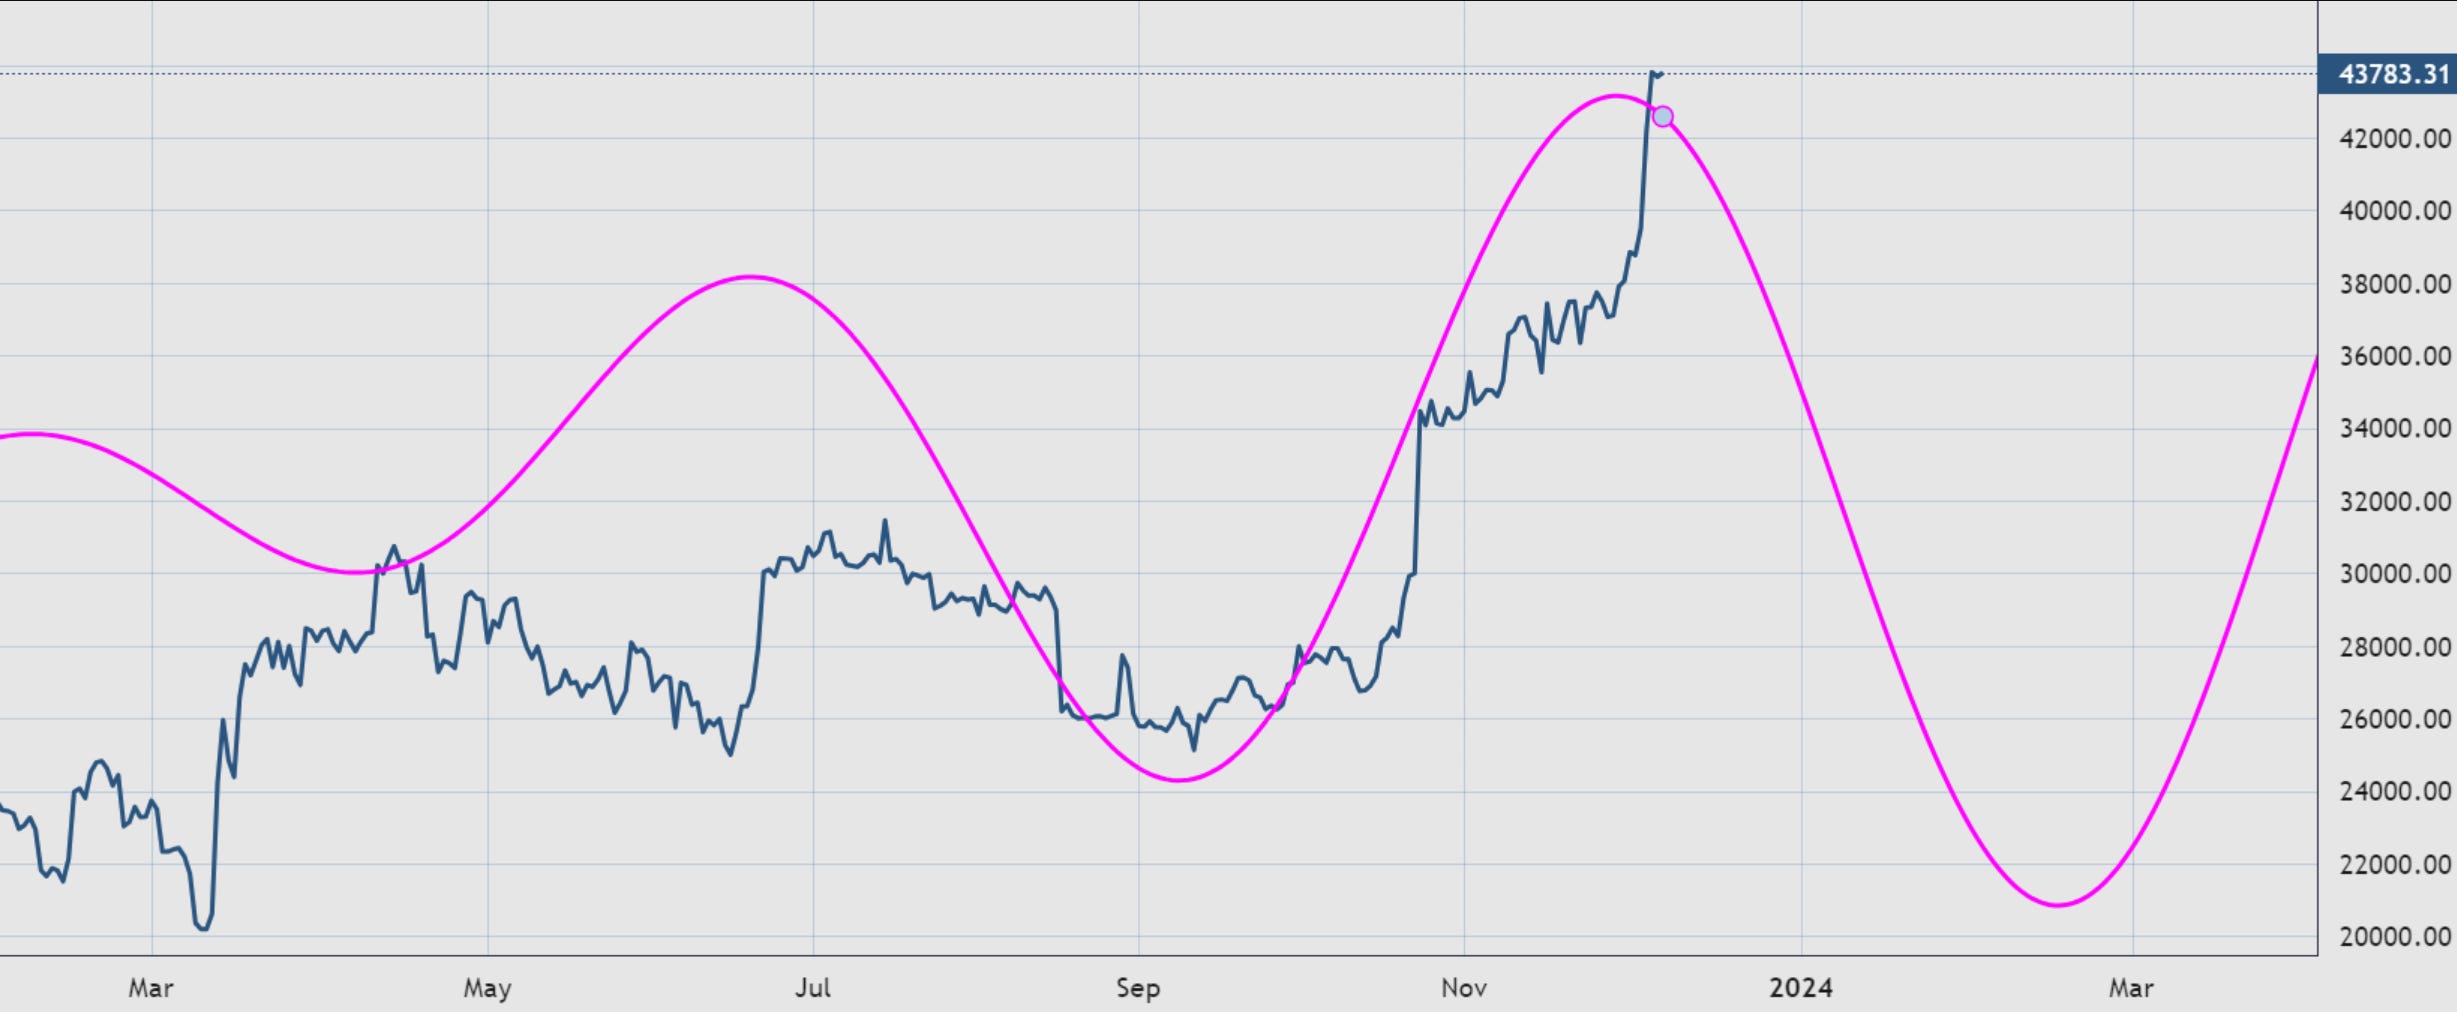
Here is the 150-180 day cycle in BTC suggesting a likely period of weakness upcoming. The depth of the correction is not what we’re looking for here but rather time spent on it.
“Double shot” Daily video coming up next,
Have a great day wherever you are! - trade well, and don’t forget to subscribe and drop a like if this letter helps you in any way.
Cris
email: ewcafe@pm.me