
The Daily Drip
Core markets charts updates and commentary
Note: The counts on the right edge are real-time, and they are prone to adjustments as price action develops. Elliott Wave has a fluid approach, is evidence-based, and requires constant monitoring of certain thresholds.
In the counts below, this (( )) = circle on chart
SP500
The session began on the timid side but accelerated higher as the day went on. We ended up near the end of Dec highs, putting my suggested count under pressure. As long as we stay below the top, the count is valid, but that does not make it a high confidence anymore. I have placed some alternate labels suggesting something I have discussed before. A larger wave (iv) with a (v) to come.
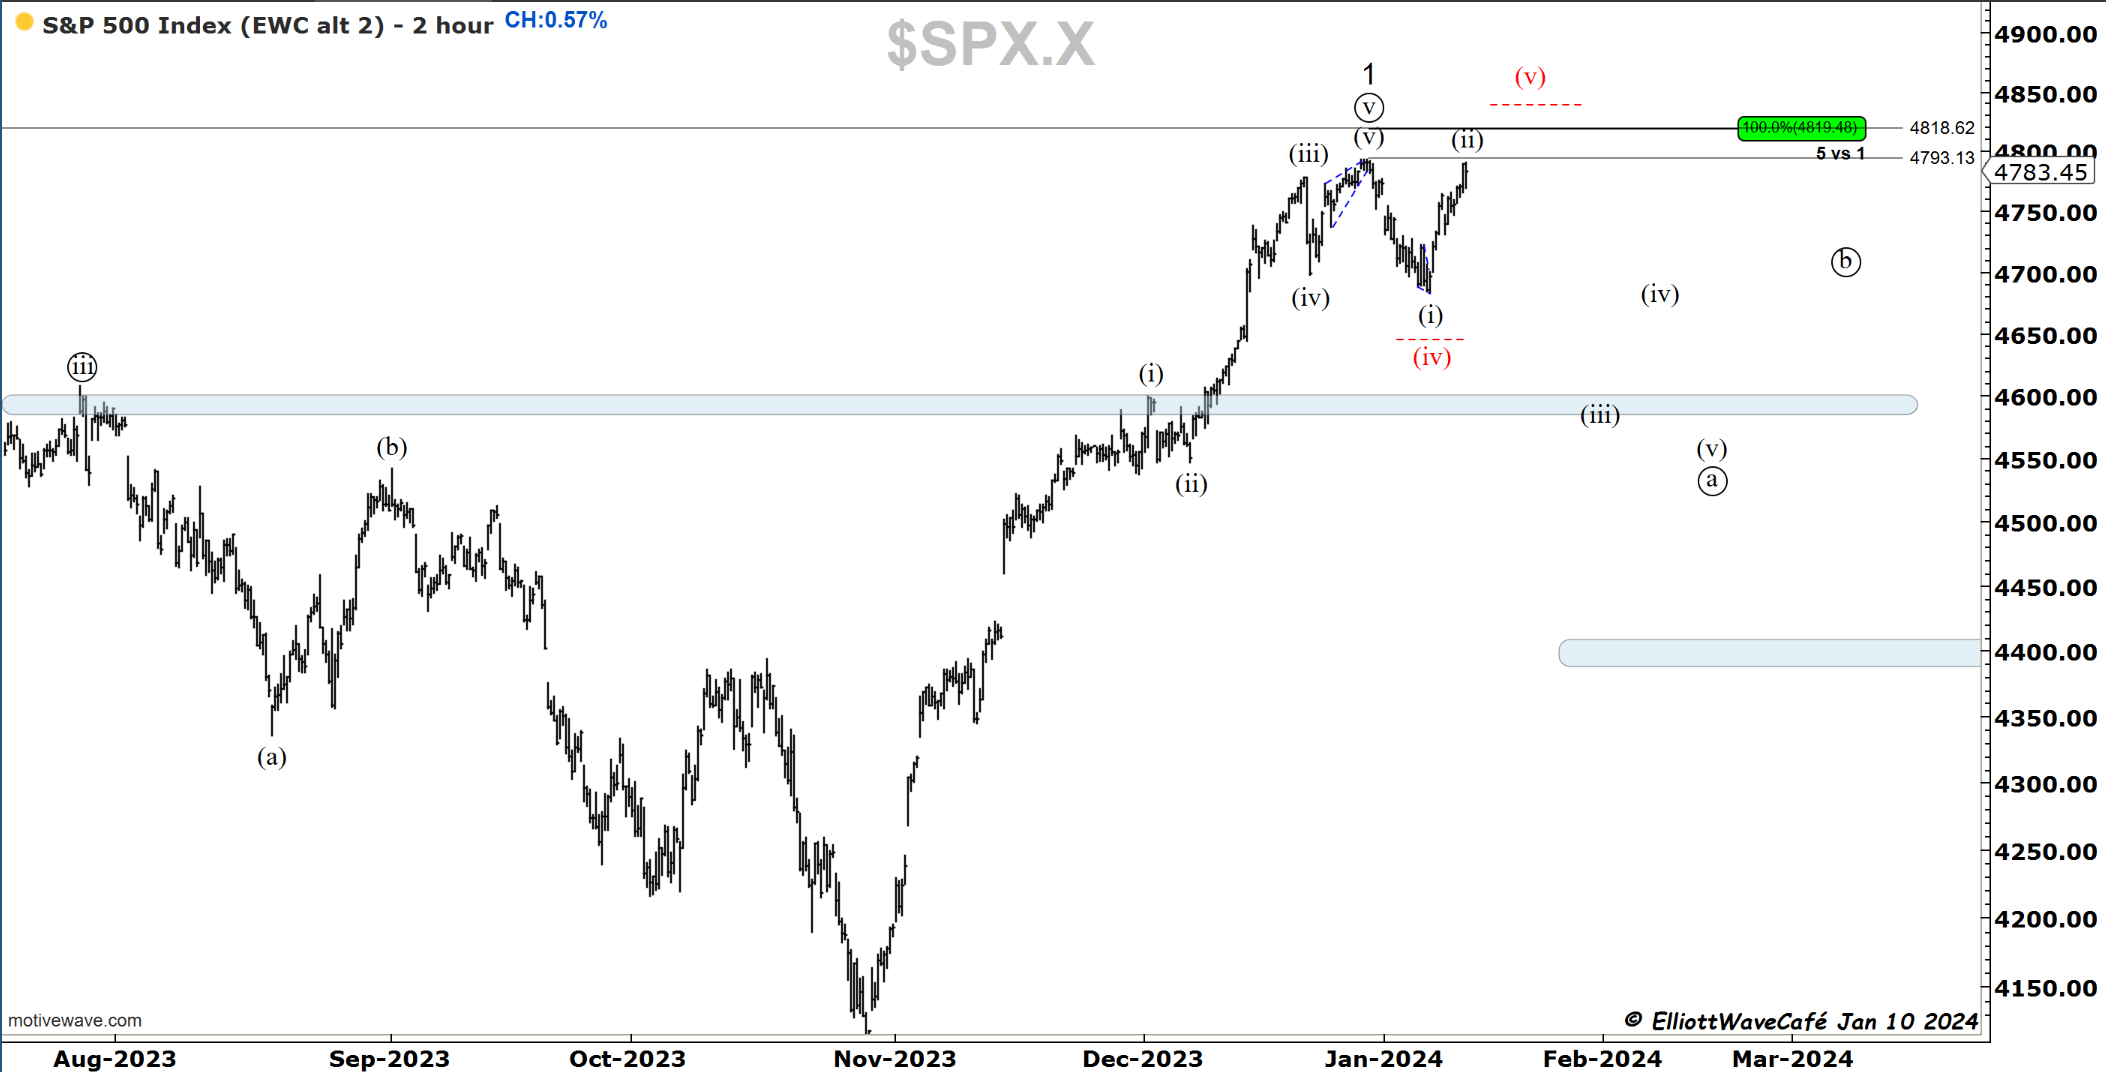
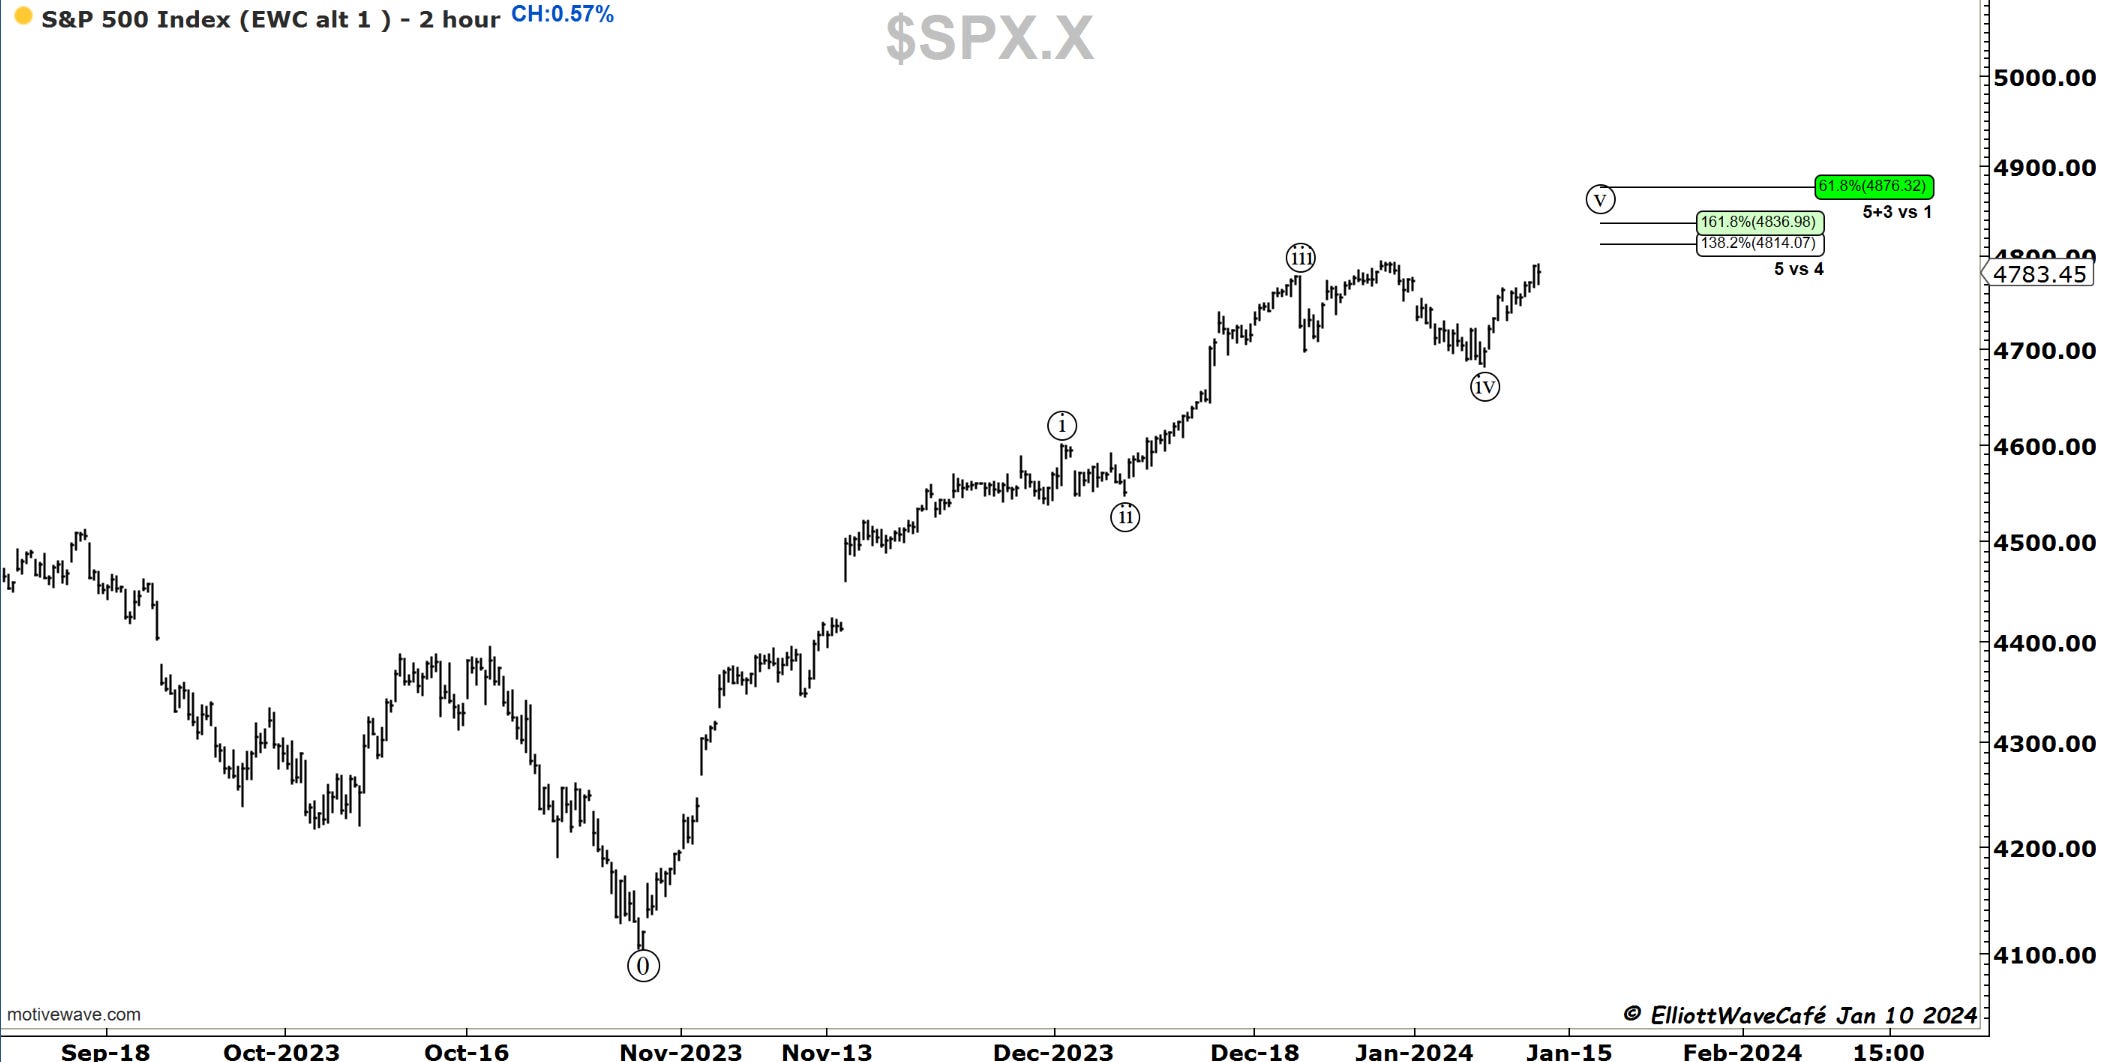
While picking the top of a 5th wave is no easy task, some areas to watch are 5+3 vs. 1 at 61.8% since we’re labeling wave ((i)) extended. The other confluence would be a reverse fib of wave ((iv)) at 138 -161.8%. The bottom line is that these are just guidelines, and we would need to see the price confirm those levels and retreat meaningfully to secure the 5th wave top. Let’s see if we break first.
The Breadth remains skewed toward a few larger names; the declining stocks continue to outweigh the rising ones in the NYSE. Tomorrow morning, we will get CPI numbers. I continue to view elevated risks in owning stocks up here with fresh money due to the multiple factors mentioned. There are headwinds until the end of Feb or mid-March.
Nasdaq100
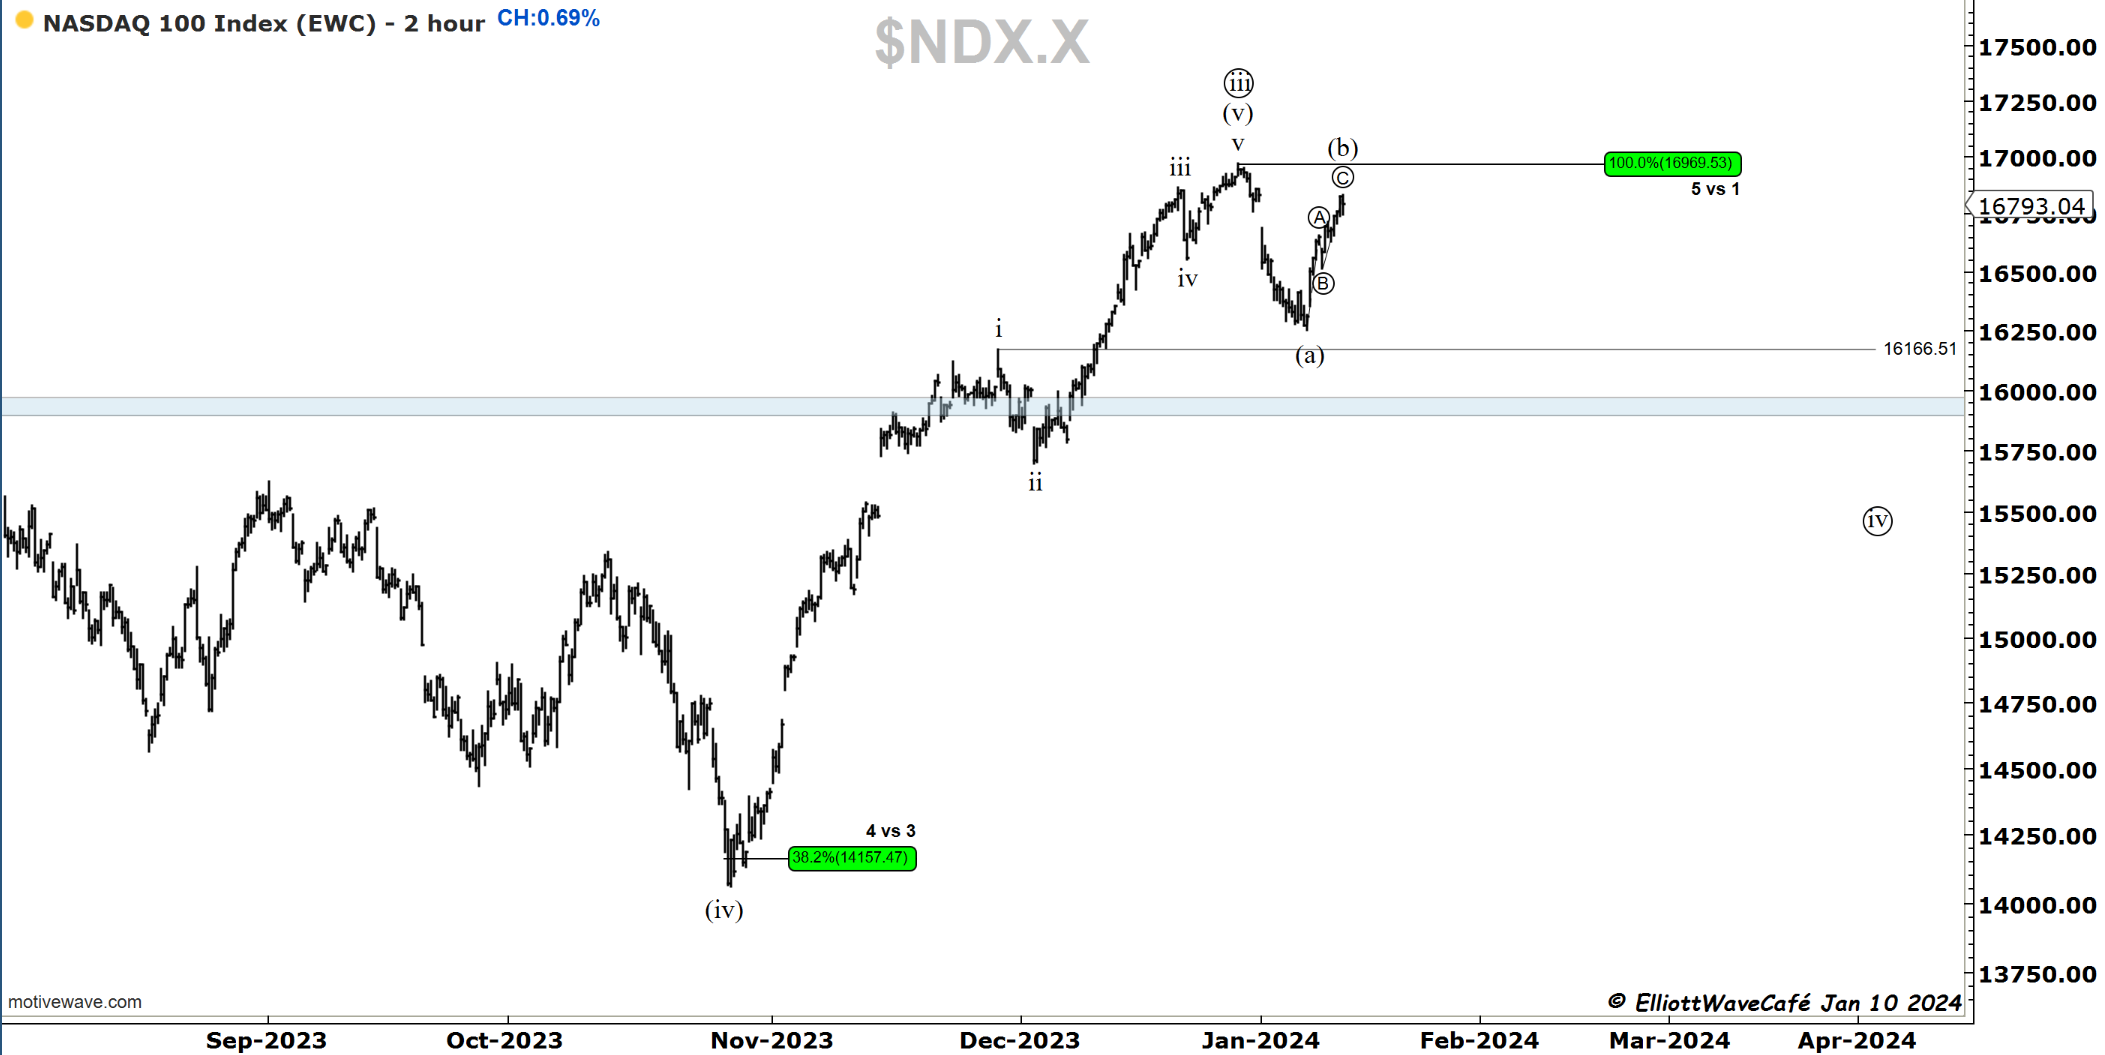
The Nasdaq rallied +0.69%. It is still below the Dec top, maintaining count validity. The move higher was sharp, but the three-wave structure remains. A new high will be labeled as a 5th wave, just like in the SP500. Below 16,500, the odds are that the corrective downtrend resumes.
RUSSELL 2000
Small caps barely budged today and were negative for the most part. The excitement about this area of the market has dissipated. The count stands and has increased odds of developing further as mapped out. I would like any potential rallies to remain below 2020, which would be the golden fib of the decline.

Dow30
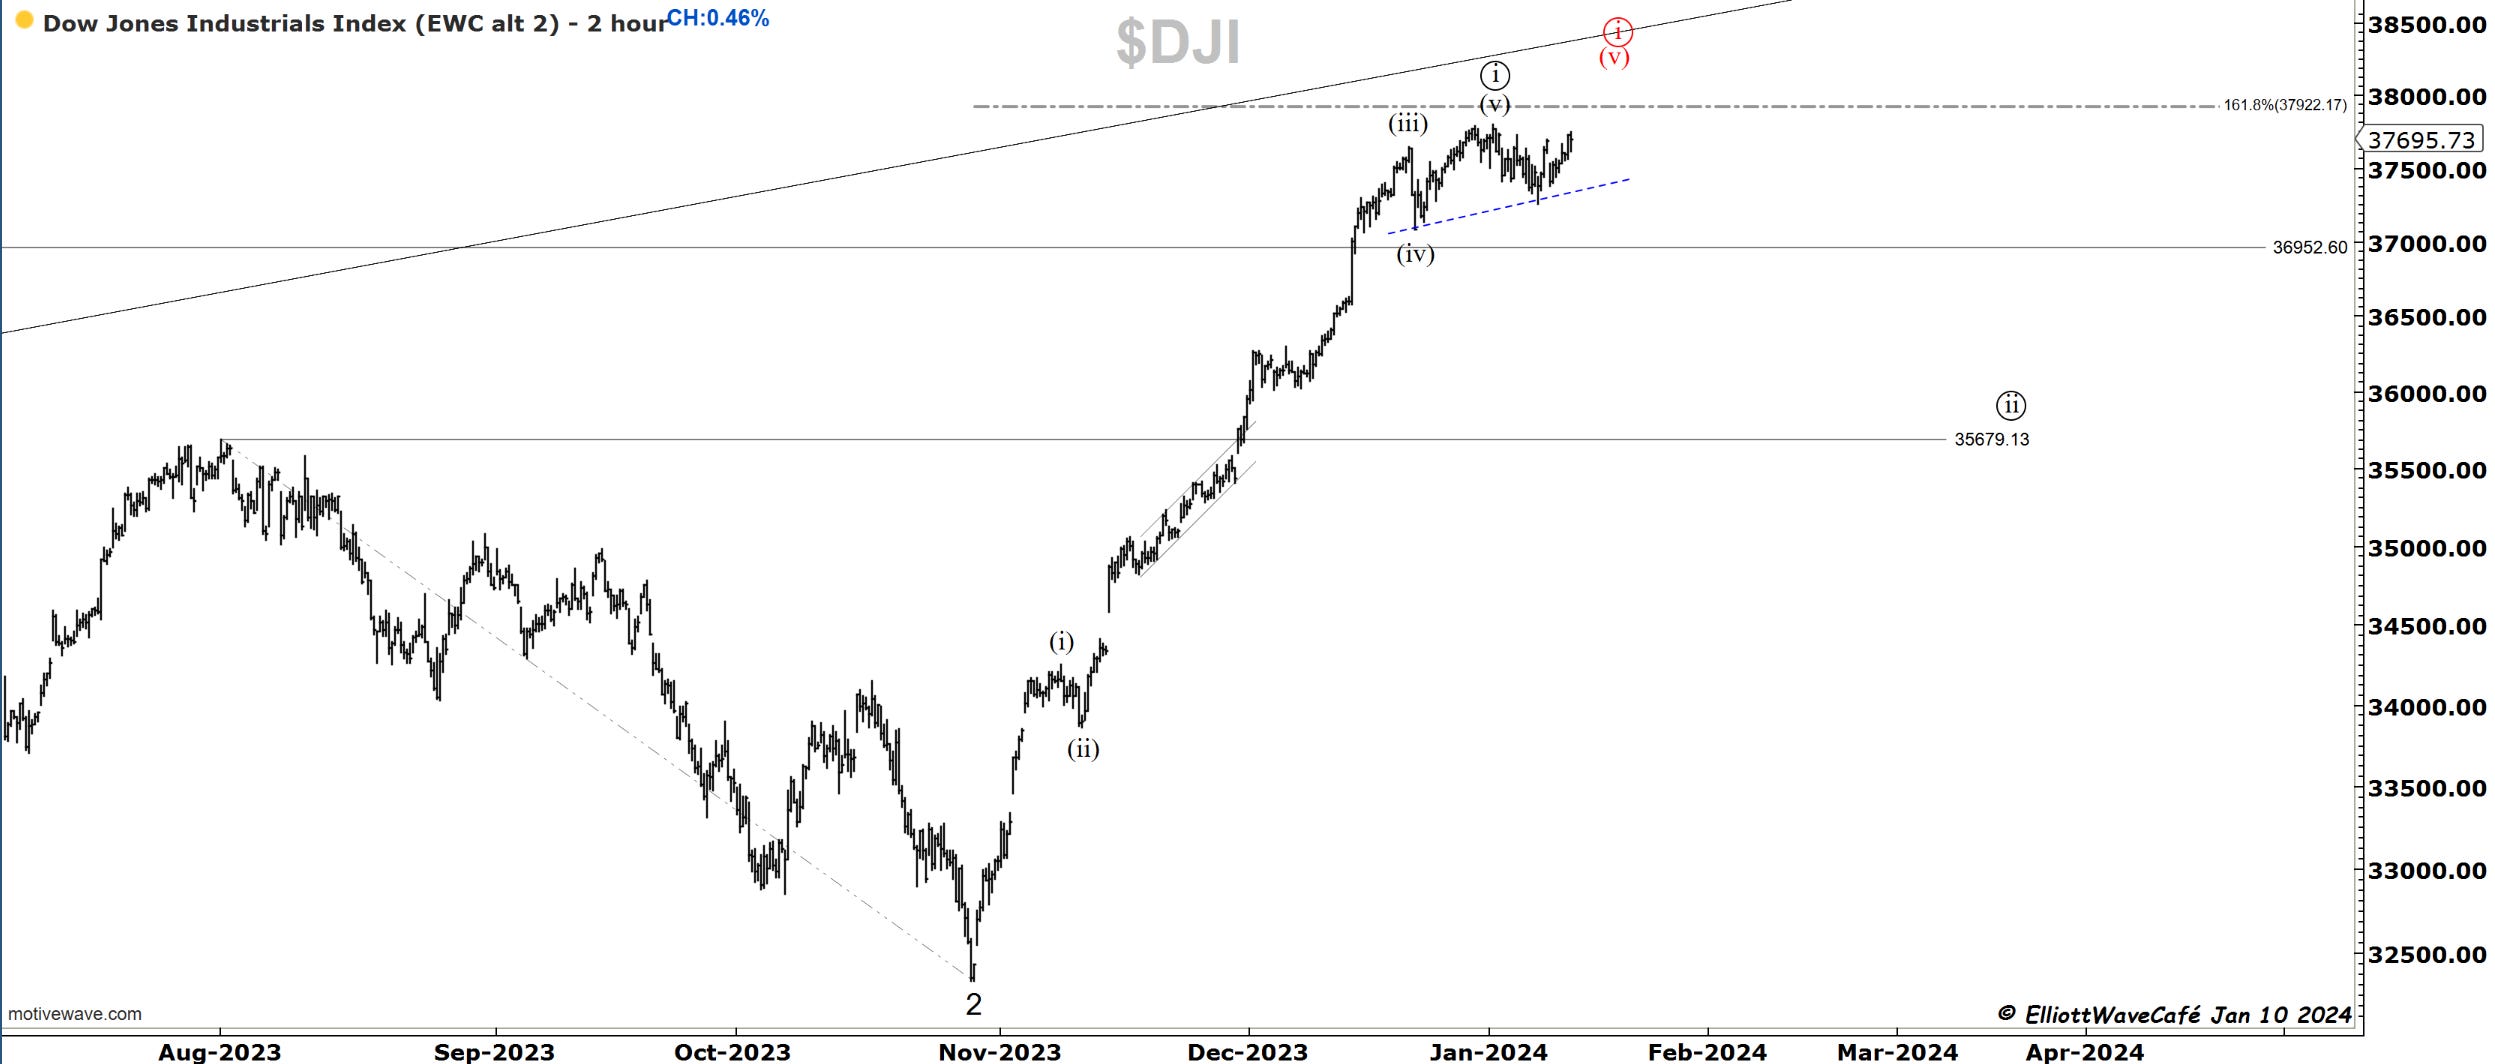
Today’s higher swing did not make a new high, but it has muddied the initial proposed declining structure. I don’t see us exploding higher from here, however. Any marginal new high should be met with selling and increased odds of corrective action. I have my finger on the trigger to take advantage of trading the upcoming decline.
US Dollar and Yields
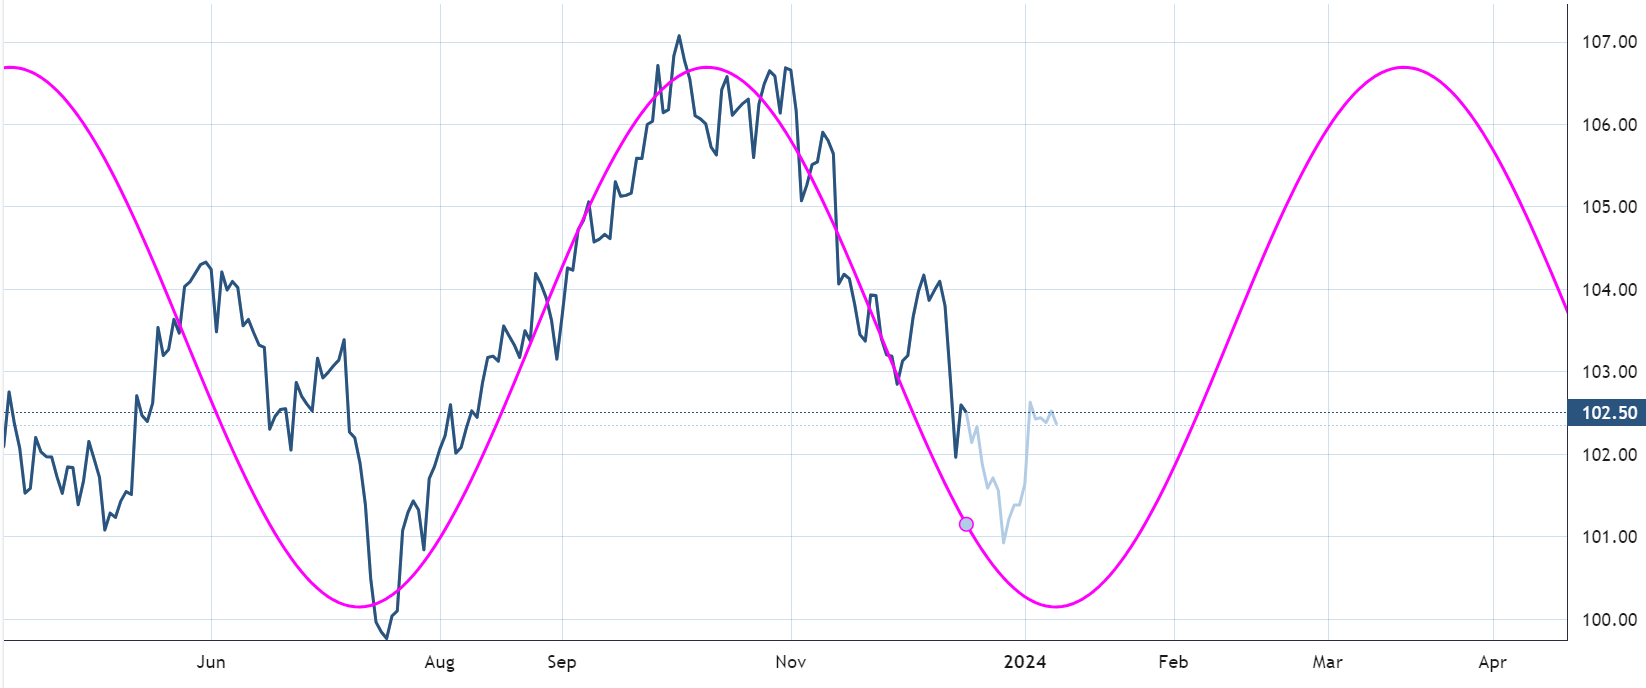
There were small moves in the Dollar and yields today as the market awaits CPI tomorrow morning. Pending a huge downside surprise in CPI, I remain bullish on the dollar and yields for the near future.
I looked at the Dollar cycle on Dec 18th; here we are, almost a month later. You can see the price action since then.
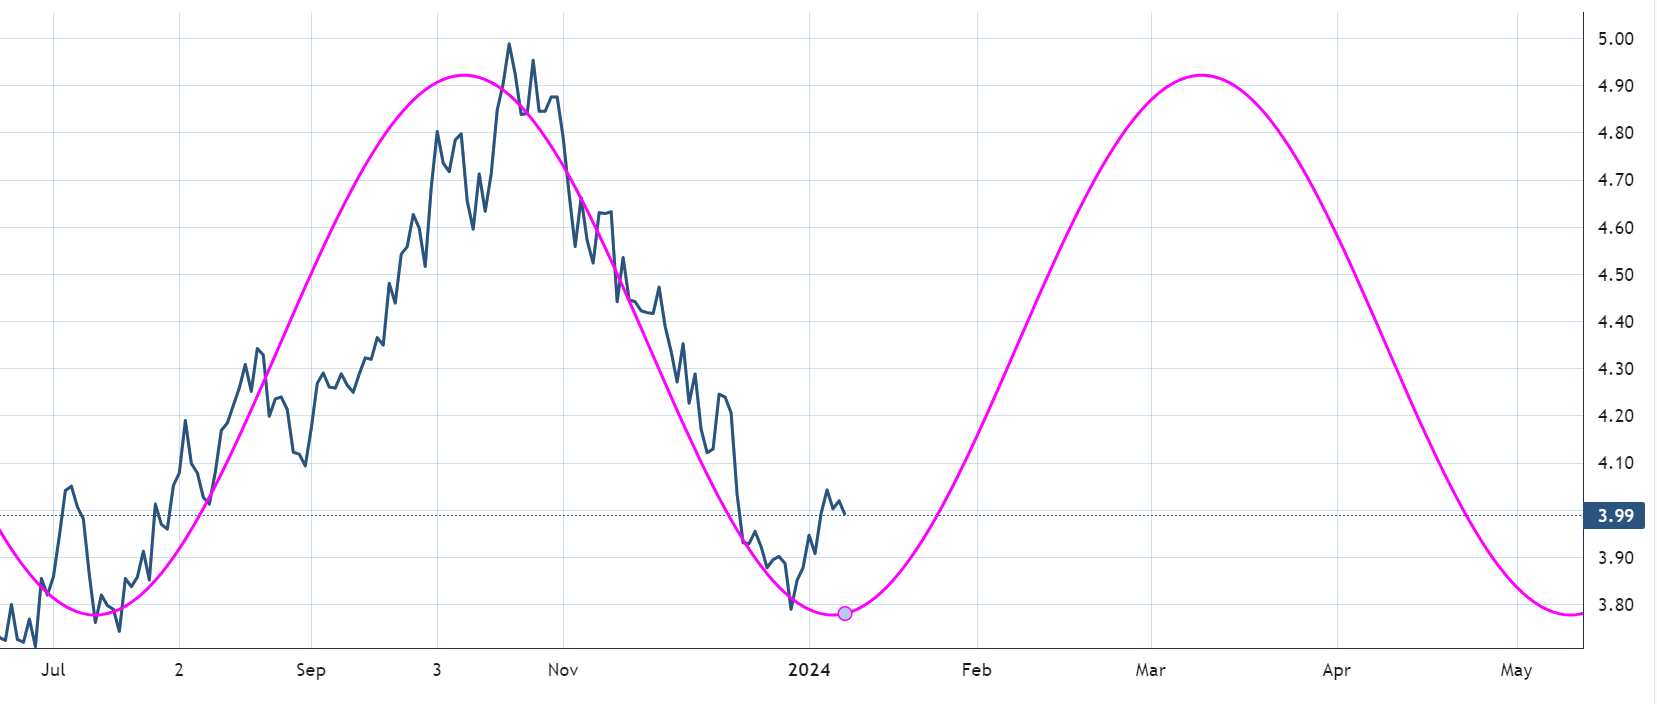
Here is the 10-year yield cycle as well. It's tough to be bullish risk assets with both of these heading higher.
Gold
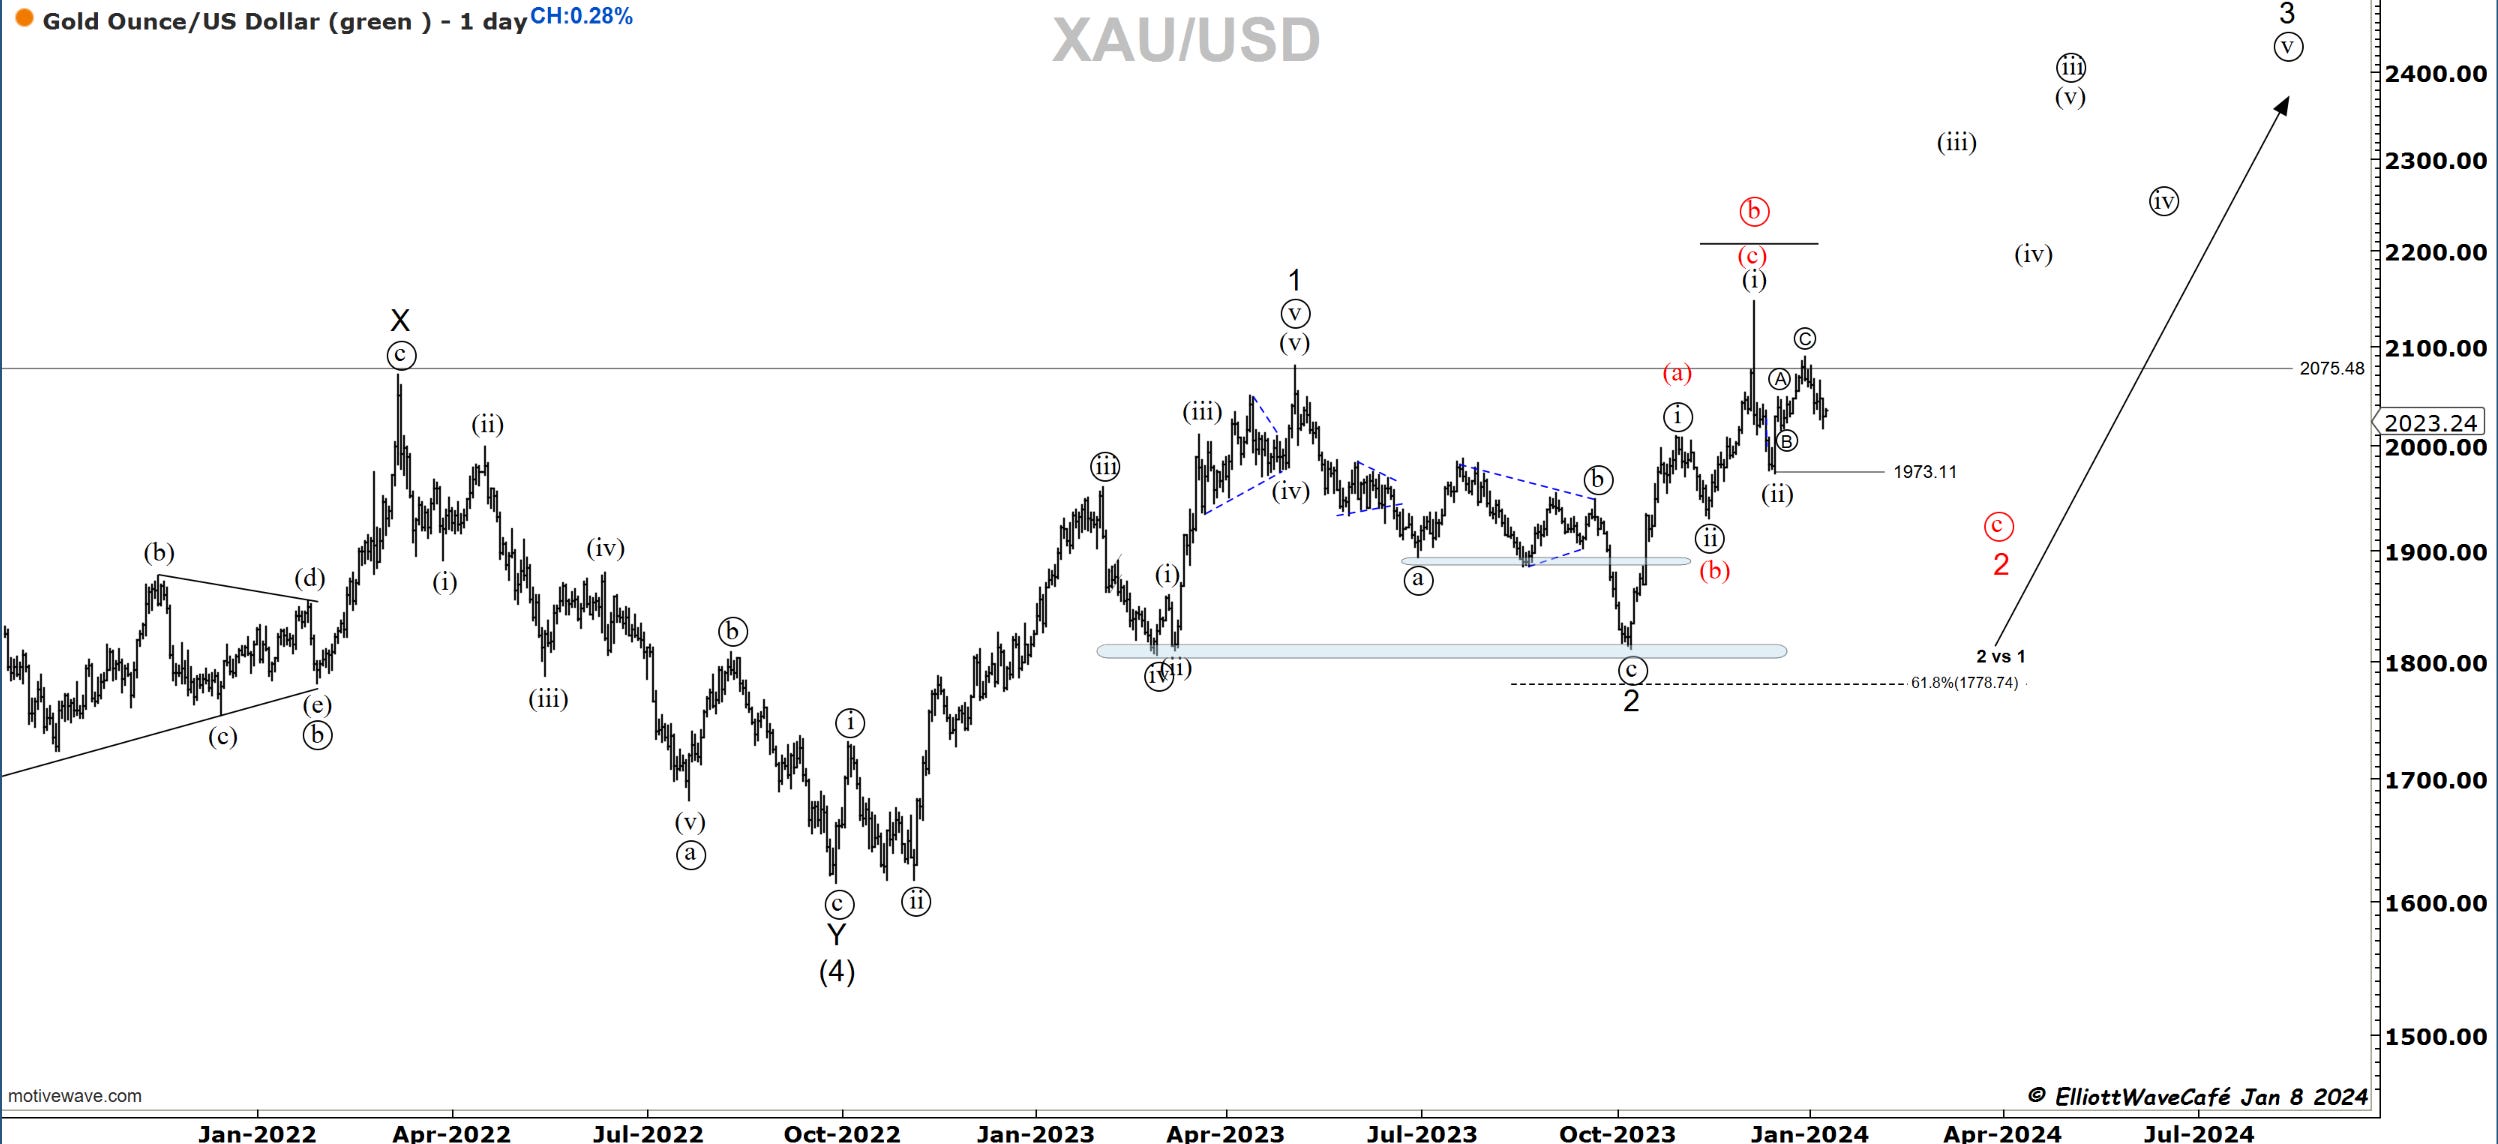
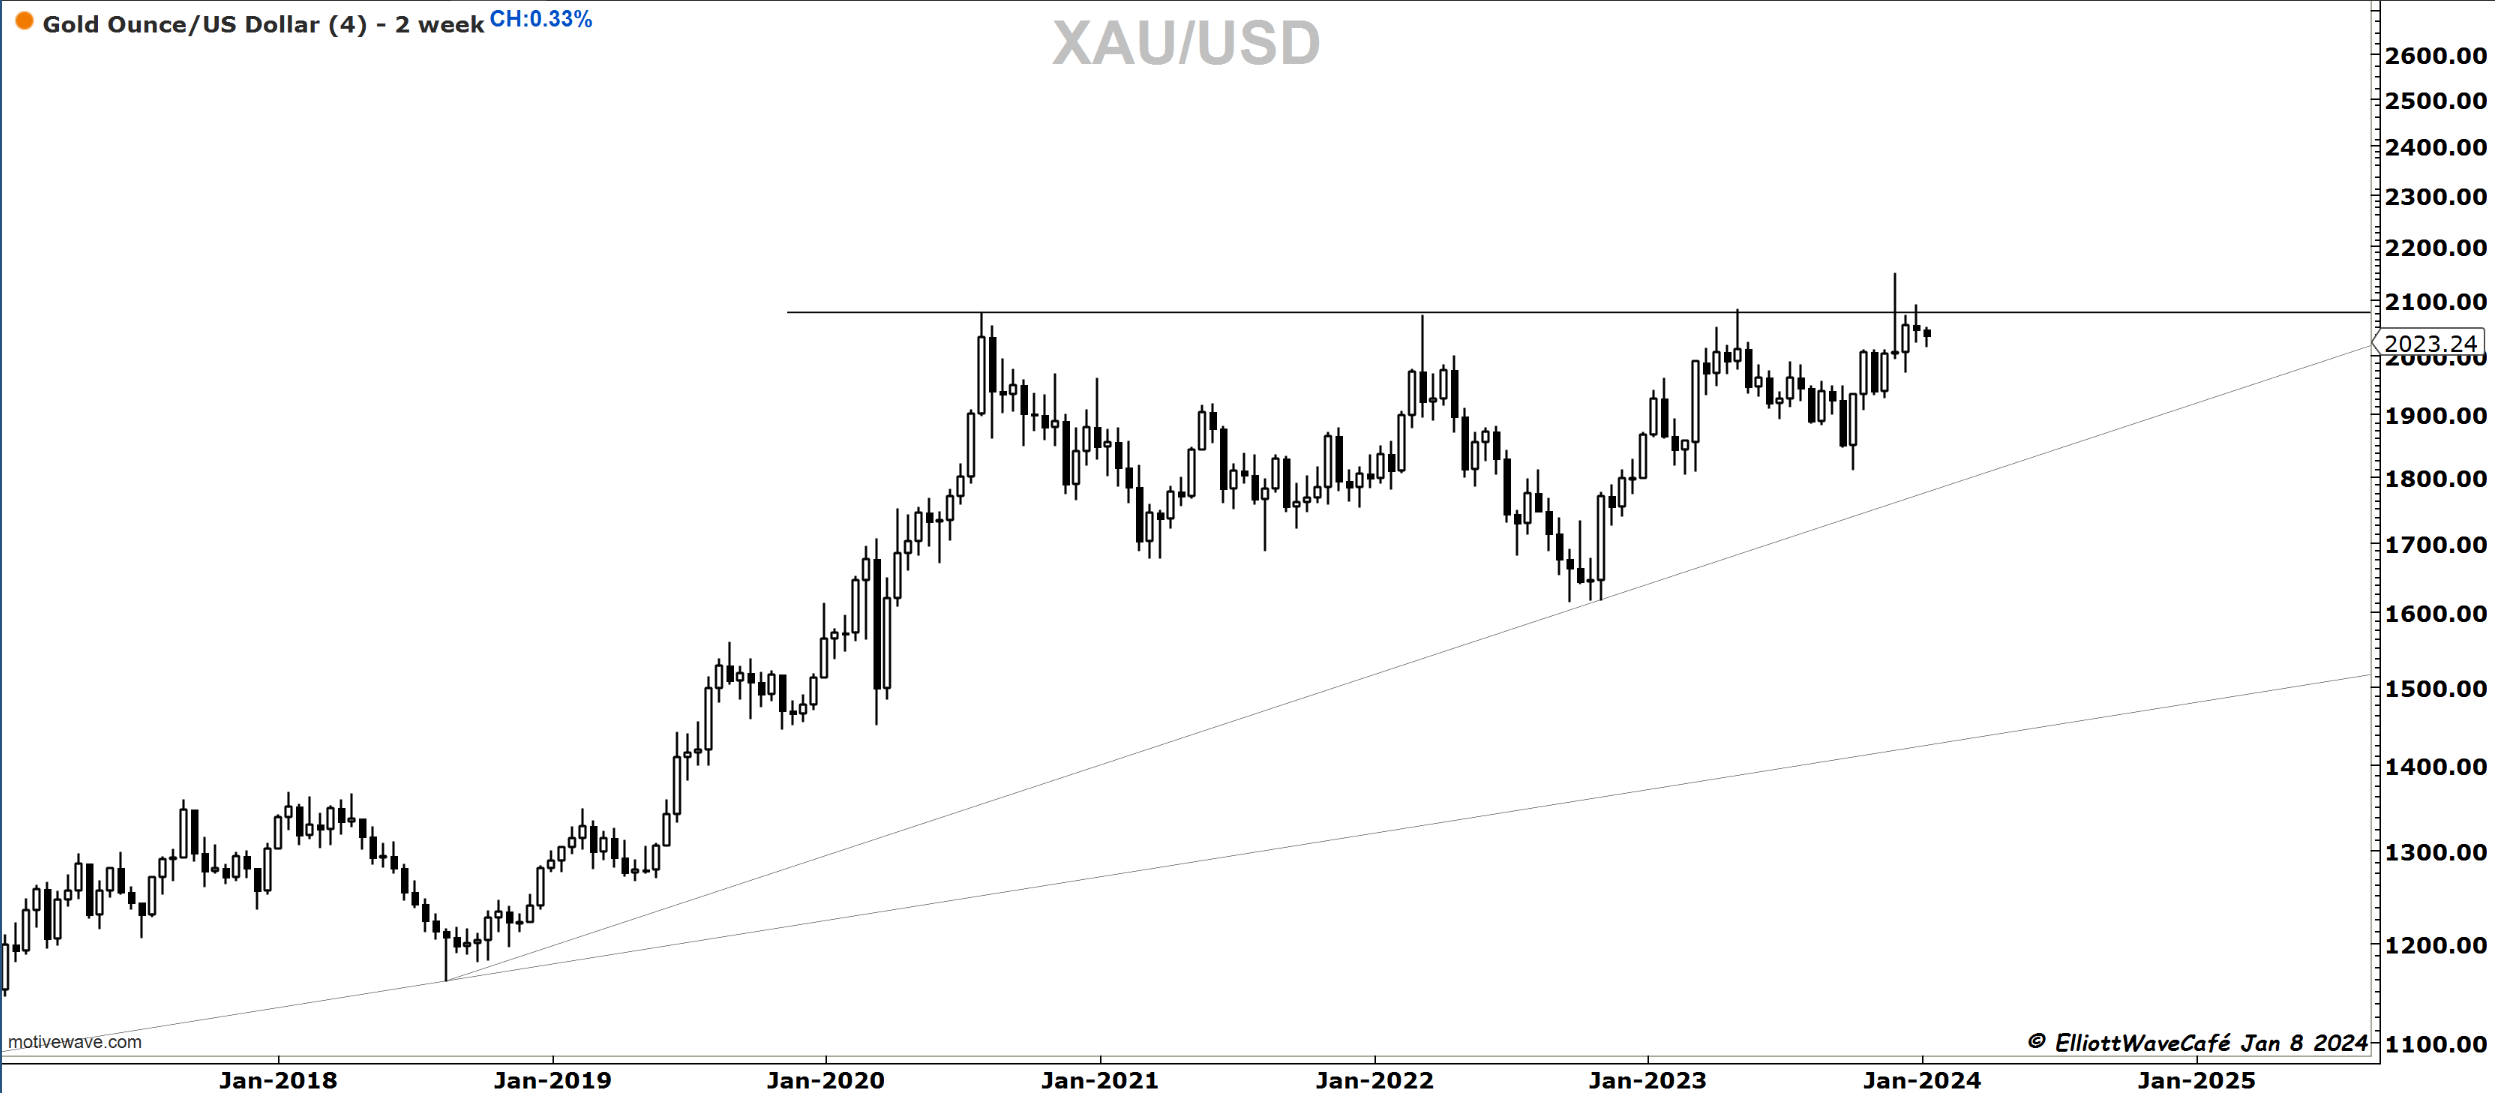
No changes in Gold - prior comments remain.
Gold continues to tease just under the ATH. There are multiple macro views that one could take by looking at money supply, liquidity, inverted curve, real yields, dollar, etc. I am sure everyone can make a compelling case of why gold should do one thing vs the other. I am also sure that once a move is made, all those reasons will be offered as proof of why something happened.
The reality is that Gold has not followed upwards after the failed move, and under a possible 1,2 1,2, it should have broken already. It has not yet succumbed lower either in a ((c )) wave of 2. There is really not a whole lot that can be done here for a swing trader looking a week or 2 out. It’s one of those markets best left being observed until more levels get taken out.
Bitcoin
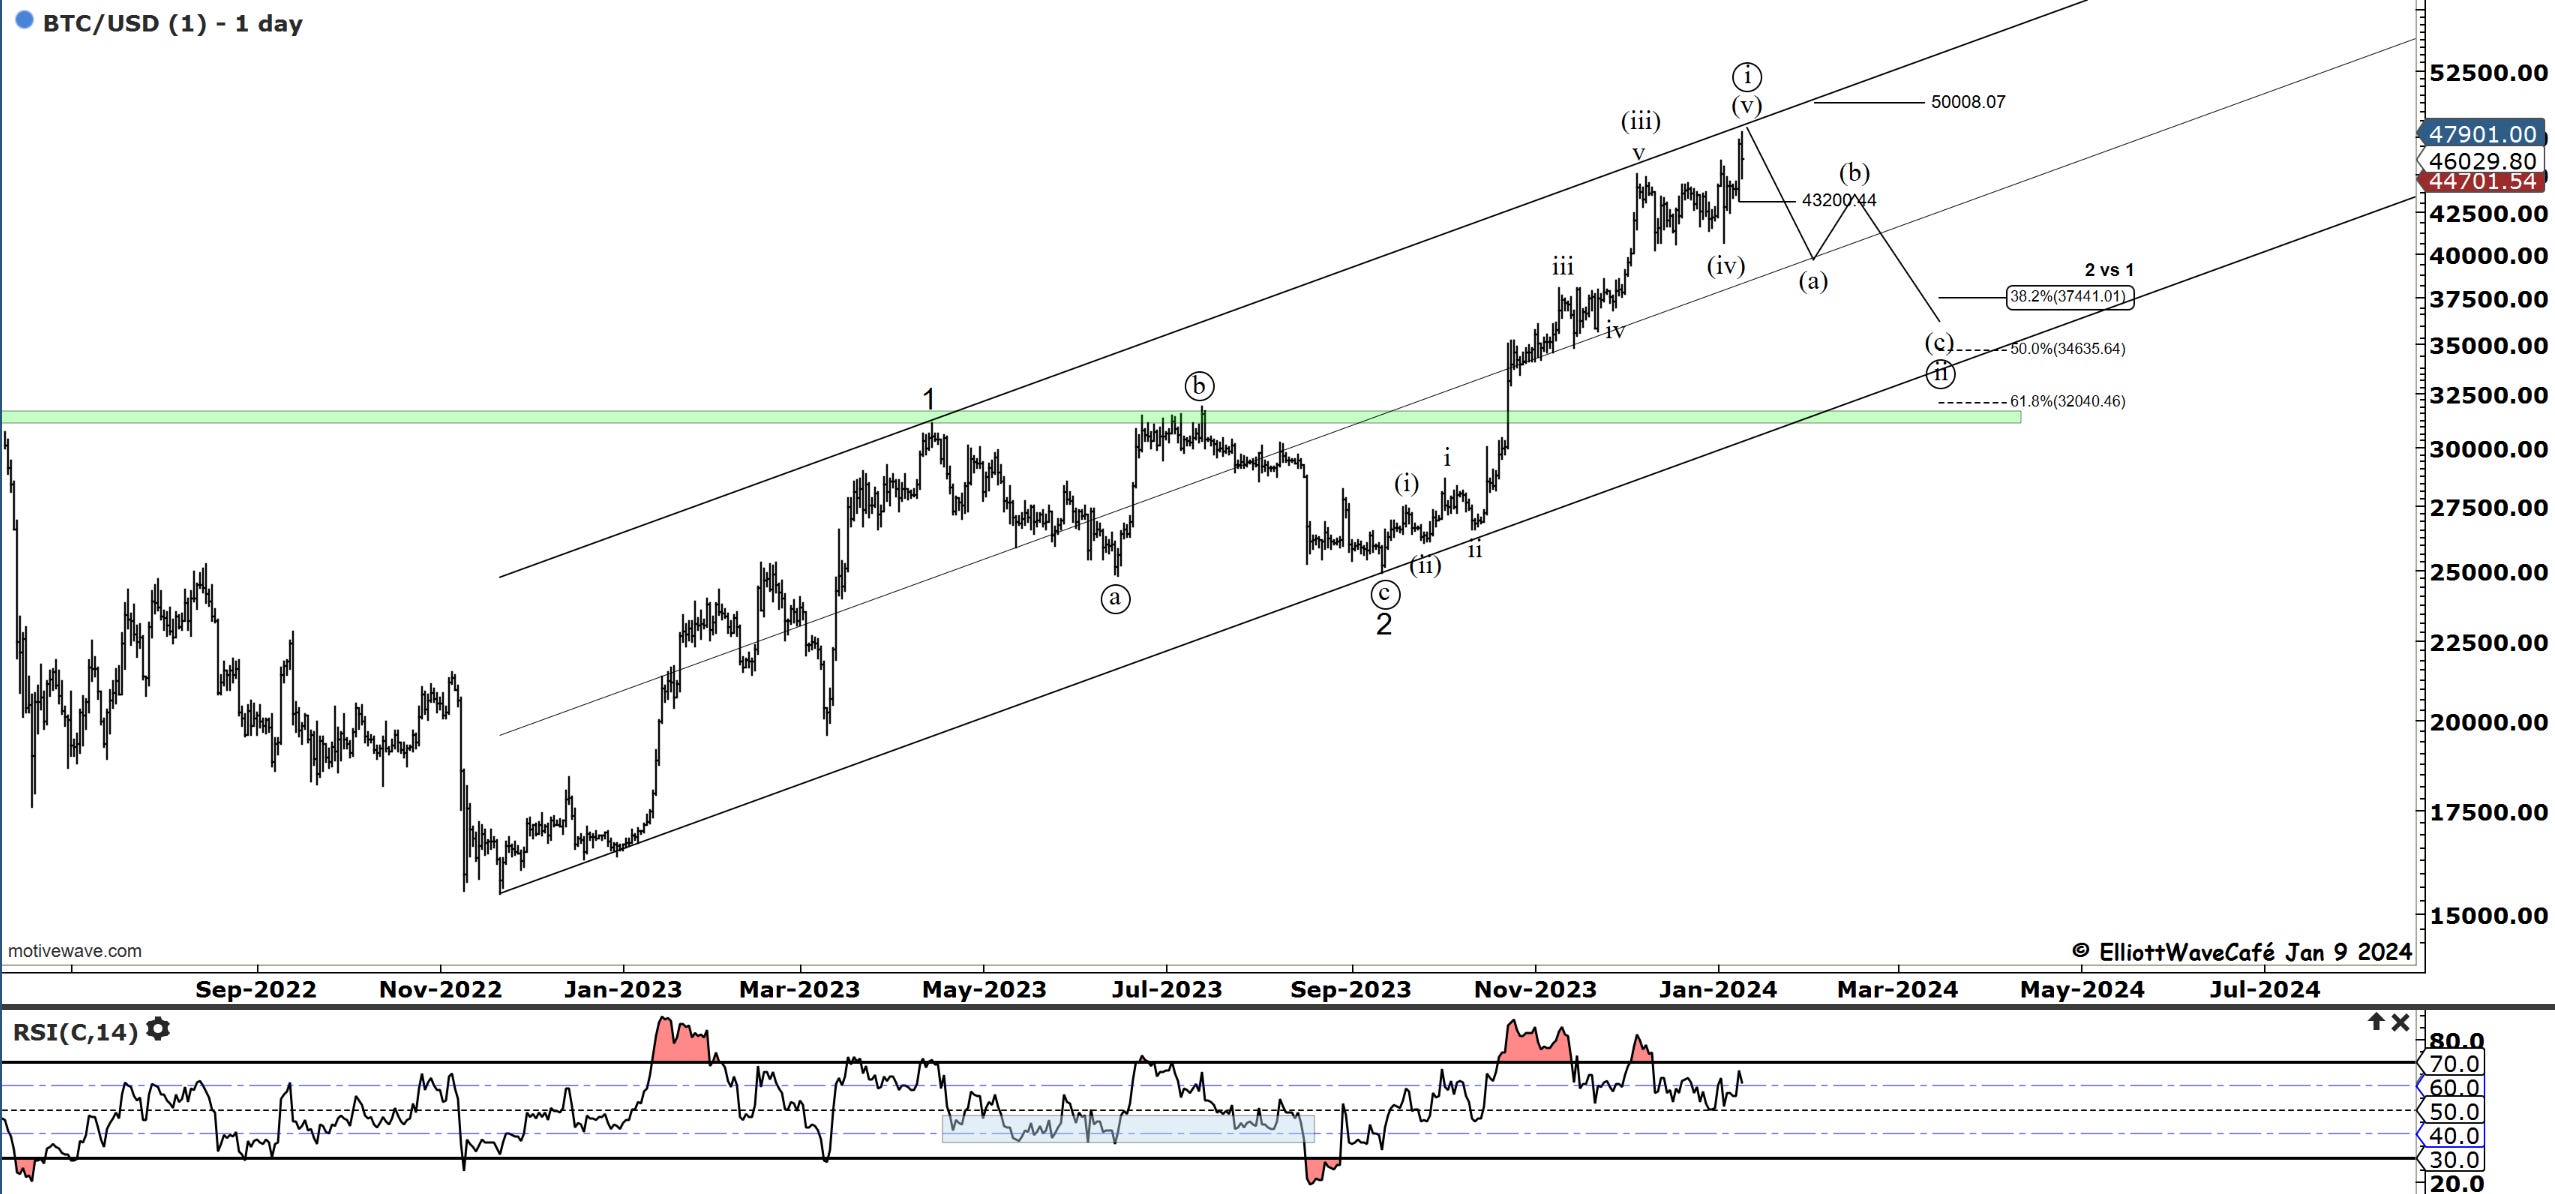
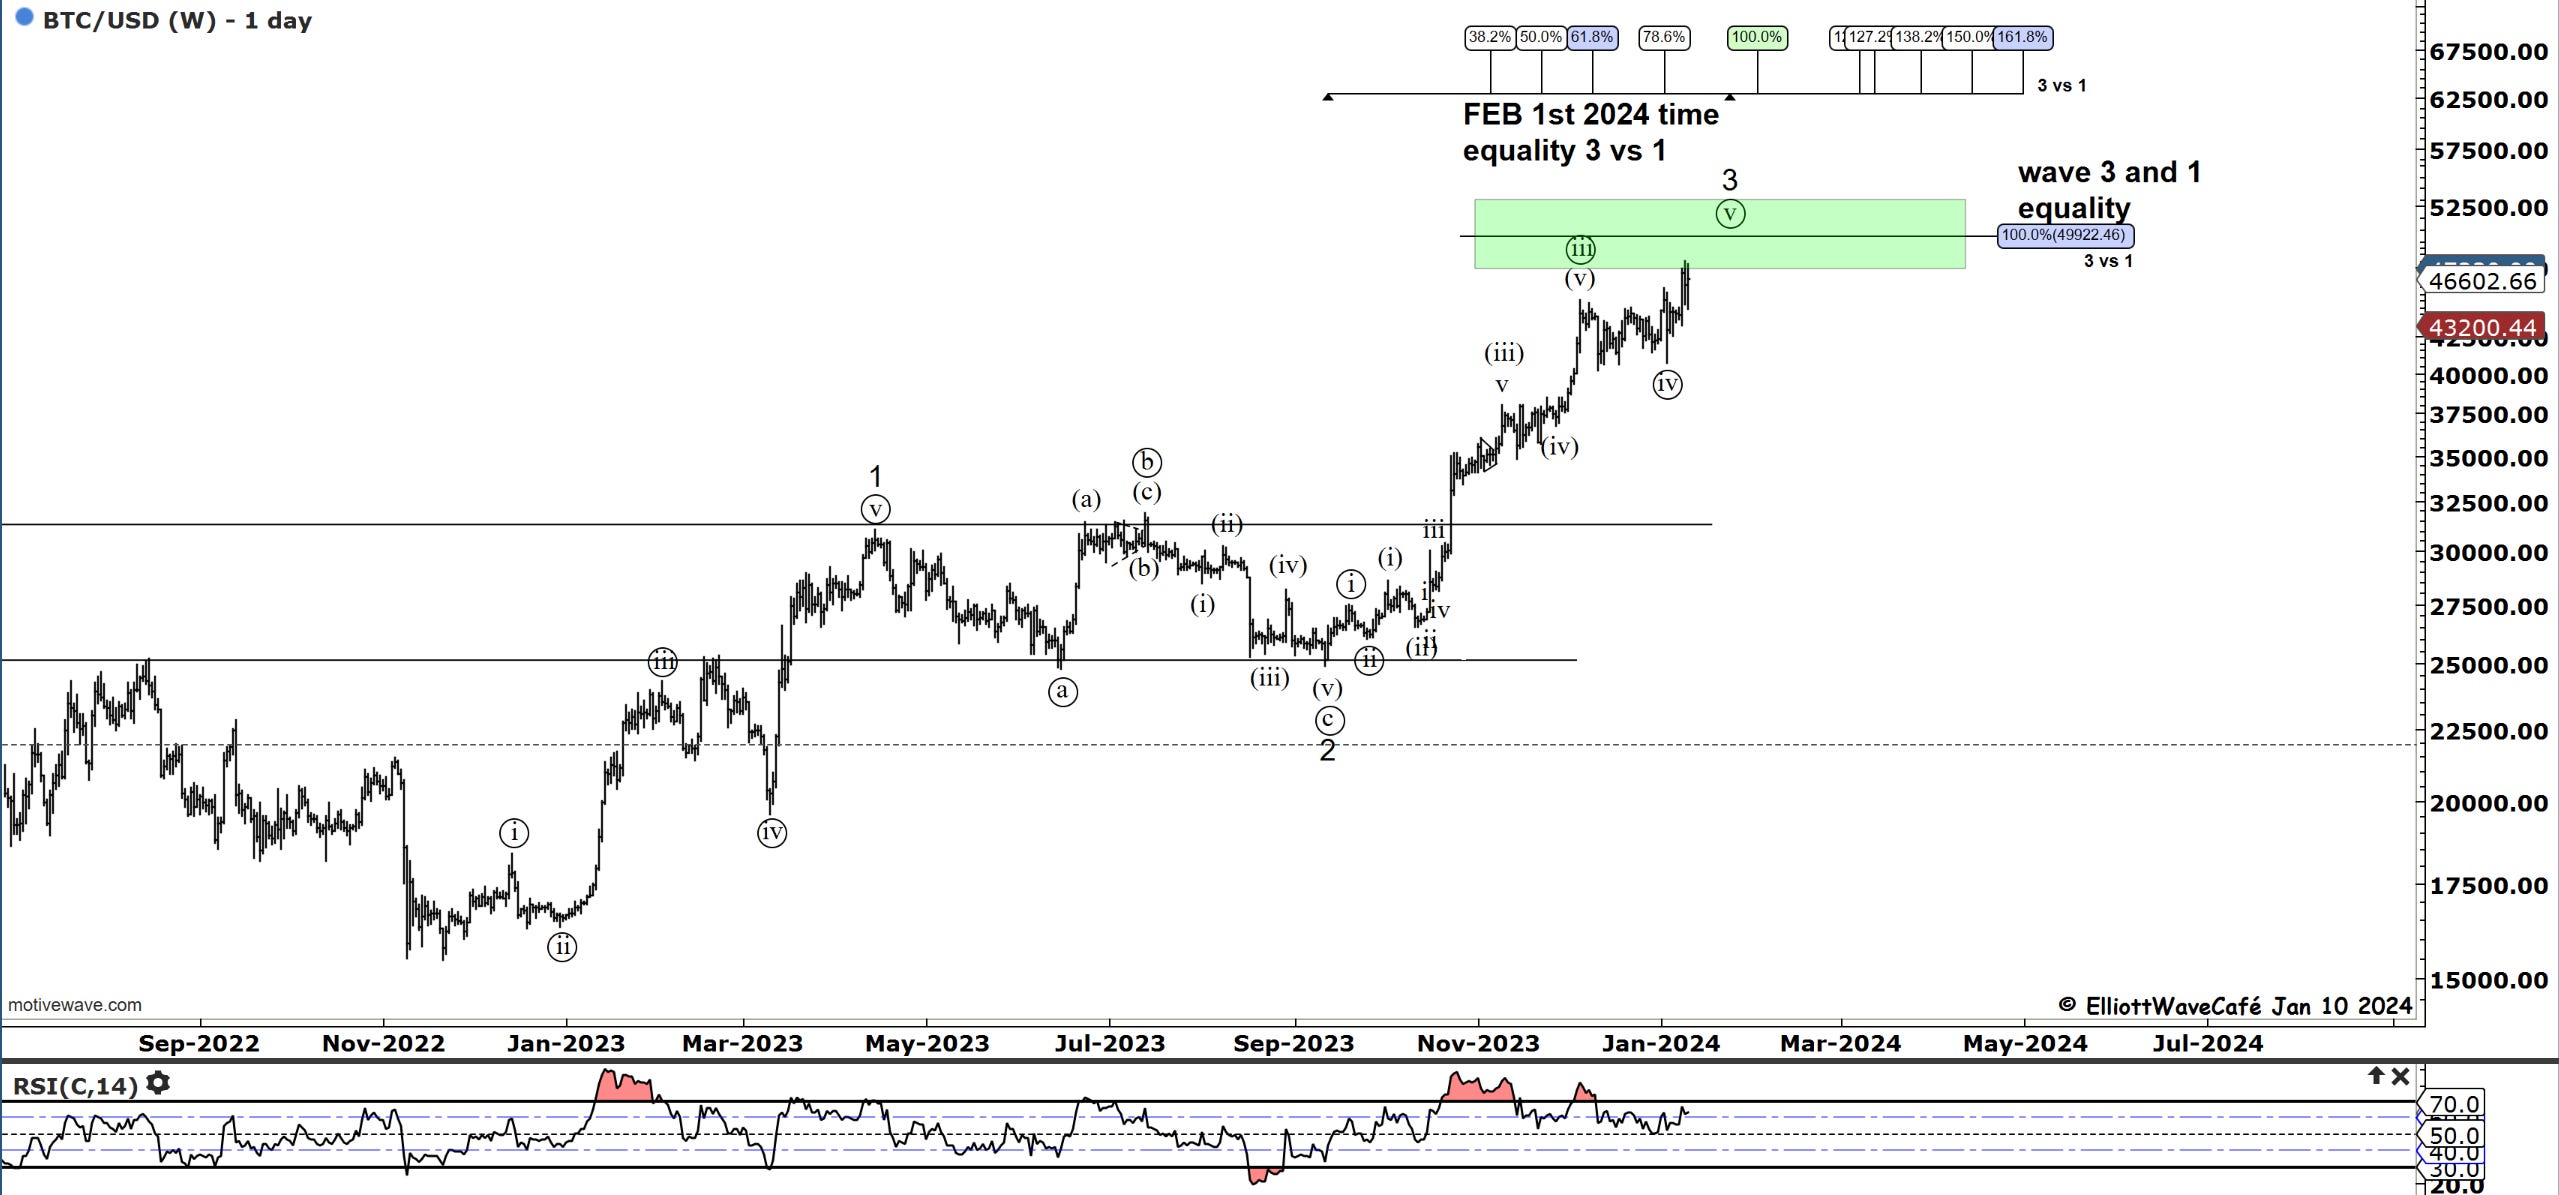
We will have a few Bitcoin ETFs starting to trade as early as tomorrow. BTC has yet to make any significant move higher as the time of this writing. I would be quite worried if it does not manage to get serious traction. A next-day “hangover” could very well be in the cards. If we manage to get there, 50k is a big level and coincides with wave equality seen in the second chart.
A loss of 43k zone can open an avalanche of sell orders, so that’s a good cut-out level for longs. I don’t know your time frame, so pls don’t take this as advice for your personal situation. Counting waves is only 1/2 the equation. The other 1/2 is executing a trading plan. It's a totally different story. You can be right on a count and direction and still lose money. But that’s a topic for another time.
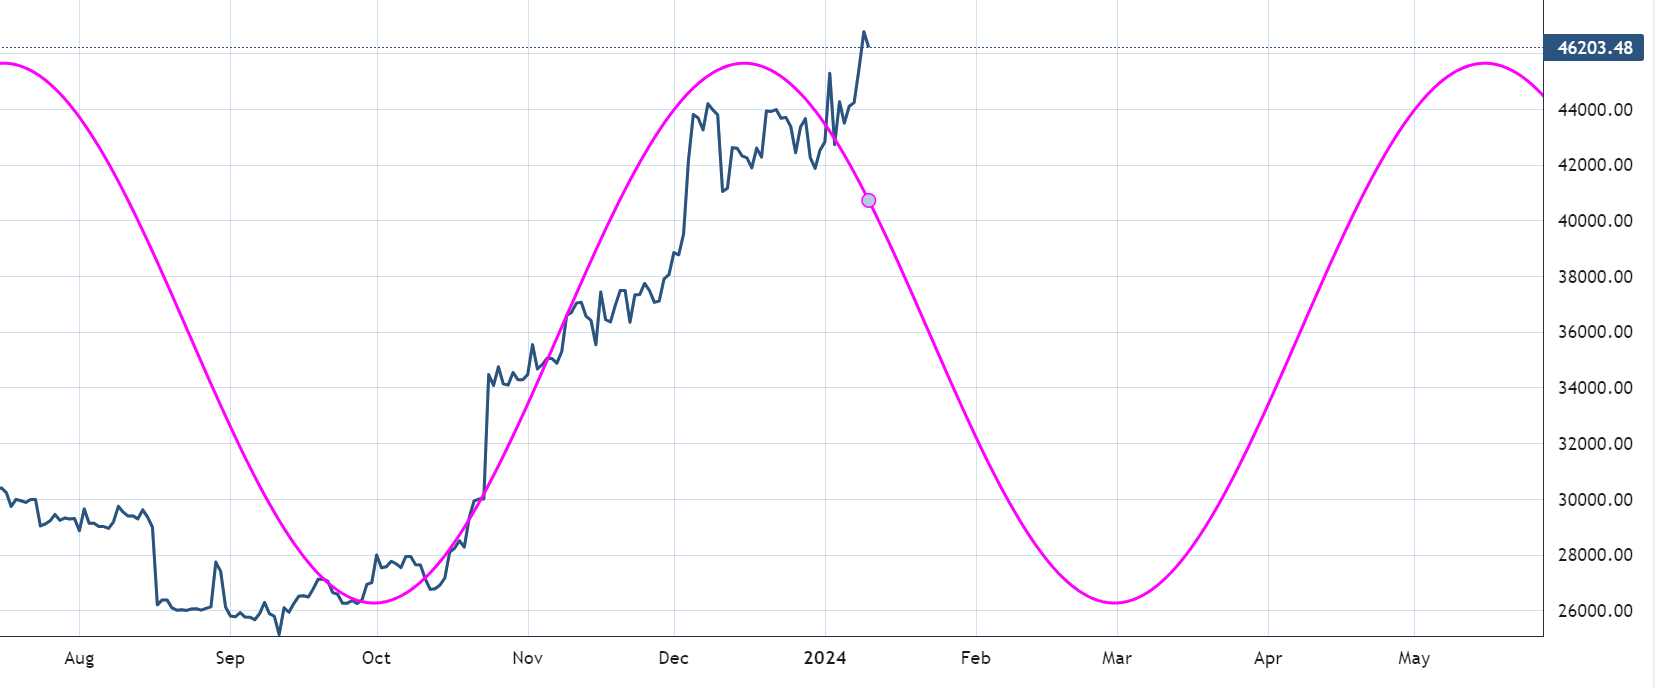
BTC time cycle update.
“Double shot” Daily member video coming up next,
If you’re new to Elliott Wave or need to refresh, there is a 7-hour video course with downloadable slides under The Coarse tab on the website.
Have a great day wherever you are! - trade well, and don’t forget to subscribe and drop a like if this letter helps you in any way.
Cris
email: ewcafe@pm.me