
The Daily Drip
Core markets charts updates and commentary
Note: The counts on the right edge are real-time, and they are prone to adjustments as price action develops. Elliott Wave has a fluid approach, is evidence-based, and requires constant monitoring of certain thresholds.
In the counts below, this (( )) = circle on chart
This is the last report of the week. I will see everyone on Tuesday afternoon.
SP500
Today’s rally did not come unexpectedly after such a sharp selloff yesterday. Since the uptrend from early Dec appears to have been violated, current attempts at a bounce will be seen as opportunities to unload longs or open short positions. This is either a wave (1) or (A). If correct, the targets remain lower towards 4600 initially.
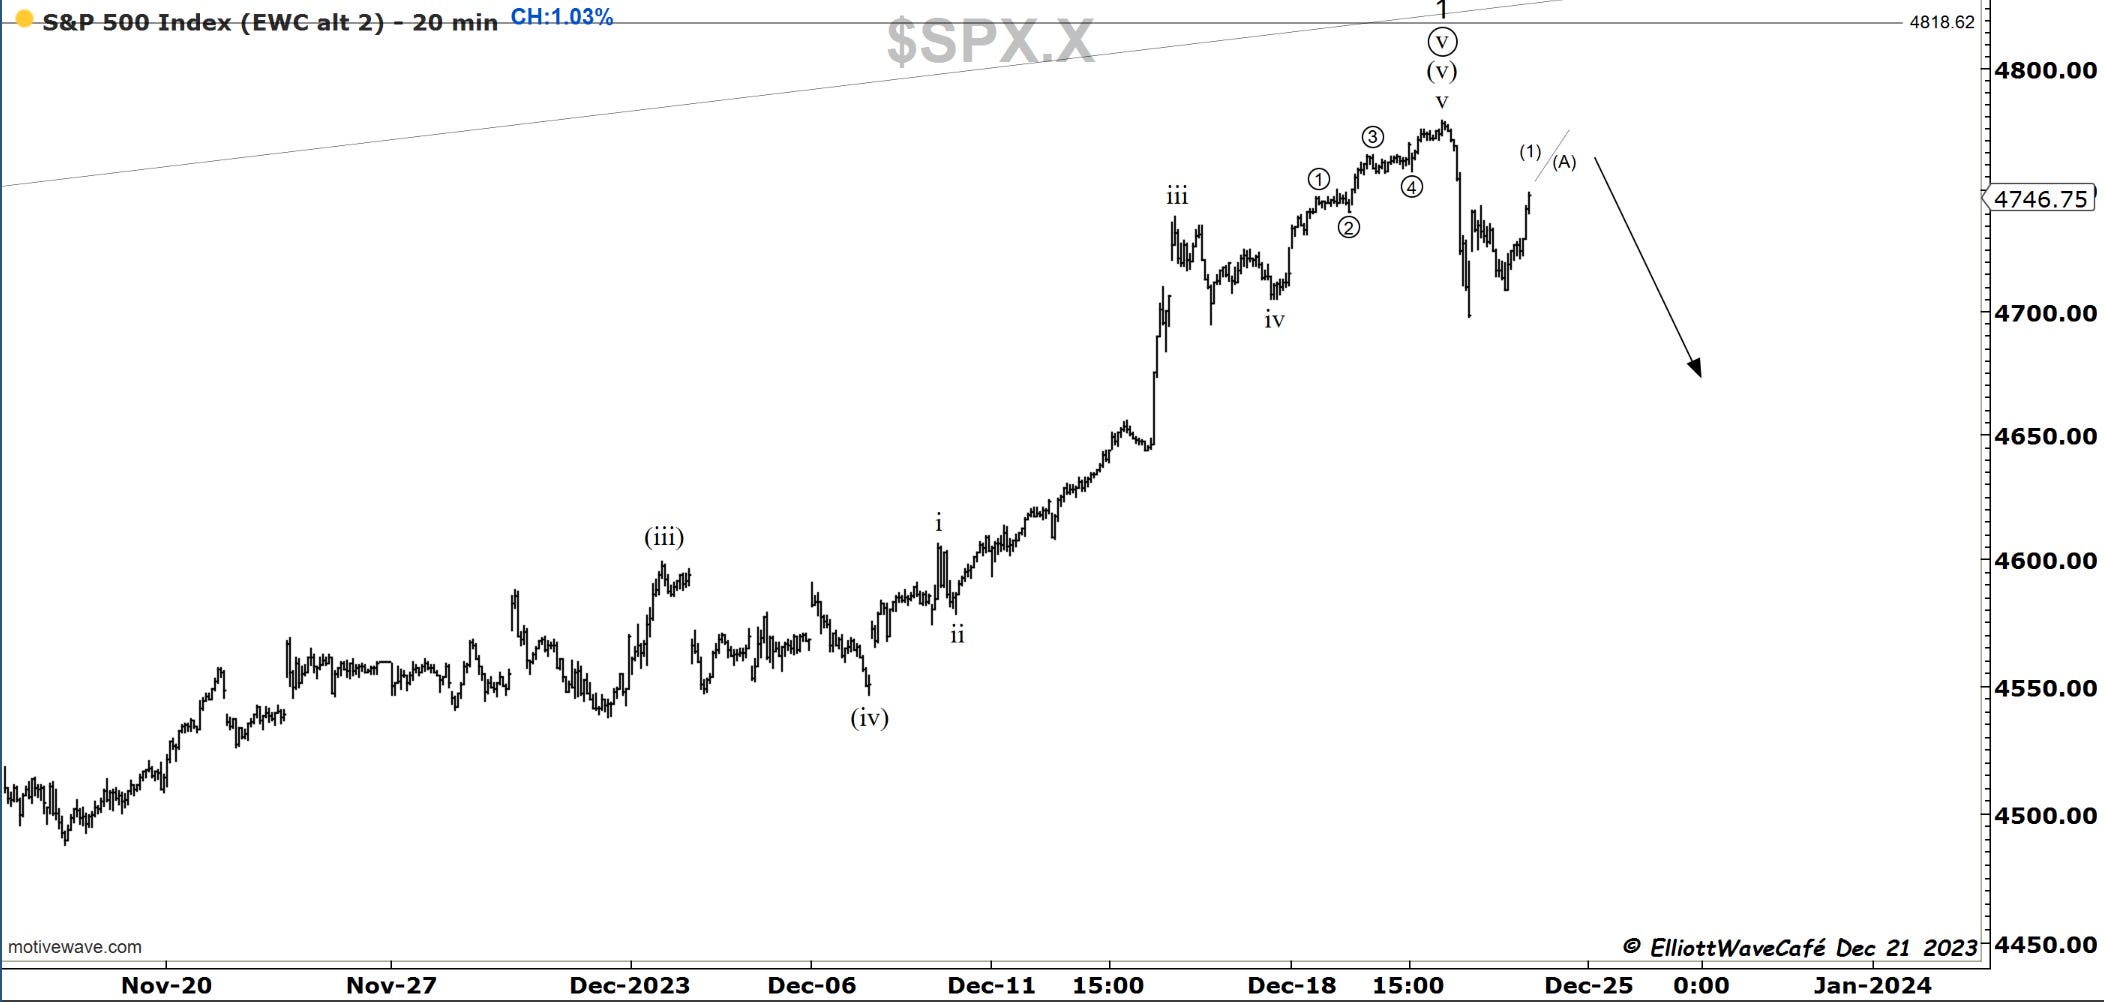
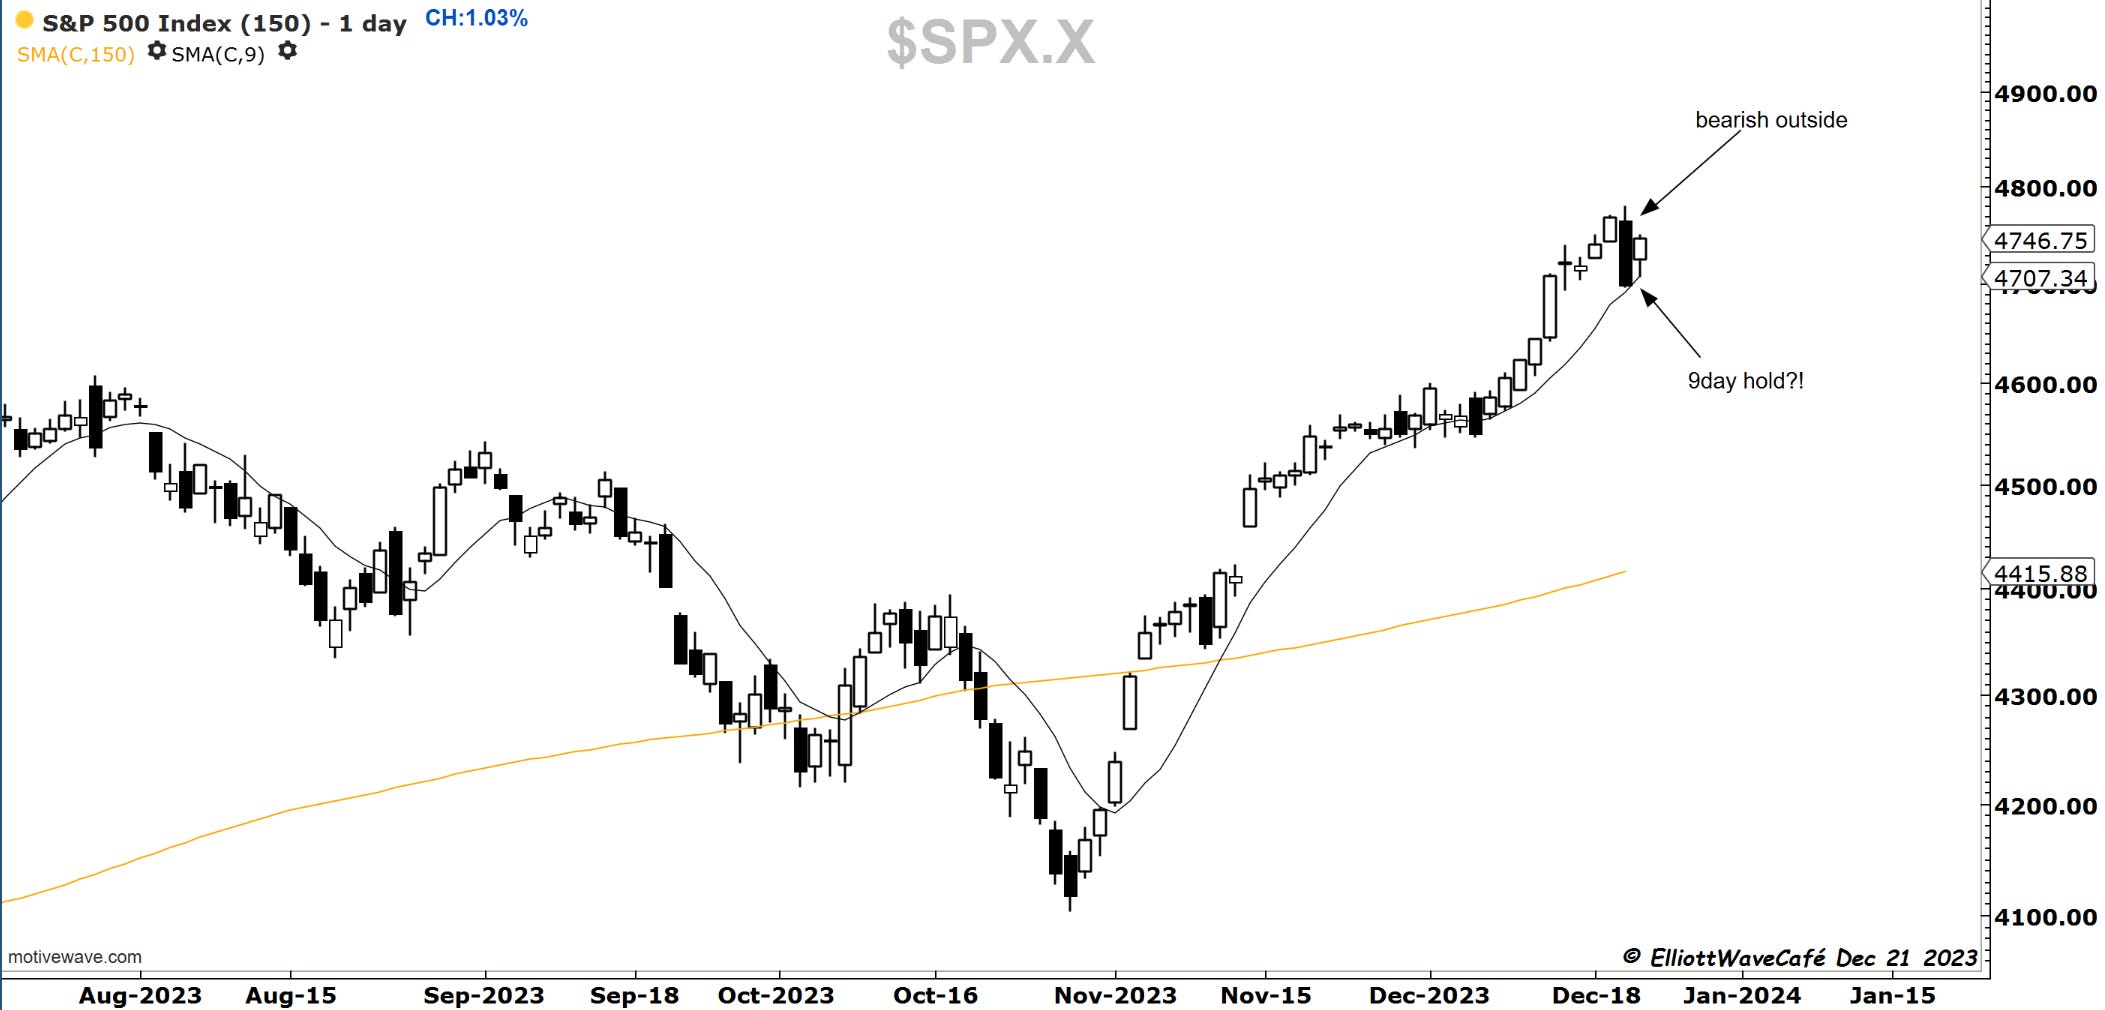
Yesterday, we displayed an outside-day reversal, but today, the market climbed from a 9-day MA support. A bit of a tug-of-war will take place between bullish trend followers and the mean reversion type.
Nasdaq100
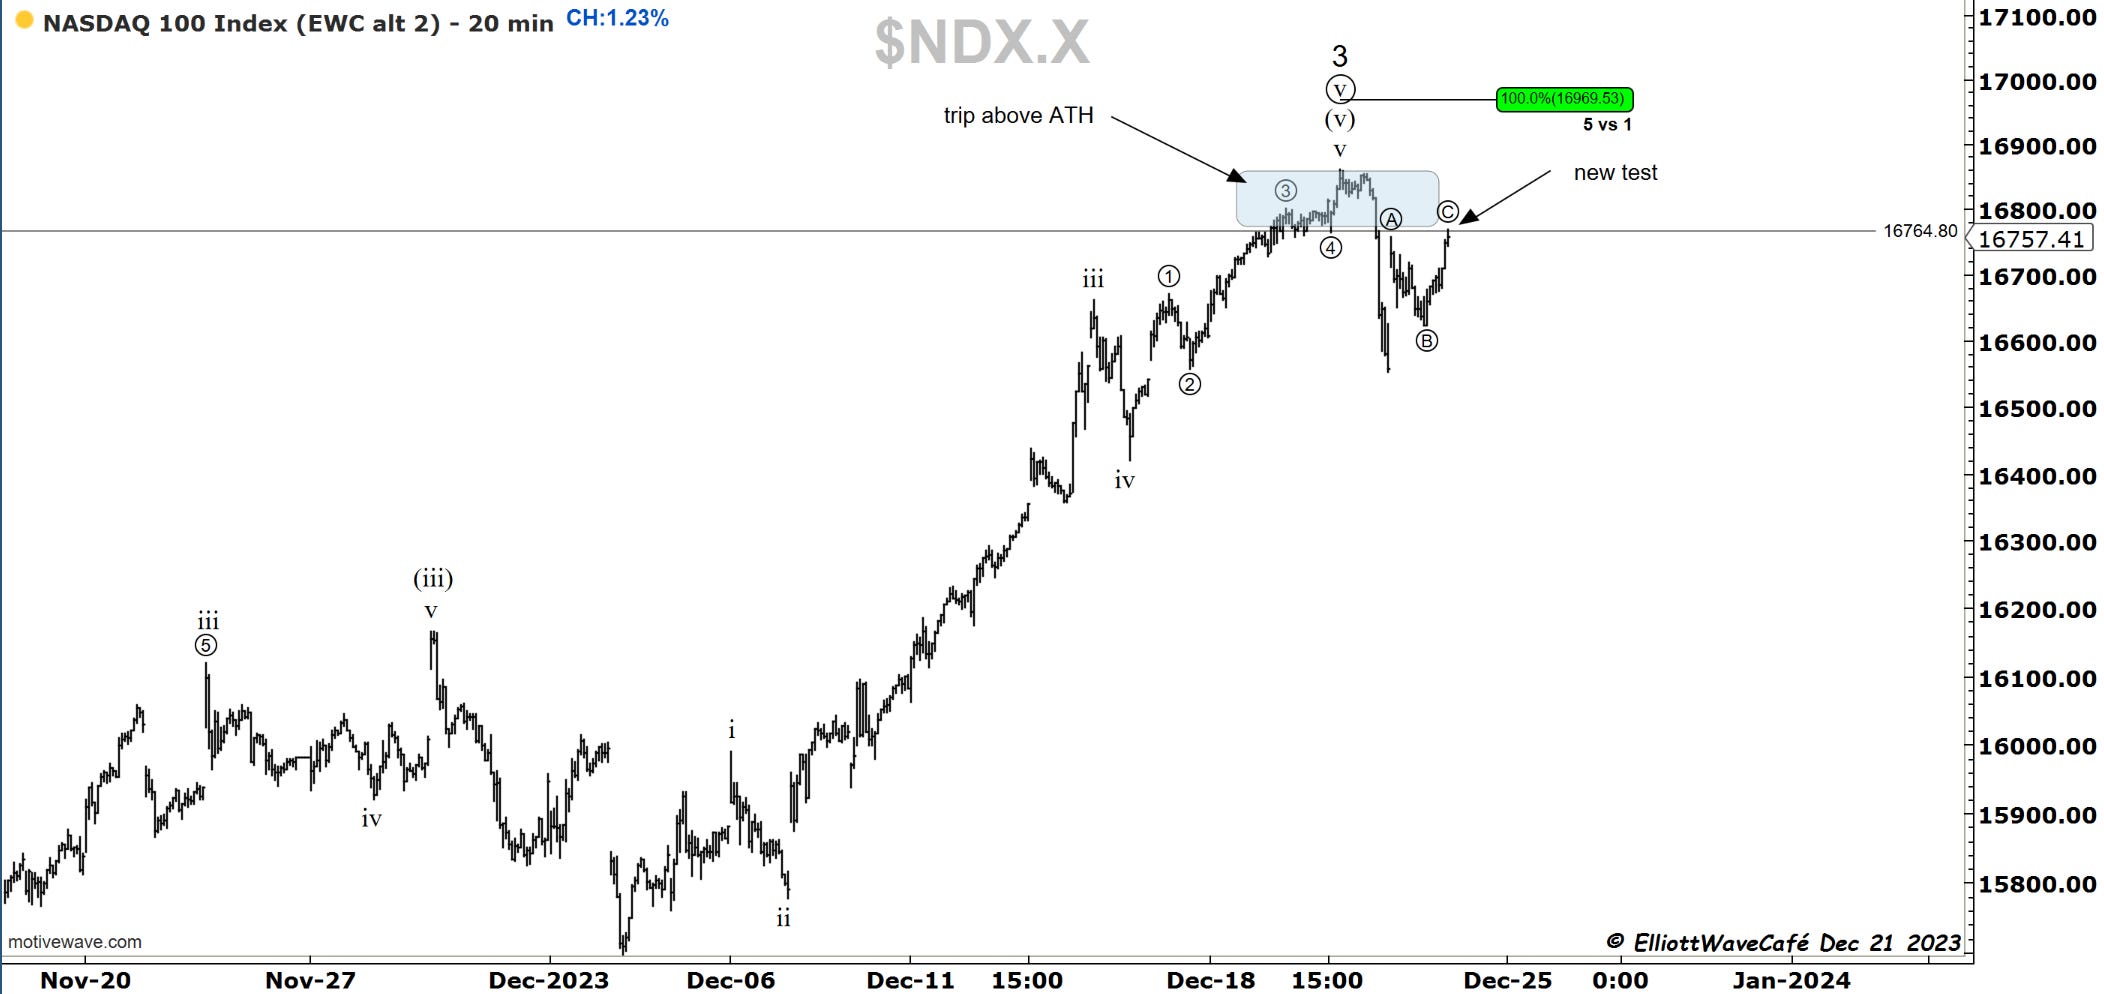
I can’t help but notice a sharp decline ( motive), followed by a 3-wave bounce. As an EW practitioner, I can’t ignore this. I also noticed a violation of the uptrend from early Dec lows. I also noticed the limited trip above the new ATH and the current re-test. With all these odds in favor of a turnback lower, of course, the market can jump to new ATH once again. Not my bet. That’s what makes a market.
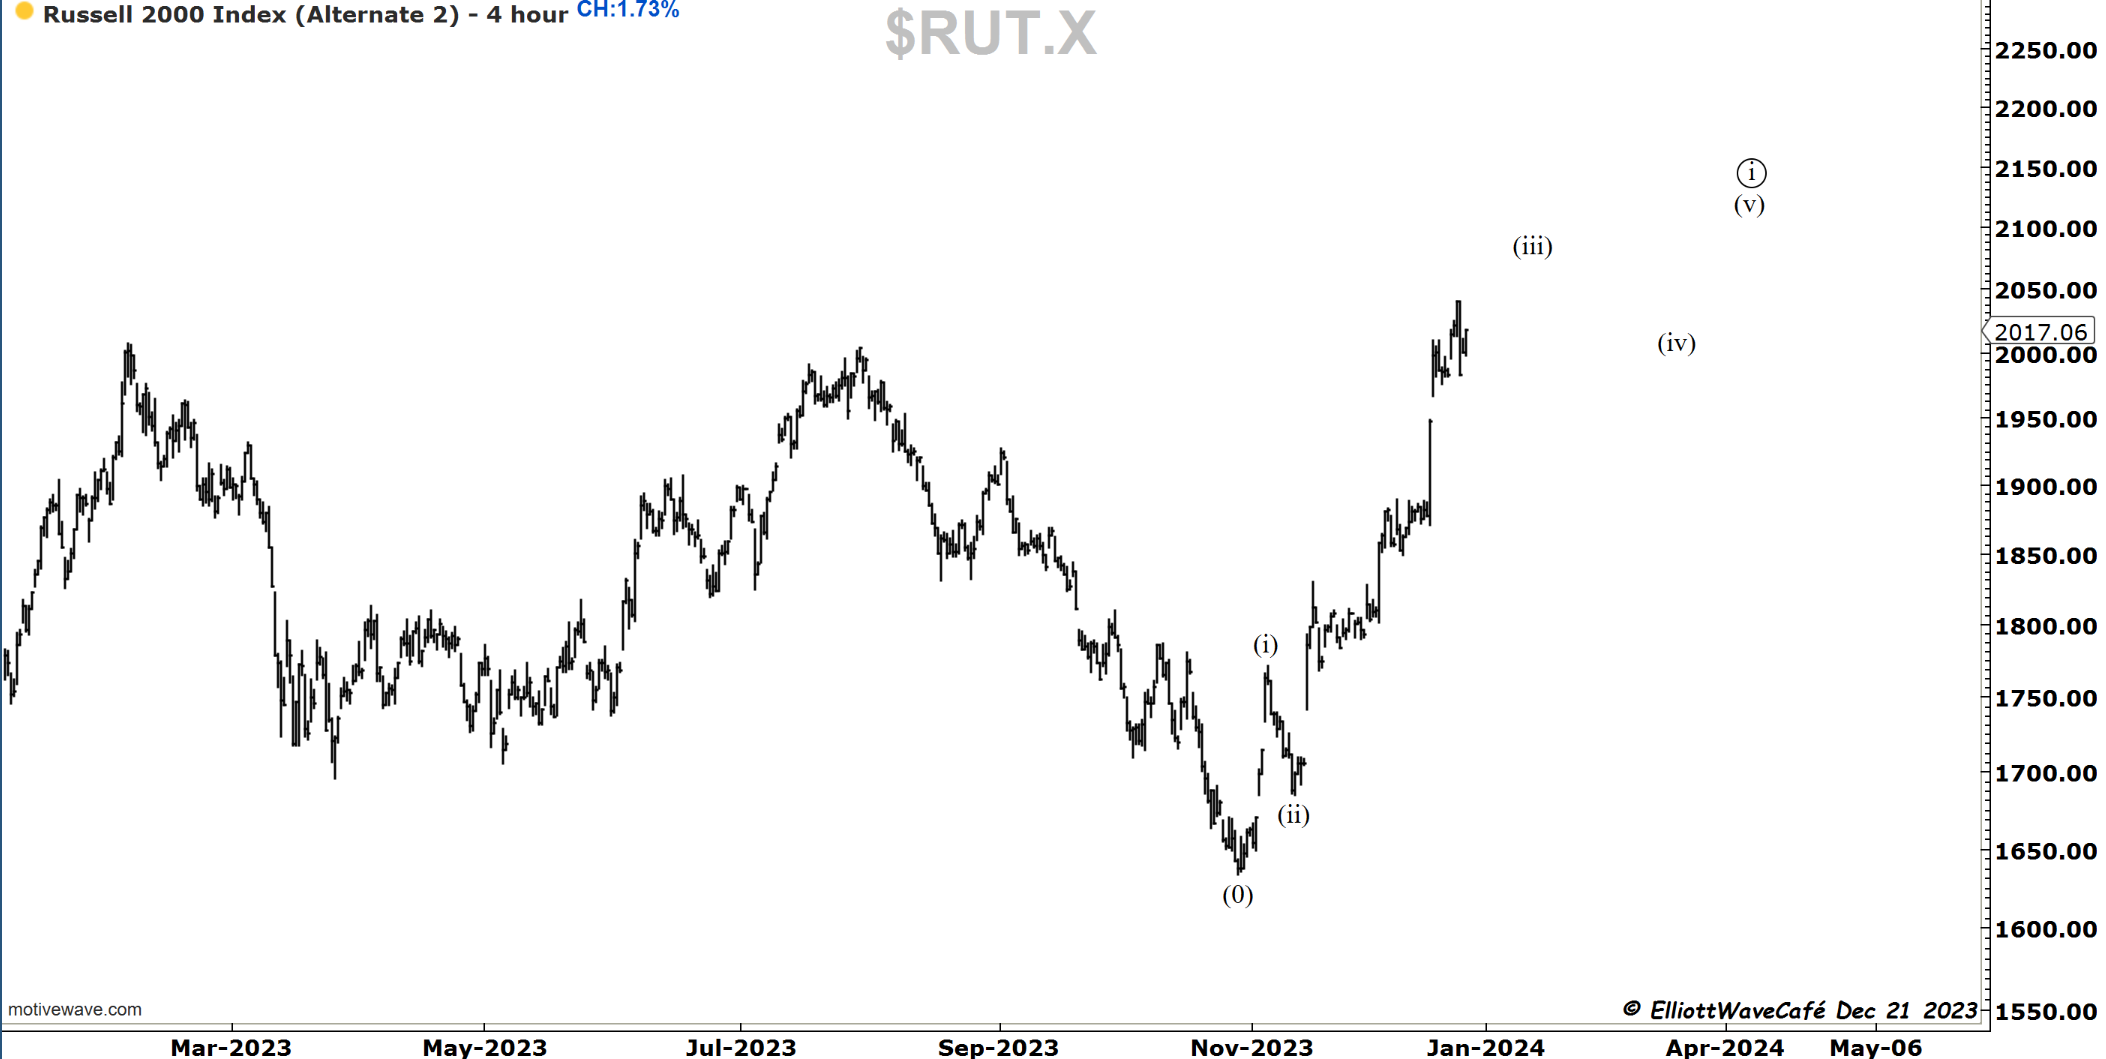
RUSSELL 2000
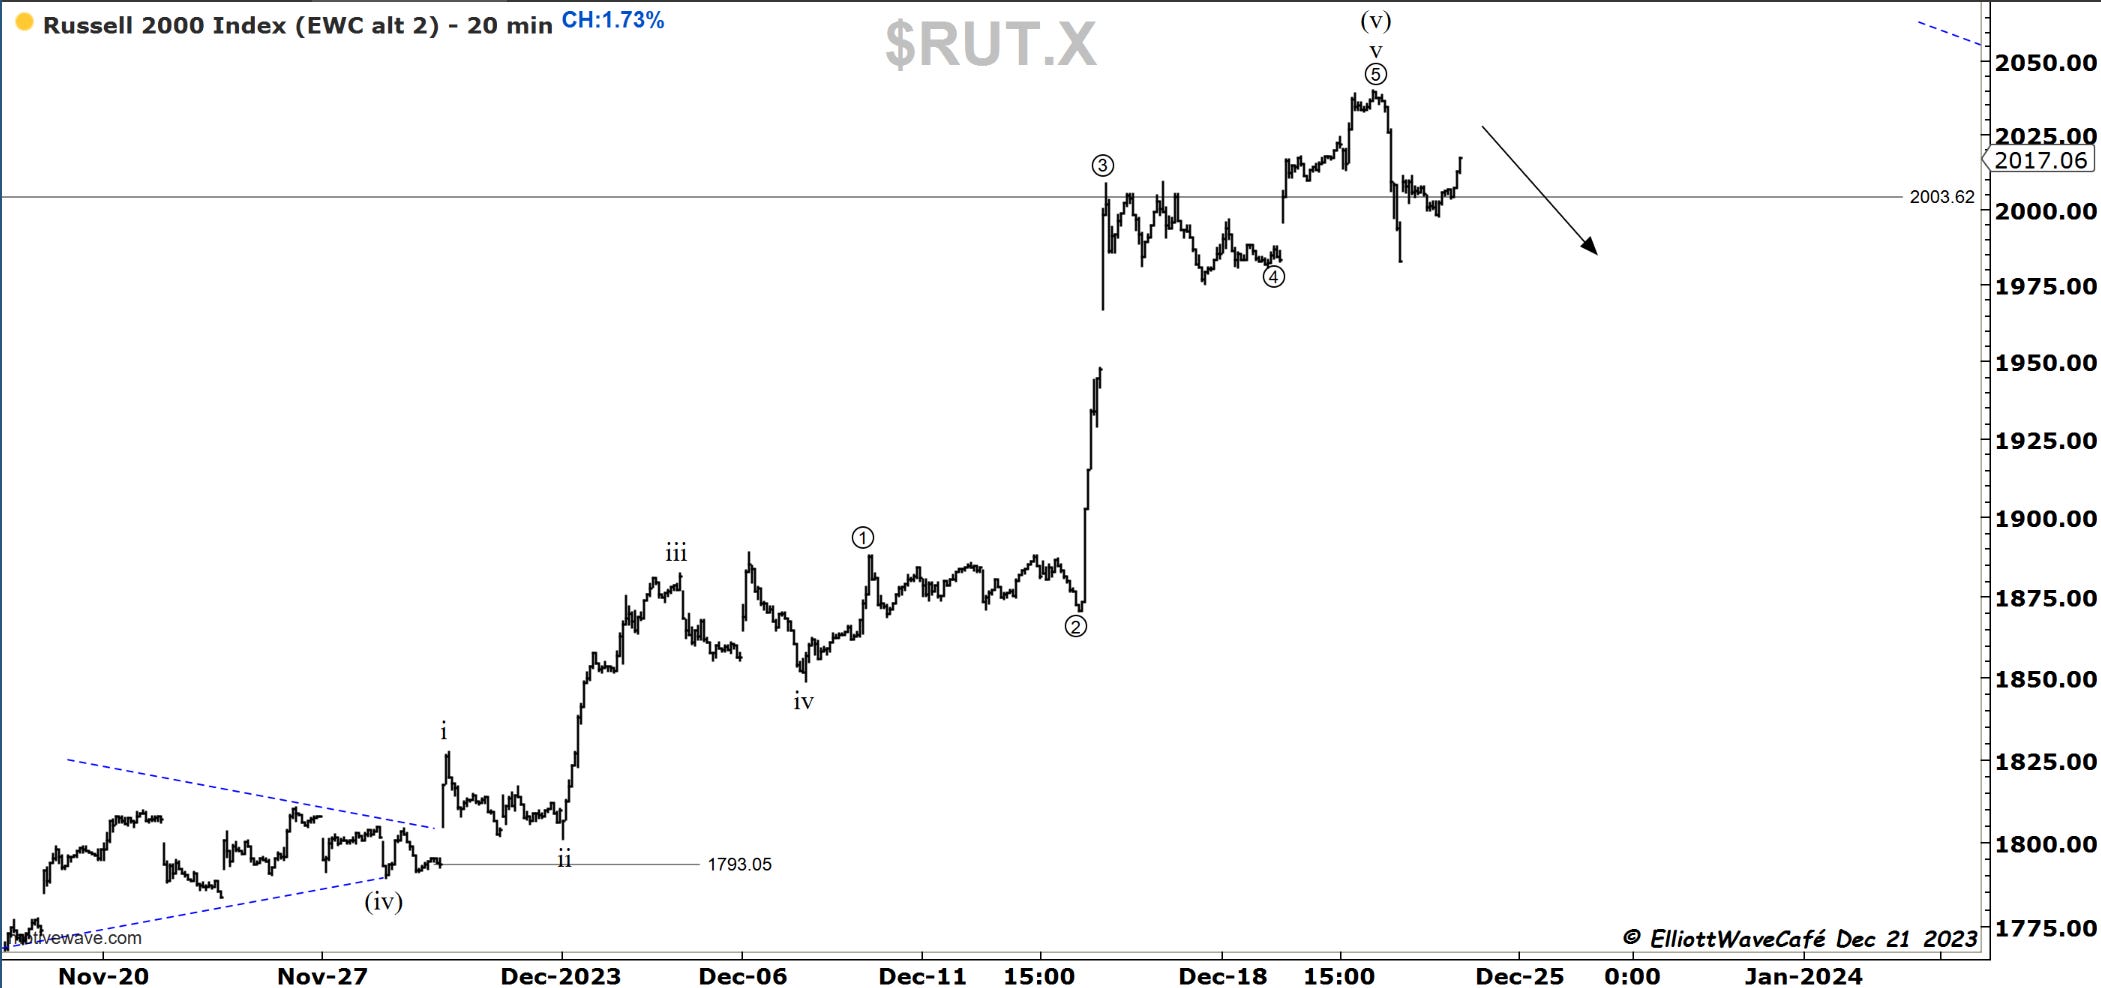
Look at the wave perfection since Nove 27th lows. (I am not talking about my count, but rather the waves themselves and how well they are displayed).
I might be wrong about the higher degree ( see second chart), but the internals, even at 20 minutes, are quite amazing.

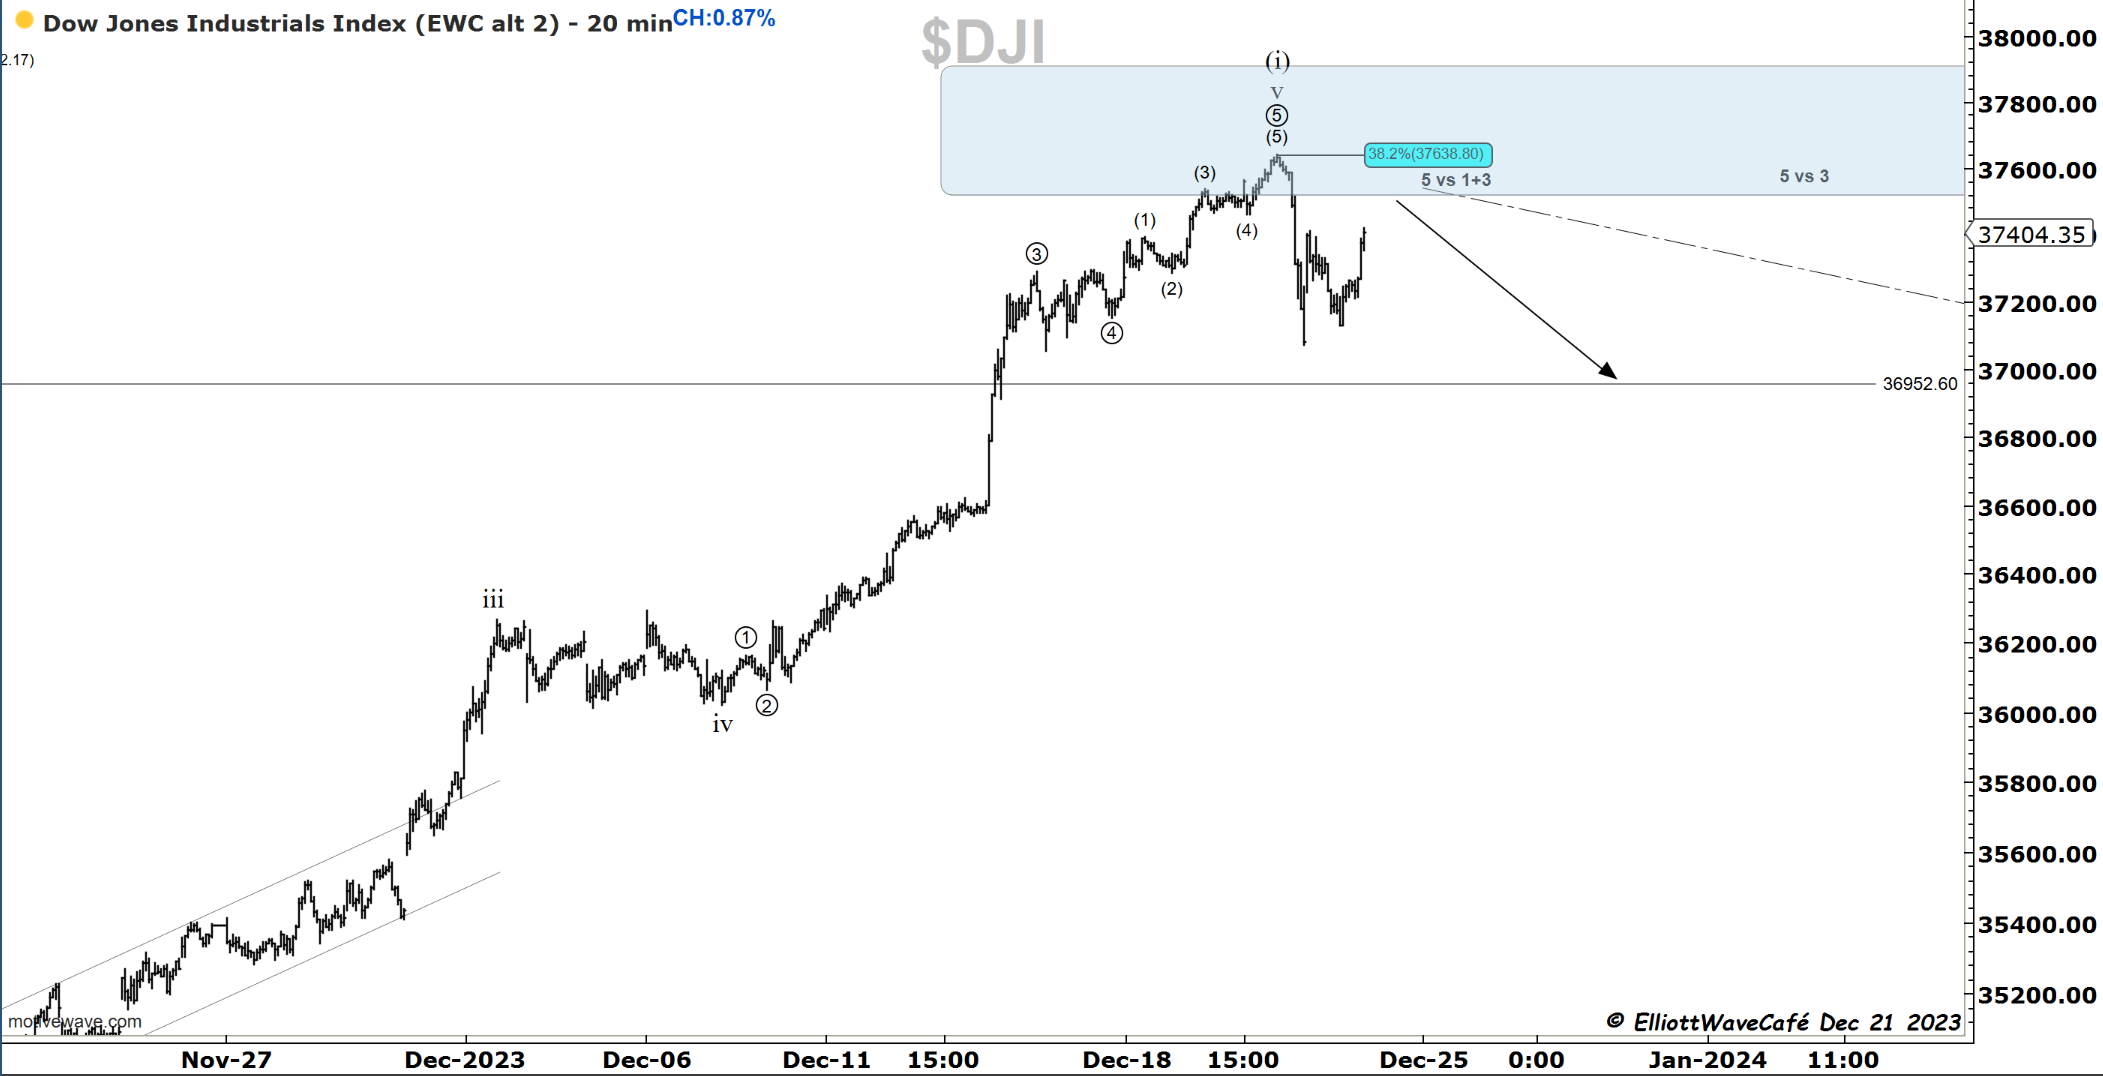
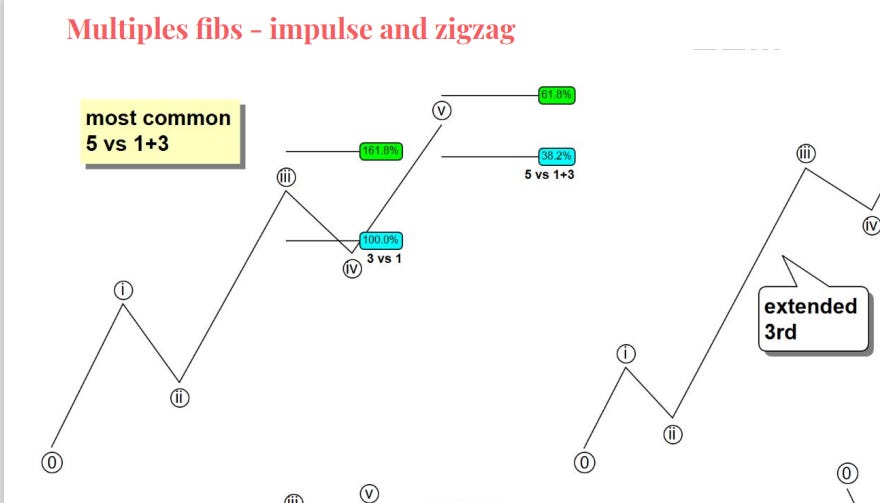
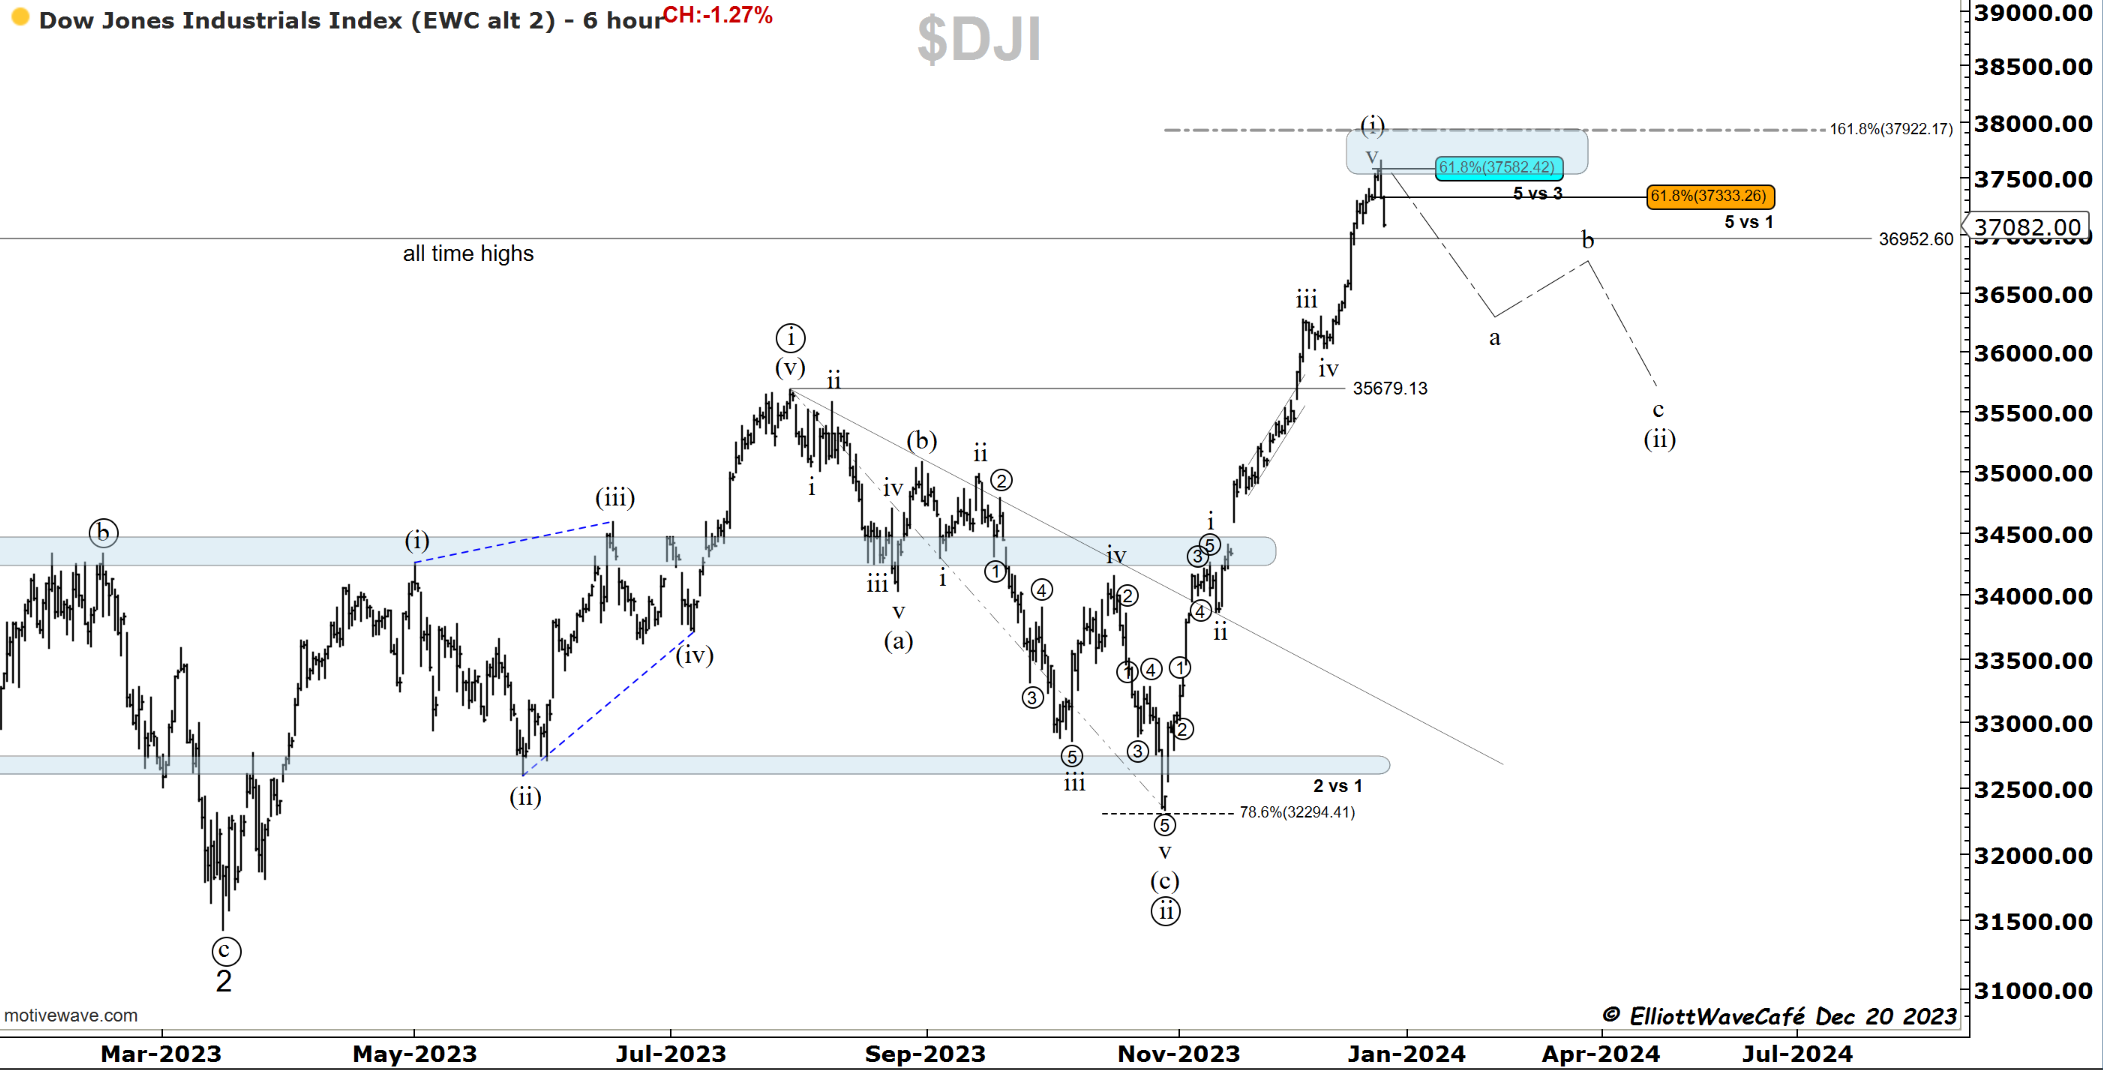
Dow30
Here is a 20-minute chart of the Dow. See that 38.2%? Let me send you a quick shot from our EW course ( i think i wrote that one 4yrs ago). Same as in the other markets, a selloff for whatever reason and then 3 waves up for now. My bet is lower.
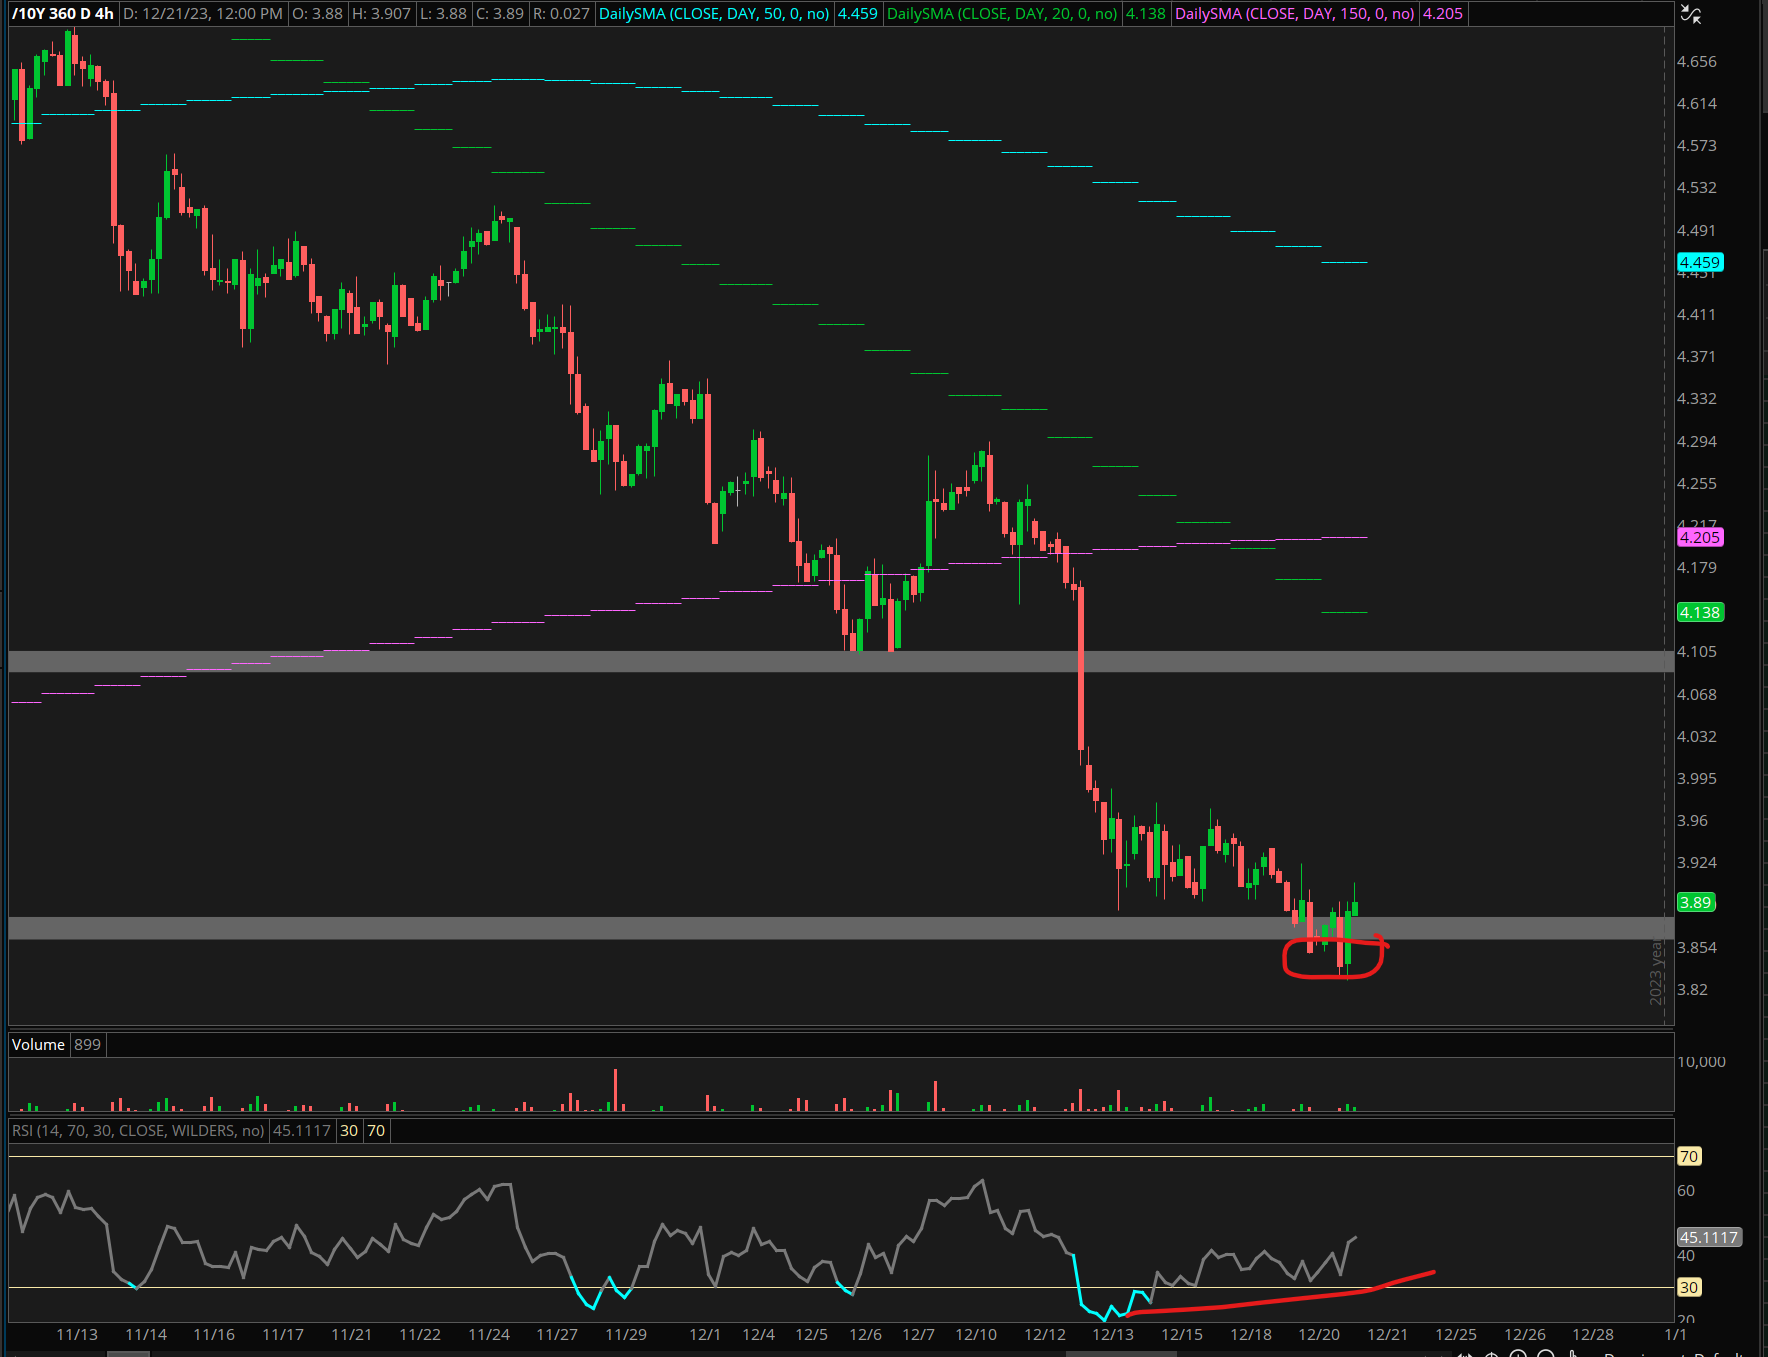
US Dollar and Yields
Like I said yesterday, the lack of response from the greenback following a marker rout suggests there is more downside. Today, we made another low. Equity bulls have this going for them in case we go higher yet in equities. But make no mistake, we have a 101.20 zone just below. So tread lightly.
Look at that quick break below support and a close higher. Now look at the RSI. A decent bounce in yields is being prepared by the market.
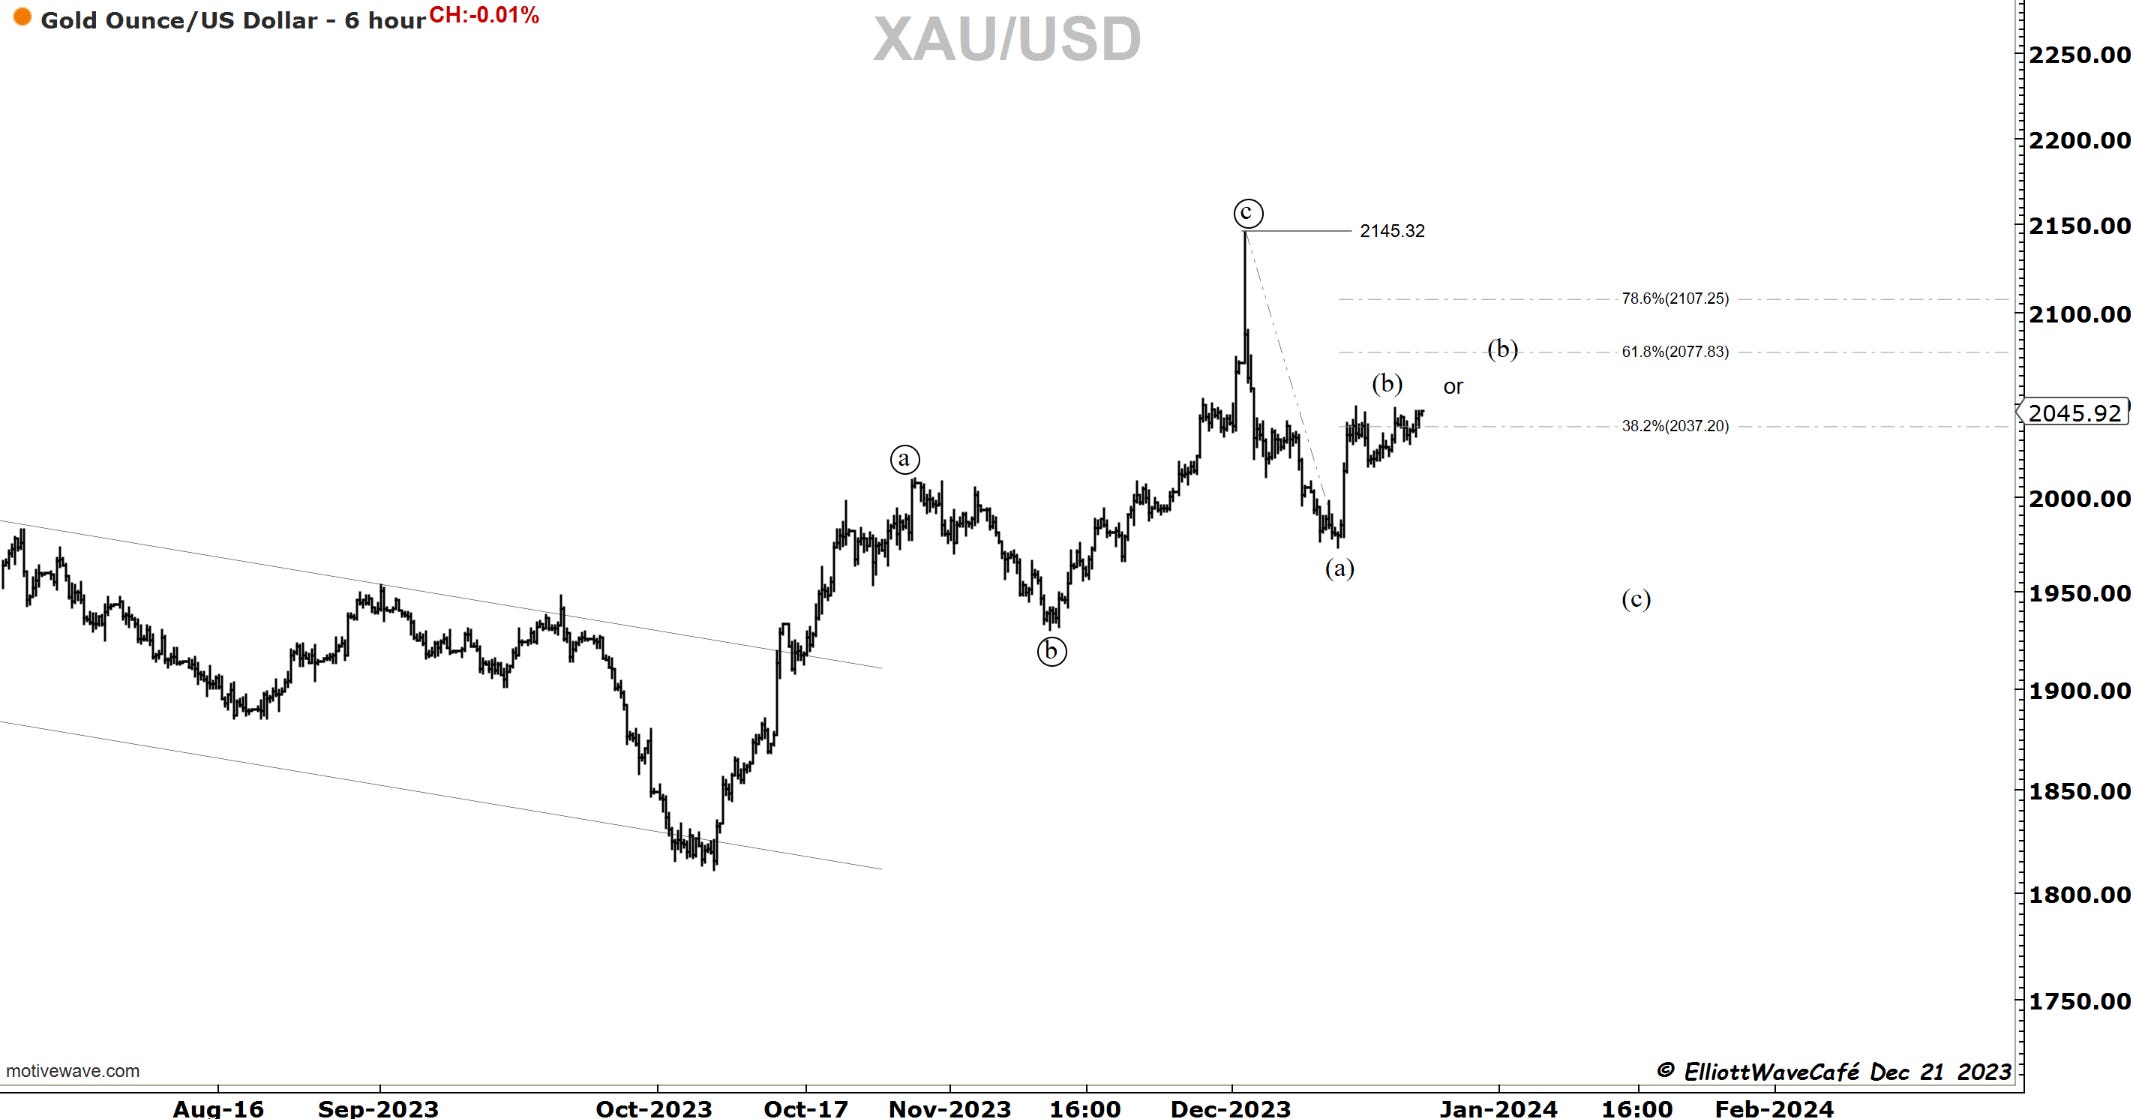
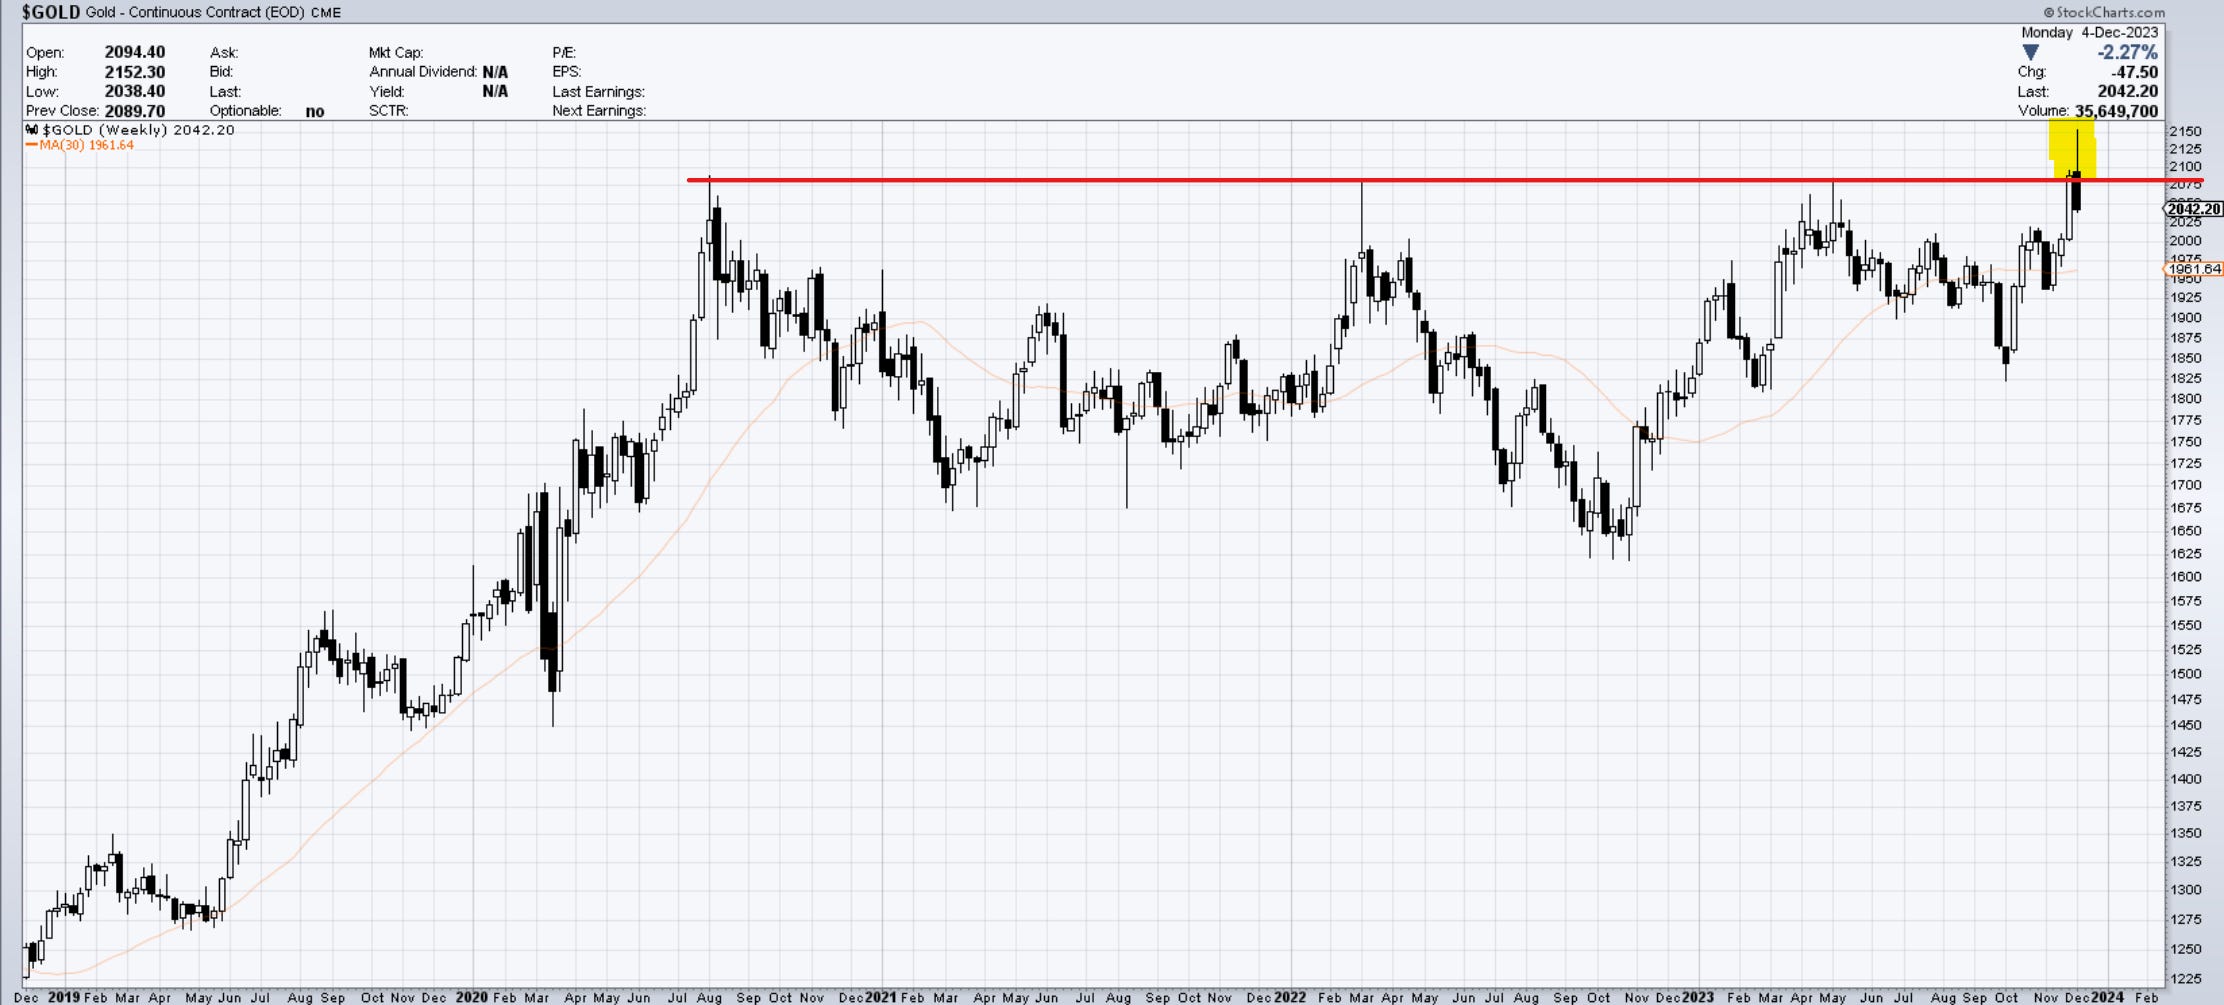
Gold
Gold made no real headway up or down. It remains resilient however after that strong weekly failure. Let’s see how it behaves as the dollar comes into support.
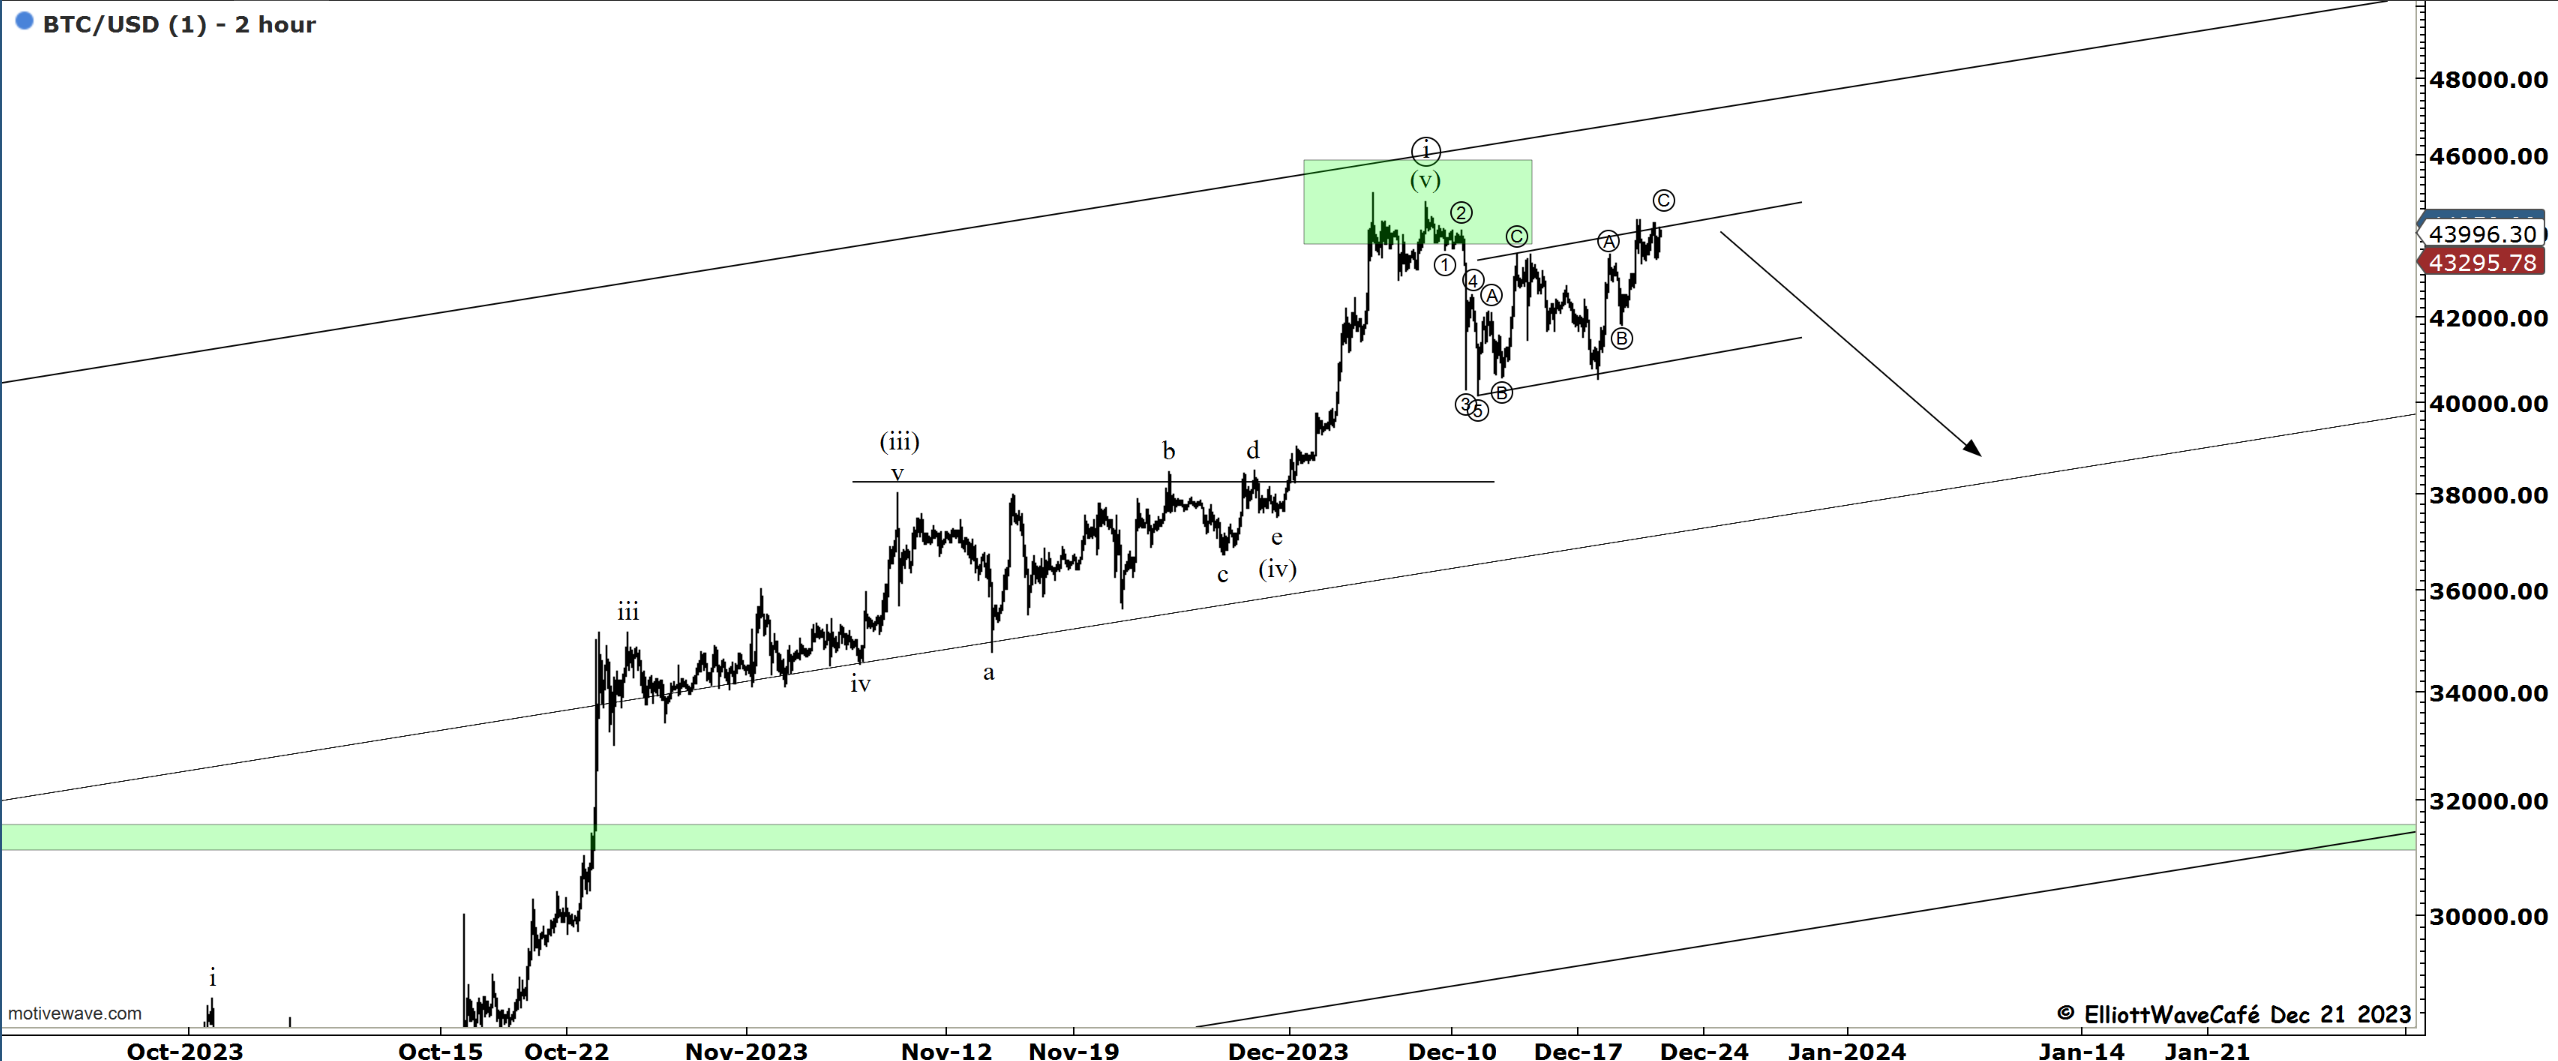
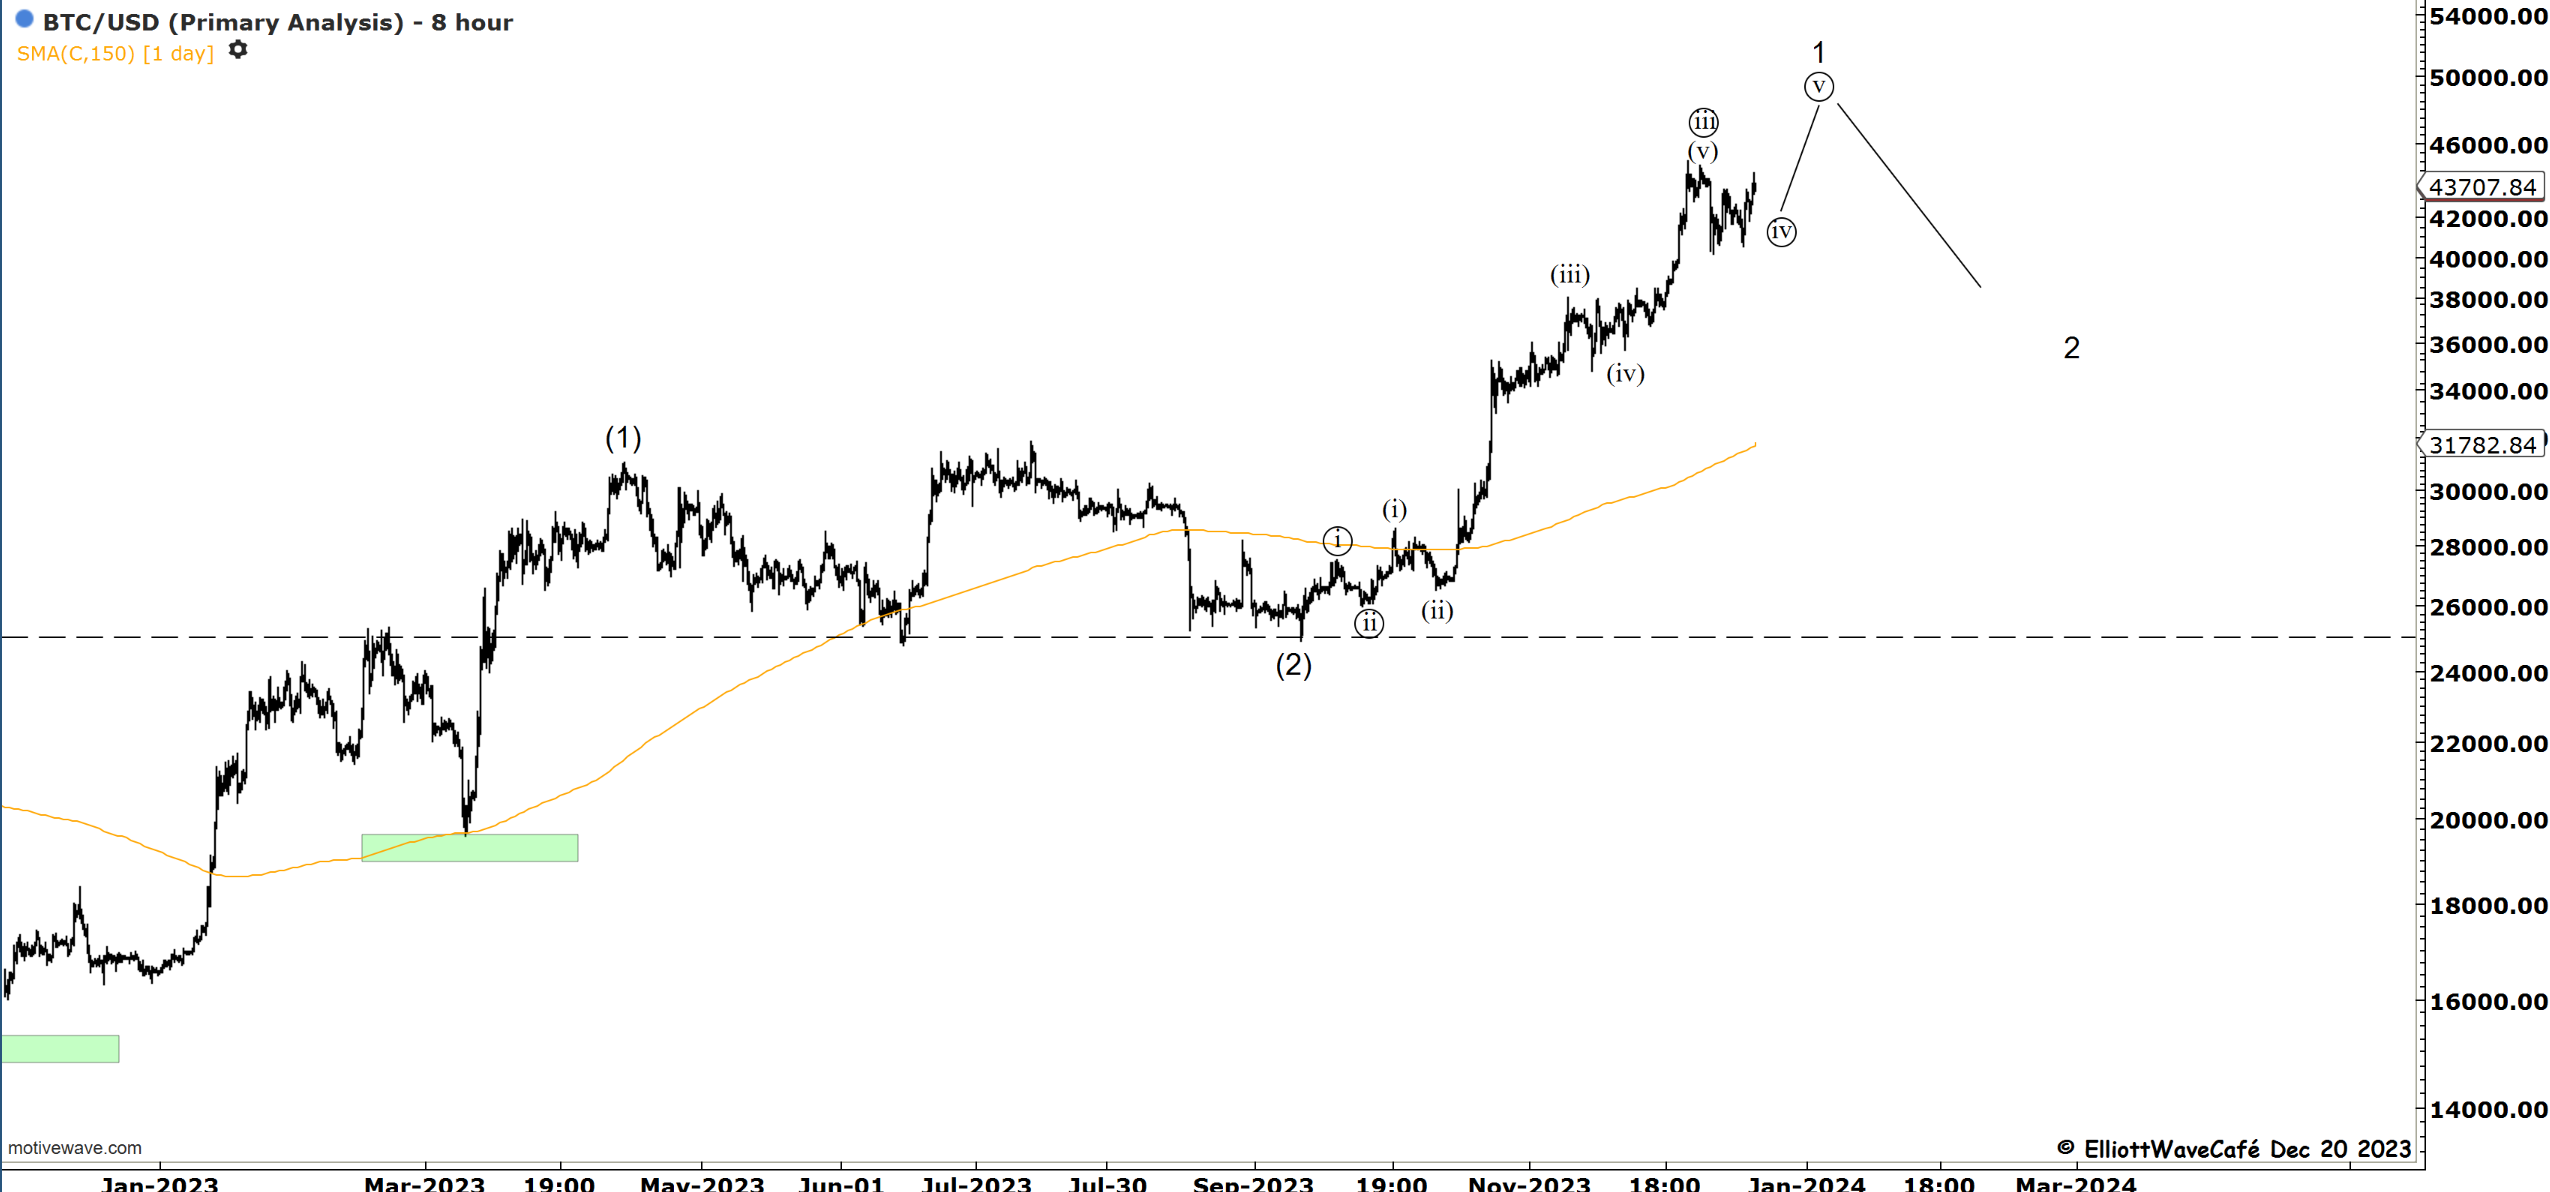
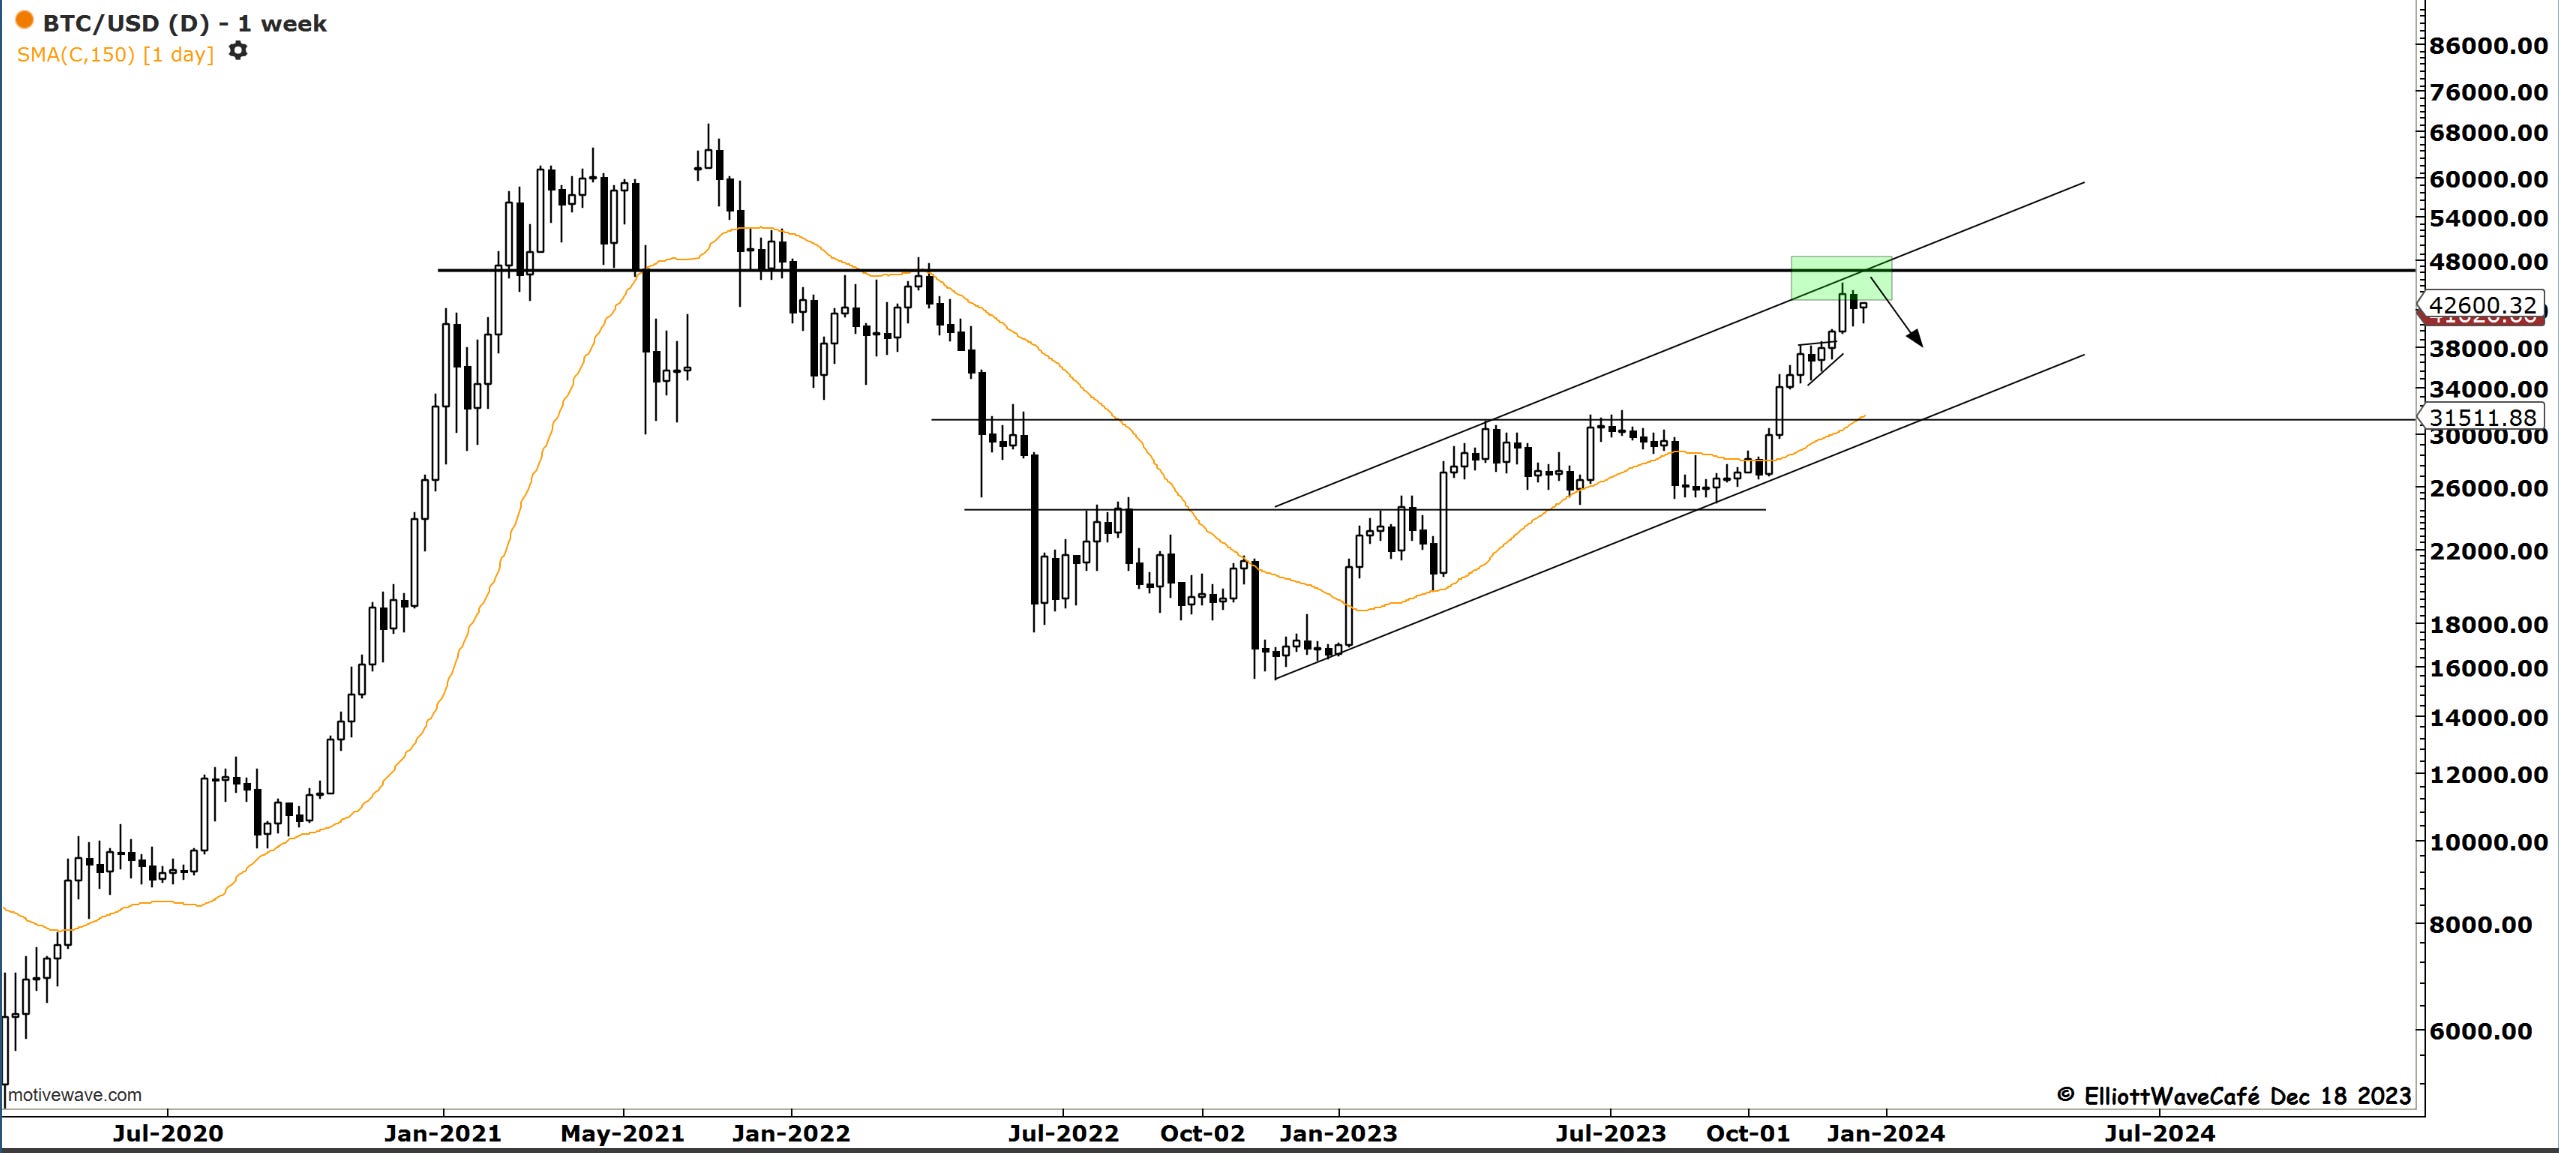
Bitcoin
She’s nearing the highs once again, knocking on 44,500. Look who’s hiding just above. That line does not have to be respected by price, but that’s not the bet I want to make with fresh money. The third chart shows how a quick fifth wave higher can terminate the move. 41,800 is a decent protective level lower. Below that, things can turn nastier.
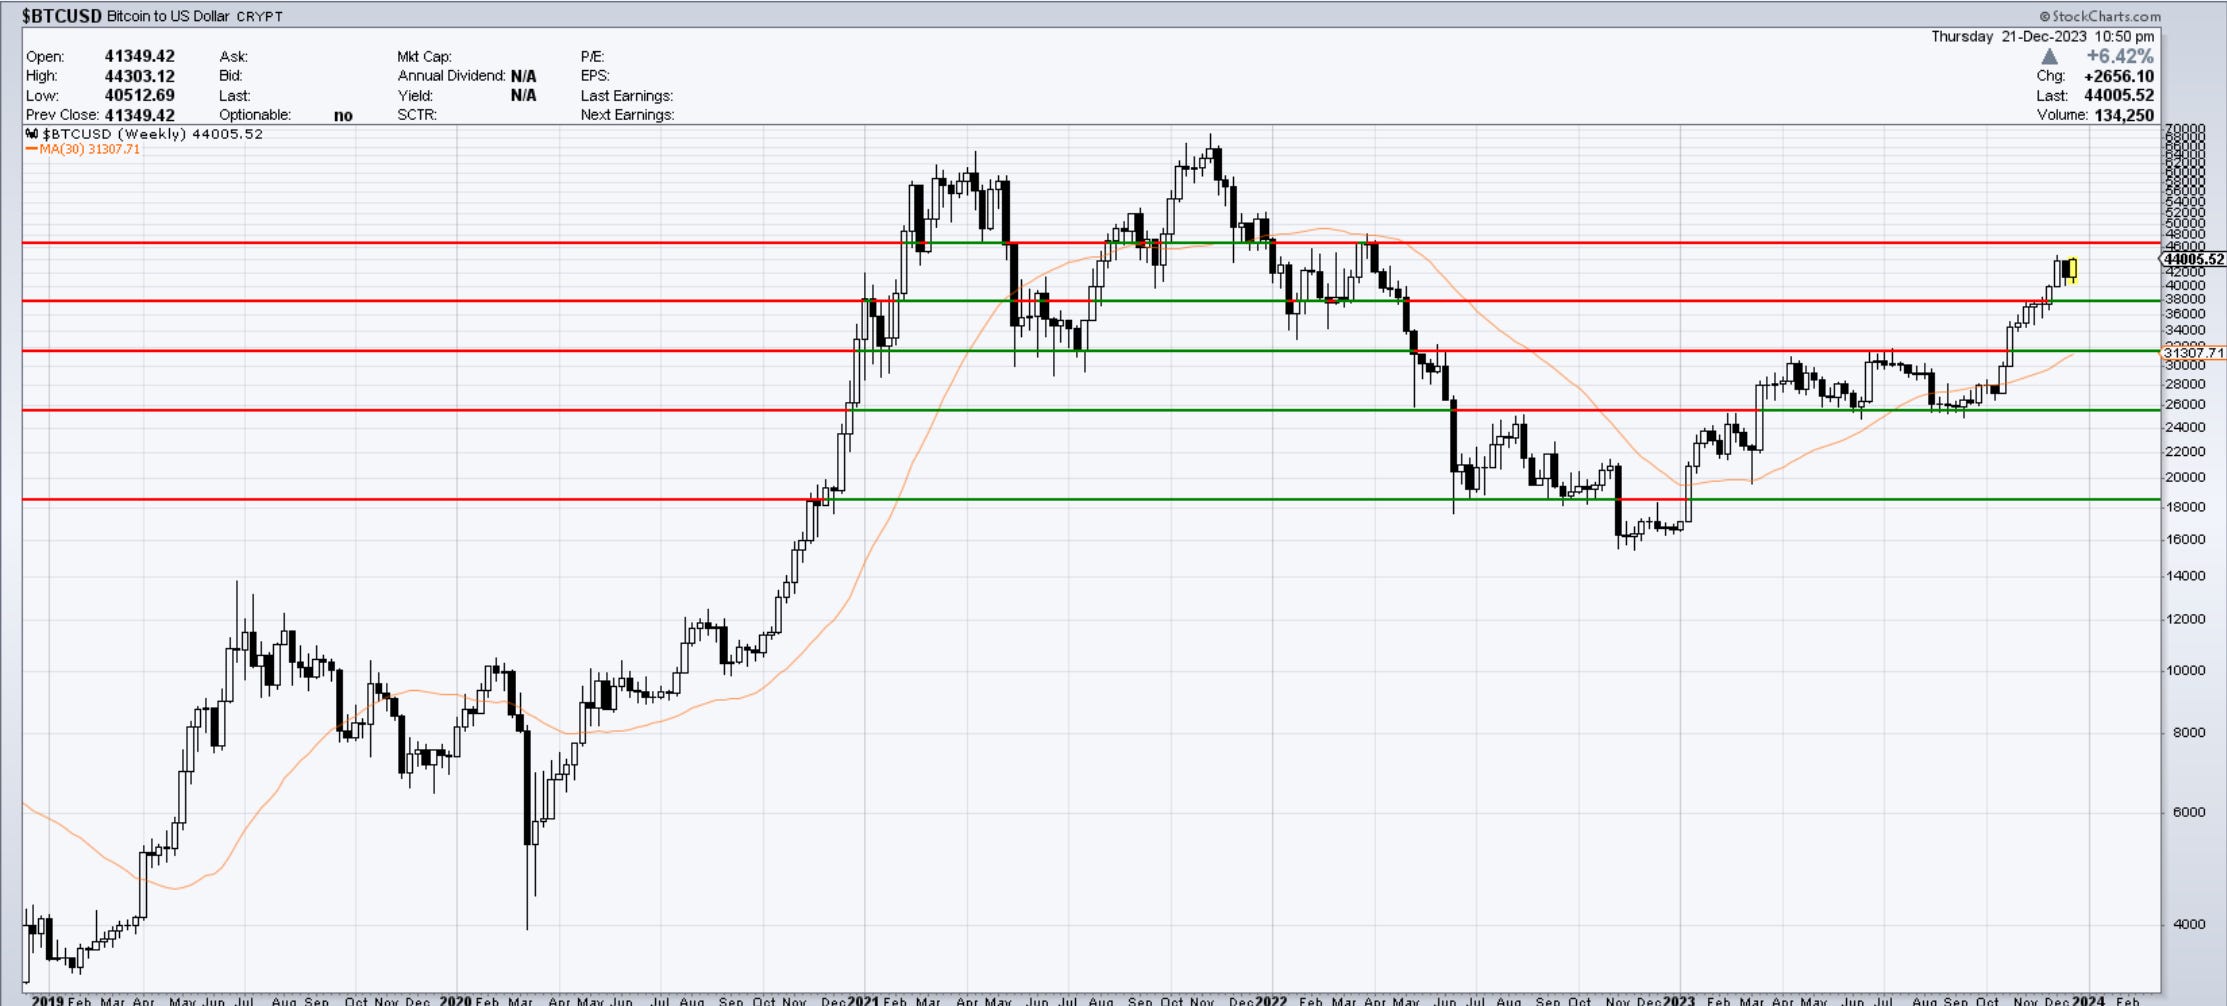
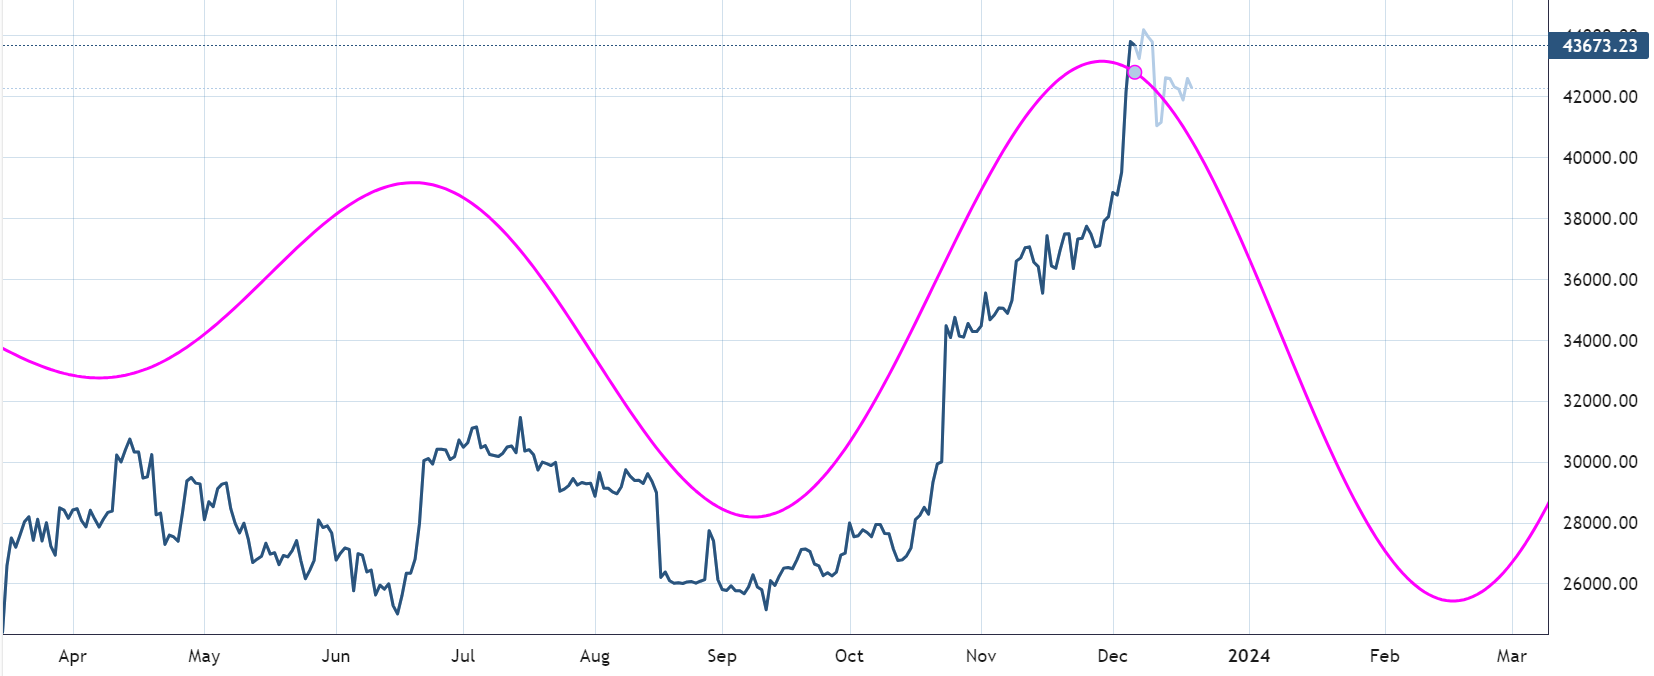
Here is the updated price action in BTC since cautioning of a likely topping cycle.
“Double shot” Daily member video coming up next,
If you’re new to Elliott Wave or need to refresh, there is a 7-hour video course with downloadable slides under The Coarse tab on the website.
Have a great day wherever you are! - trade well, and don’t forget to subscribe and drop a like if this letter helps you in any way.
Cris
email: ewcafe@pm.me