
The Daily Drip
Markets review, strategy and analysis
Note: The EW counts on the right edge are real-time, and they are prone to adjustments as price action develops. Elliott Wave has a fluid approach, is evidence-based, and requires constant monitoring of certain thresholds.
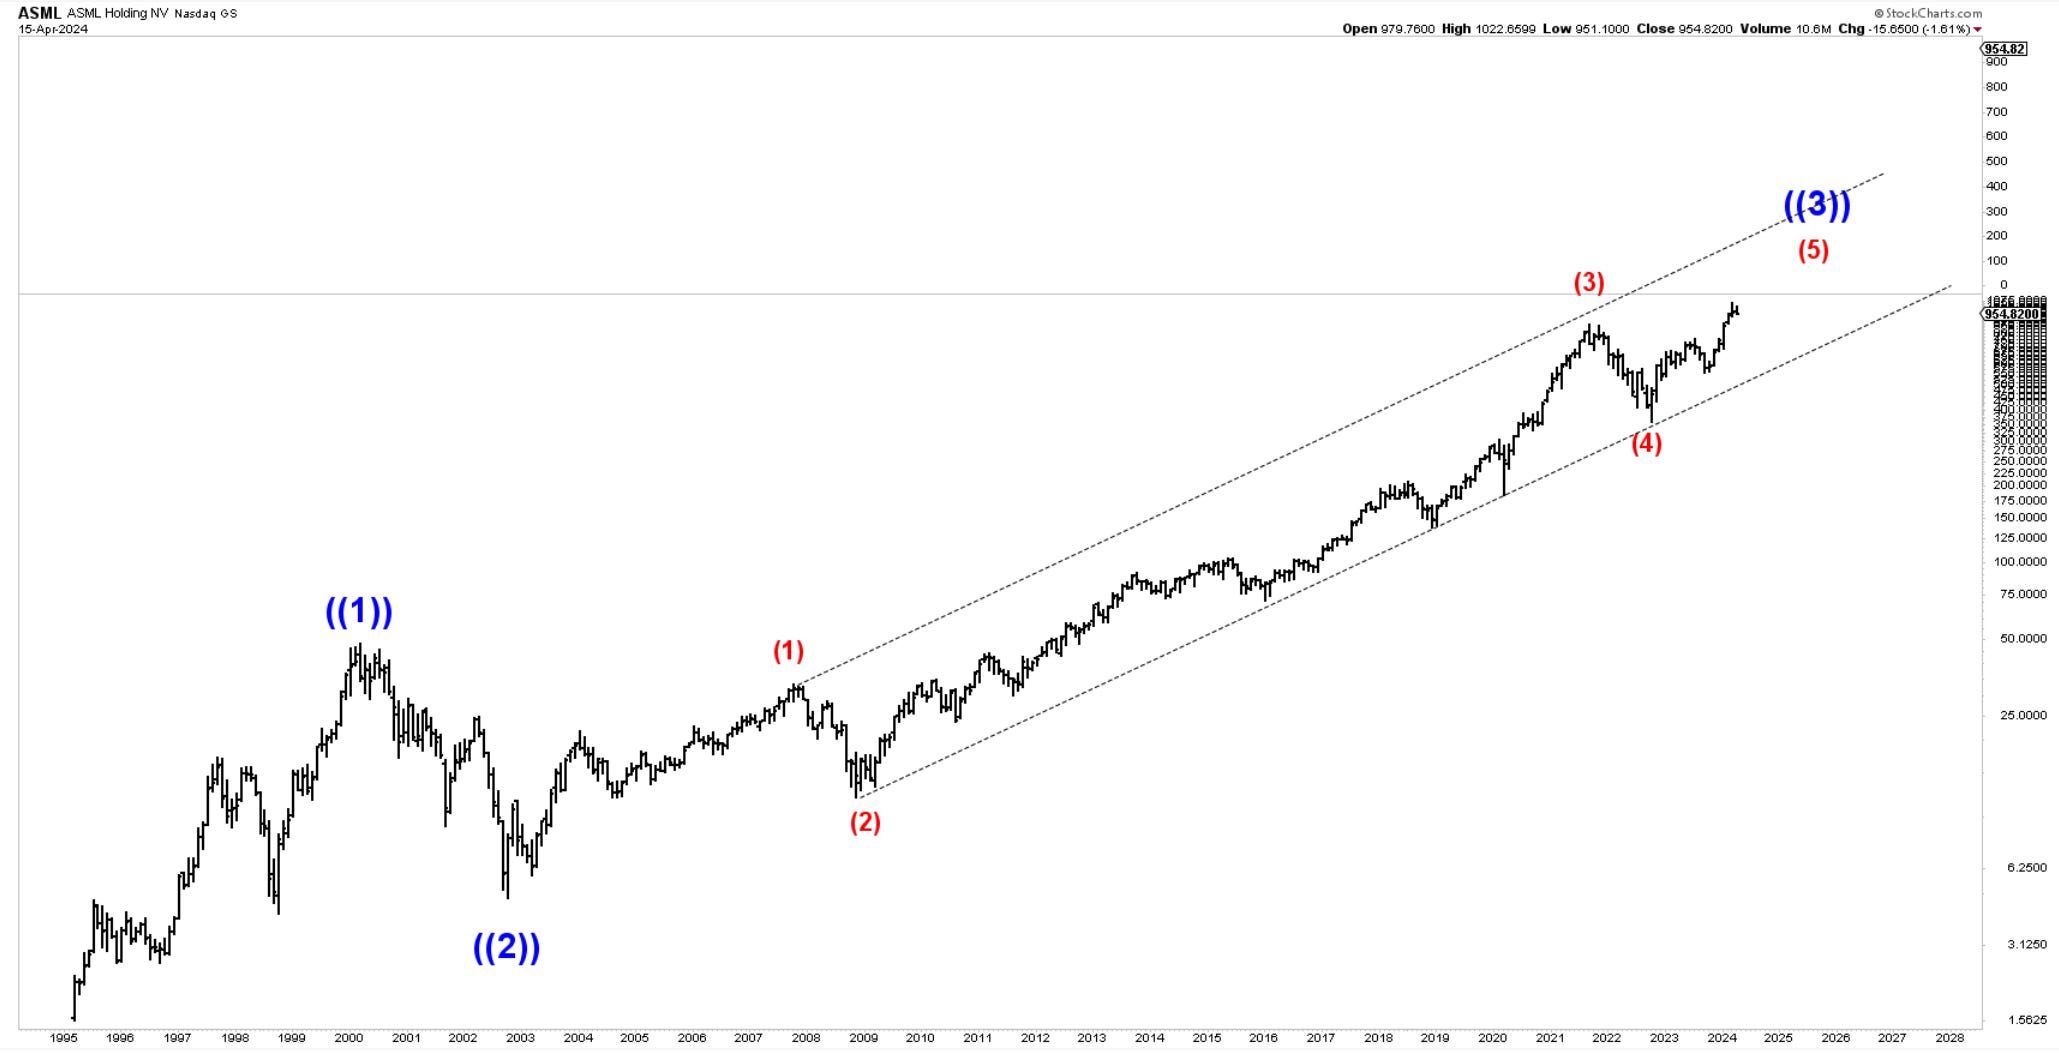
In the counts below, this (( )) = circle on chart
Chart of the Day—ASML— A monthly view of the larger wave count in this semiconductor stock.
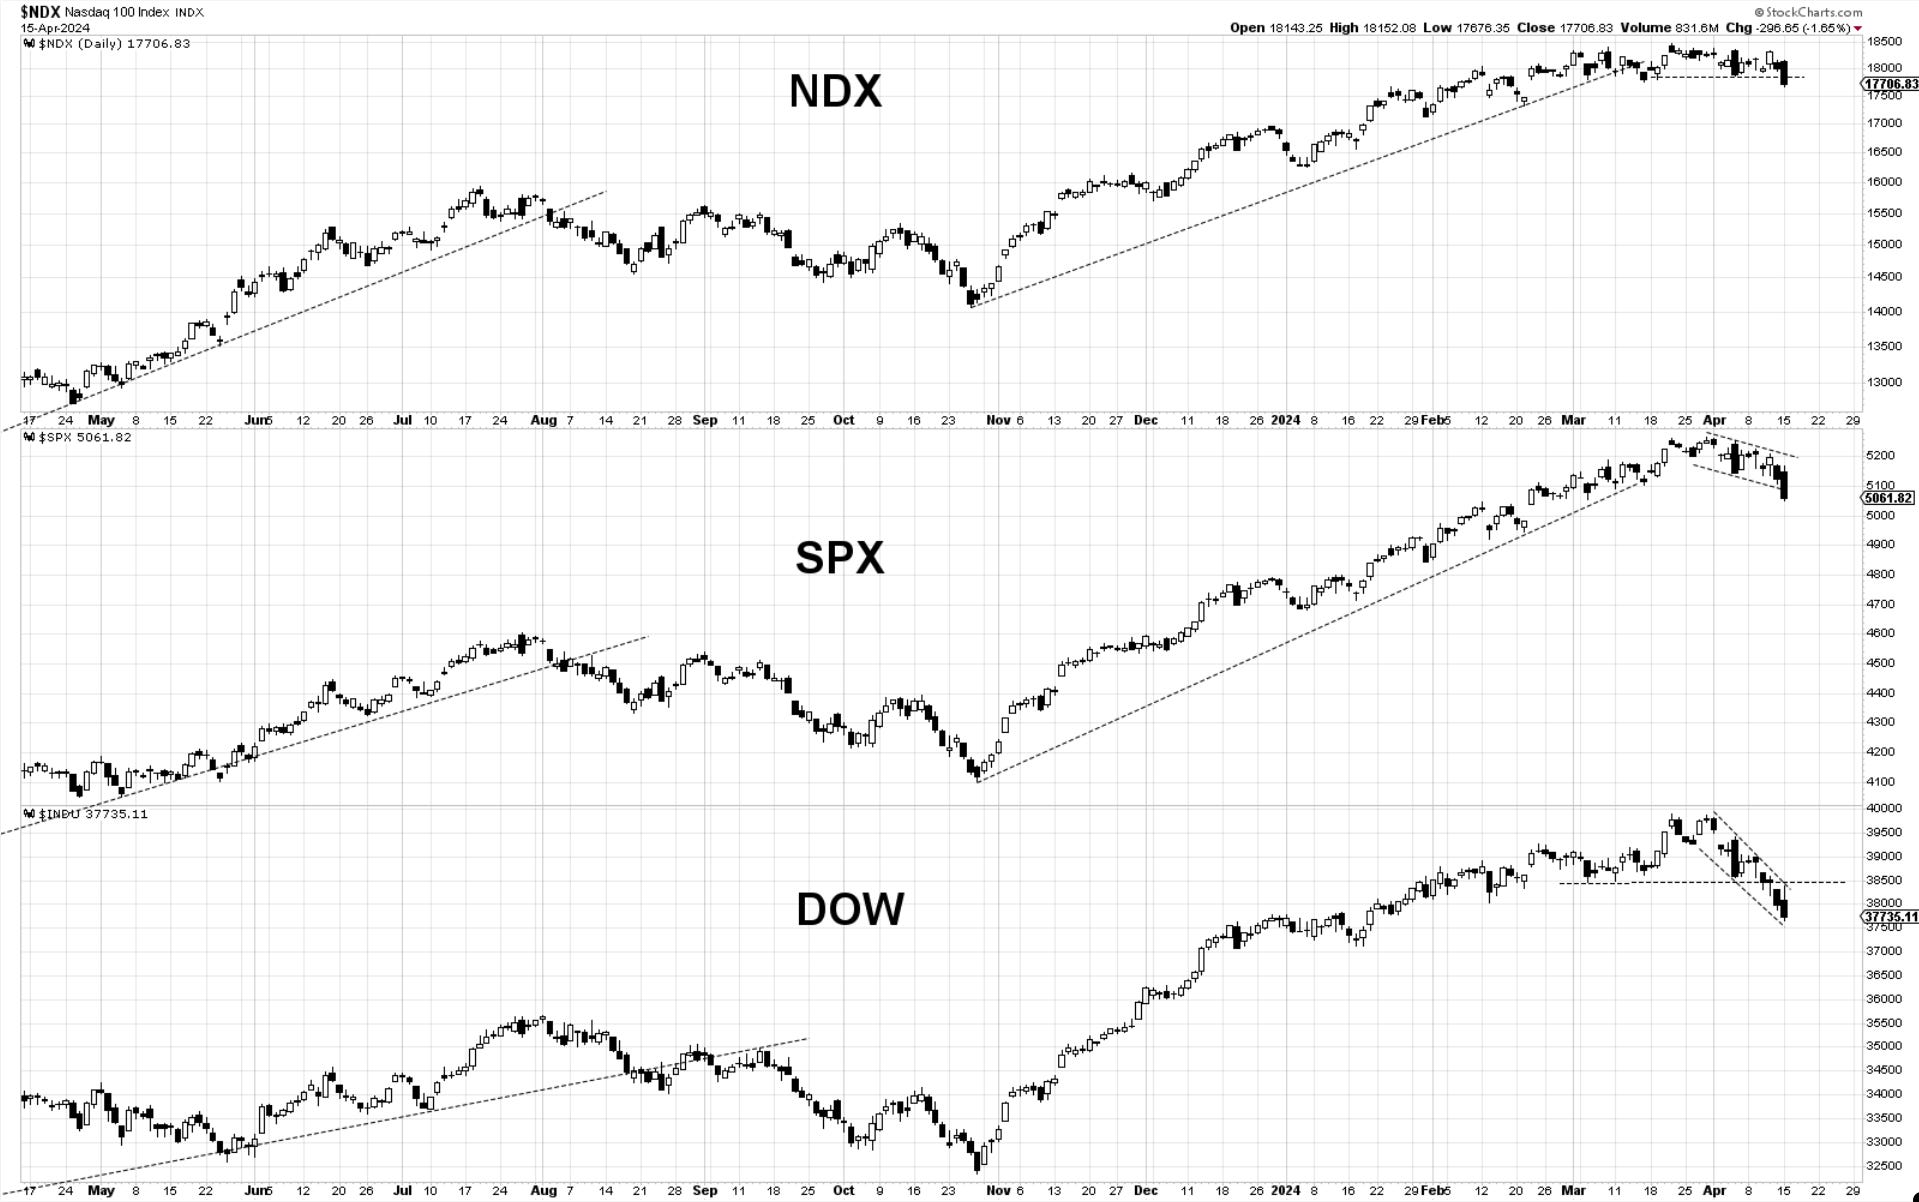
Bottom Line: Both Friday's and Monday’s actions have sent indices below crucial levels of support, triggering a signal that the market has entered a corrective period. Reducing long exposure and raising cash is preferred until signs of upside buying come in heavily.
Let’s dive into charts and further commentary below…
