
The Daily Drip
Markets review, strategy and analysis
Note: The EW counts on the right edge are real-time, and they are prone to adjustments as price action develops. Elliott Wave has a fluid approach, is evidence-based, and requires constant monitoring of certain thresholds.
In the counts below, this (( )) = circle on chart
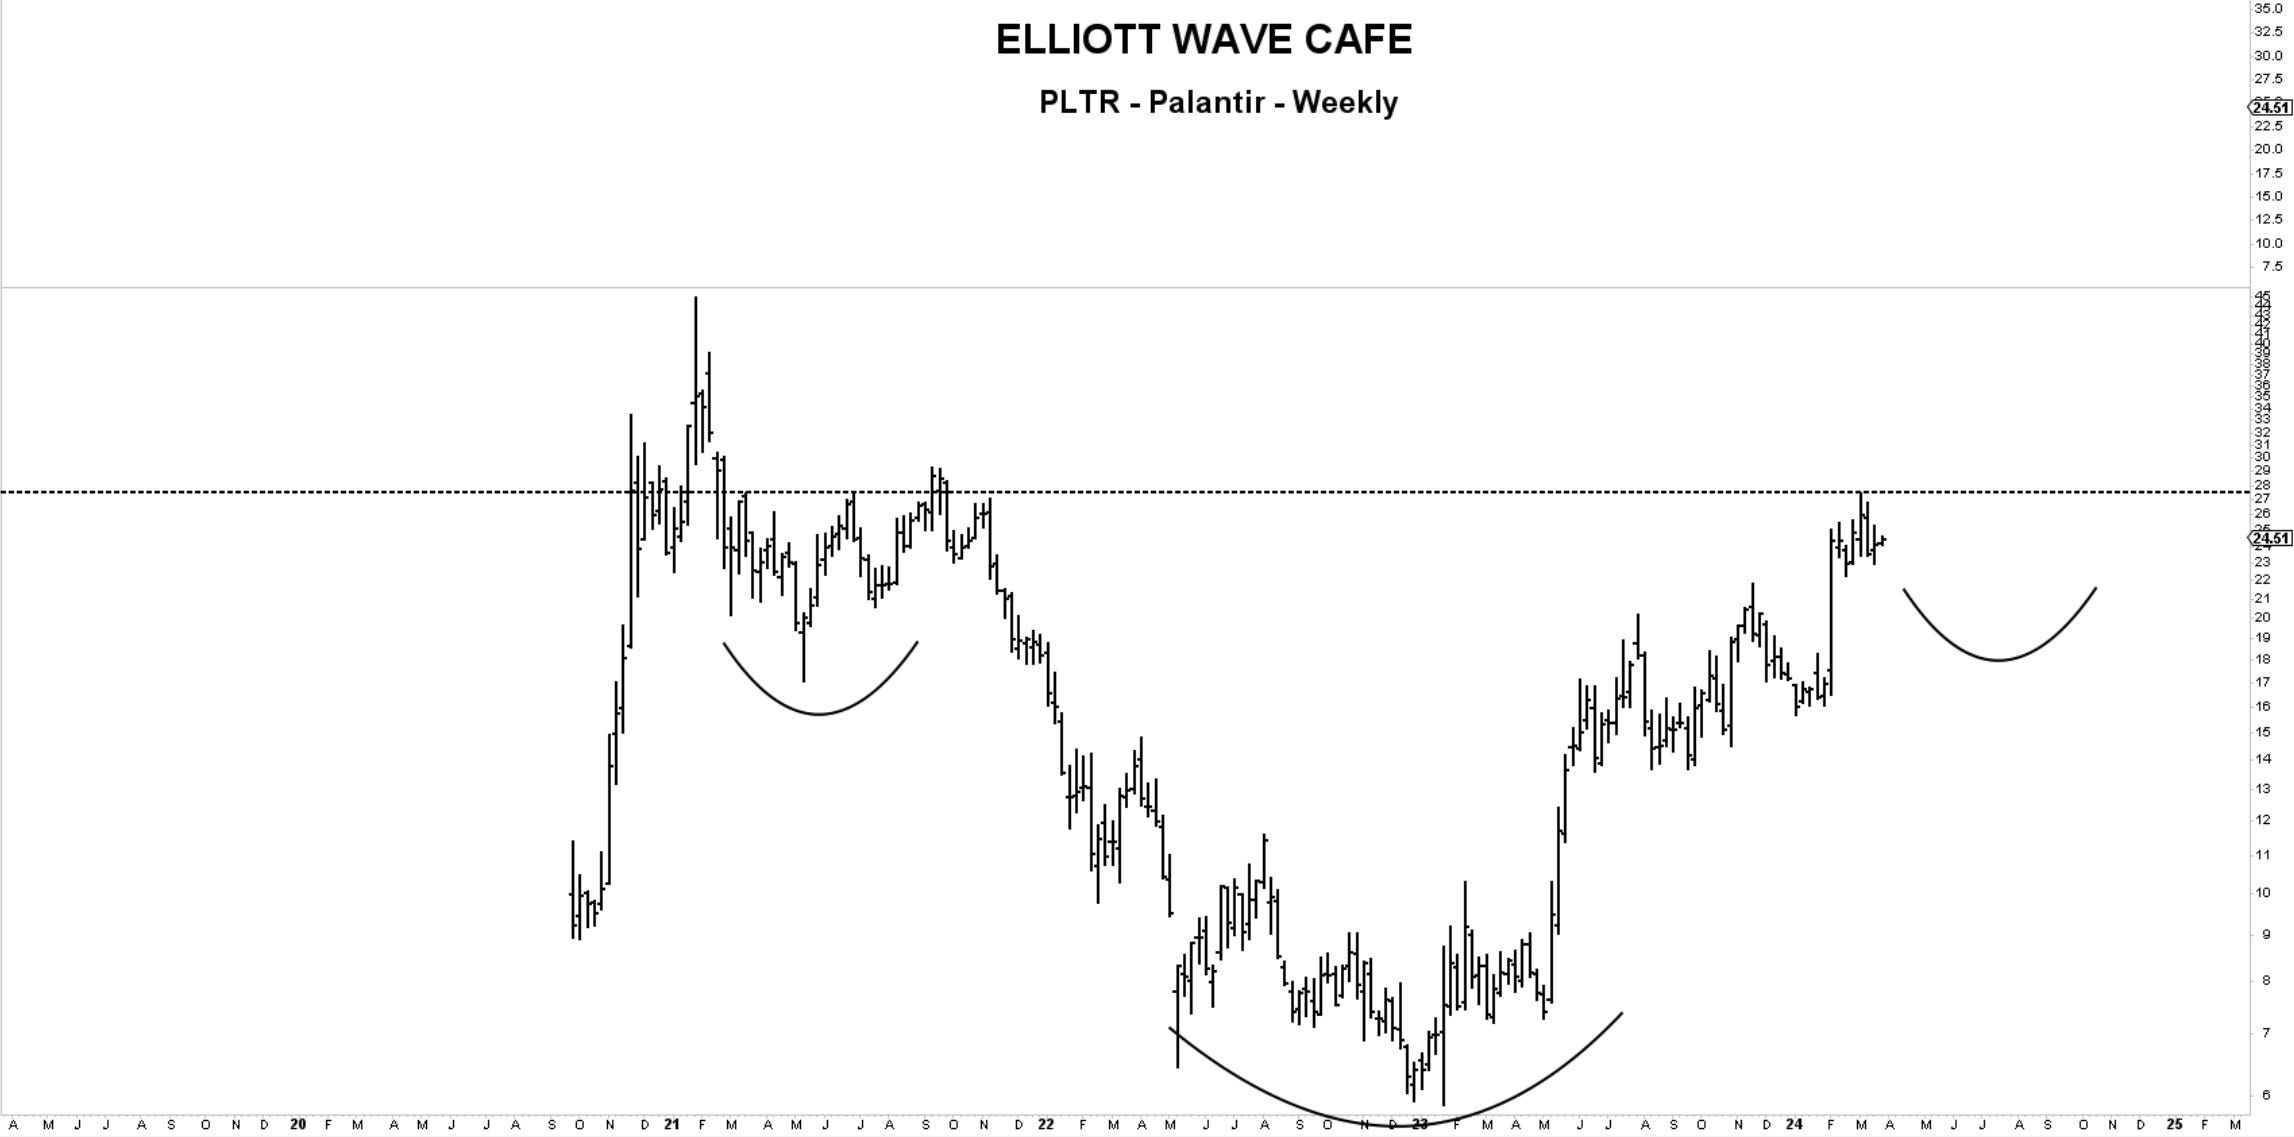
Chart of the Day: PLTR—This stock is now back to its summer 2021 levels. There is pretty heavy resistance from current levels to 30. Any throwbacks towards 20 should continue fining bids. The main focus is now the break of the upside neckline, which, once taken out, can propel this stock toward the $50 level. A break of $16 lower would be the cutoff line in terms of defense.
We closed off last week by discussing some out-of-the-ordinary moves in the breadth indicators we follow. Historical evidence shows that they seemed to be typical of exhaustive moves in the markets and are usually followed by some level of underperformance.
In today’s note, I will review Elliott's wave patterns on core markets from a daily and hourly perspective. The notes will be brief; I will discuss the counts in the daily video.
