Note: The counts on the right edge are real-time, and they are prone to adjustments as price action develops. Elliott Wave has a fluid approach, is evidence-based, and requires constant monitoring of certain thresholds.
In the counts below, this (( )) = circle on chart
SP500
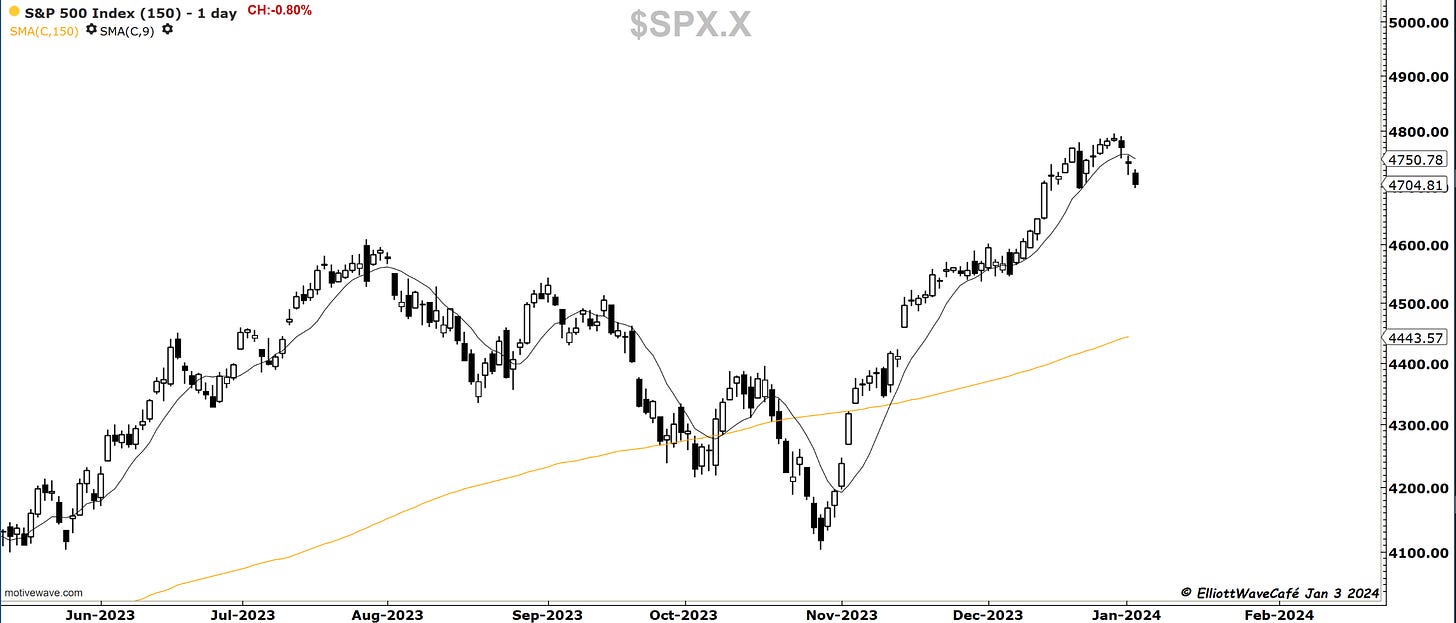
The selling has continued today as well, with closes near the lows. The bears have been and remain in control of the price action for now. We should find some support here near the previous swing low of 4697. This coincides with the 20-day MA, so together, it could provide a short-term relief going into tomorrow. However, I expect bounces will be sold, and the market will travel lower towards 4600. There is no need to be concerned at the moment with short-term 20-minute counts, but they do count impulsively and have good wave separations. Again, if this corrective move just started, it should take at least several weeks to unfold.
As a reminder, please take a look at the gaps left unfilled in the SP500. It is not a requirement that they get filled, but one needs to be aware of where they’re located and how that relates to fib retracements and other horizontal levels.
Here, we see the two closes below the 9-day MA. After such a strong rally, this should not be an isolated incident. If anything, it warns of an impending trend change.
The cycle view reminds us as well not to be too aggressive until we run through the valley for a while. Points to late Jan or early Feb.
Nasdaq100
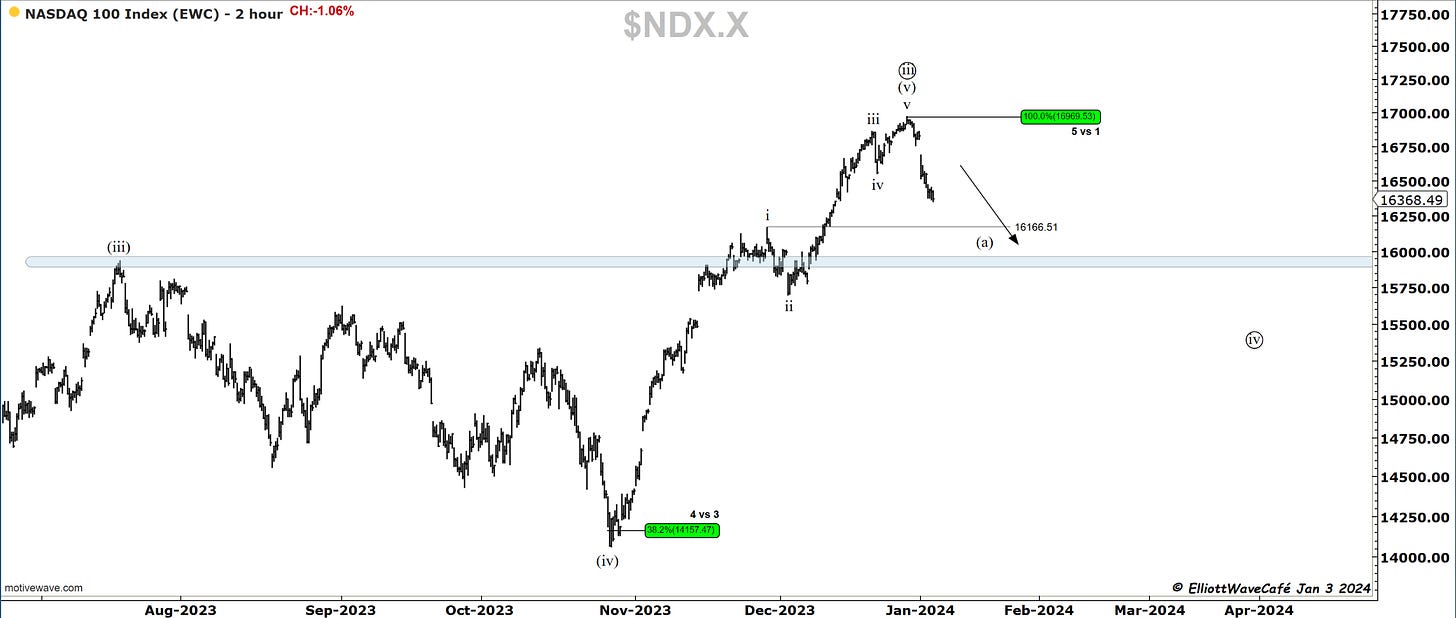
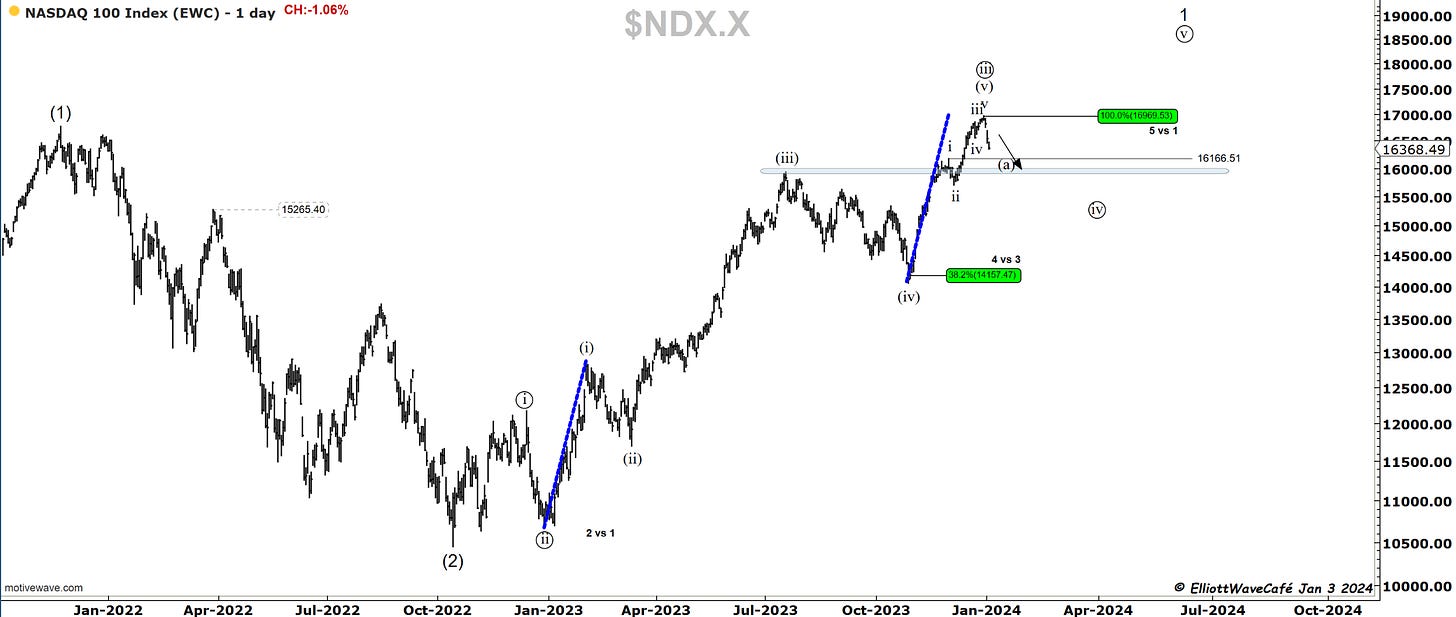
NDX has dropped below the 20-day MA and has its eyes on the highs from Nov 29th. Between there and the larger support below, the bulls will bring the troops out and stage a decent fight. Just like n the SPX, any rally attempts will be opportunities to sell. Keep an eye on the daily RSI near 40. That’s where bullish activity starts appearing.
Wave (v) lasted exactly 100% of wave (i). Yes, markets have proportions and balance. There is precision in chaos.
RUSSELL 2000
Small caps had a great performance in 2023, with all the gains being made in the last 2 months of the year. Notice how the attempted breakout seems to be failing, or at least testing the trader’s nerves. This is where discipline comes in. ( for example, long only above the 2000 line, below that it’s cash position). Remaining above that 150-day MA after the corrective move ends would be a great sign of further strength for the rest of the year.
Dow30
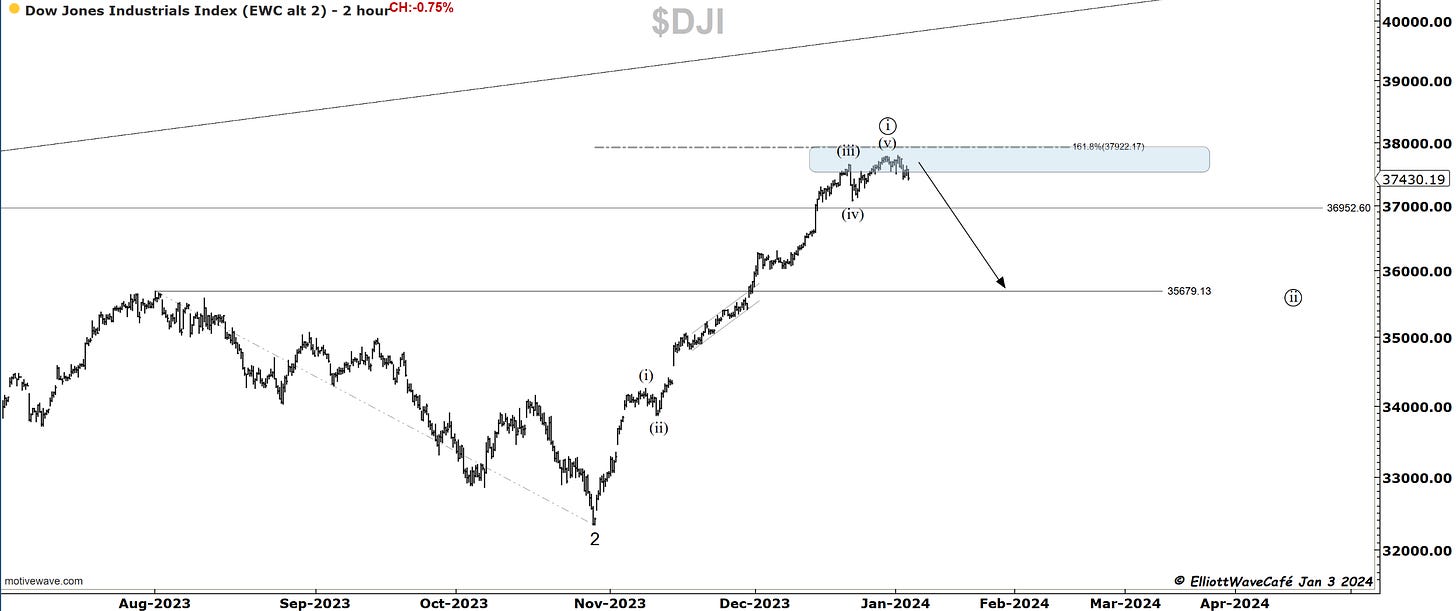
Dow gave further signs of cracking today. We closed below the 9day MA, on a diverging RSI, with 5 waves from the Oct lows. It's a decent cocktail suggesting upcoming weakness. One would raise cash, buy put spreads, sell call spreads, short the ETF. Whatever avenue one desires. A good way to see or anticipate Dow Industrial's behavior is to analyze the 30 stocks it contains and look at resistance levels and how those stocks are likely to behave.
US Dollar and Yields
There is not a perfect inverse correlation between stocks and the dollar. But it is good enough that one must constantly monitor it. It took stocks just a few more days to top out after the dollar found a low in July 2023. Now it was at the same time like clockwork. As the dollar approaches resistance and eases off a bit, it will clue us in on some reaction higher in stocks.
The 10yr reacted to the 20-day flexible trendline and sold off. The weekly charts tell a story of good support. The job numbers on Friday will create more movement in bonds, but my hunch remains that yields will enter a period of strength for a little while.
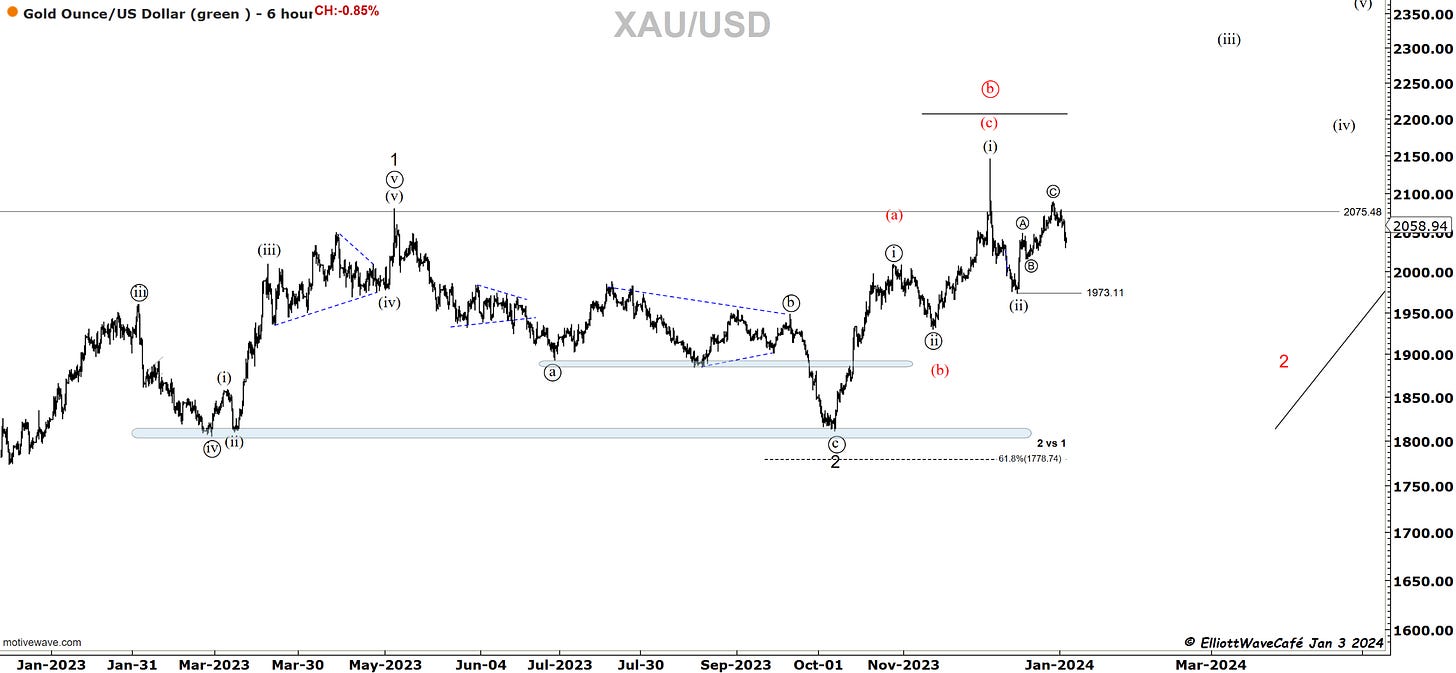
Gold
prior comments in GOLD remain. We accelerated the selloff towards the confirmation of a 3 wave rally. The 1,2 1,2 does not appear convincing. A break of 1973, should send us below 1900.
A bit of a selloff in Gold with the stronger dollar, but nothing worth changing drastically the overall picture. There are arguments to be made for just a 3 wave little rally after the December drop. Hovering near all-time highs does not give us a whole lot to work with. I am going to refrain from making any strong calls until we see some of these key levels getting challenged.
Bitcoin
I remember in 2008 when I first started getting involved in markets, how I bought the top at 1.60 in EURUSD. I will never forget. I got so excited thinking that I would make so much money and the euro would keep going higher. Of course I top ticked that market, then watched in awe how my account evaporated. It was 5k, I remember to this day. Painful lesson. You never want to be the one that buys the top of a 5th wave. If a market fails a level, don’t hope; get out. The Euro kept falling until July 2022, and there still isn’t a higher low on that quarterly chart.
We won’t know for sure if this is a 5th wave top in BTC, but it does not pay to find out by sticking around if one bought that break. If the market returns there and slowly grinds higher, then there is a case to be made. Until then, the charts show a failed move and a return below that proposed wave (iv) low. It’s a signal that a larger correction is at hand. And if it’s not, let the market prove it.
“Double shot” Daily member video coming up next,
If you’re new to Elliott Wave or need to refresh, there is a 7-hour video course with downloadable slides under The Coarse tab on the website.
Have a great day wherever you are! - trade well, and don’t forget to subscribe and drop a like if this letter helps you in any way.
Cris
email: ewcafe@pm.me


