The Daily Drip
Elliott Wave and technical market updates on SPX,NDX,DOW,IWM,DXY,BITCOIN
Note: The counts on the right edge are real-time, and they are prone to adjustments as price action develops. Elliott Wave has a fluid approach, is evidence-based, and requires constant monitoring of certain thresholds.
In the counts below, this (( )) = circle on chart
SP500
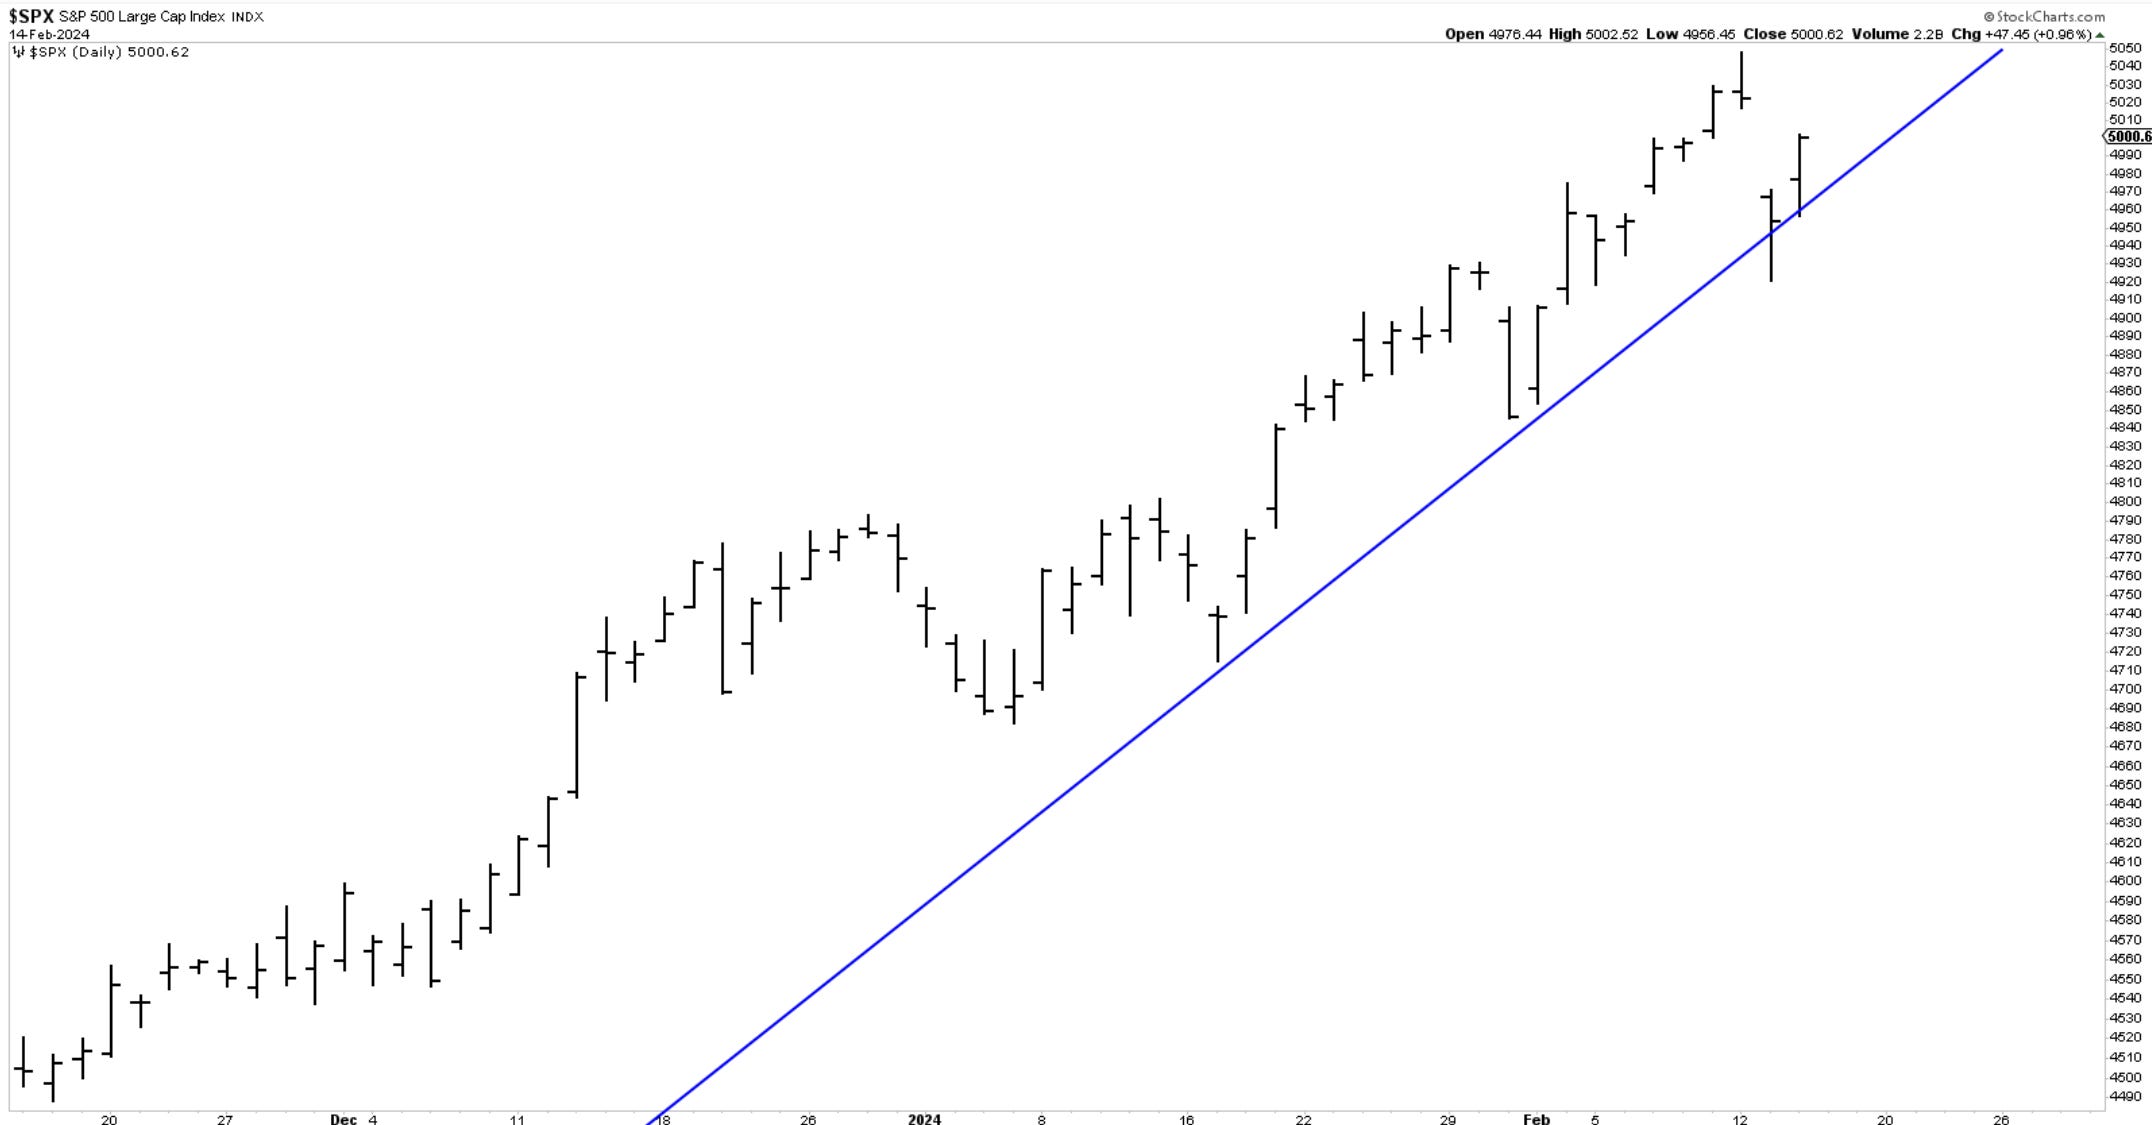
The trendline from the October 2023 lows continues to offer support on dips. The reaction from yesterday’s close, along with a higher close today, proves its relevance. Actually, one could argue that we did not yet have a daily close below it. The eyes are now on the Monday closing prices of 5021.84. We could be under a hunt for new highs once again or just a simple gap close from Tuesday’s drop.
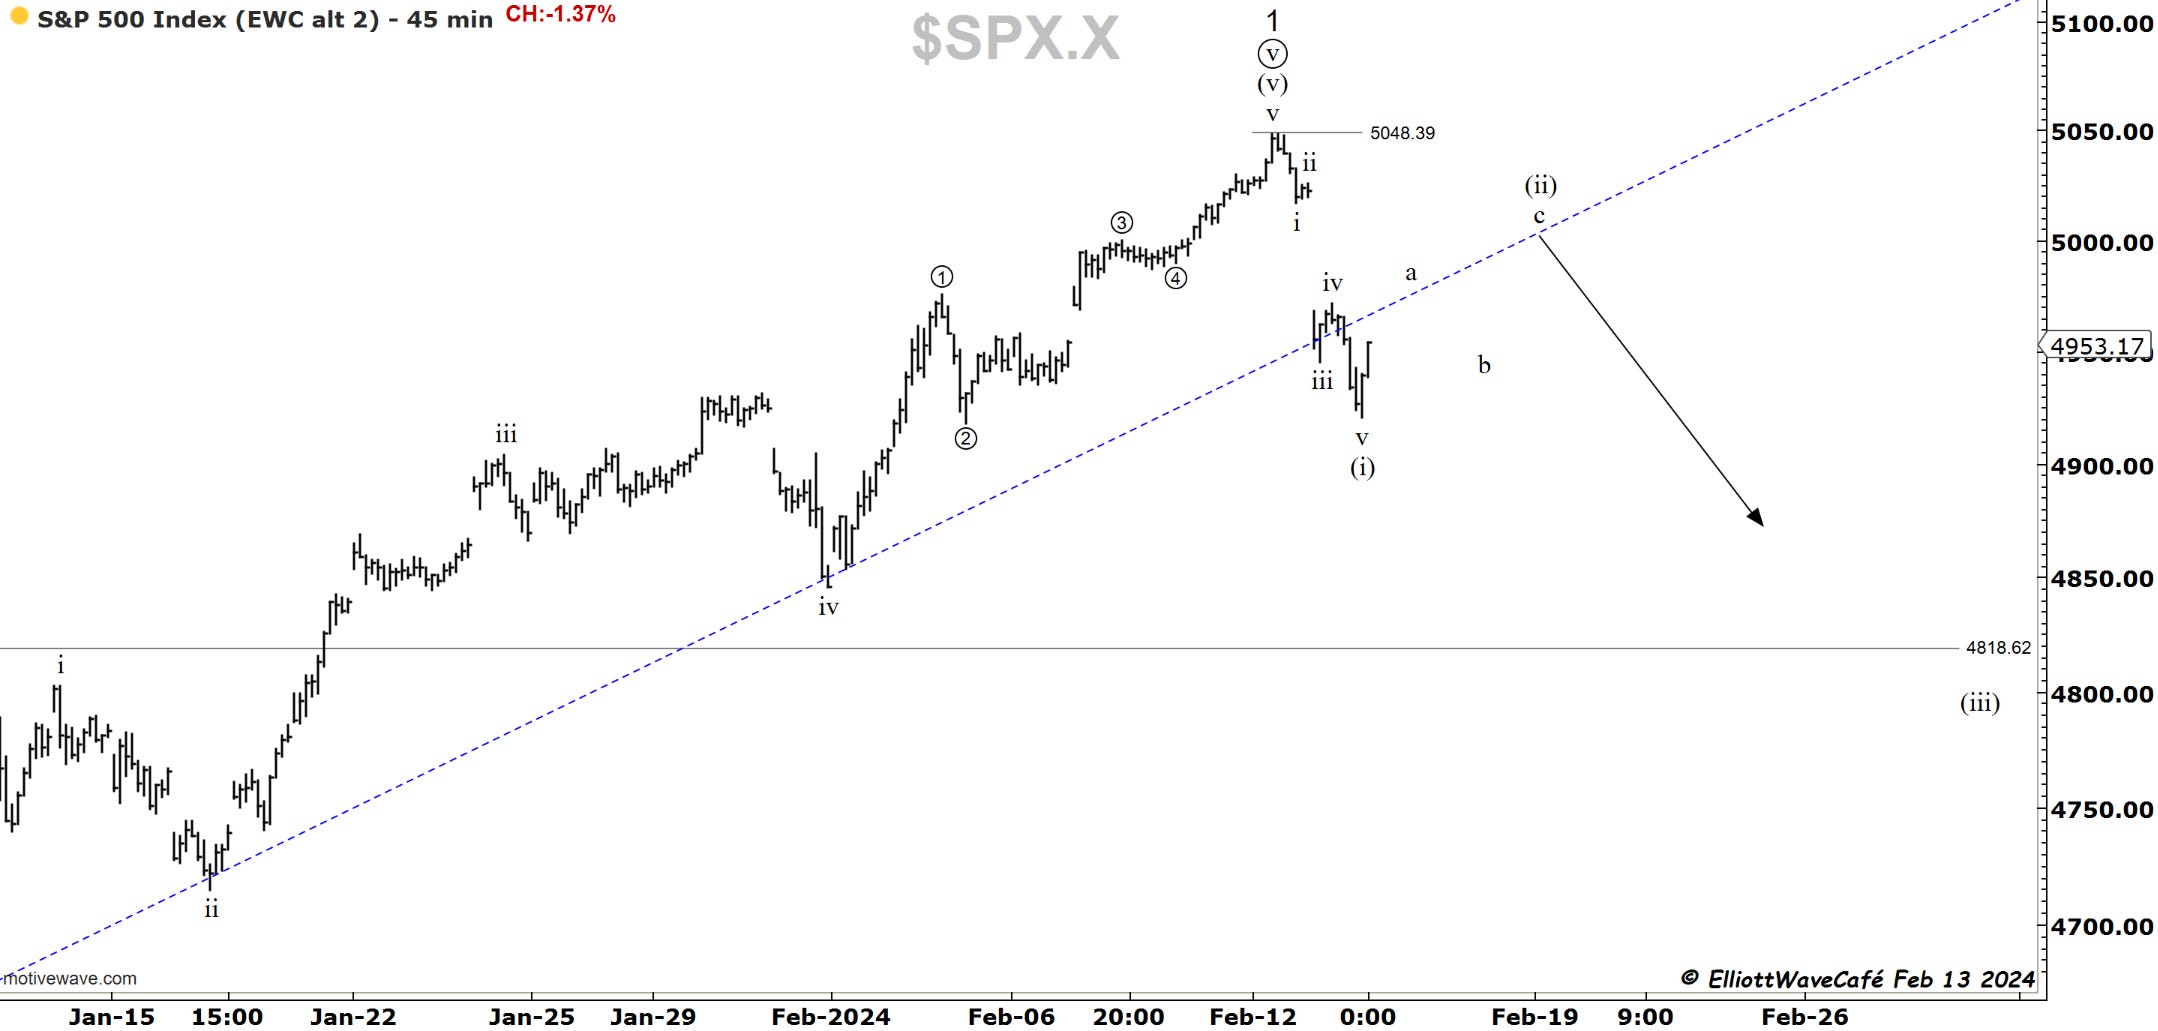
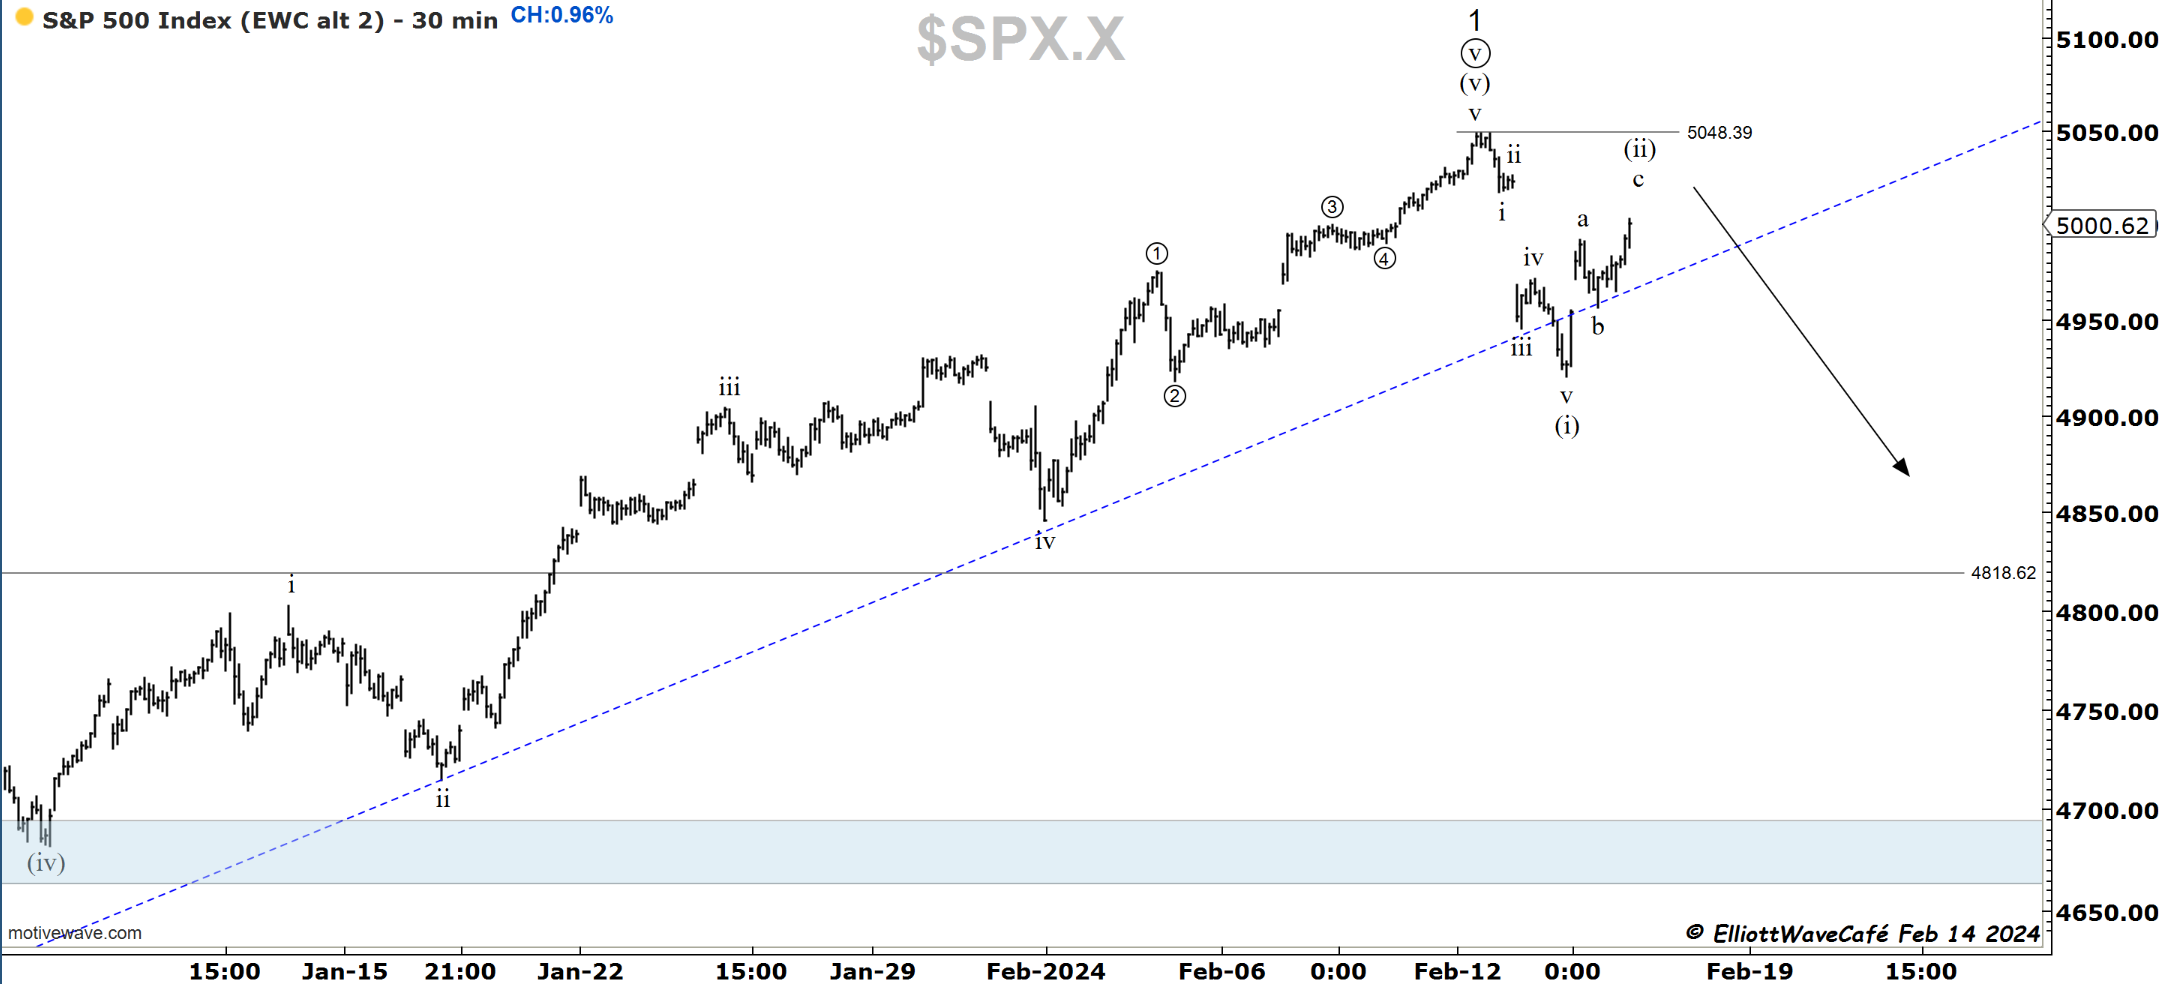
Since we can count a 5-wave decline from 5048, we can assume the current move is a three-wave correction. I have displayed this roadmap in yesterday’s note. You can see today’s action in the second chart. A failure to register new highs and a return below the suggested b-wave low would confirm a three-wave advance, and we would then be looking for further drops below 4900.
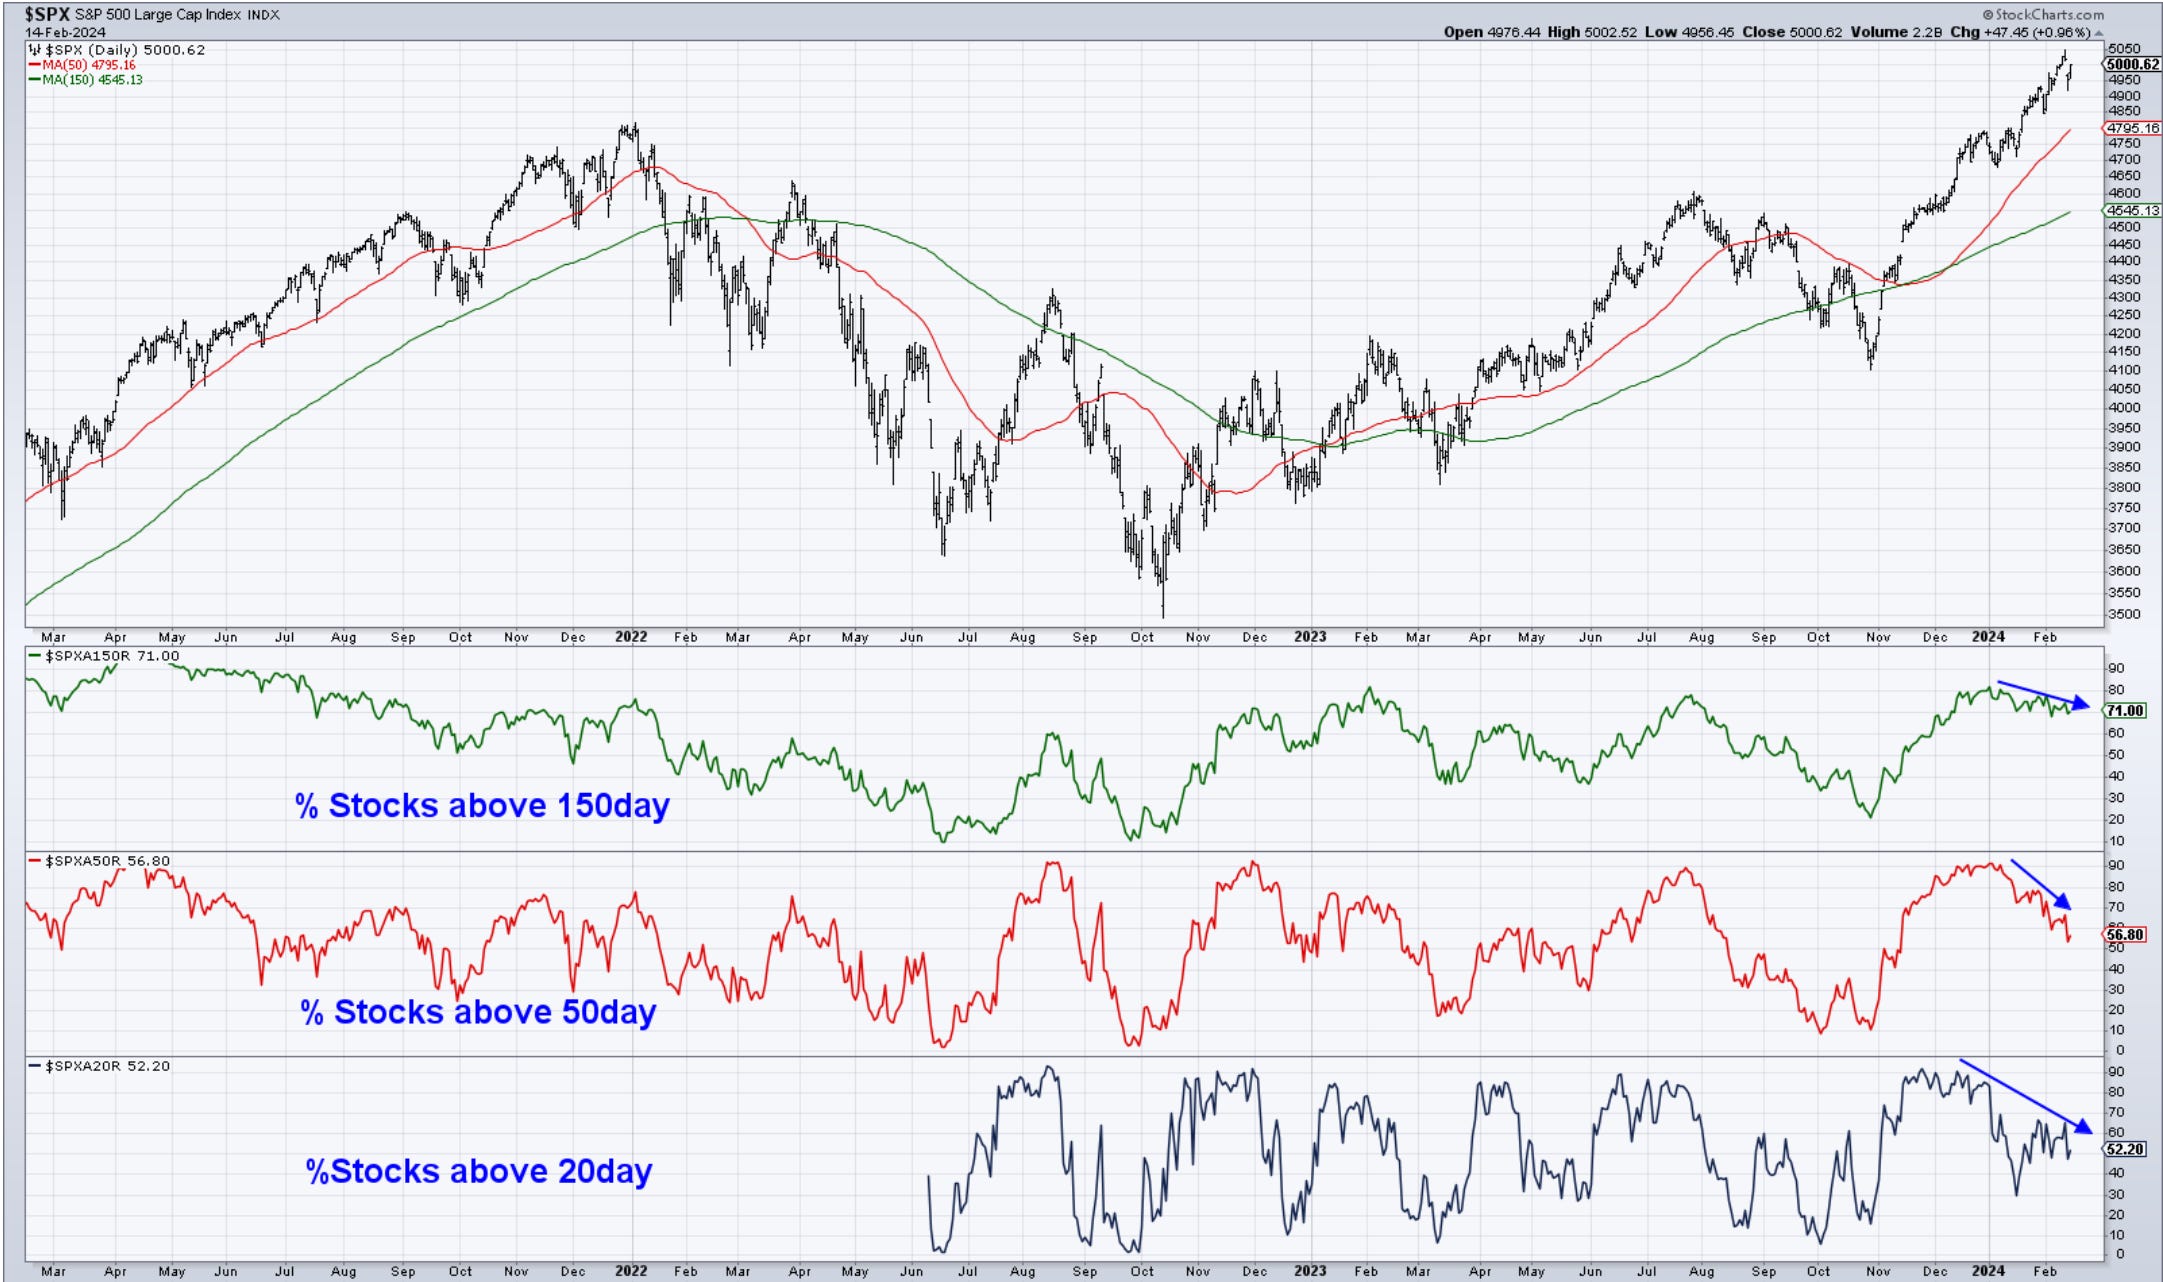
Breadth deterioration continues to take place as seen below.