
The Daily Drip
Core markets charts updates and commentary
Note: The counts on the right edge are real-time, and they are prone to adjustments as price action develops. Elliott Wave has a fluid approach, is evidence-based, and requires constant monitoring of certain thresholds.
In the counts below, this (( )) = circle on chart
SP500
The market trod water for most of the day in anticipation of the upcoming heavy earnings from some of the largest cap names. Wall Sreet was not impressed with some of the numbers or guidance, and we’re selling off in the after-hours as I am writing this piece. In lieu of the Fed meeting tomorrow, I expect this to stabilize until Powell takes the stage at 2.30 PM EST. Some of these very large-cap names, especially in tech, had tremendous runs, so earnings have to be outstanding for these high prices to hold water. Anything subpar can create “sell the news” events. We add to that the final proposed stages of a wave (v), a weak seasonal period, and a topping cycle, and we have a decent cocktail of events that can start the corrective phase towards 4600. A break of 4800 would be a decent signal for such a scenario.
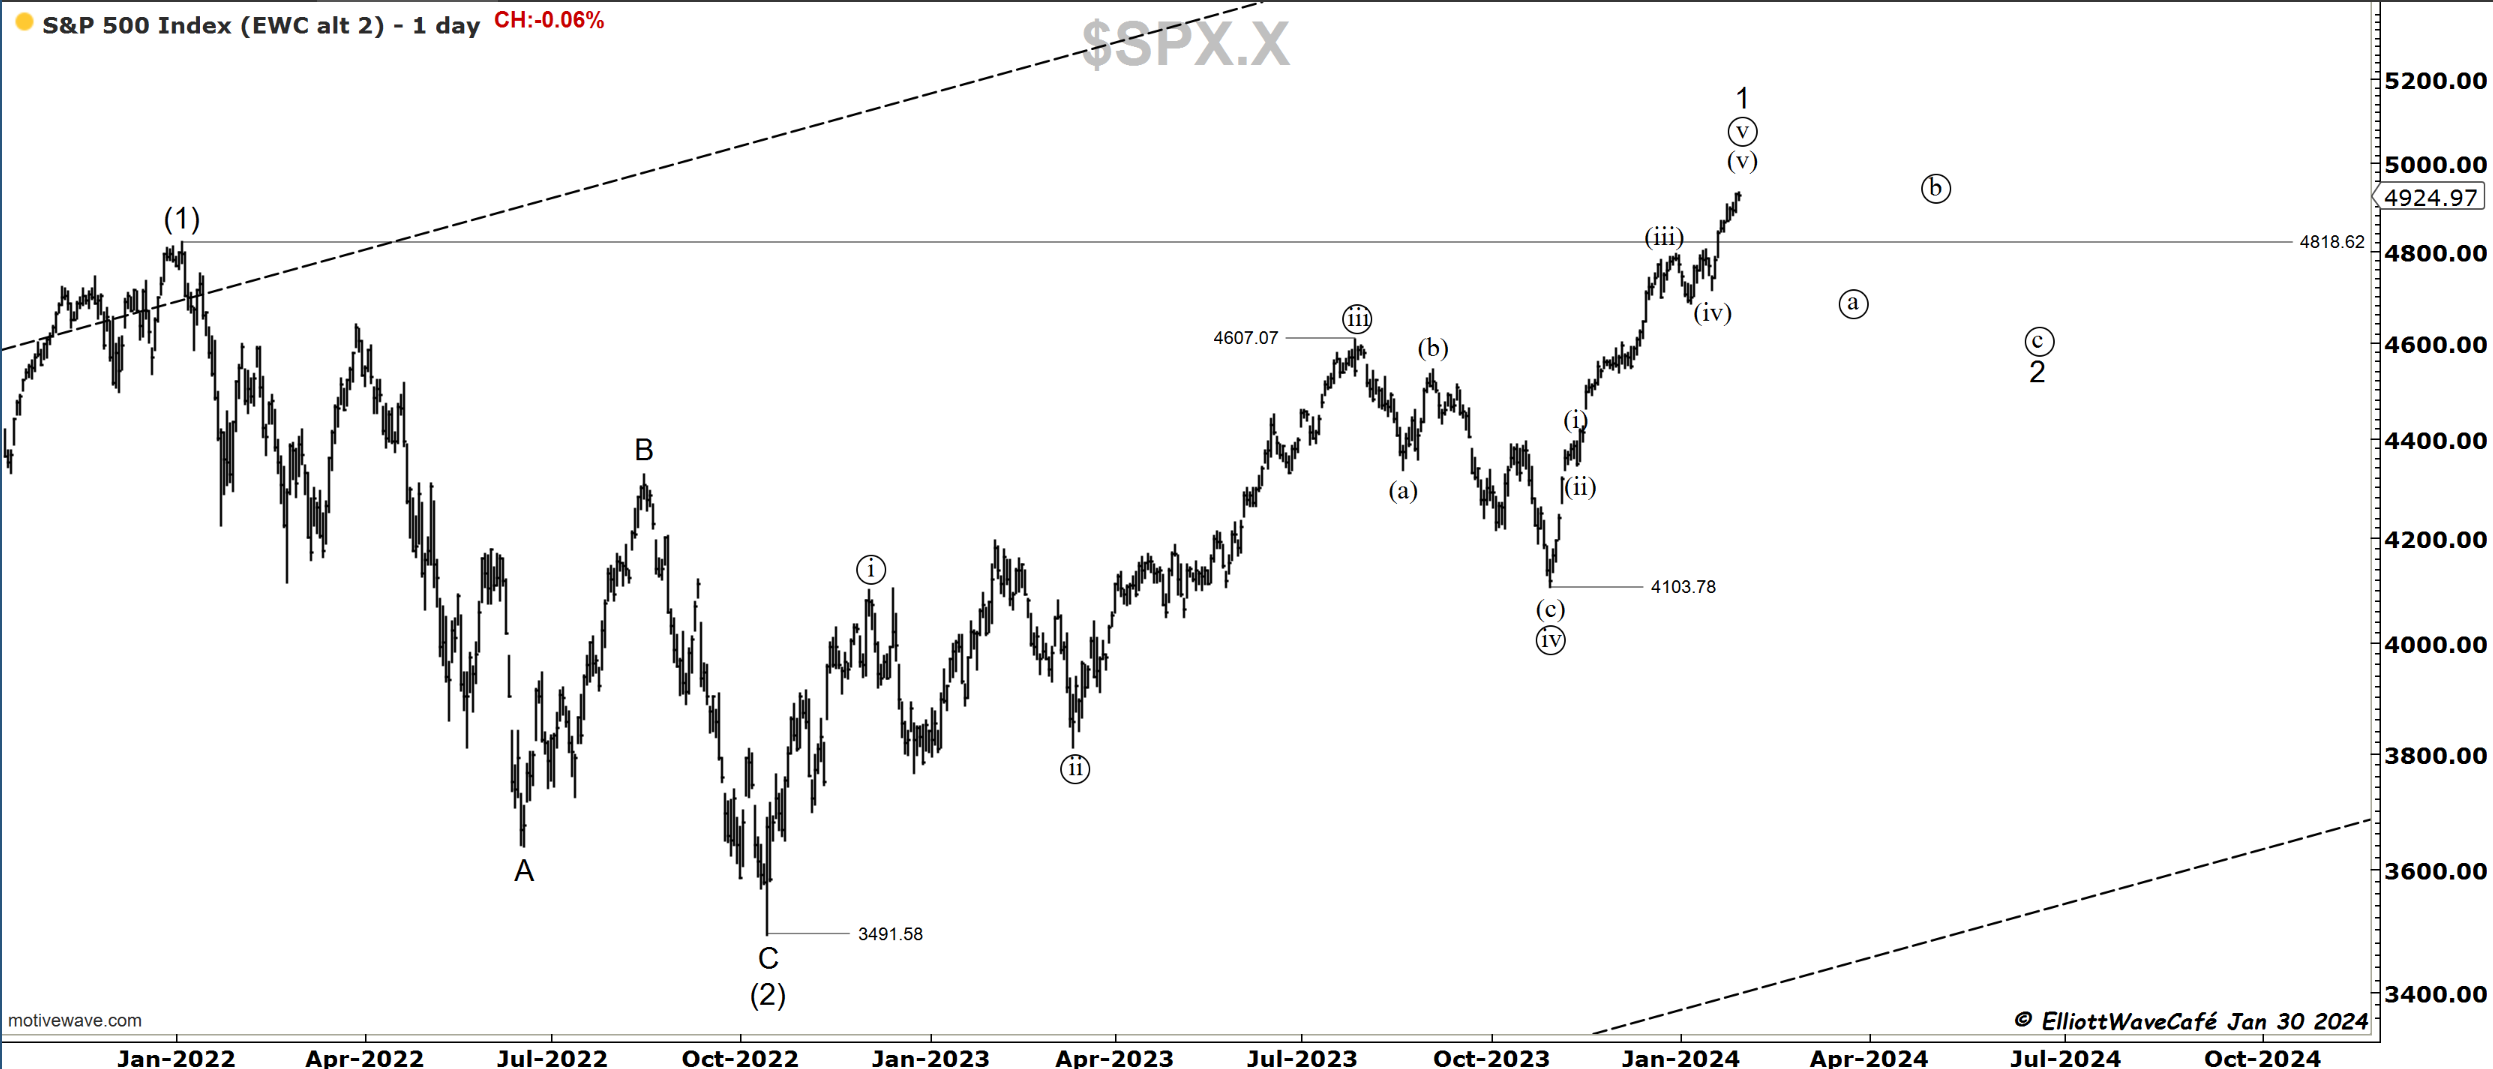
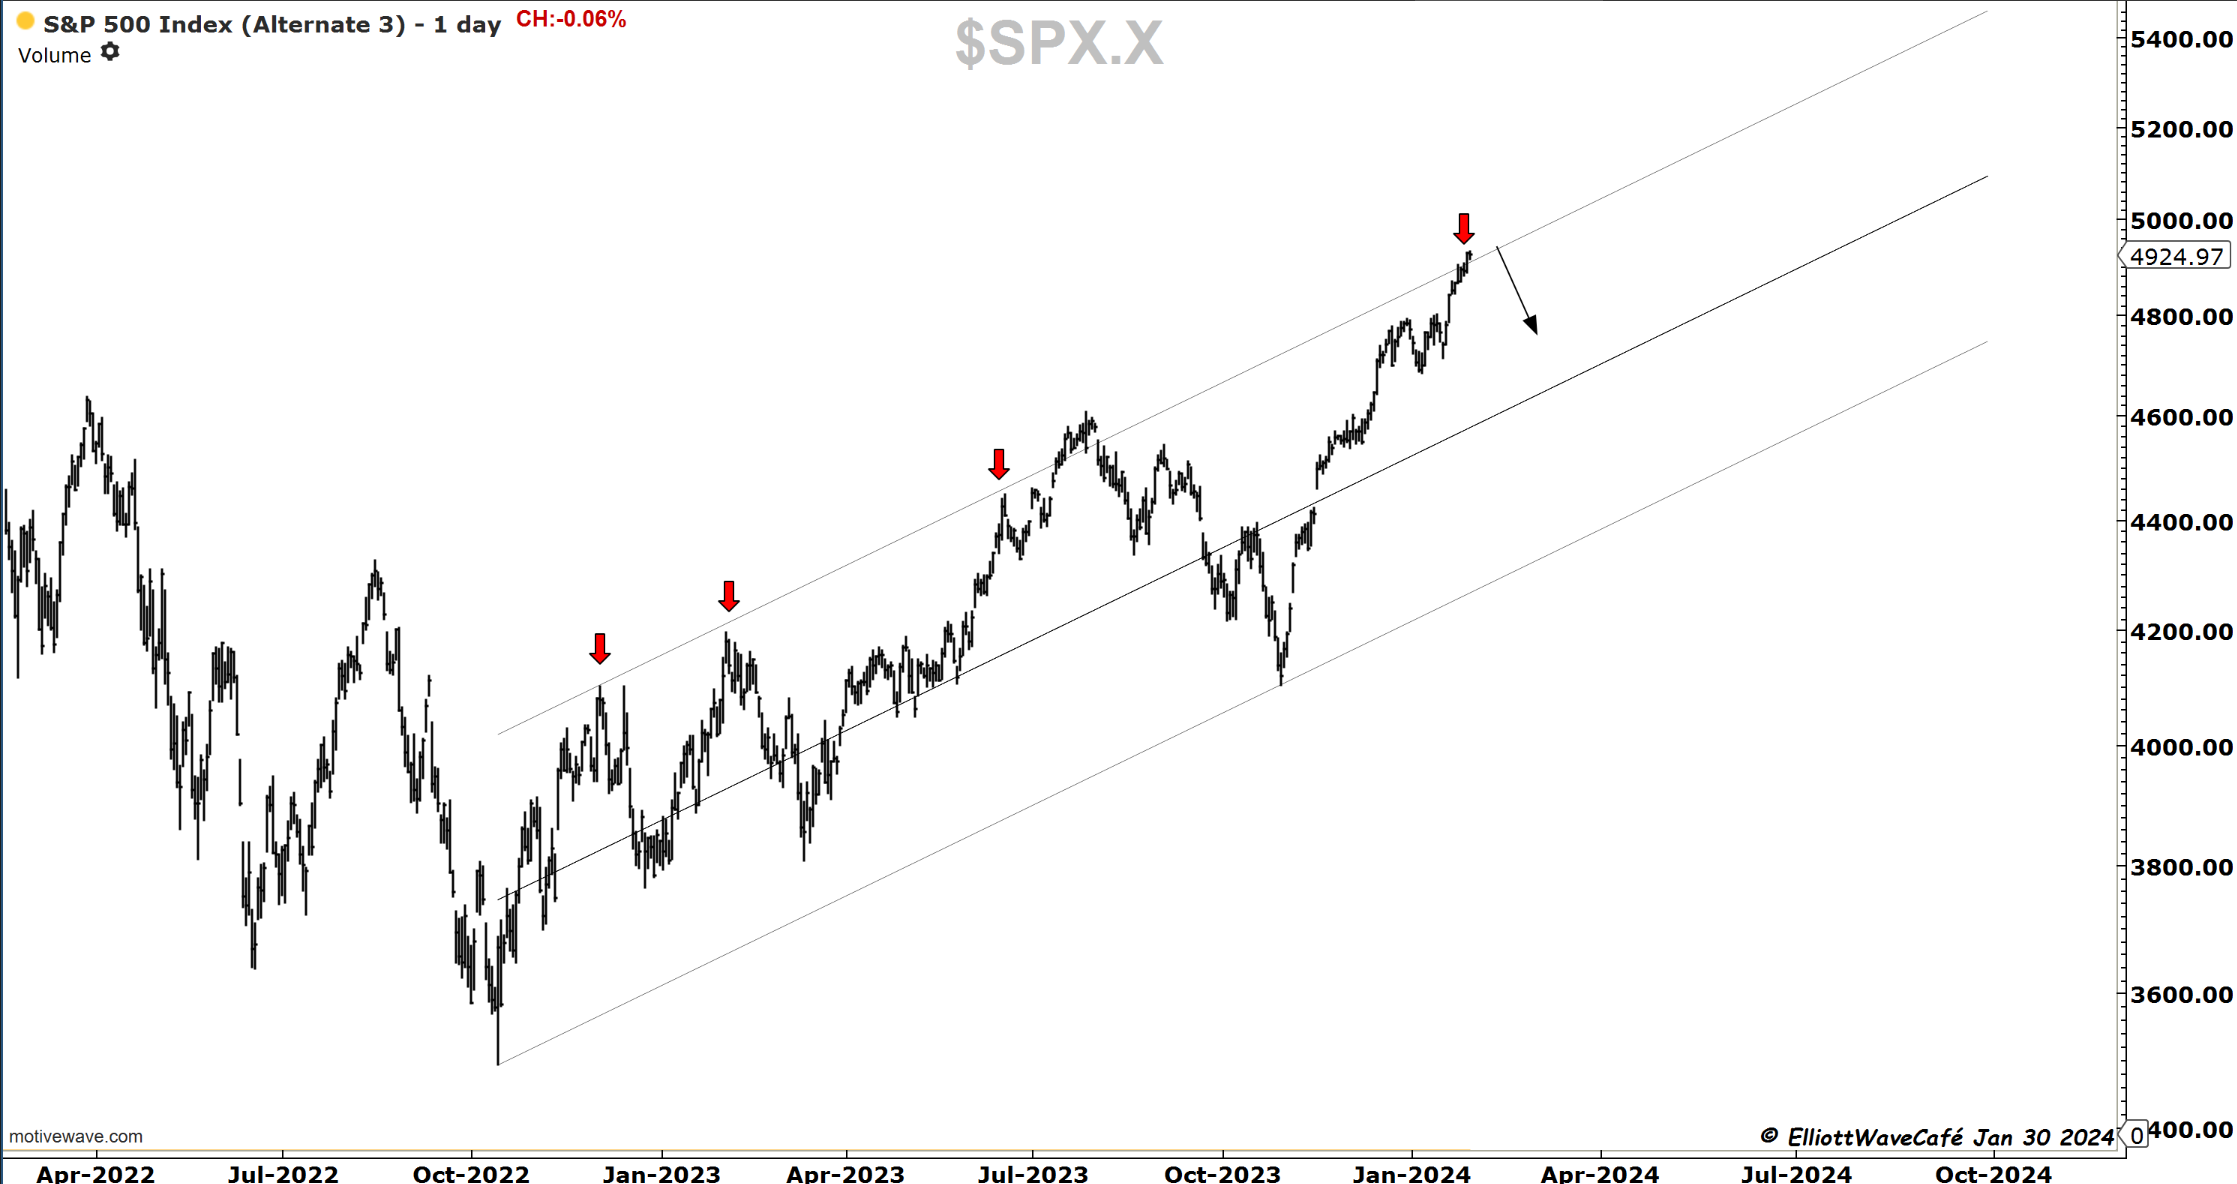
Channels are sometimes imperfect, but just a quick glance below suggests that the odds of a pullback would be higher than the odds of a continuous breakout. At this juncture, I would continue to be a trimmer, call seller, put buyer, and straight seller.
Nasdaq100
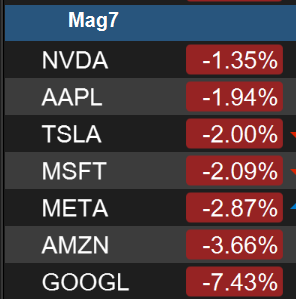
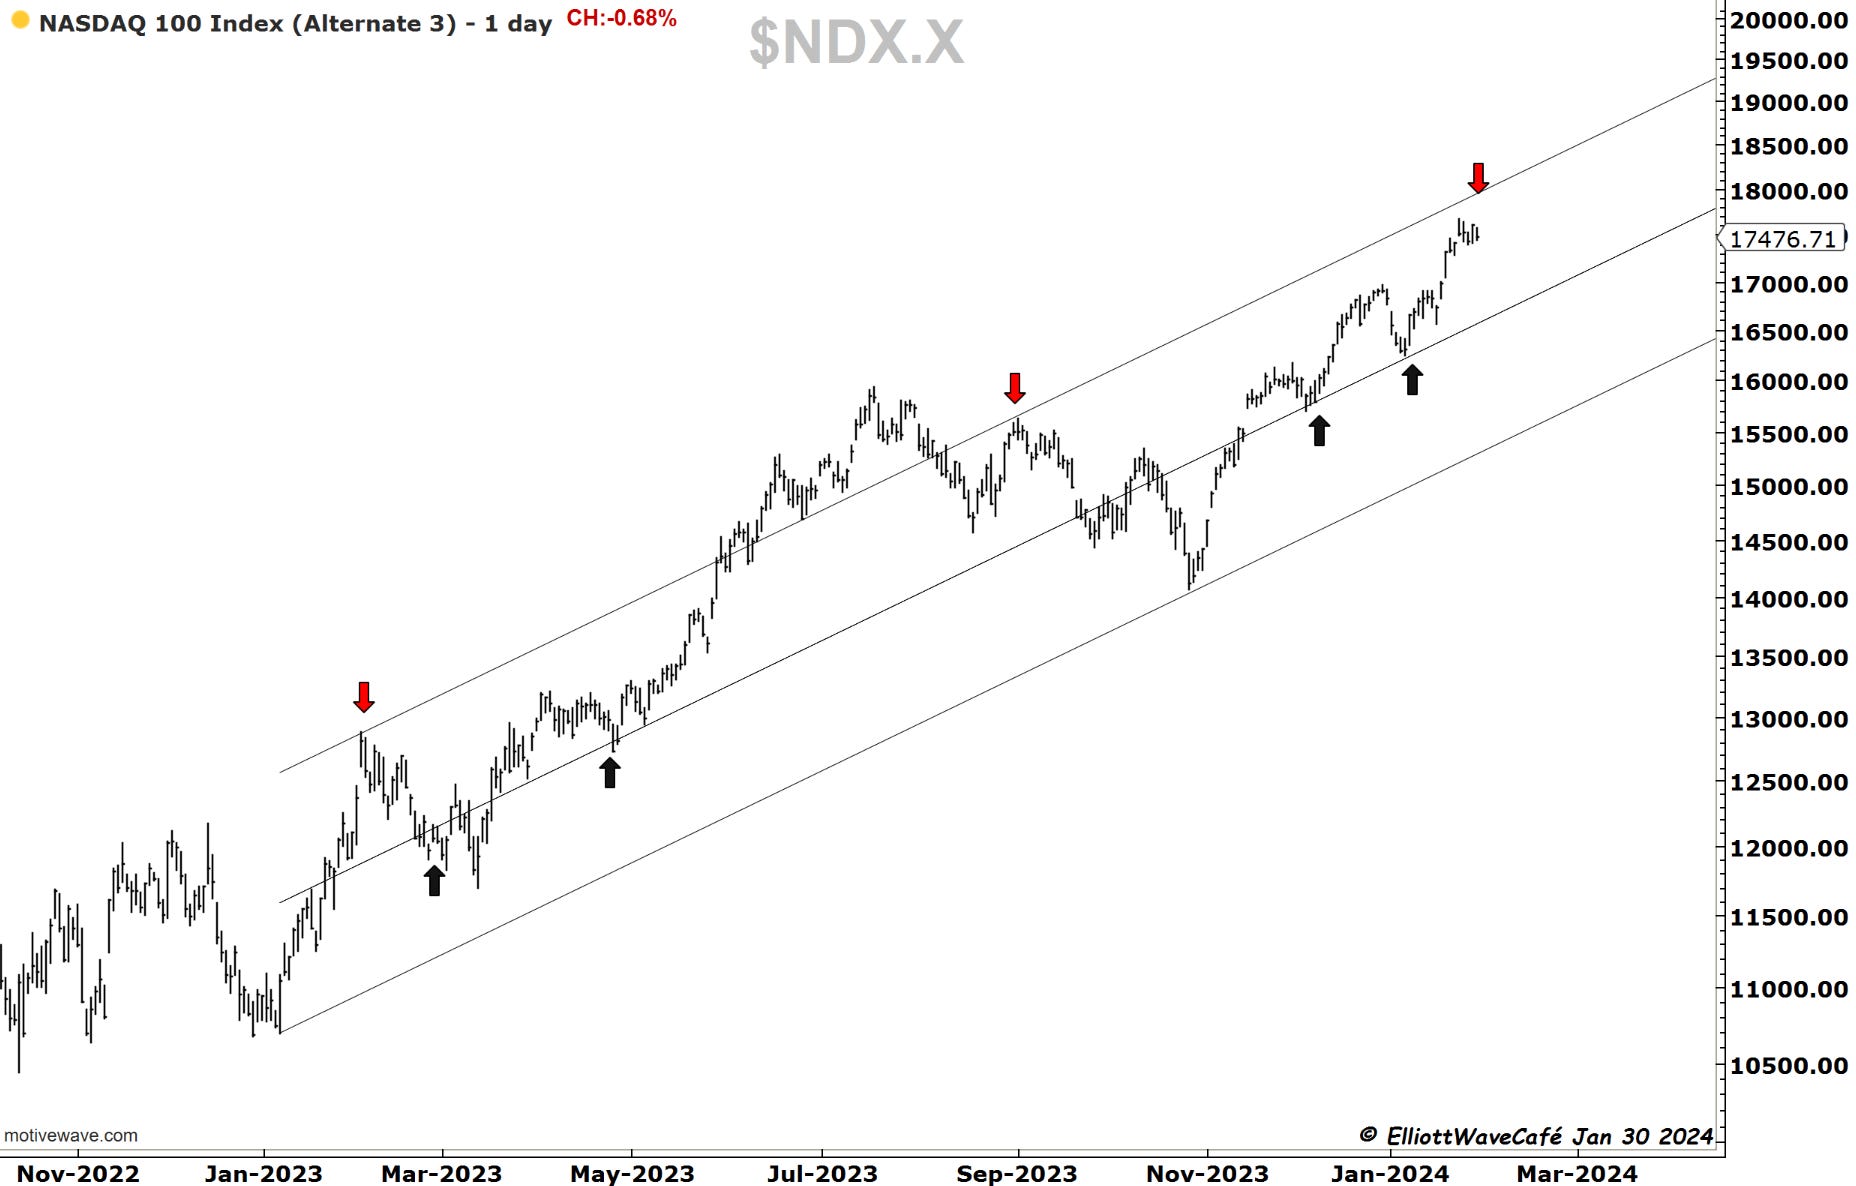
A little bit of red in the biggest of them all in the after-hours screenshot taken at 5:22 PM EST. Let’s see how they look by early morning. If a temporary top is to be in place in this index, this is the type of price action that would get things started.
Continuing to search for that wave (v) top with price evidence beginning to creep in.
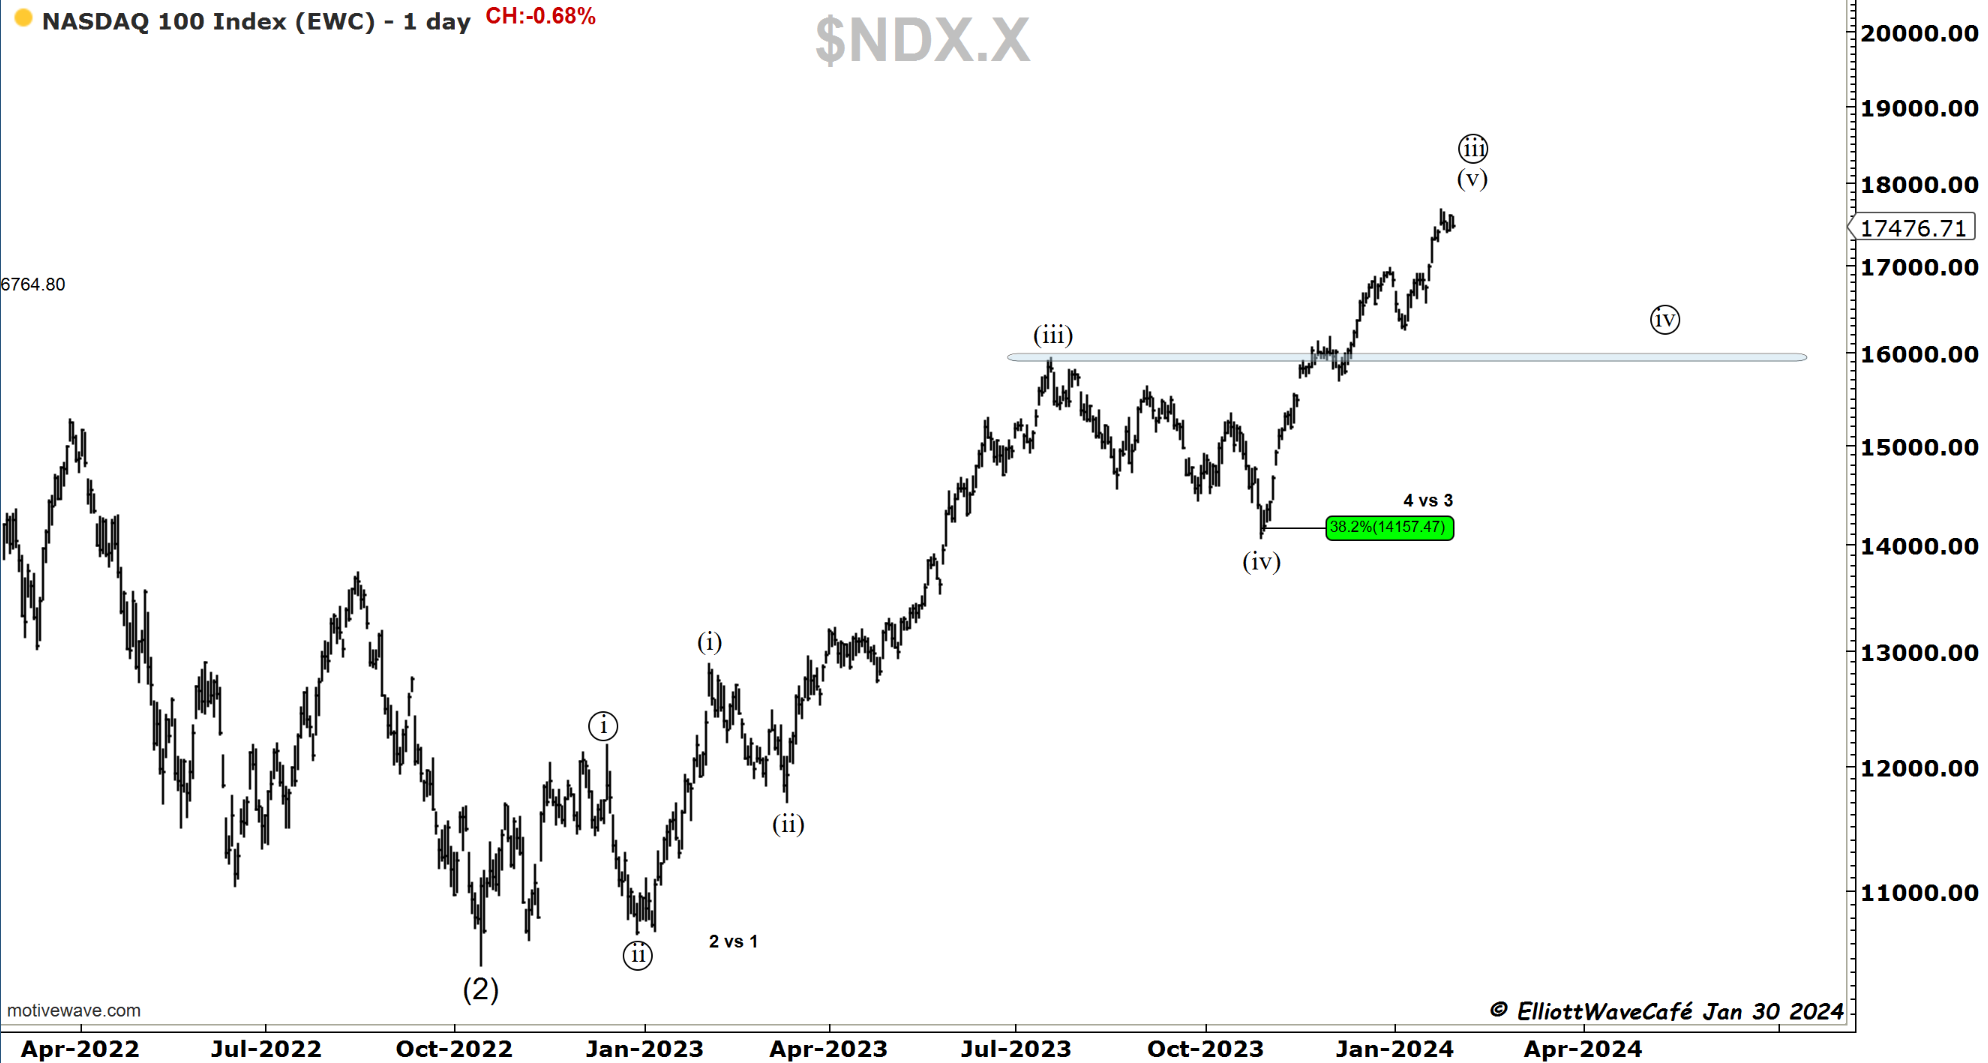
The Nasdaq channel is a bit wider, but the bottom line and the middle are keeping track of major swing points. Respecting the price hitting near the channel top is a must.
RUSSELL 2000
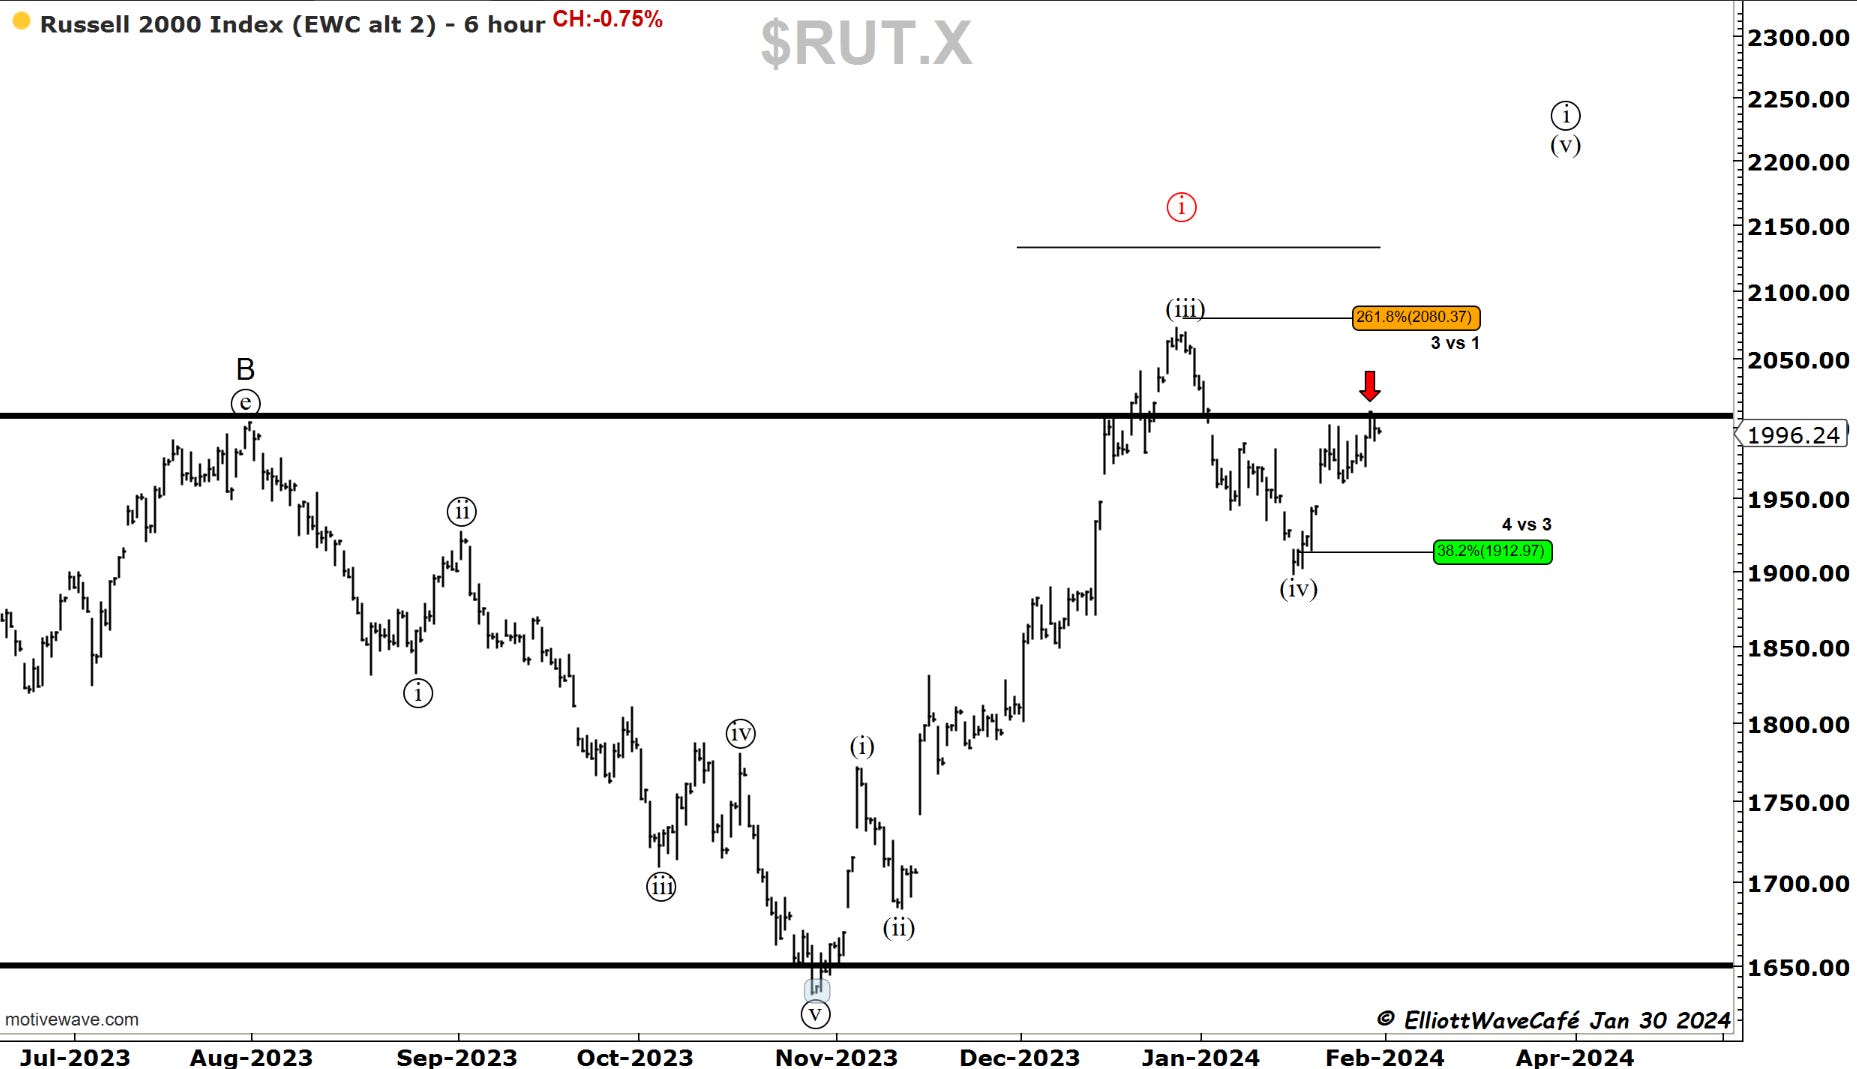
There are no further cracks upward in the small caps, which took a decent beating today. The red arrow shows the importance of that level, which extends all the way to August 2022. A break-back below 1900 would pretty much negate the wave (iv) theory.
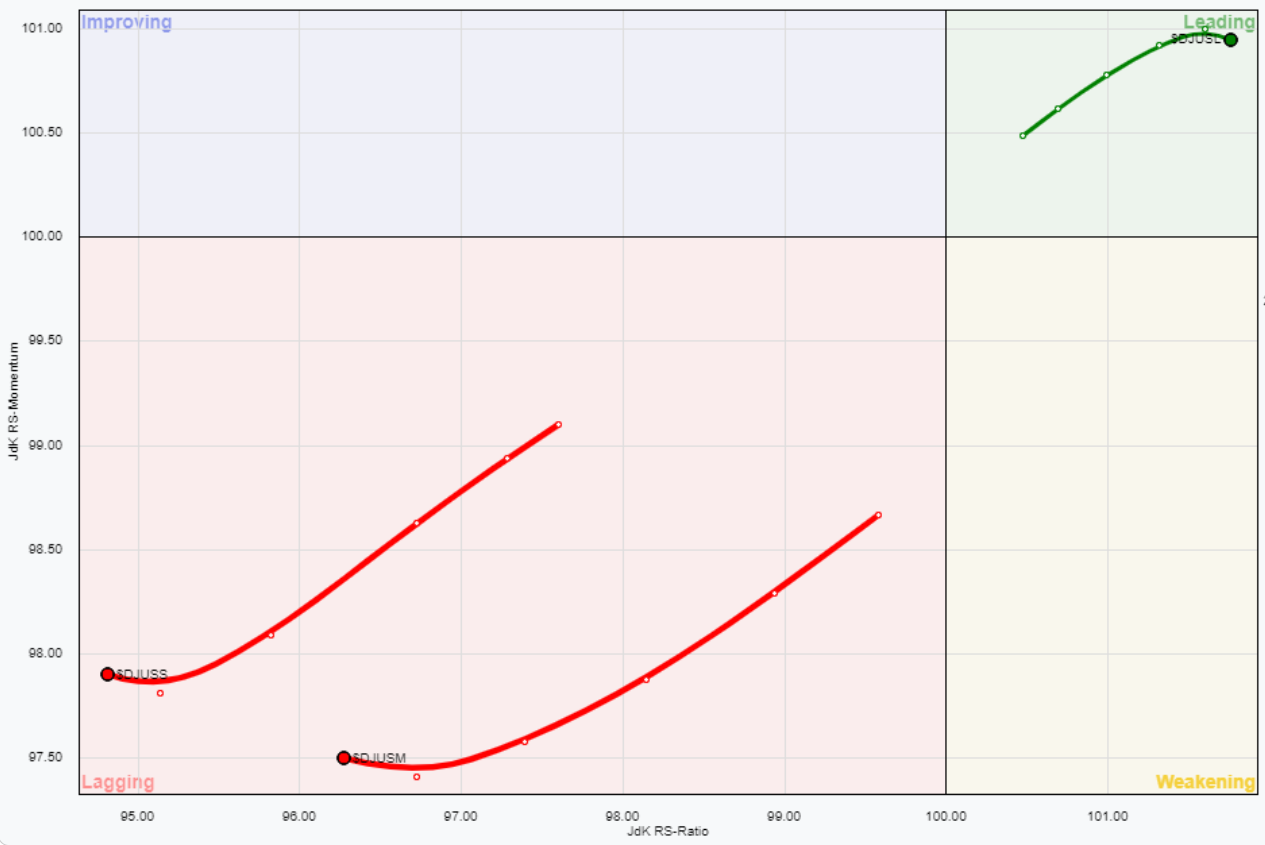
I'm not sure how familiar you are with the relative rotation of assets, but the graph below shows the three main indexes in terms of size: large, mid, and small. It’s a monthly time frame. The large caps are leading and have been outperforming the main market for the past 2 years. This boat seems to be taking a small turn lower. The other two, small caps and midcaps, have been a disaster relative to the benchmark but seem to turn higher slightly. It is still premature, but I will monitor this for members throughout updates. Looking at absolute charts and relative graphs on multiple timeframes can help paint a clearer picture of how assets are getting in and out of favor.

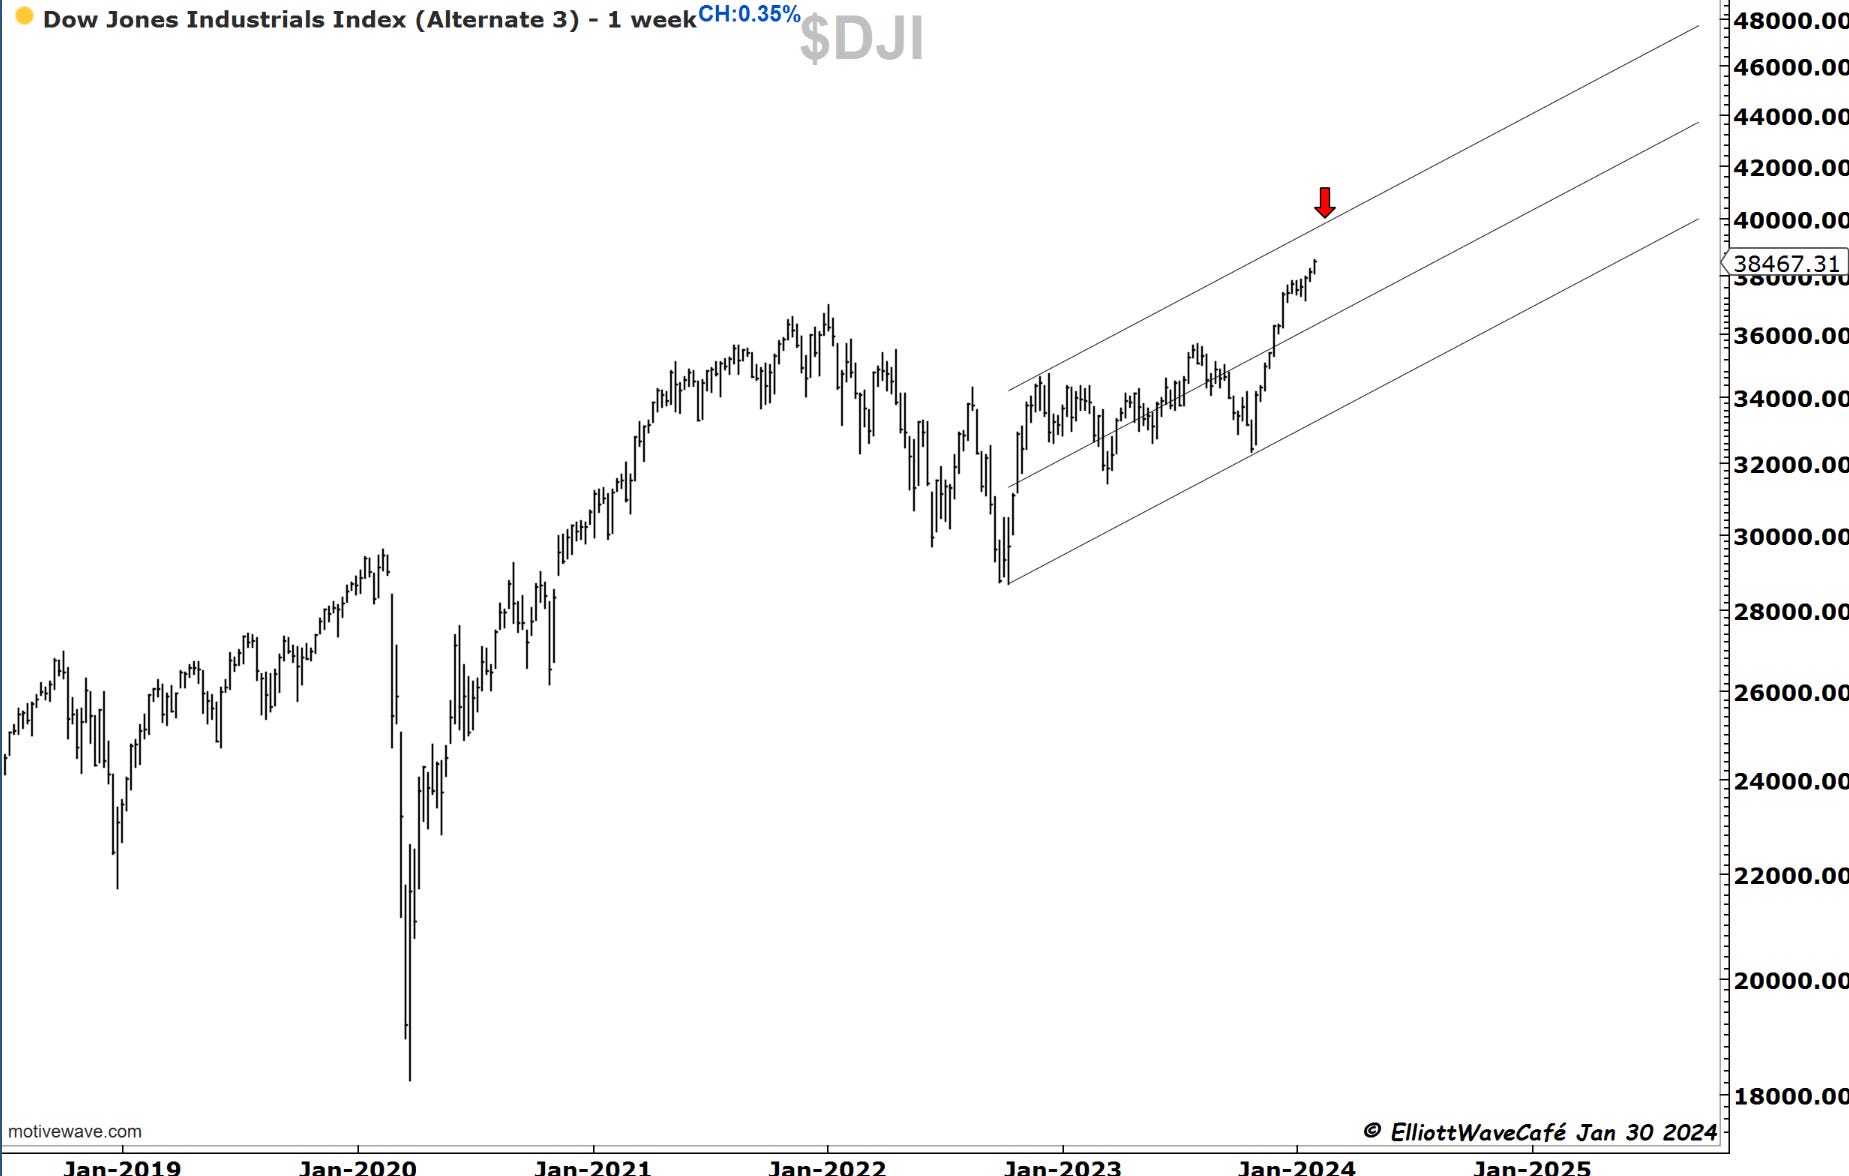
Dow30
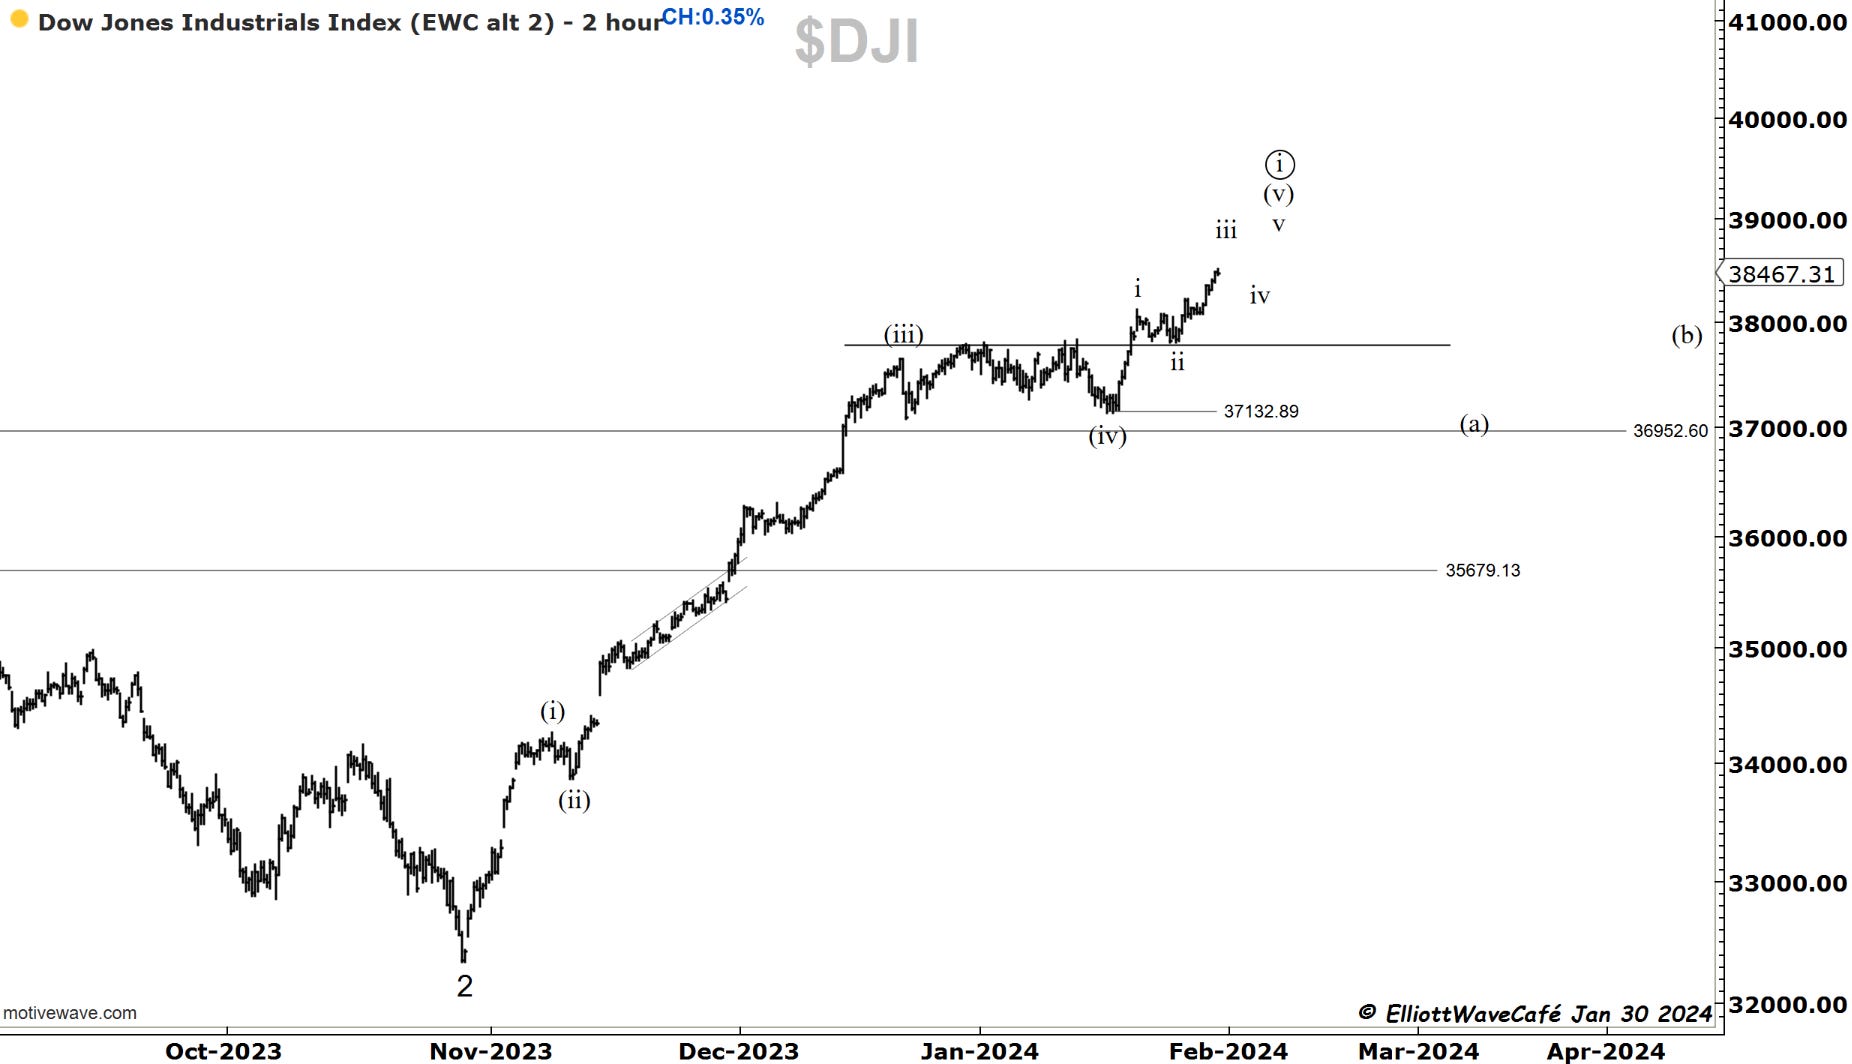
Dow continues to build on its strength and was helped to make a new high today by the performance in financials. Both the count and the channel below, suggest there should be a bit more upside here until we get to the next corrective phase. However, a break below 38k would hint at a top being found. Wave (a), when it starts, should take us to 37k.
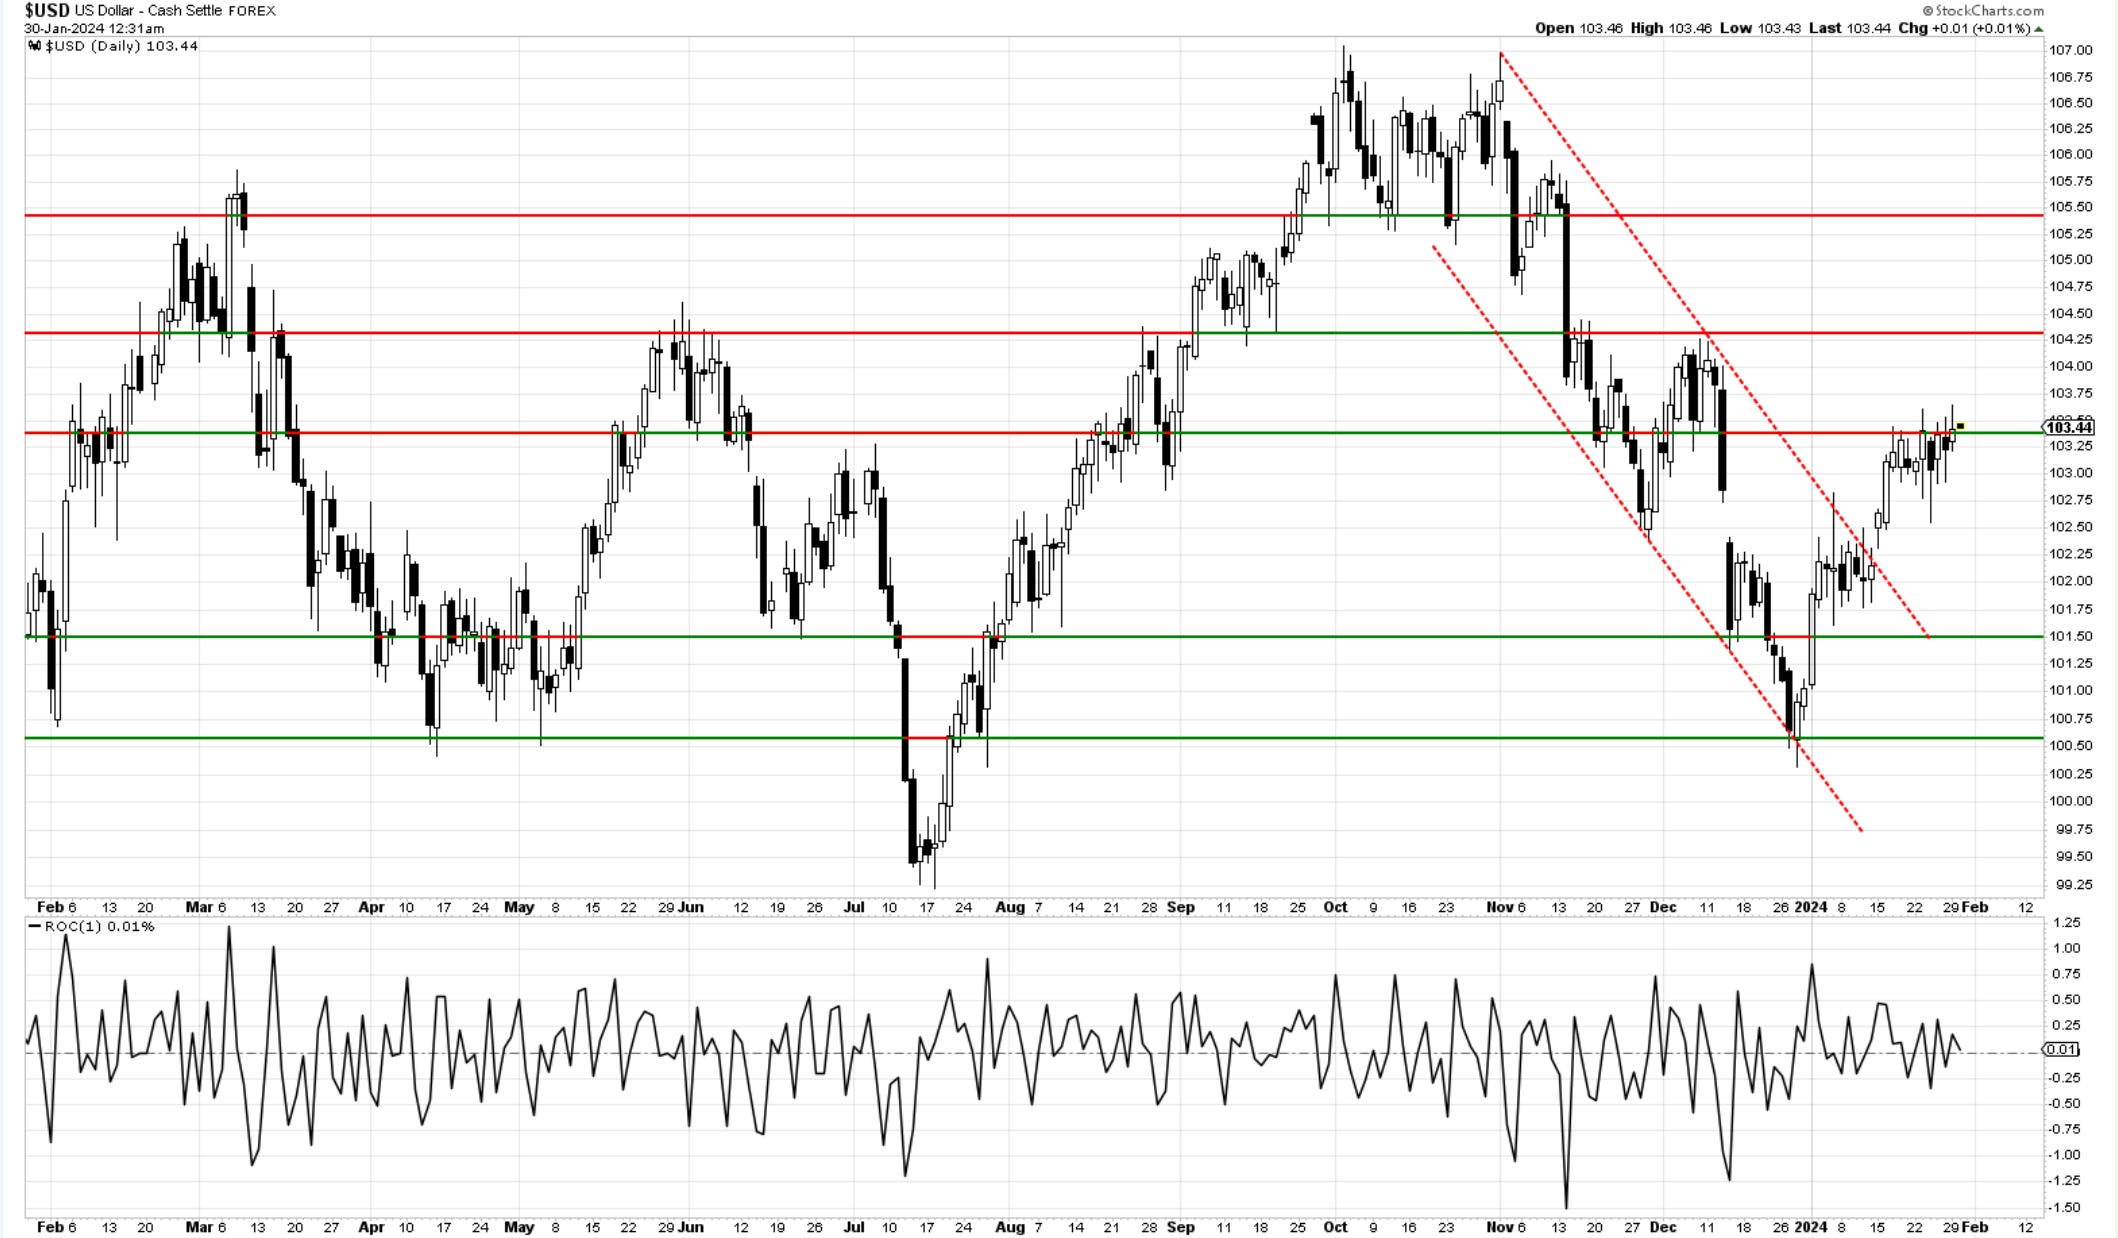
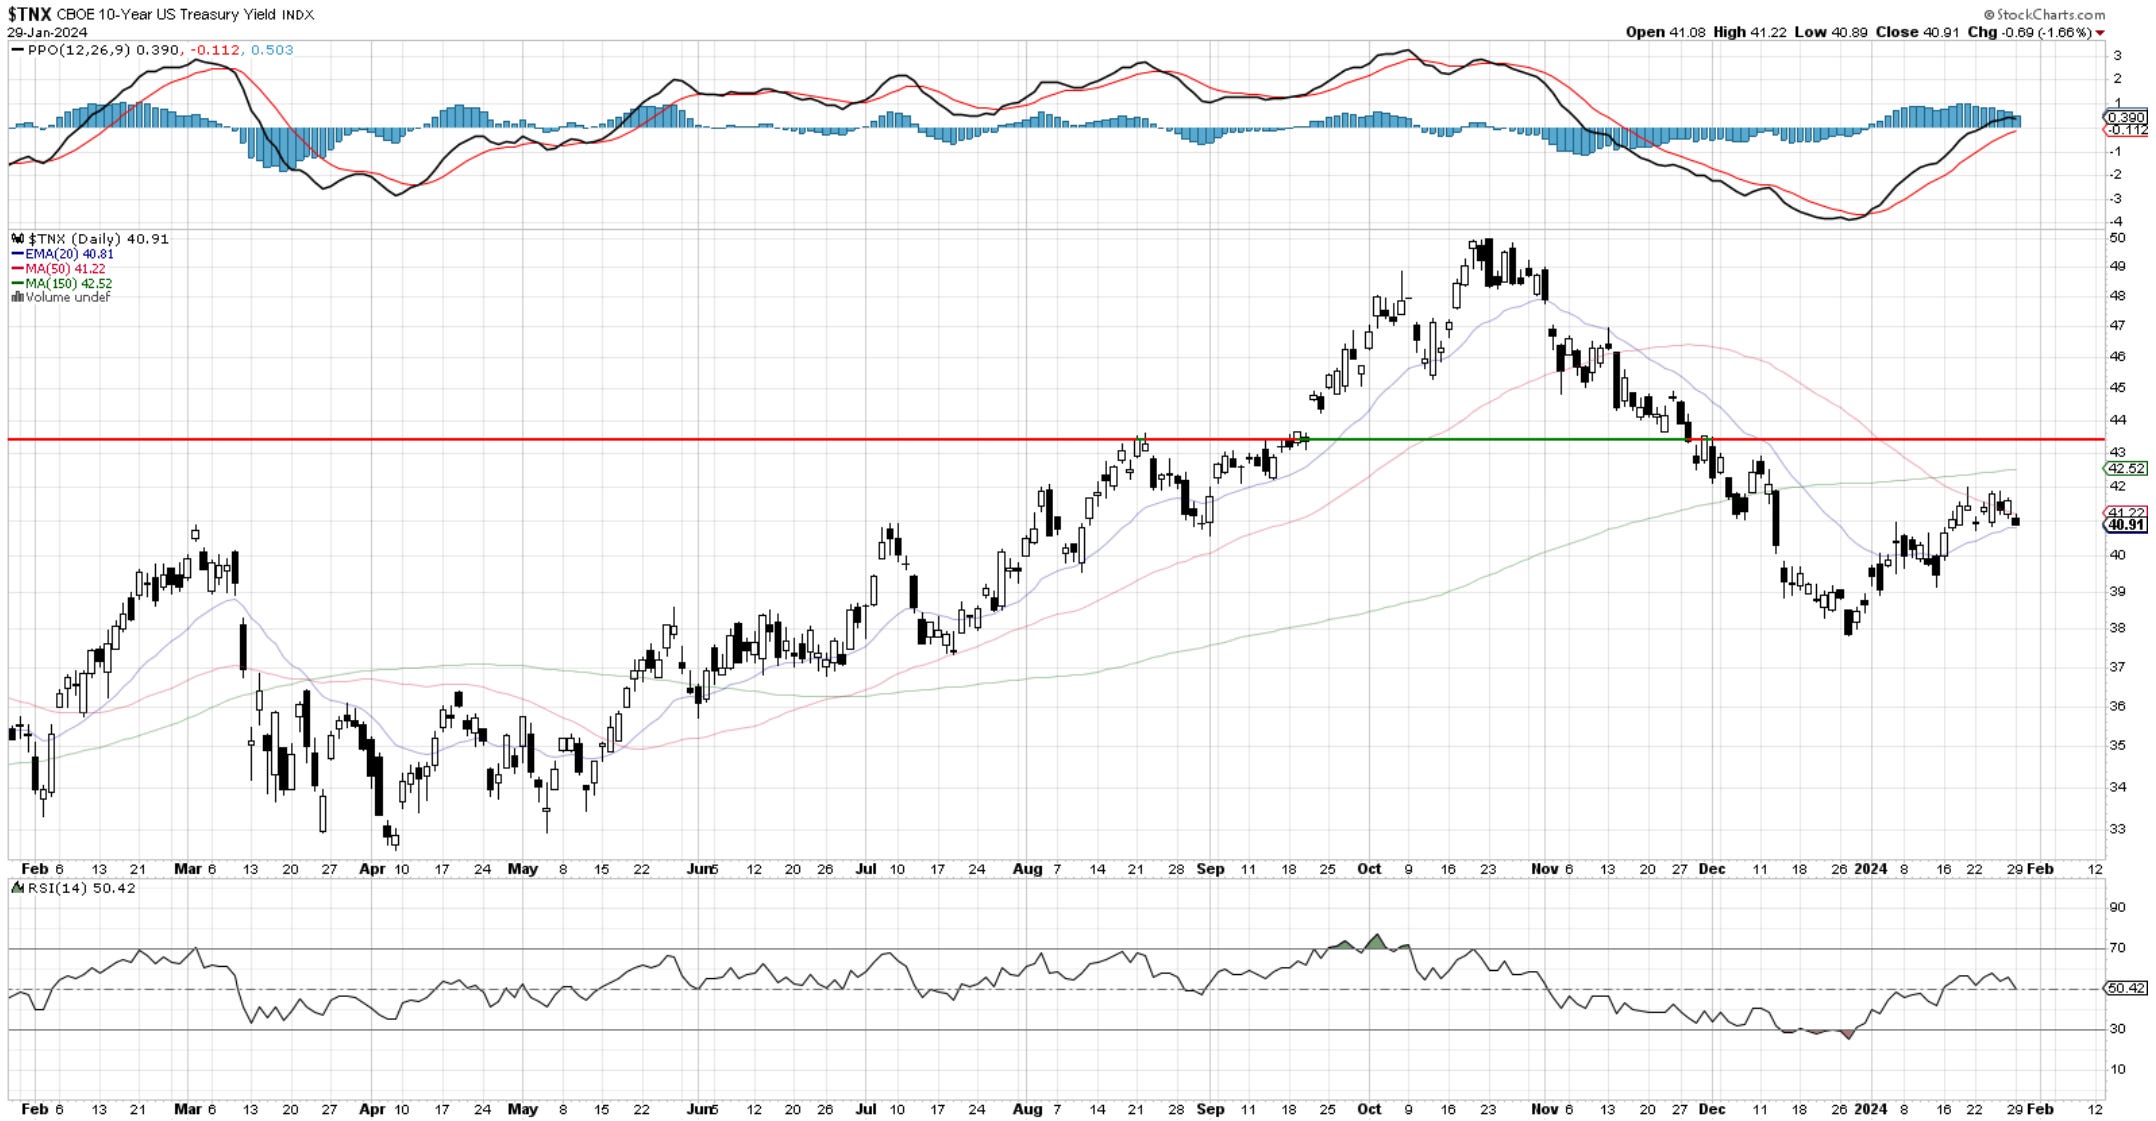
US Dollar and Yields
previous comments remain - once the Fed meeting is over, I should be able to update with fresh takes.
The dollar has yet to respond to the strength in equities, even with a slight decline in treasury yields. With the FED on Wednesday, these two markets are key. A break of 3.9% in the 10yr would suggest the 3-wave rally is over and new lows are coming. The dollar would follow I reckon along with risk continuing higher. Notice how the Greenback is fighting the old memory level near 103.30.
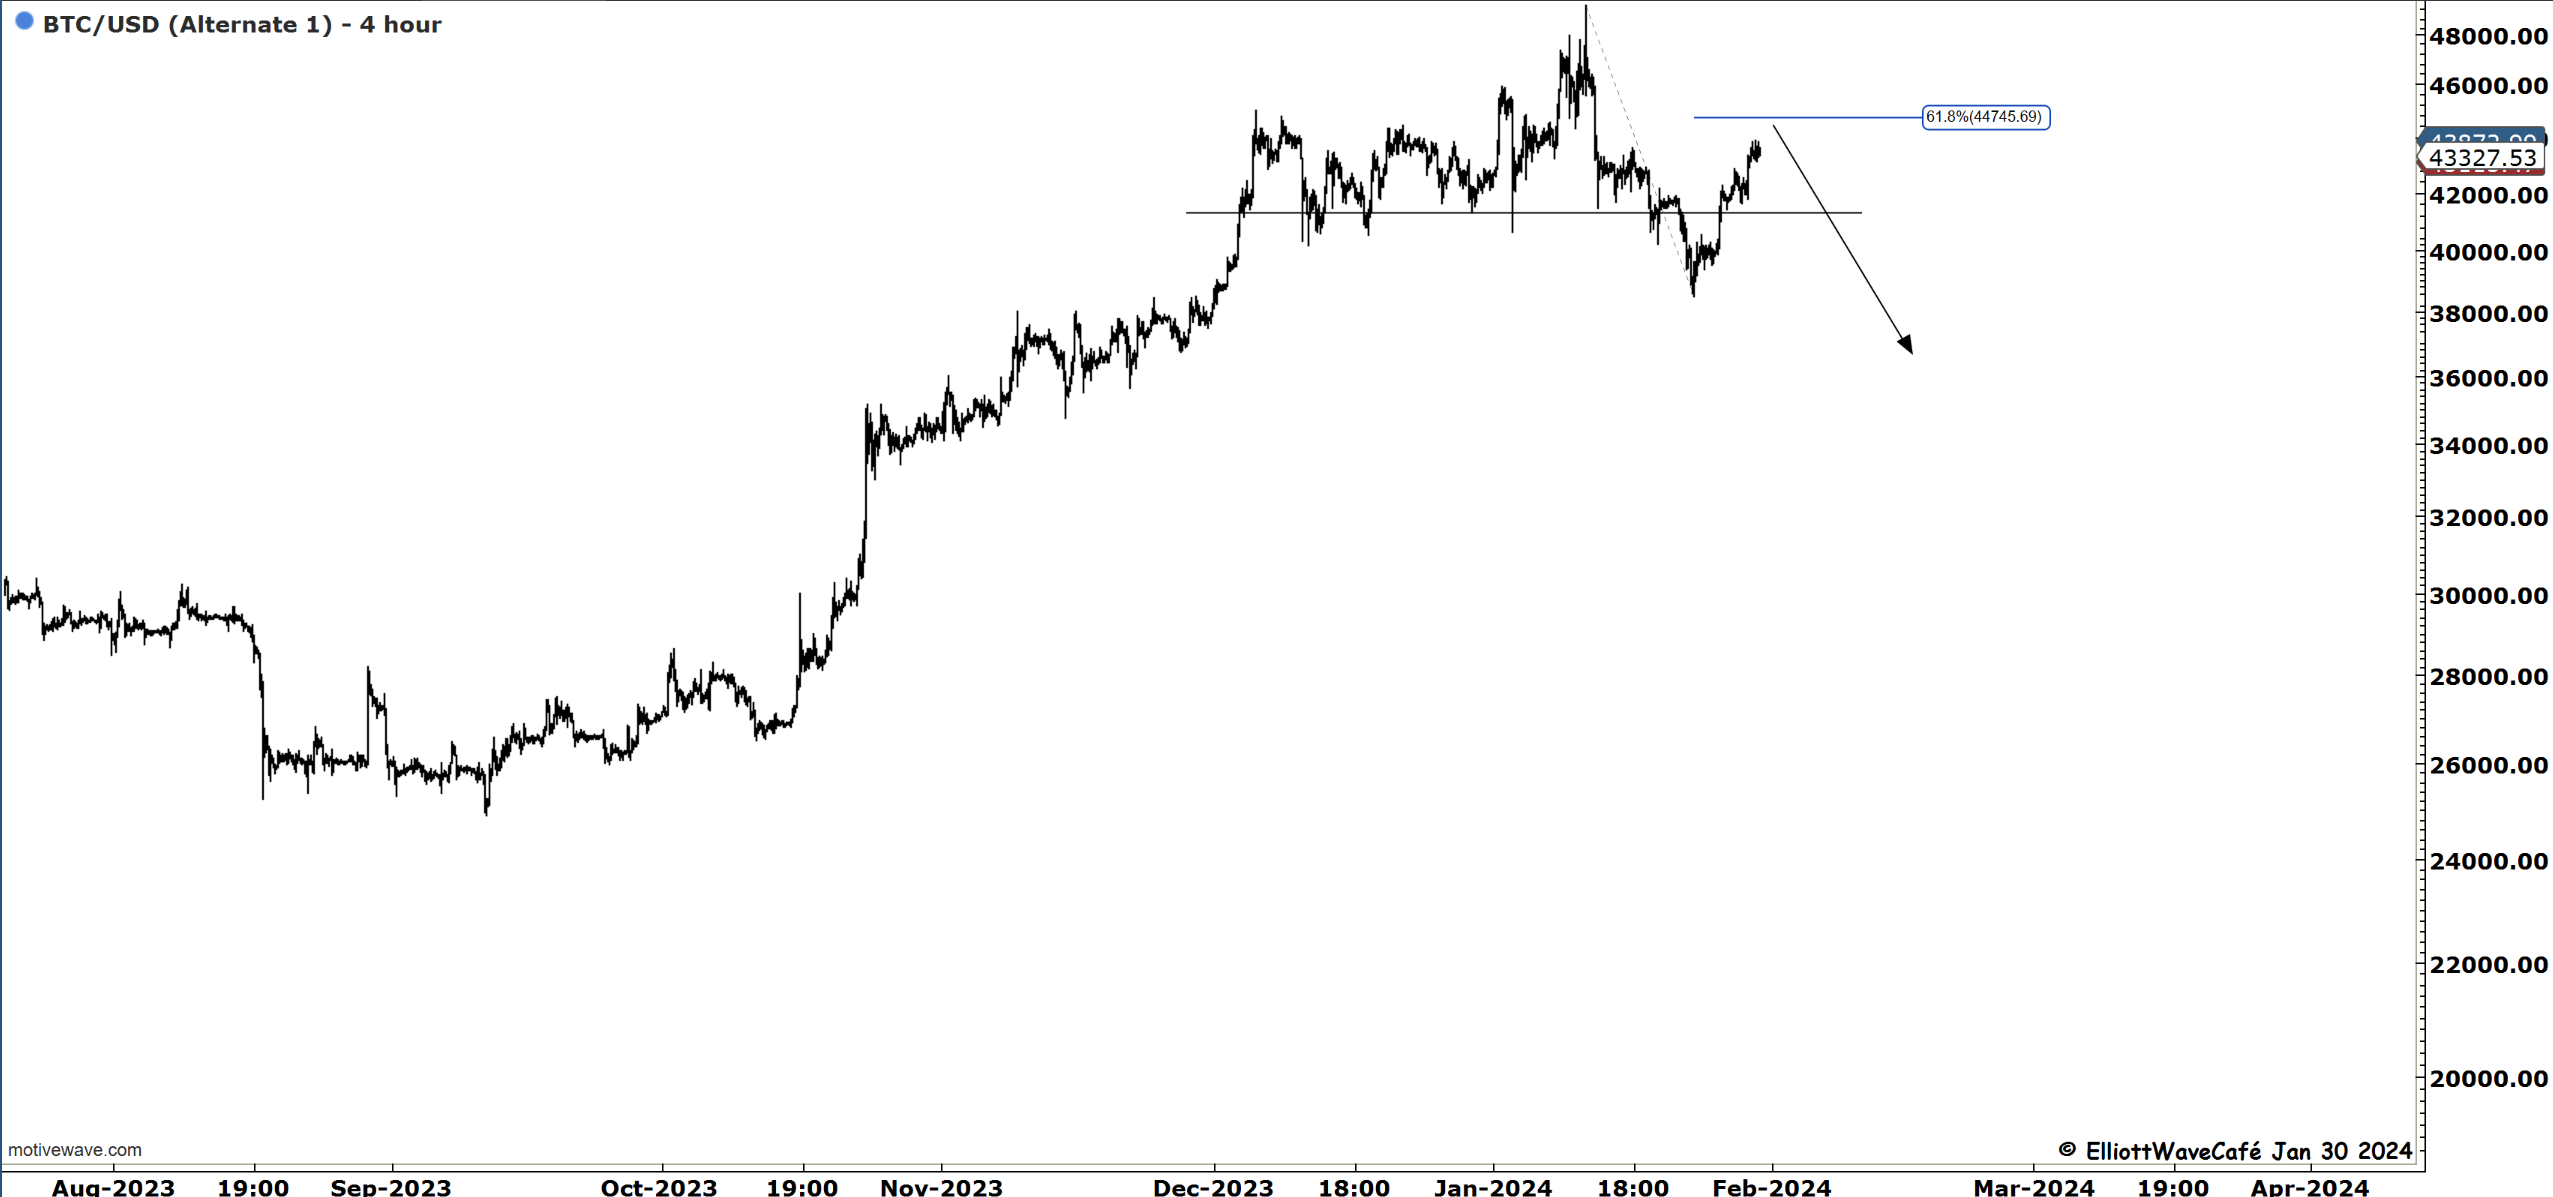
Bitcoin
If wave a of (b) is taking place, we should not be traveling higher from here. I am on the lookout for a b next, followed by a quick c. We follow along by using the simplest form of correction and adapt from there. I don’t have great visibility here as we had at the top of the channel or back at the middle line reaction. In situations like this, the market is better to be observed, and one should wait until clearer opportunities appear.
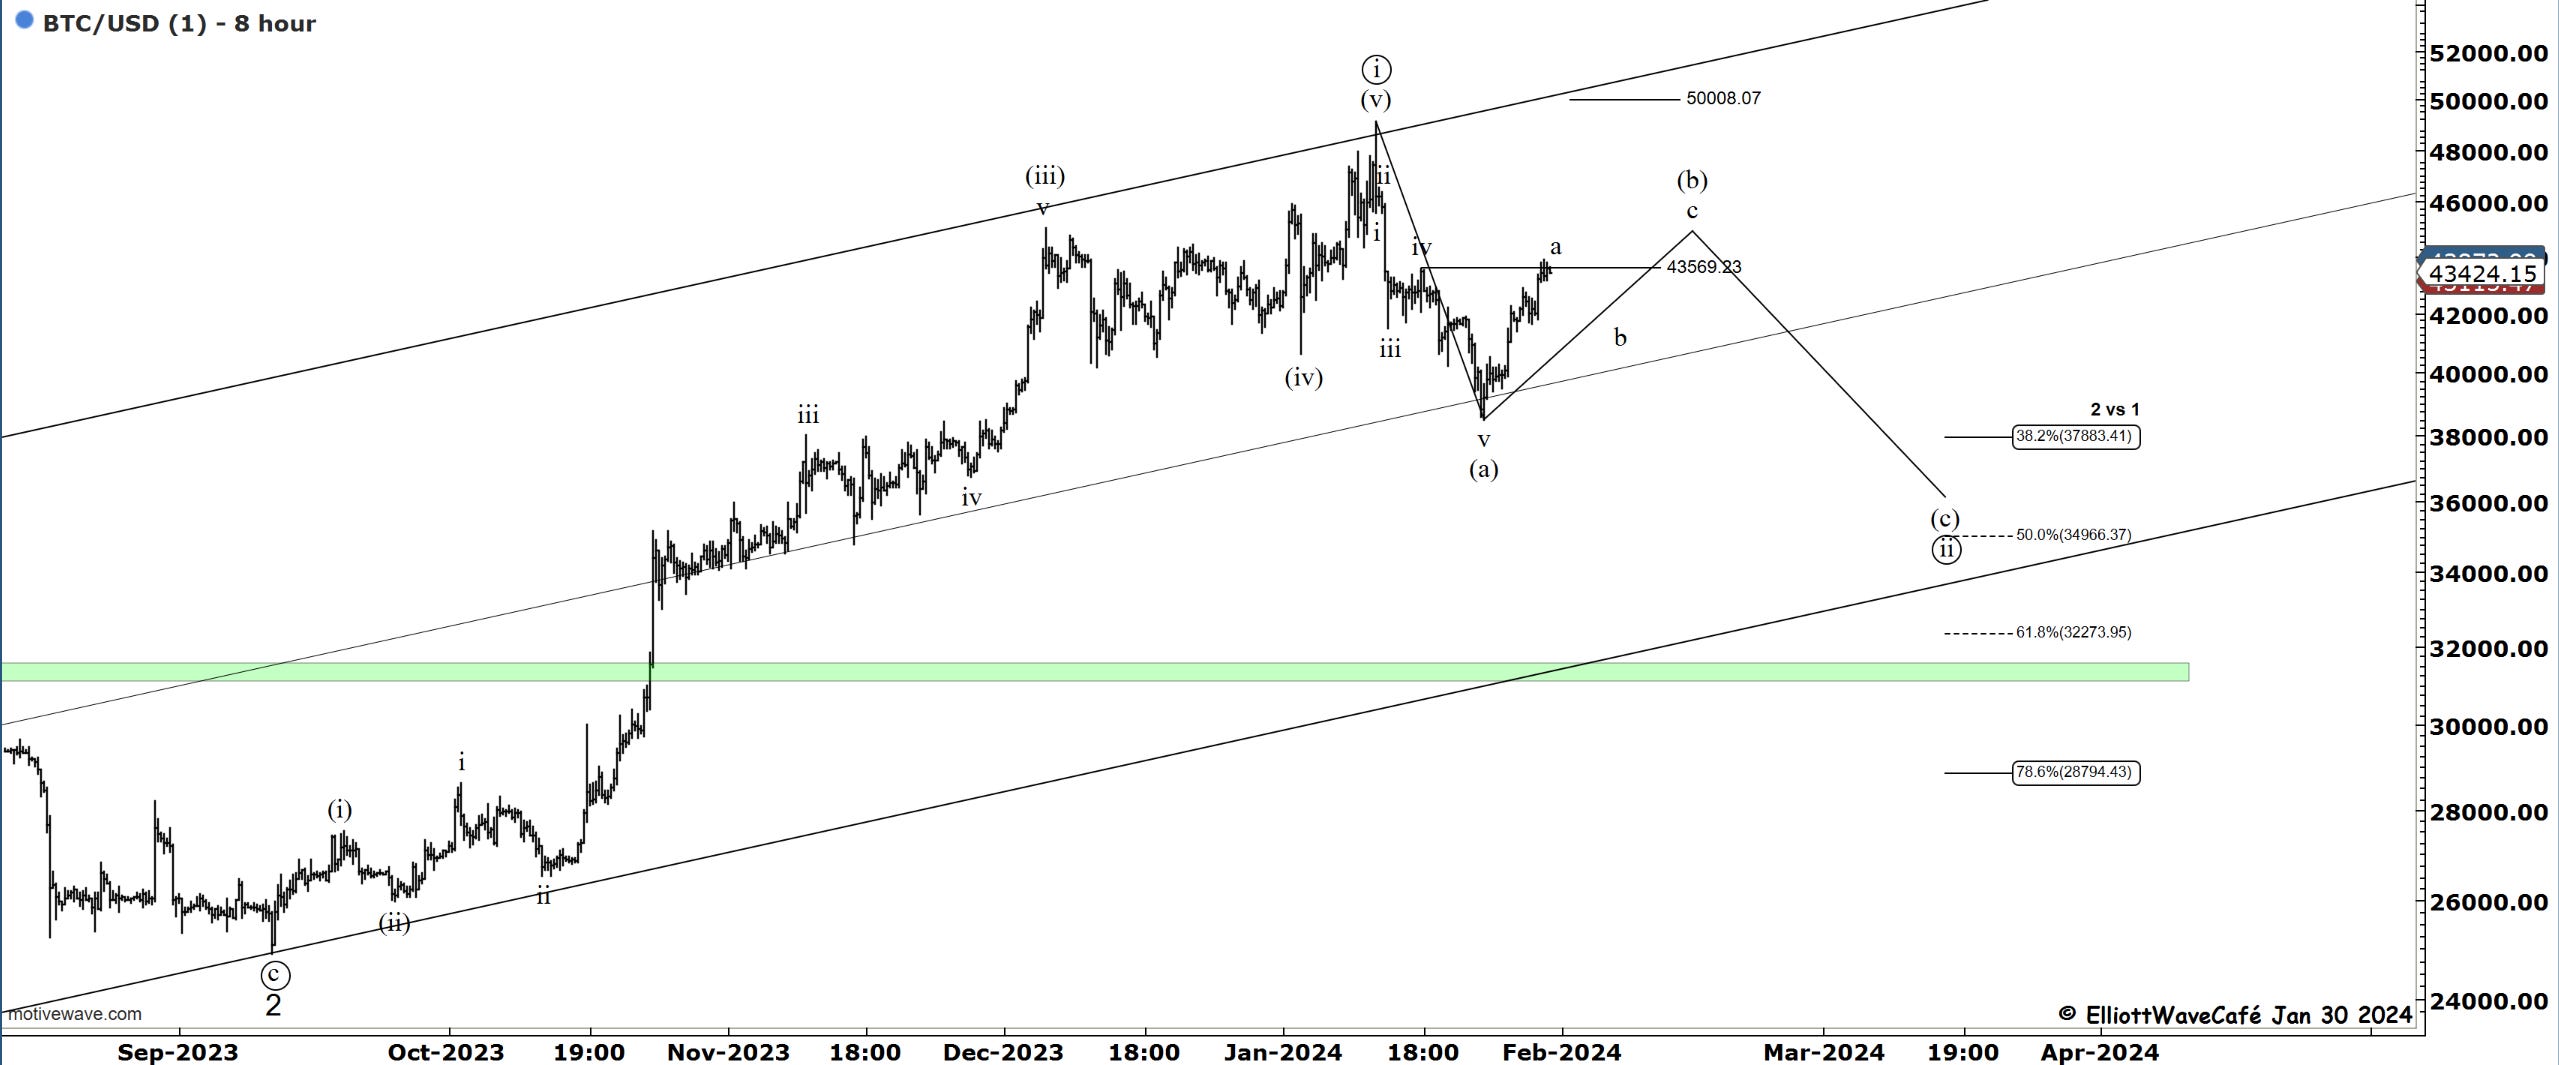
A simple way to take a short view on this would be to protect above 45k and look for a break below 38.5 with initial targets at 41k.
“Double shot” Daily member video coming up next,
If you’re new to Elliott Wave or need to refresh, there is a 7-hour video course with downloadable slides under The Coarse tab on the website.
Have a great day wherever you are! - trade well, and don’t forget to subscribe and drop a like if this letter helps you in any way.
Cris
email: ewcafe@pm.me