
The Daily Drip
Core markets charts updates and commentary
Note: The counts on the right edge are real-time, and they are prone to adjustments as price action develops. Elliott Wave has a fluid approach, is evidence-based, and requires constant monitoring of certain thresholds.
In the counts below, this (( )) = circle on chart
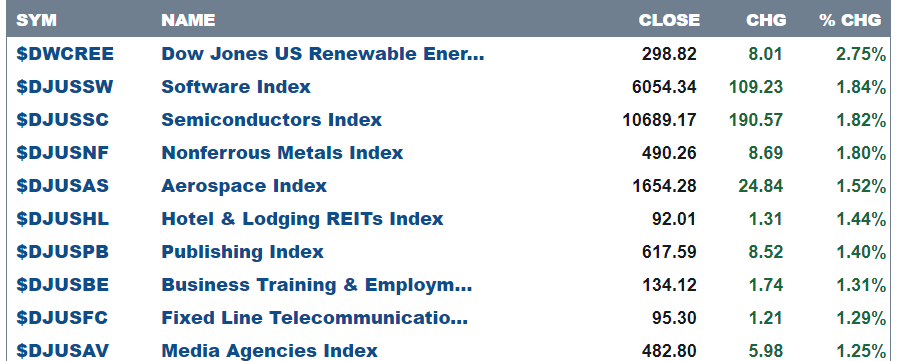
Here are today’s top 10 best performers out of 104 industries.
81 positive closes and 23 negative.
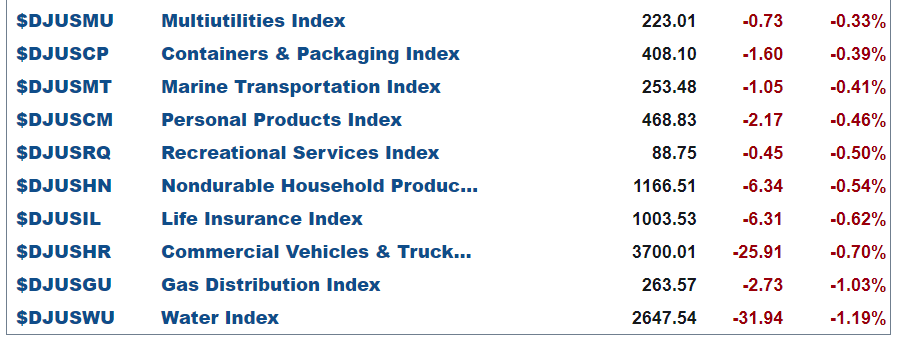
and bottom 10 …
SP500
The Sp500 is running fast towards the end of this wave (v) rally. By comparing the counts with the Nasdaq I am finding this approach to be more appropriate. I was waiting for us to get a wave (ii) of ((v)) but it never got to develop into a “standard” second wave. It was quite fast and short-lived. I still place it on the chart as an alternate for now. A quick move above 4600 would satisfy it.
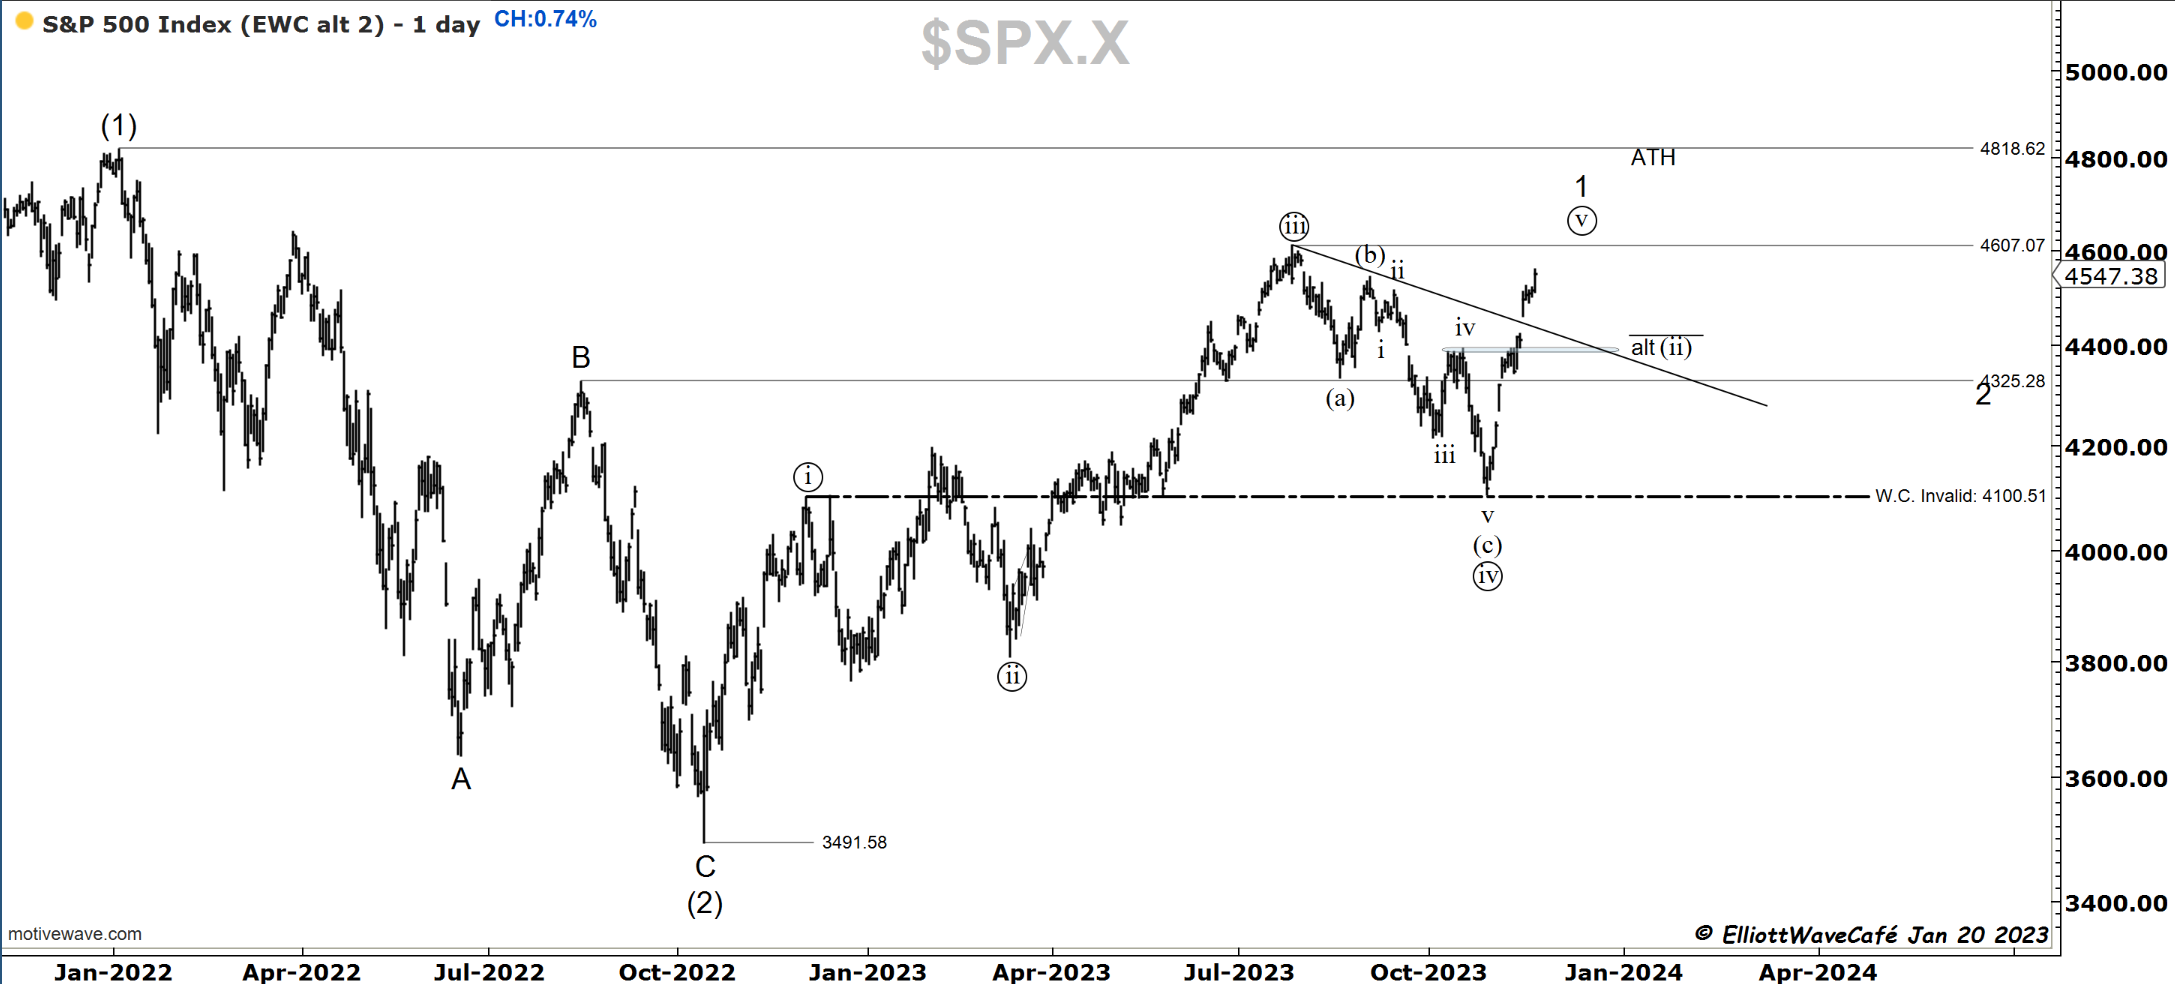
The speed of the move from the lows has me thinking of it being an extended wave (i) instead of a (iii). If that’s the case, then wave (v) needs to be shorter than (iii) to not break the rules of a motive wave.

Bottom line: a correction should start taking place by next week at the latest.
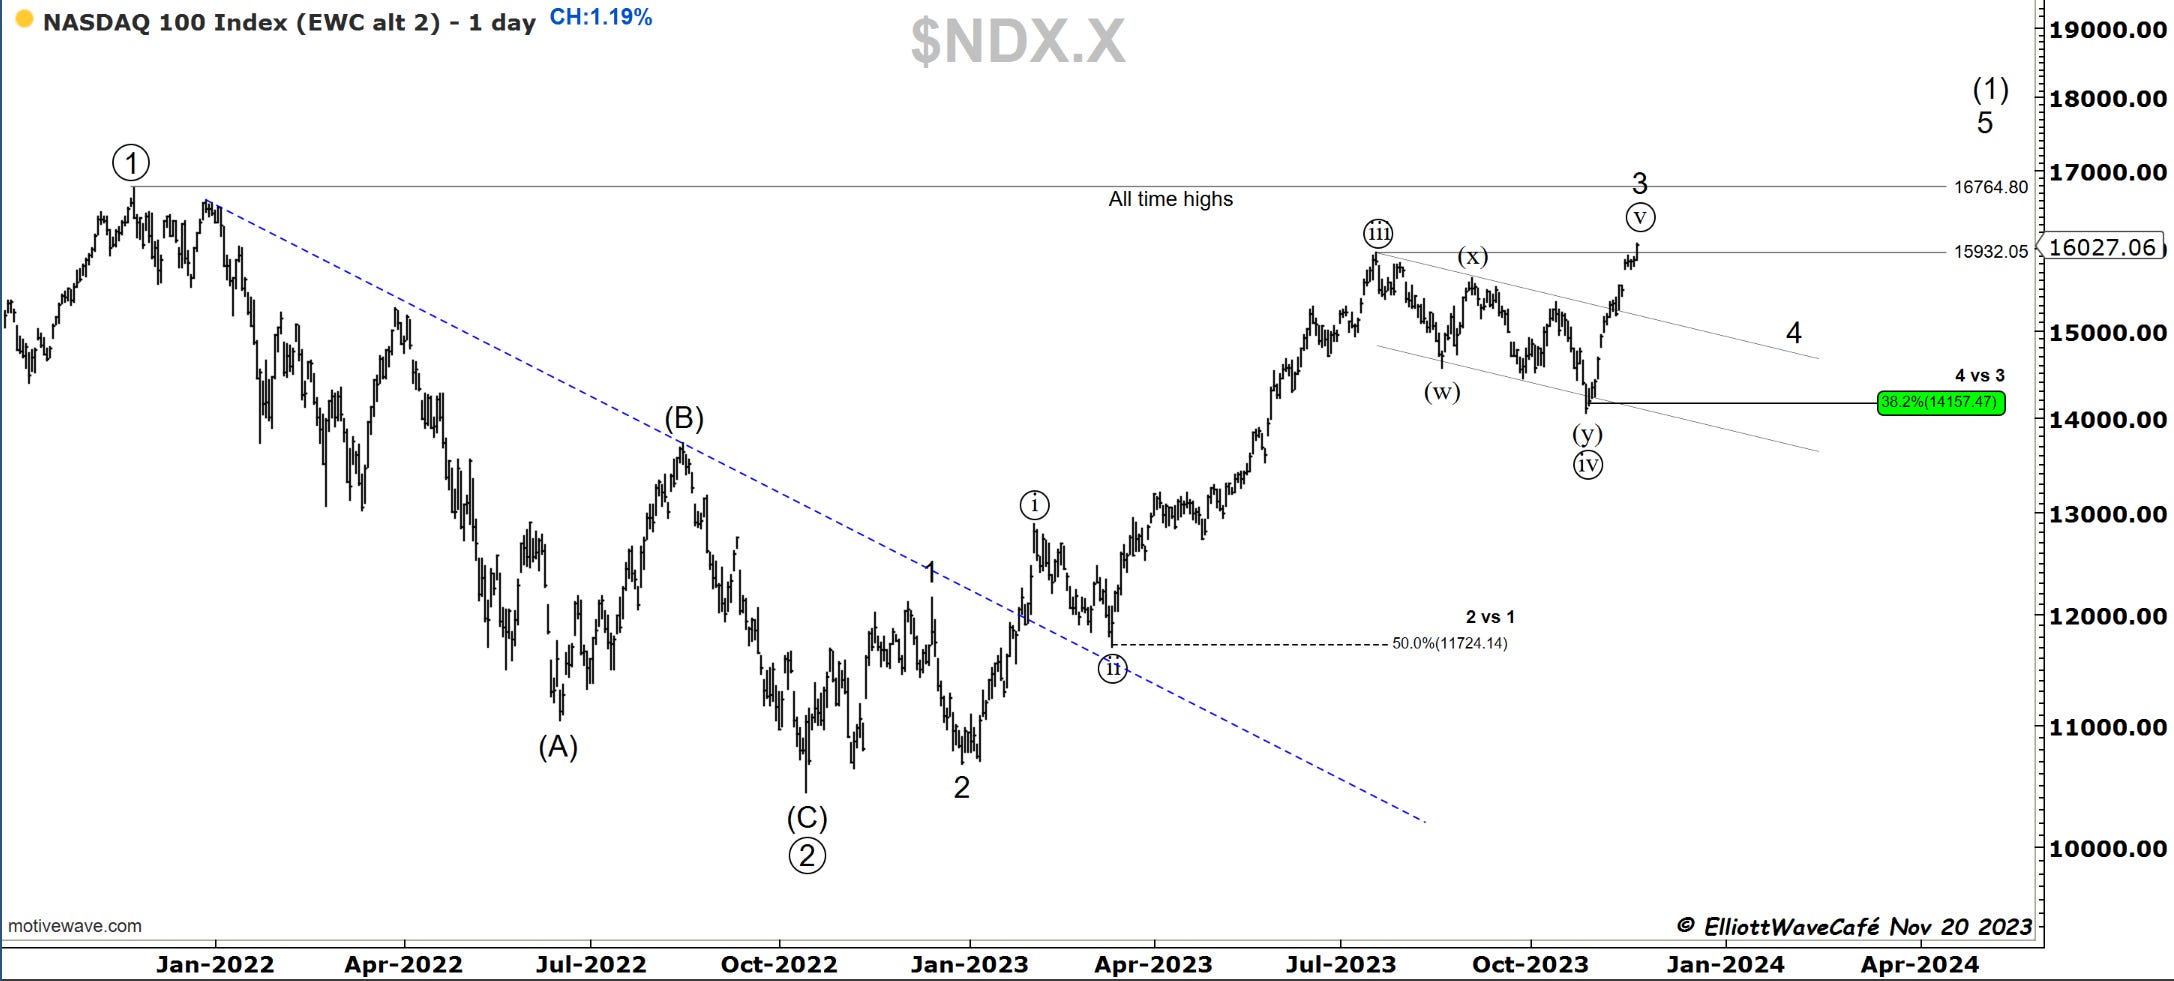
Nasdaq100
The move above wave ((iii)) high has satisfied the requirement for a 5th wave. Next is the internal of that wave. In the second chart, you can see how the 5wave display is evident with a similar extended wave (i).
As a side note, the clue the that Oct low was a 4th wave is the .382 fib in green. We discussed that ad nauseam in previous posts. If that’s a 4th, the current rally is a 5th.
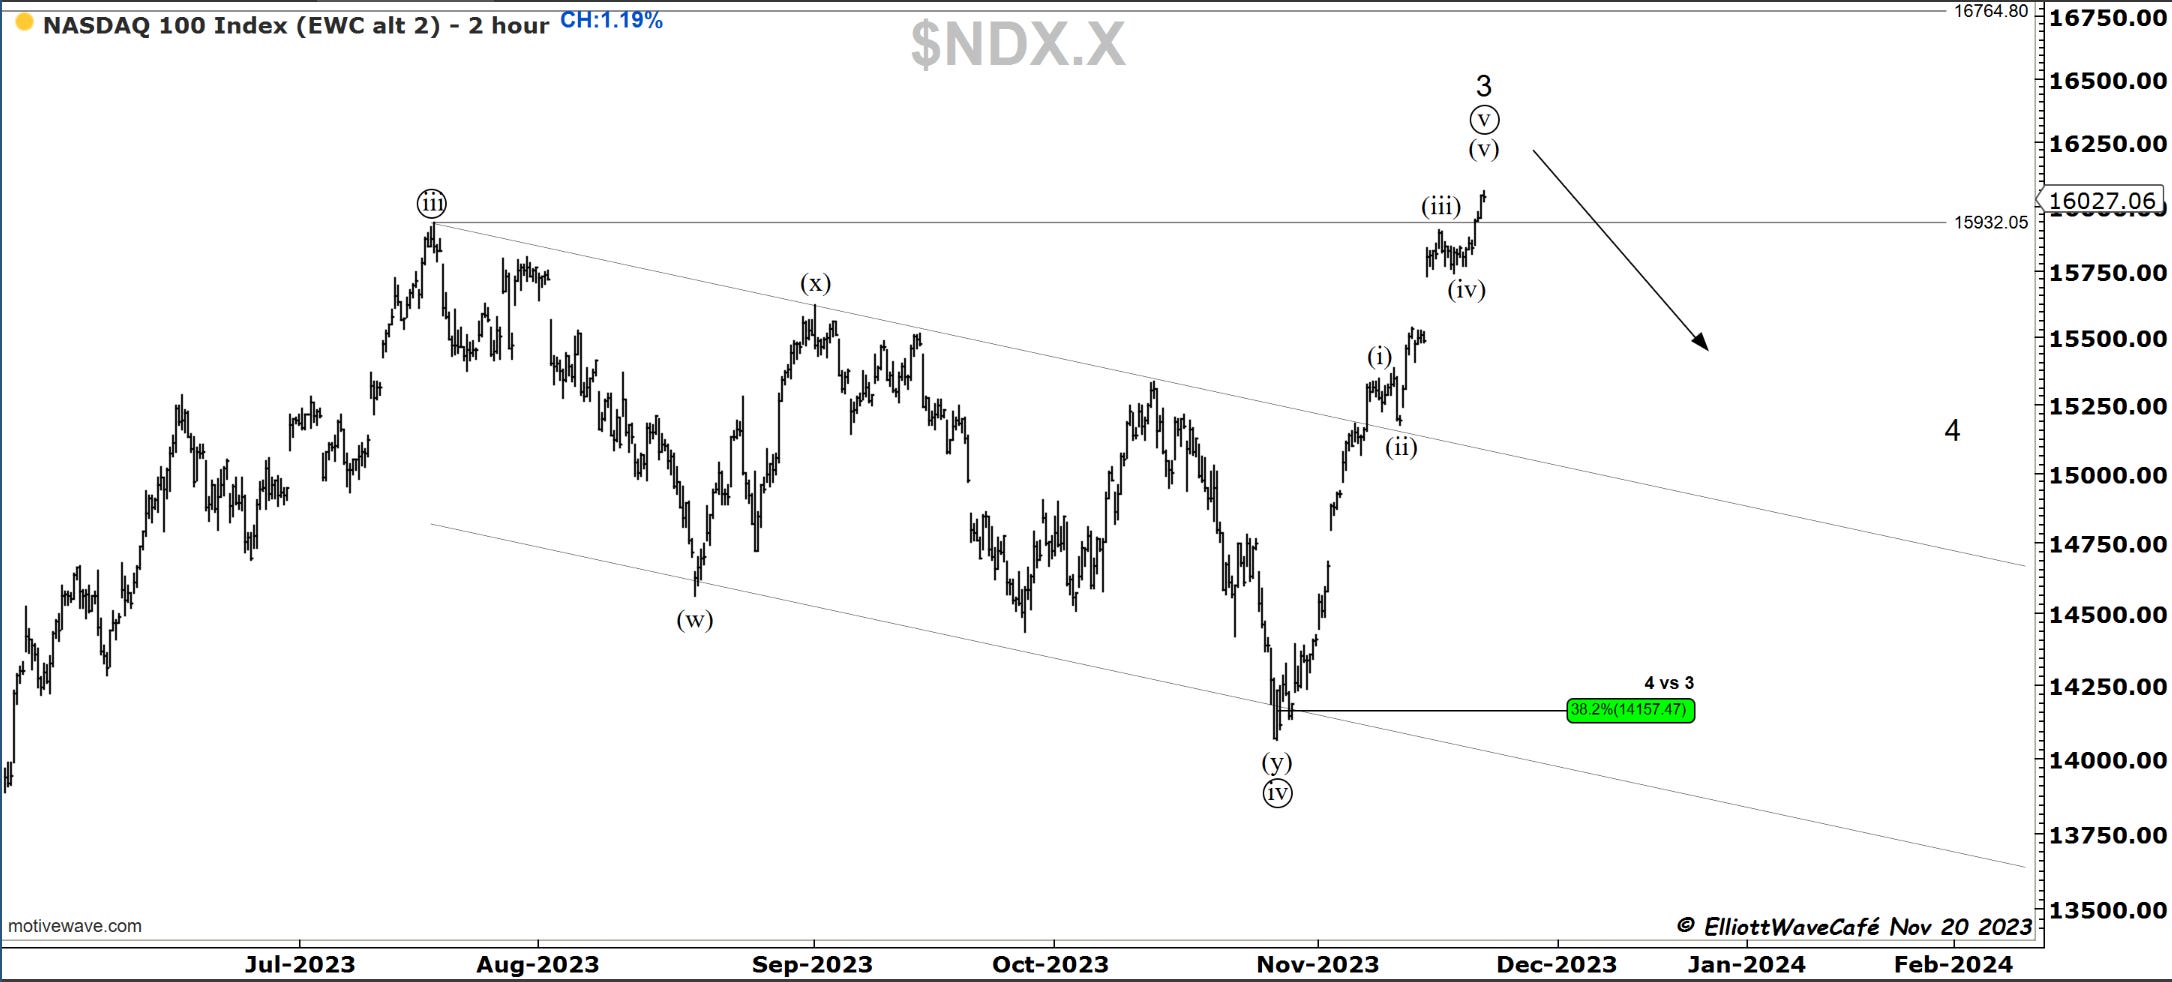
The BPI is getting quite hot. There could be a bit more room to run, but it’s telling longs to be quite cautious from here on out.
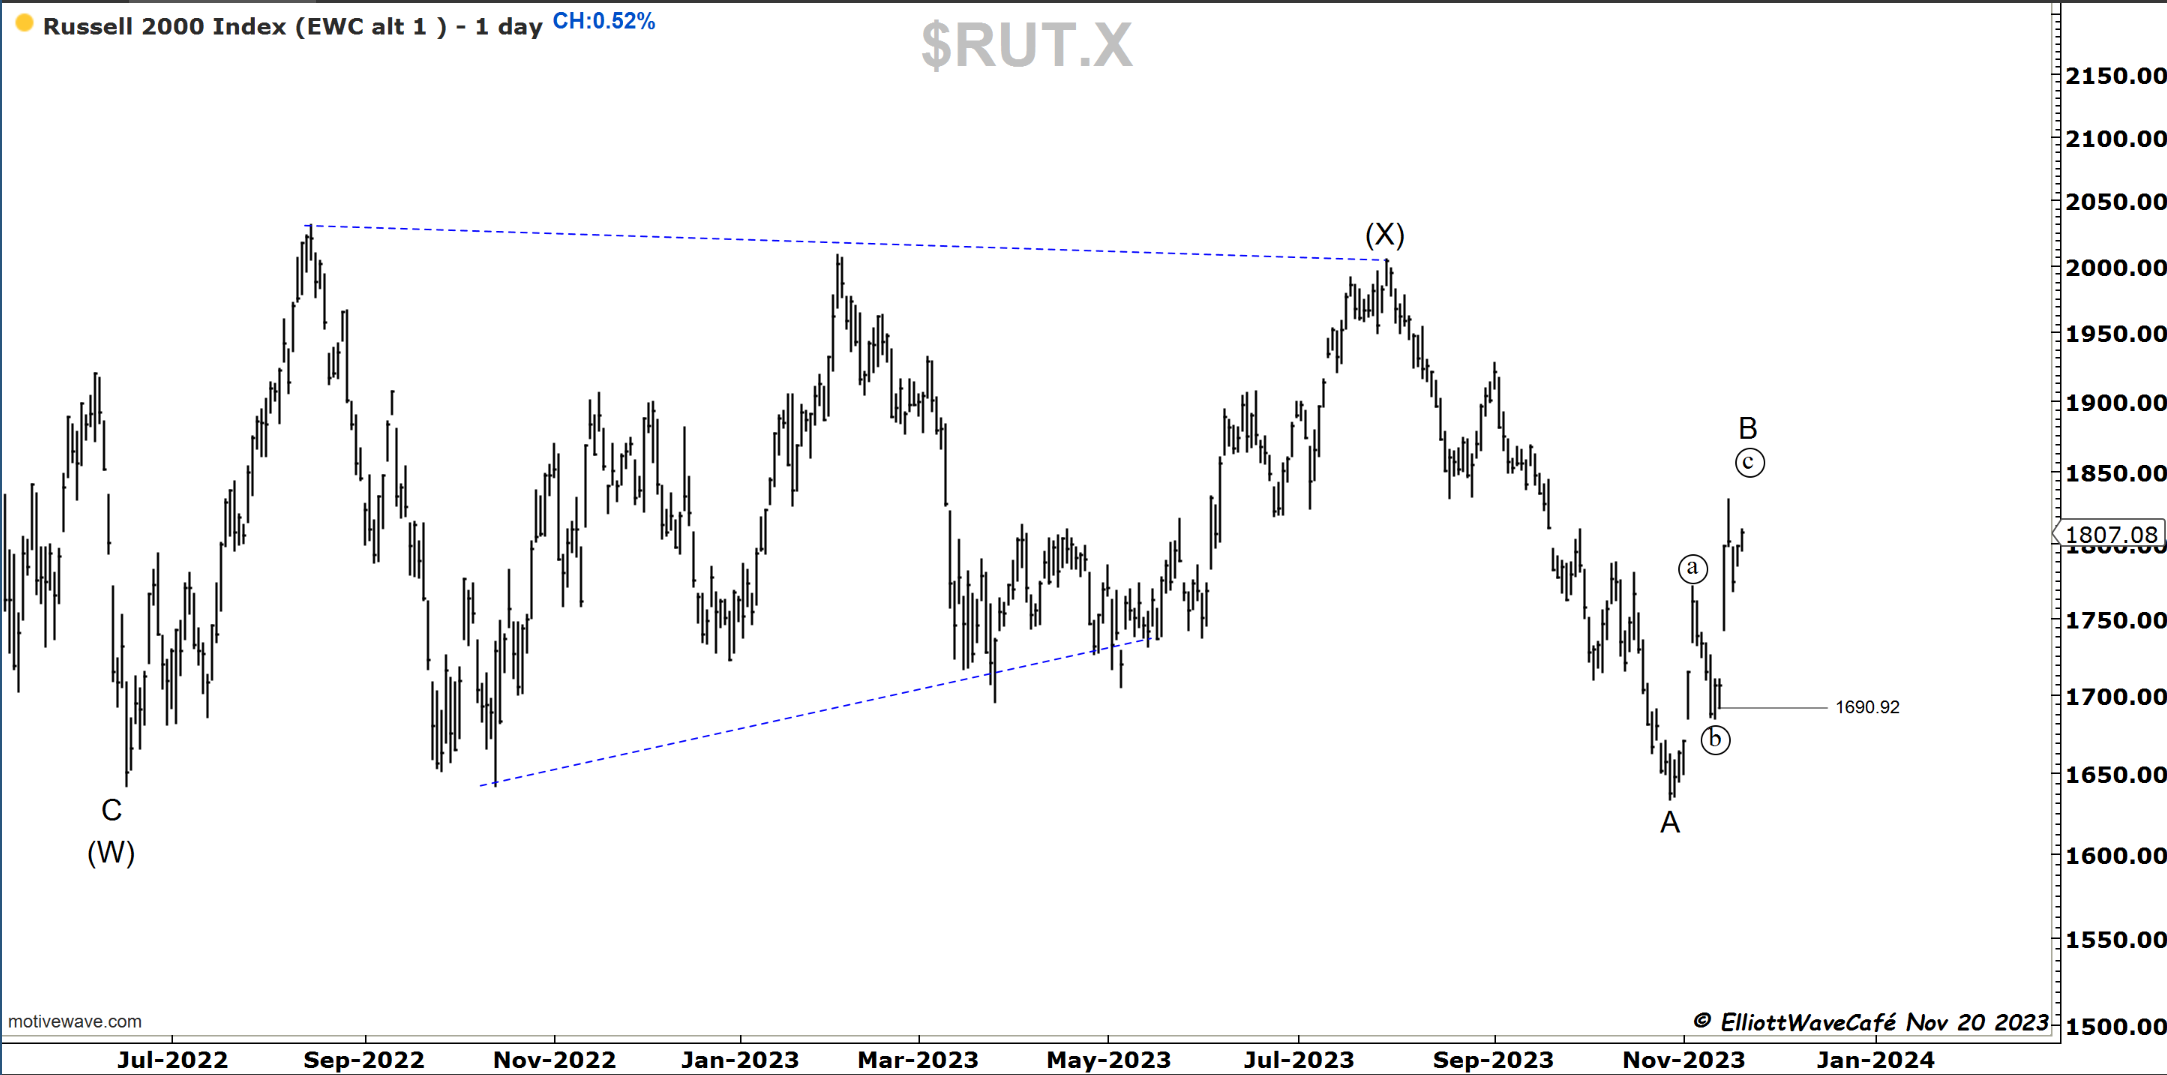
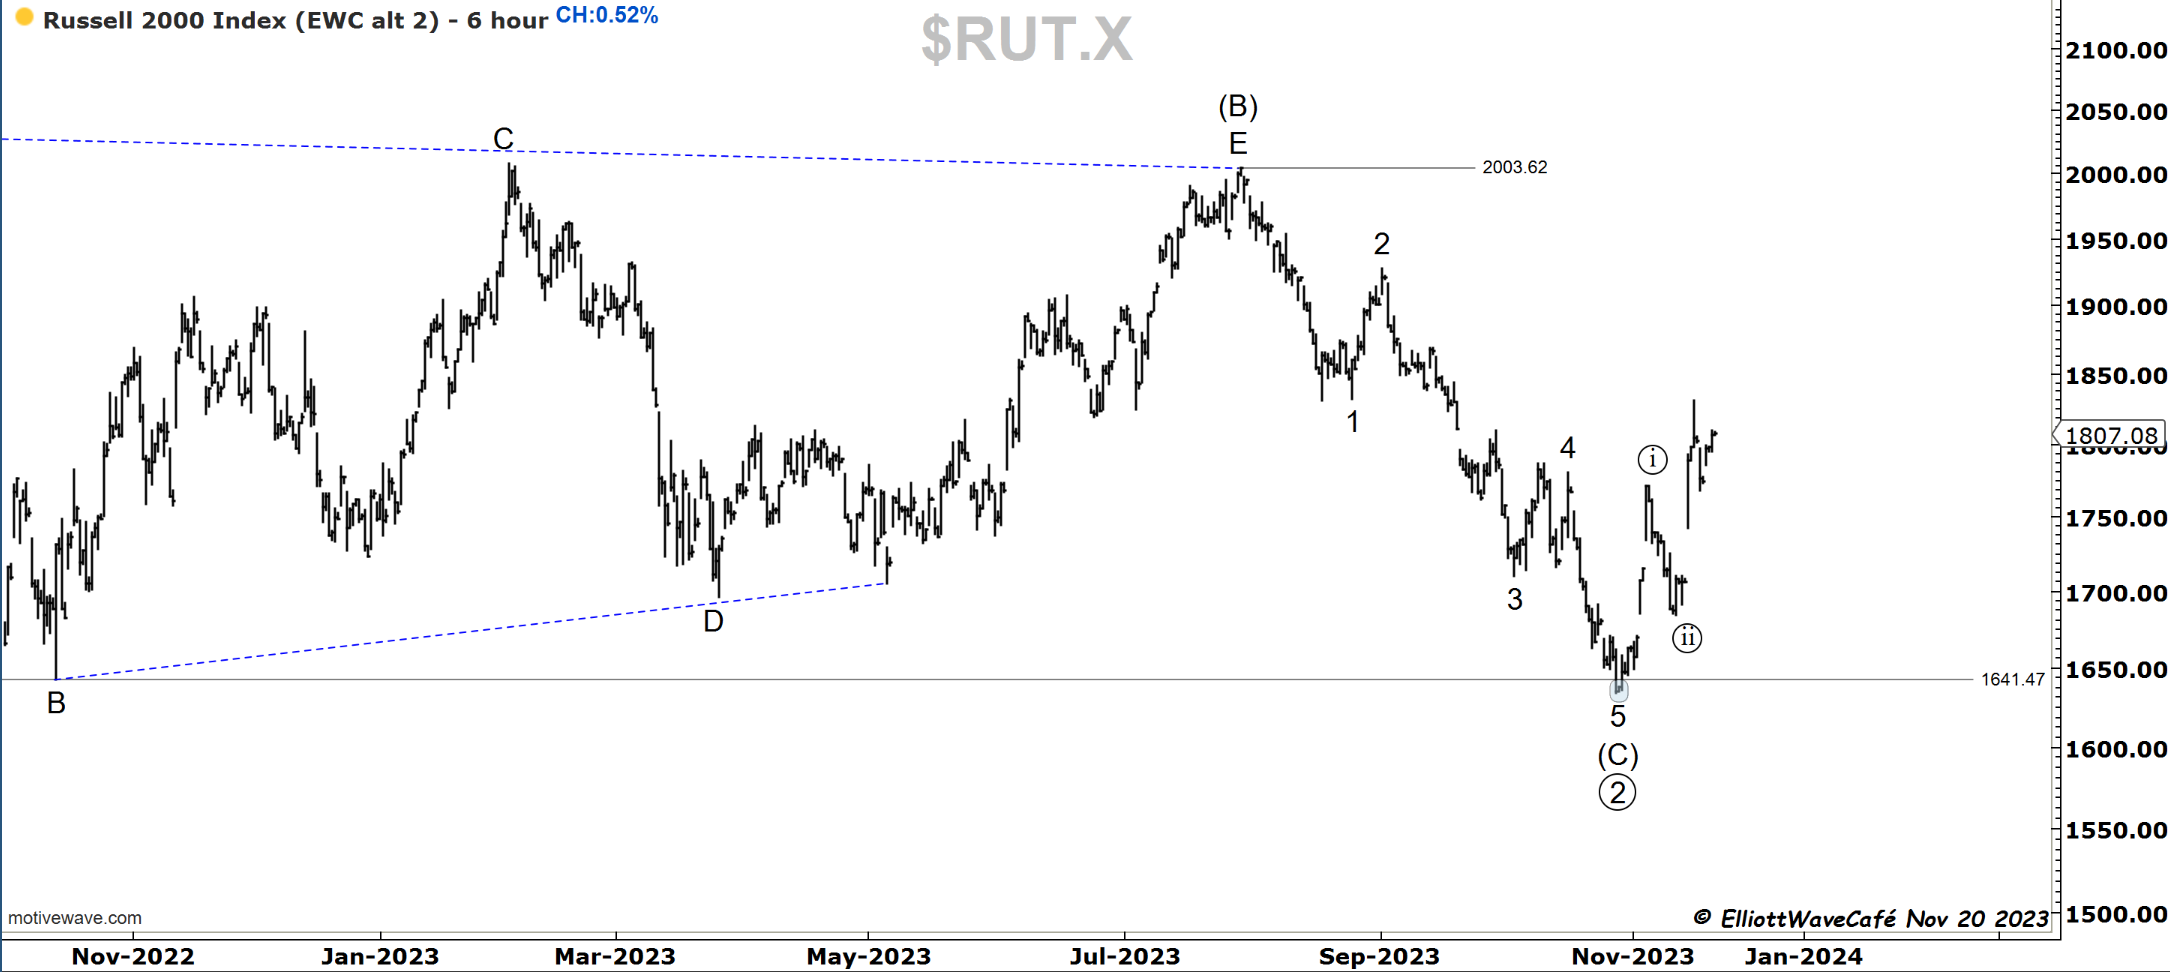
RUSSELL 2000
I need to continue to present both charts for the small caps. The current move has displayed 3waves so far which makes it a candidate for a B wave rally. It needs further upside to continue building the 1,2 in the second chart. A break below 1690 would elevate the 1st chart as a higher odd view.
One question to ask is, if the other indices start correcting in the next few days, how do the small caps behave? That relative ratio should be watched closely.

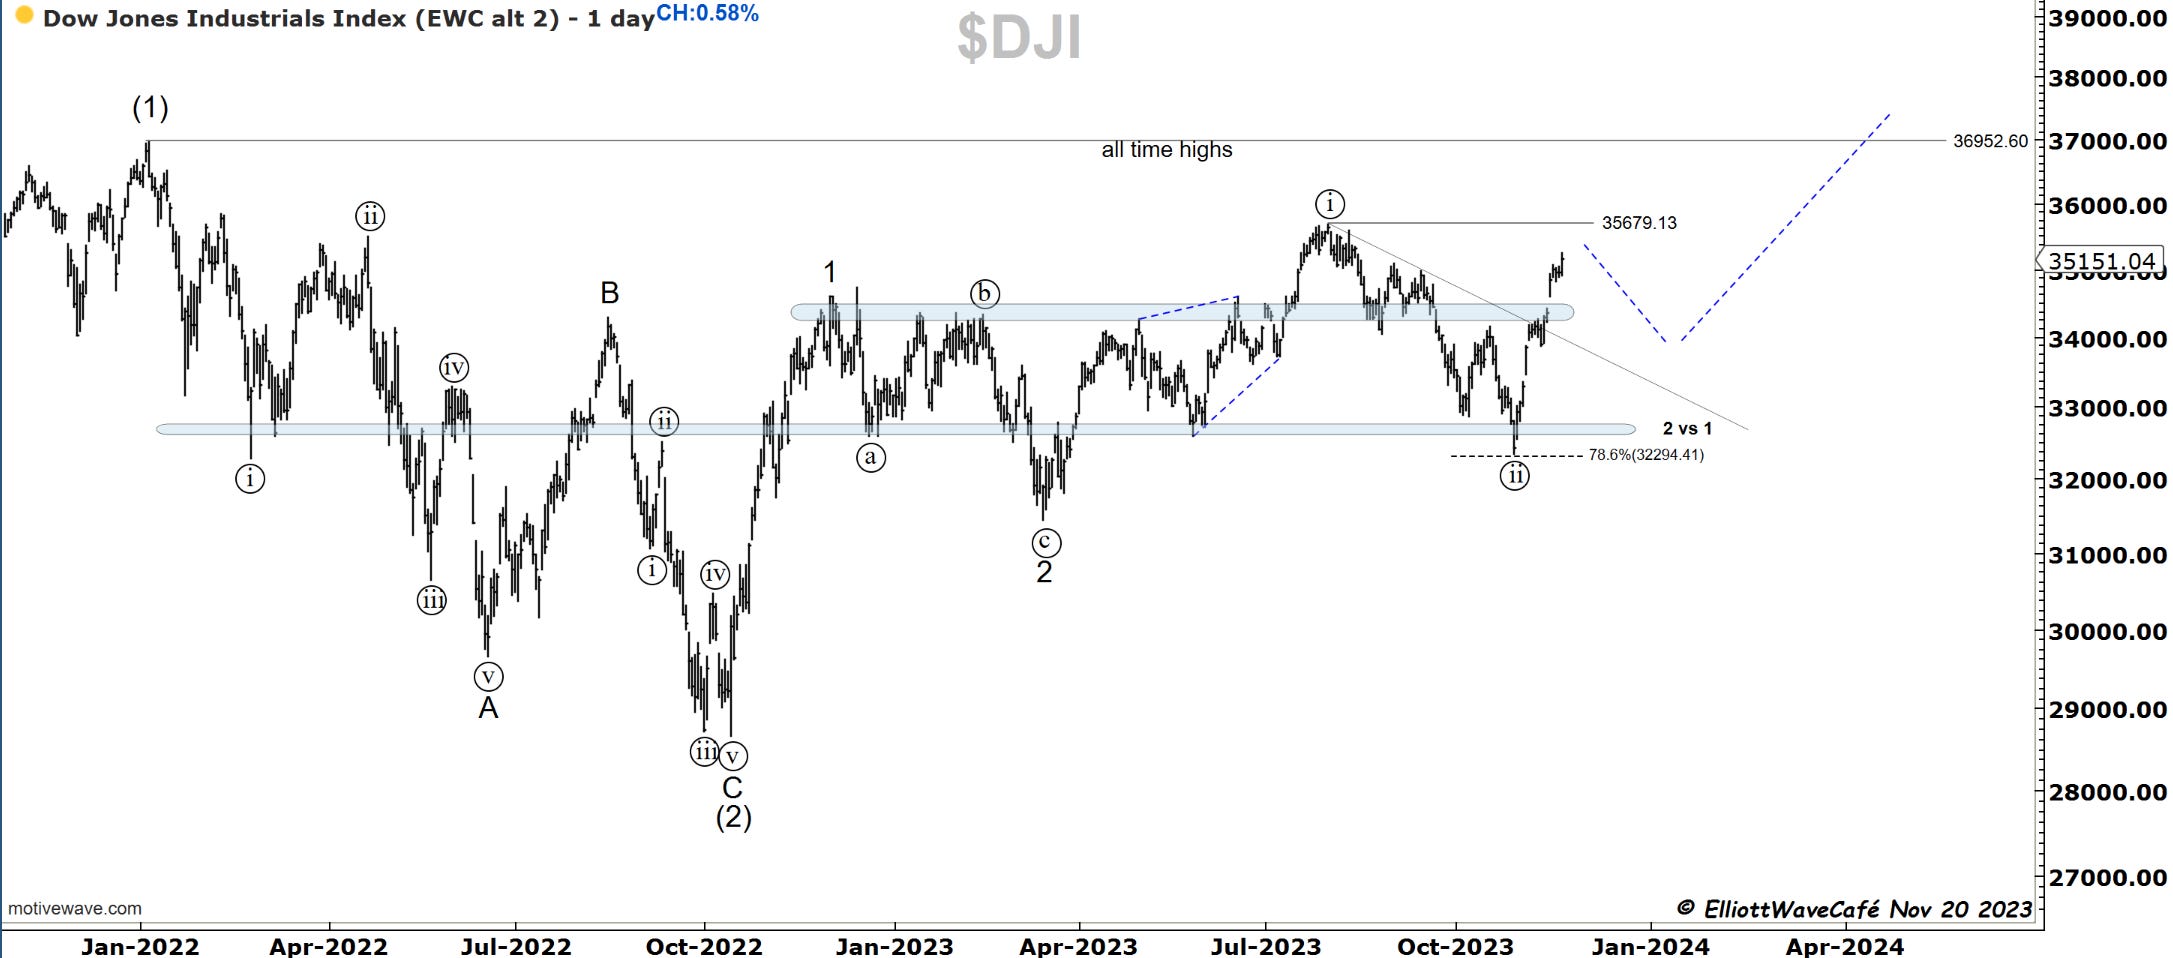
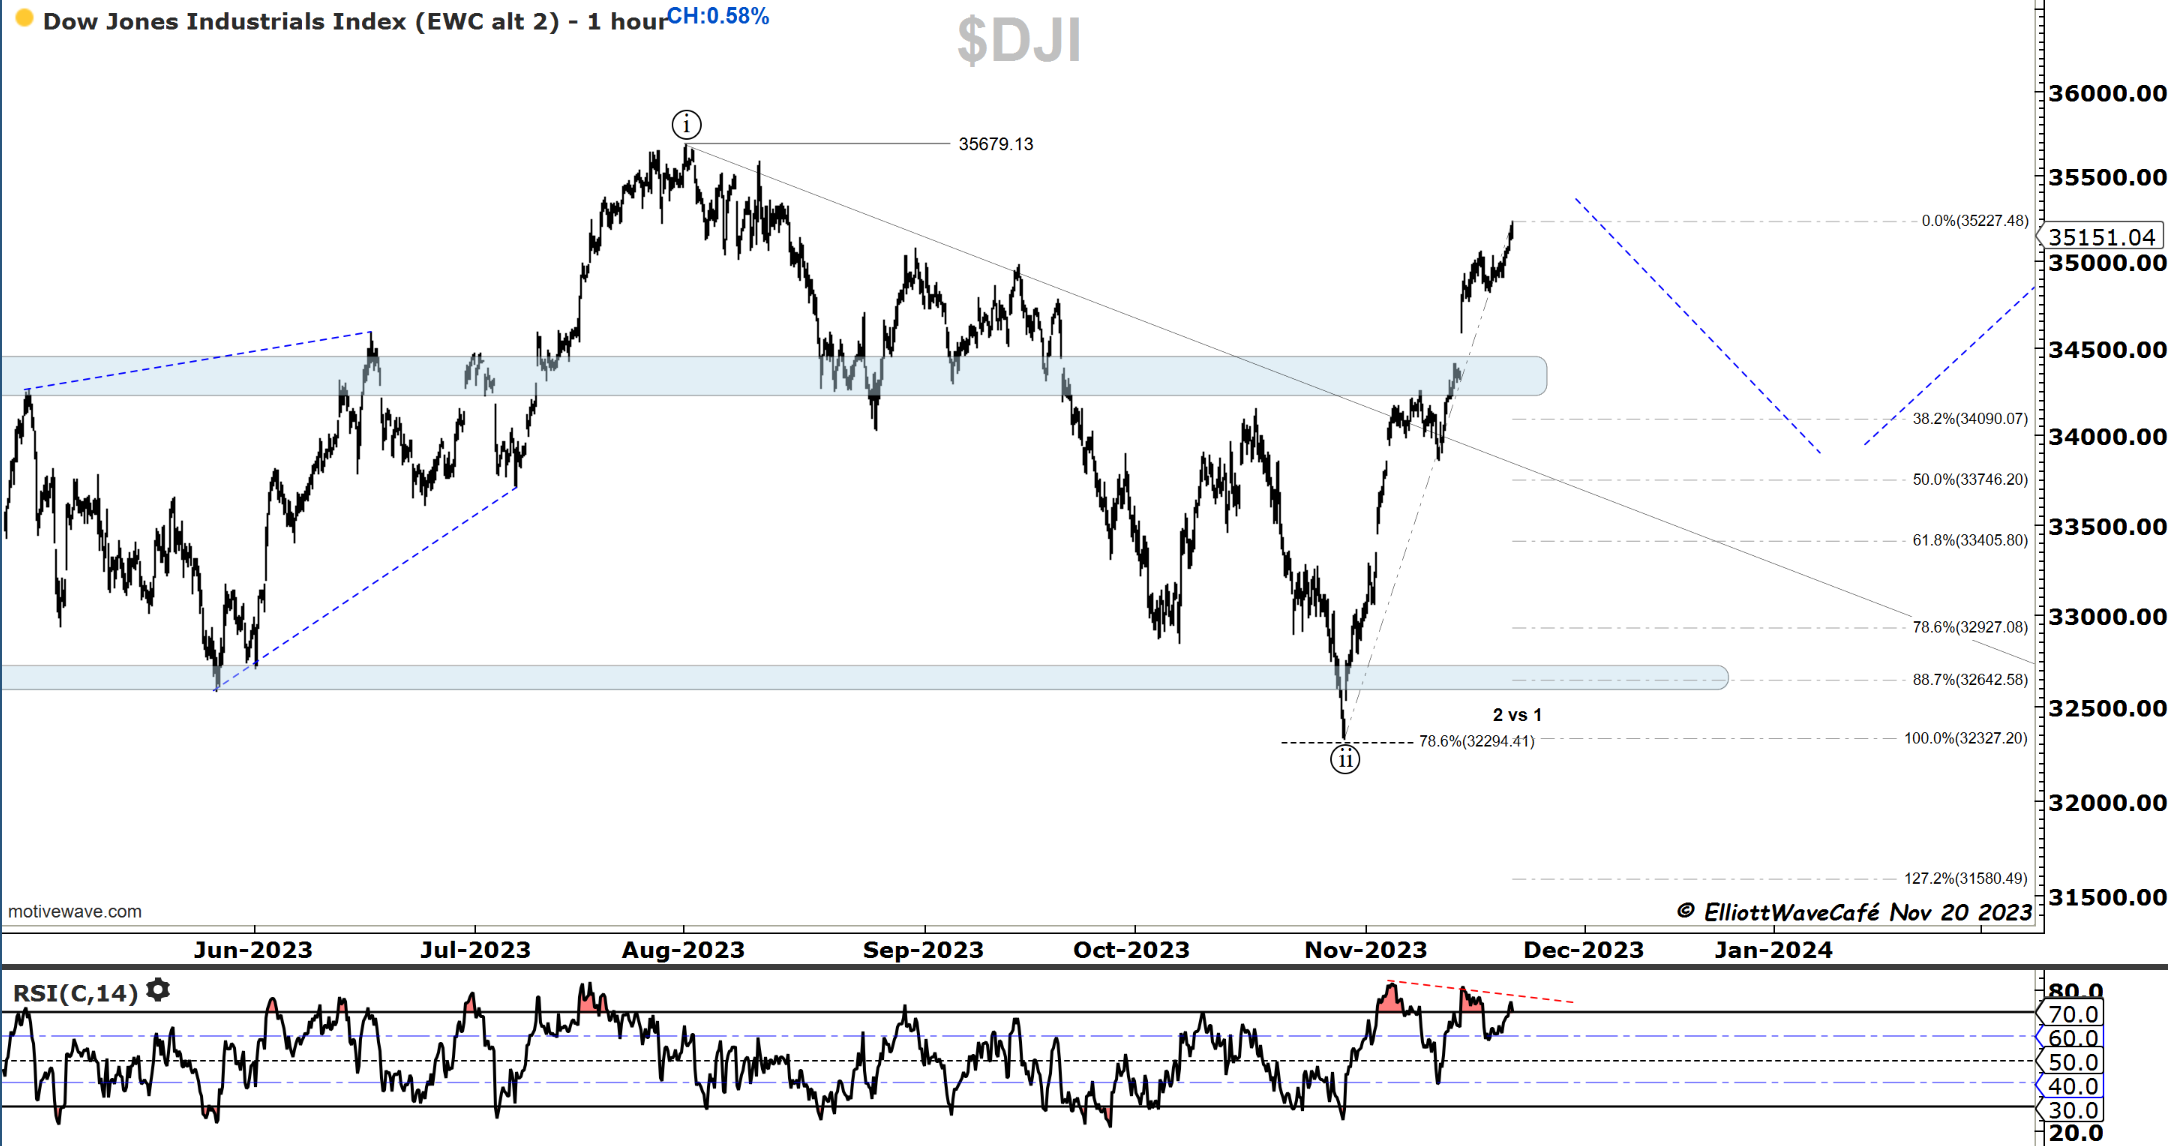
Dow30
Not much to add here. At least a 38% correction is expected once we get going.
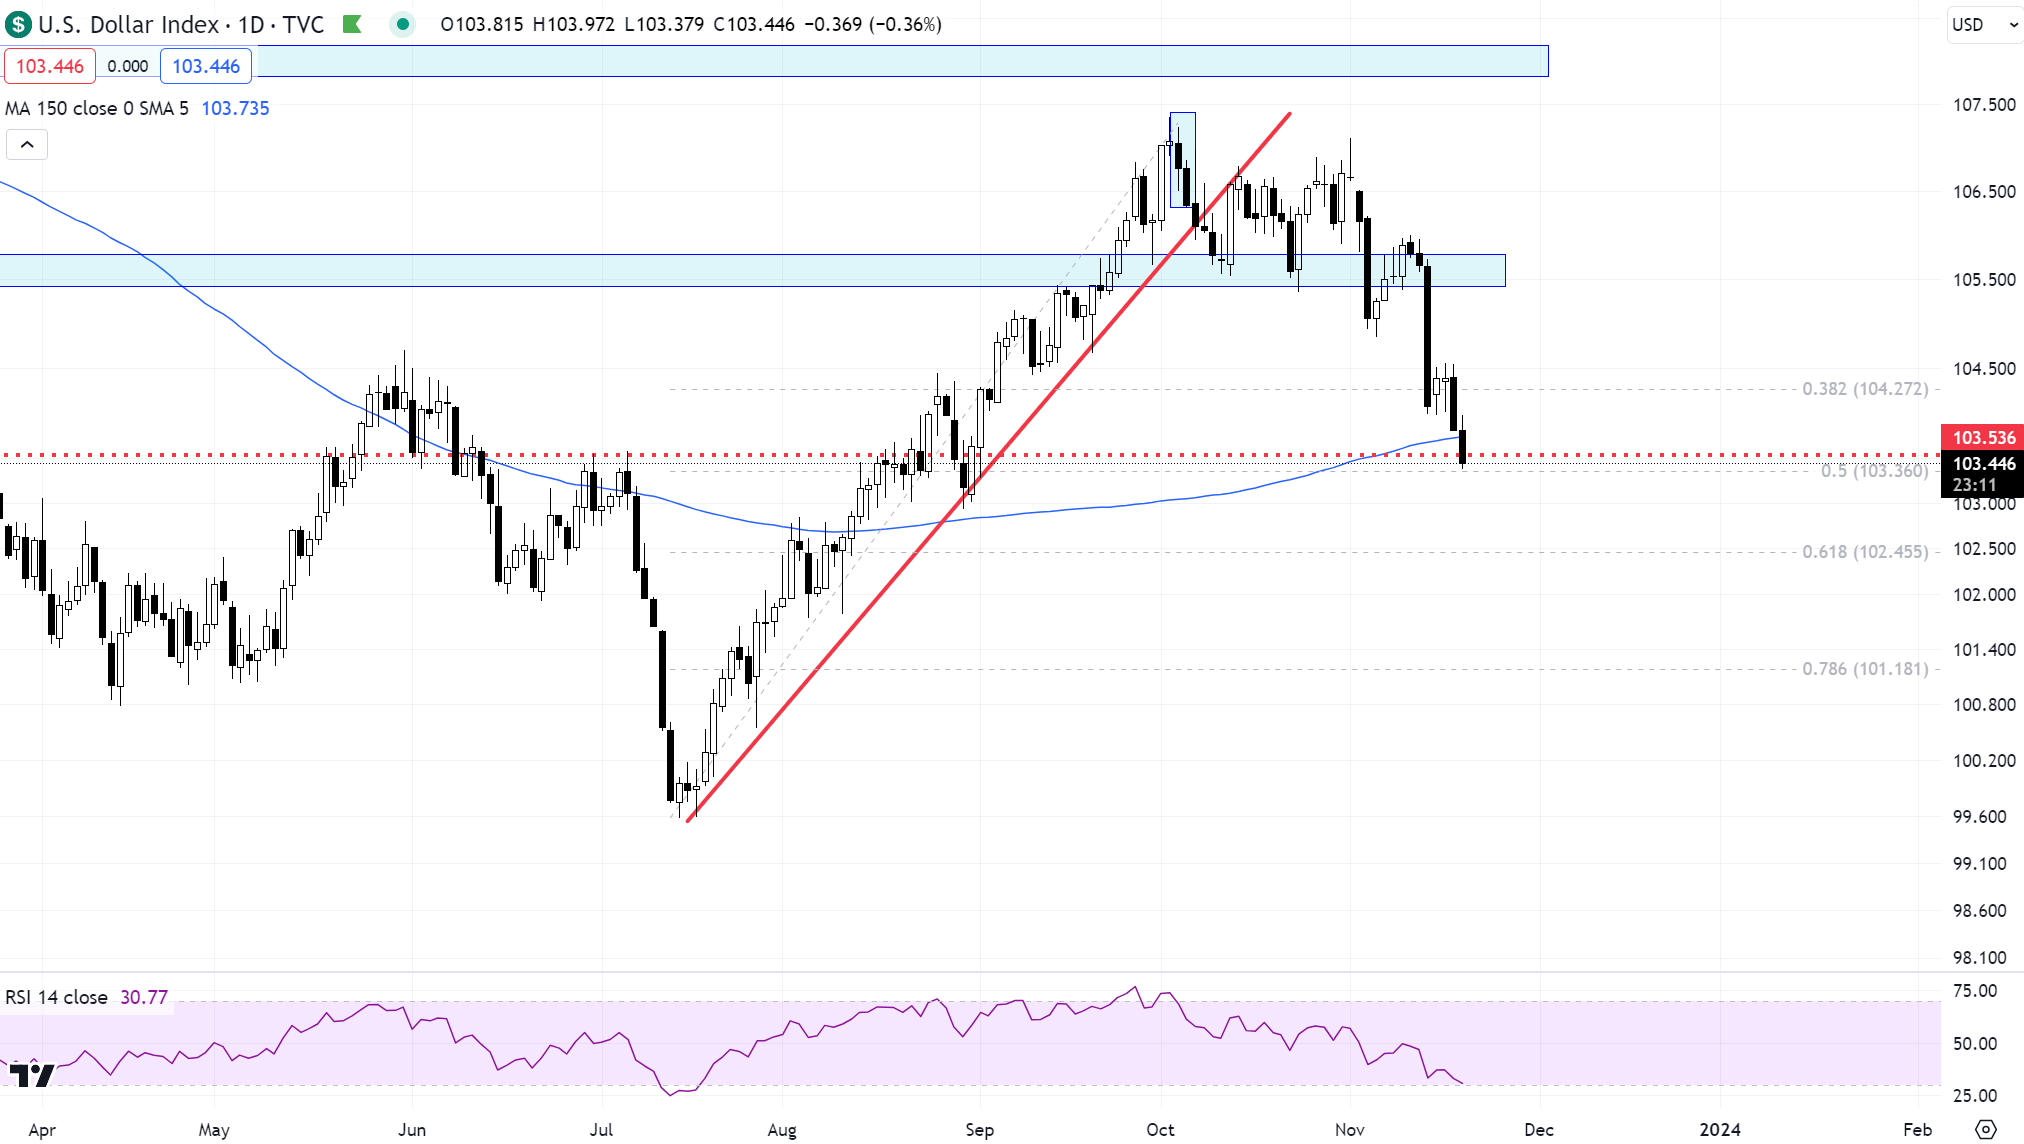
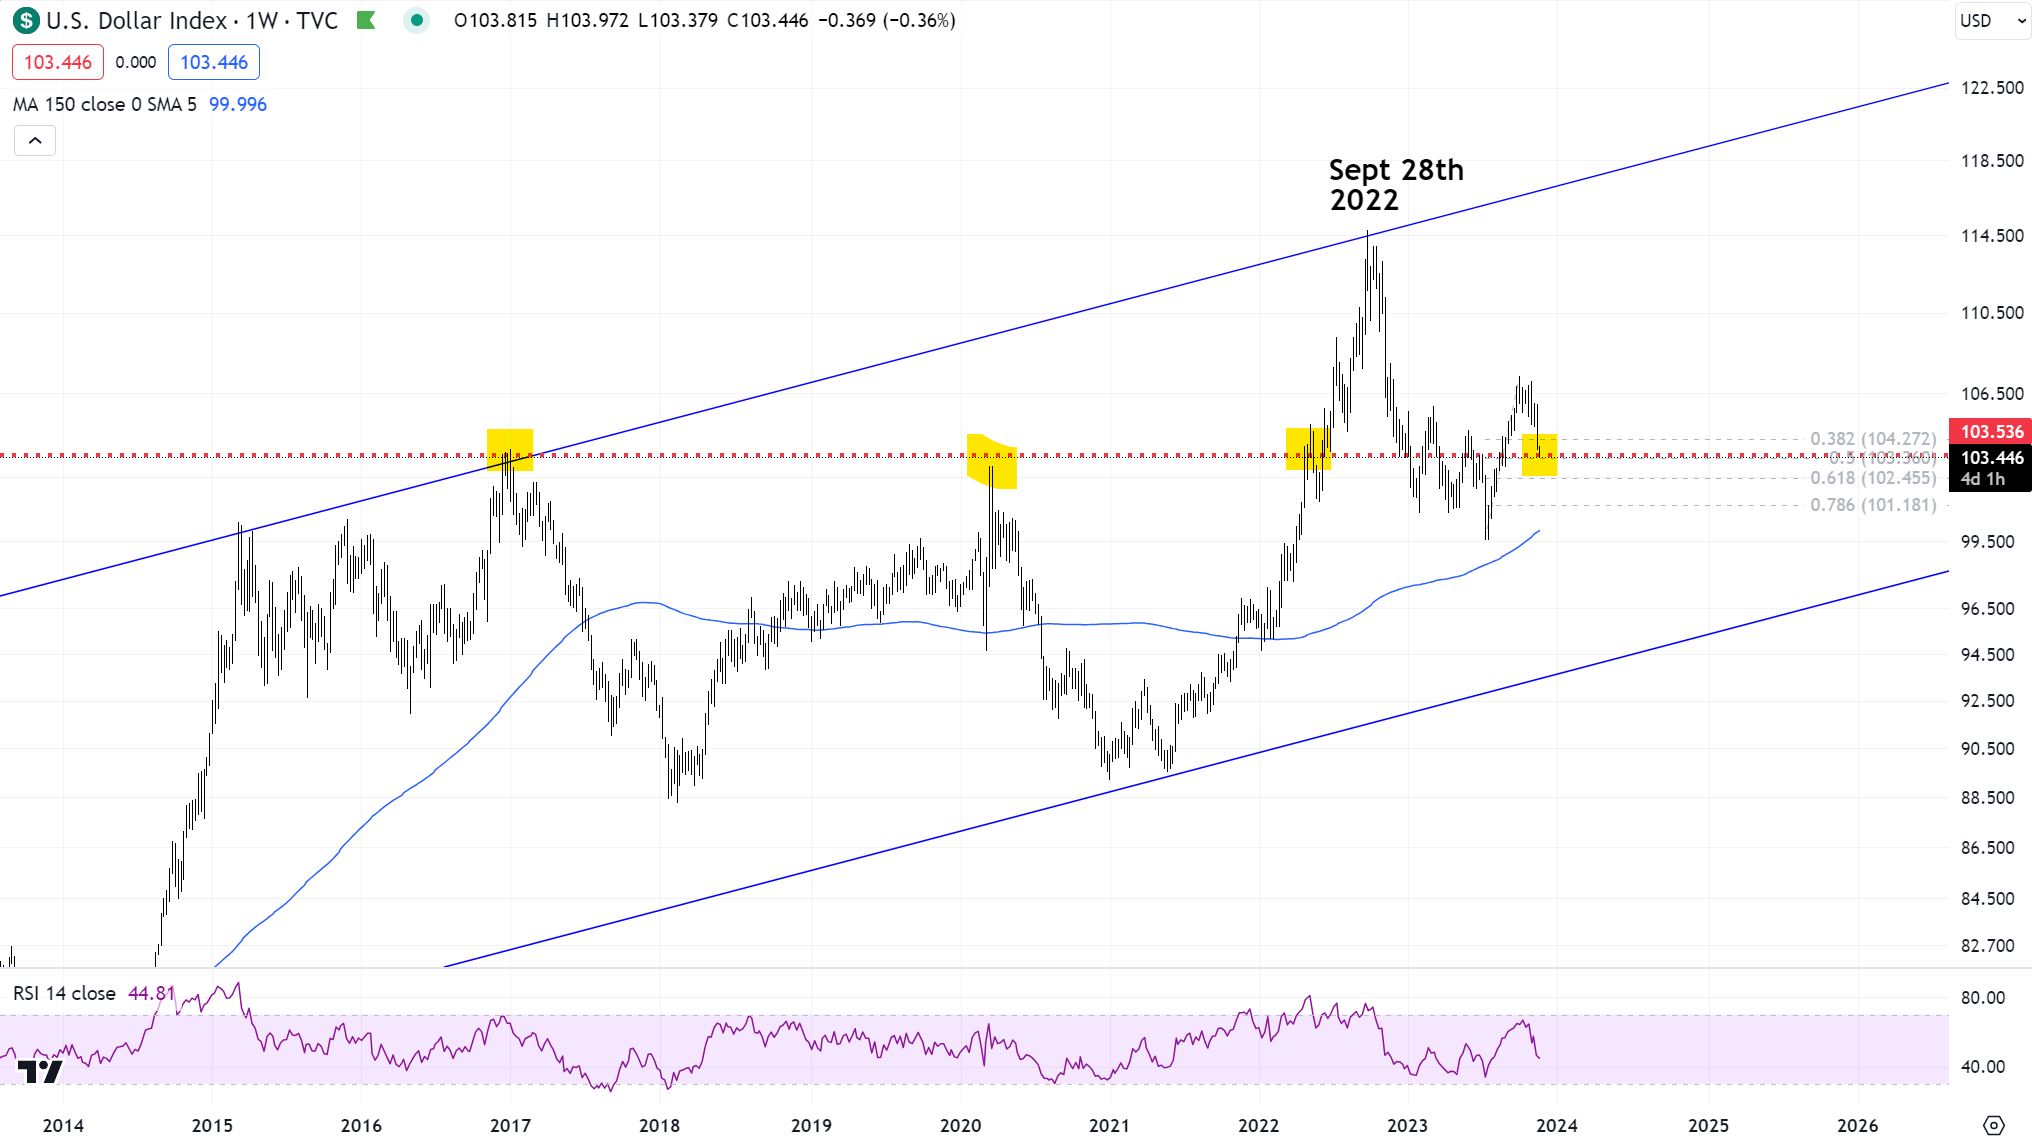
US Dollar and Yields
Ever since the dollar broke that trendline, with little consolidation delay, it was a roll over. We are trading at 103.50 and are just at the 150-day MA. It’s also a pretty major horizontal level for the greenback so I would be cautious down here.
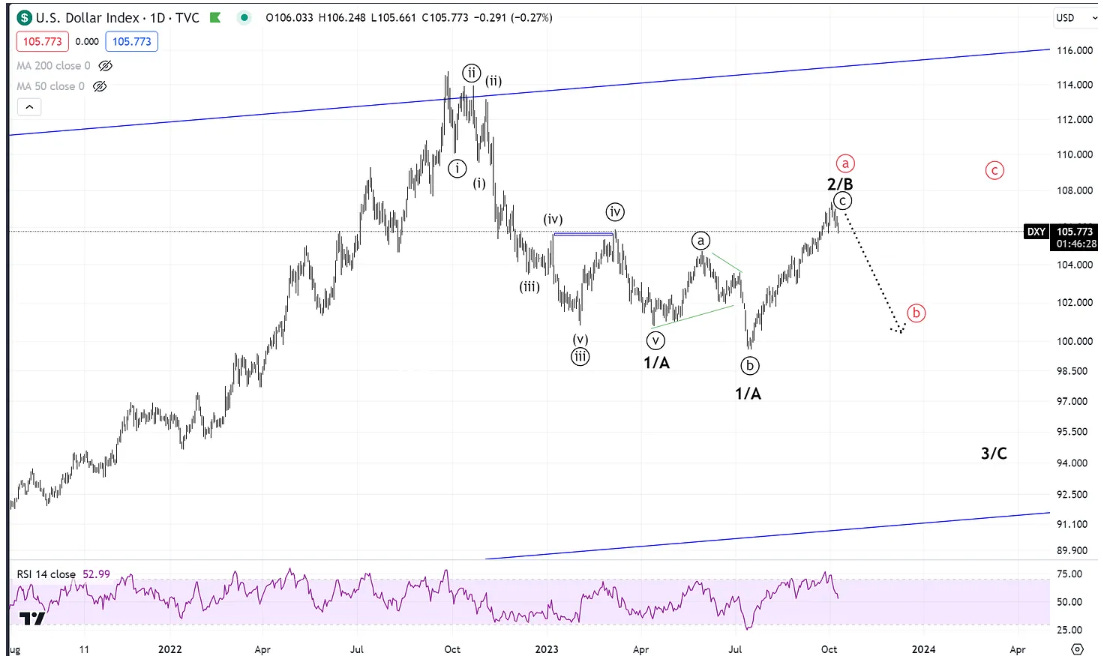
Here the EW variation count that we have been tracking .
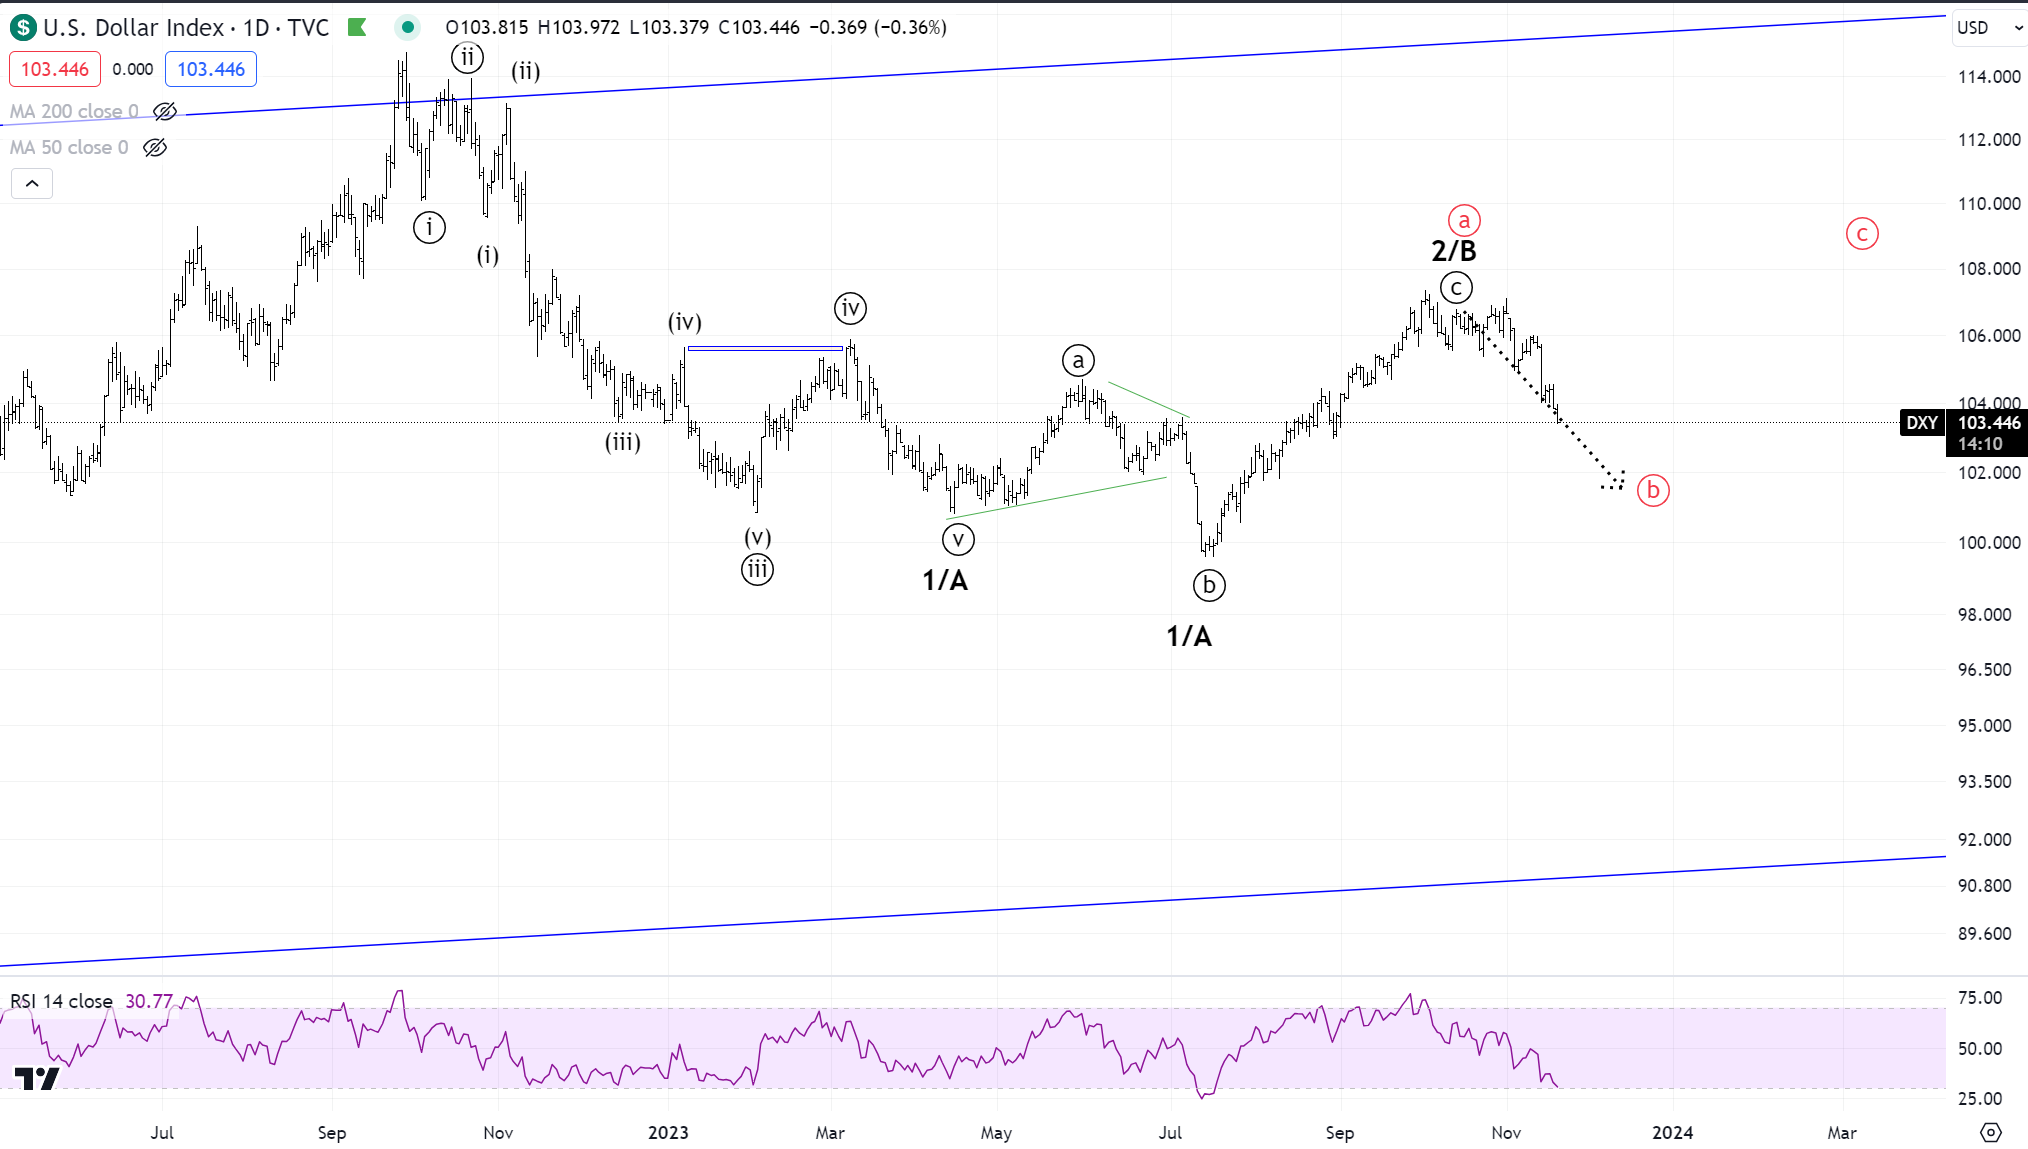
Looking for 10Y yields to start finding support near 4.35 zone followed by a 3 wave setback.
Gold
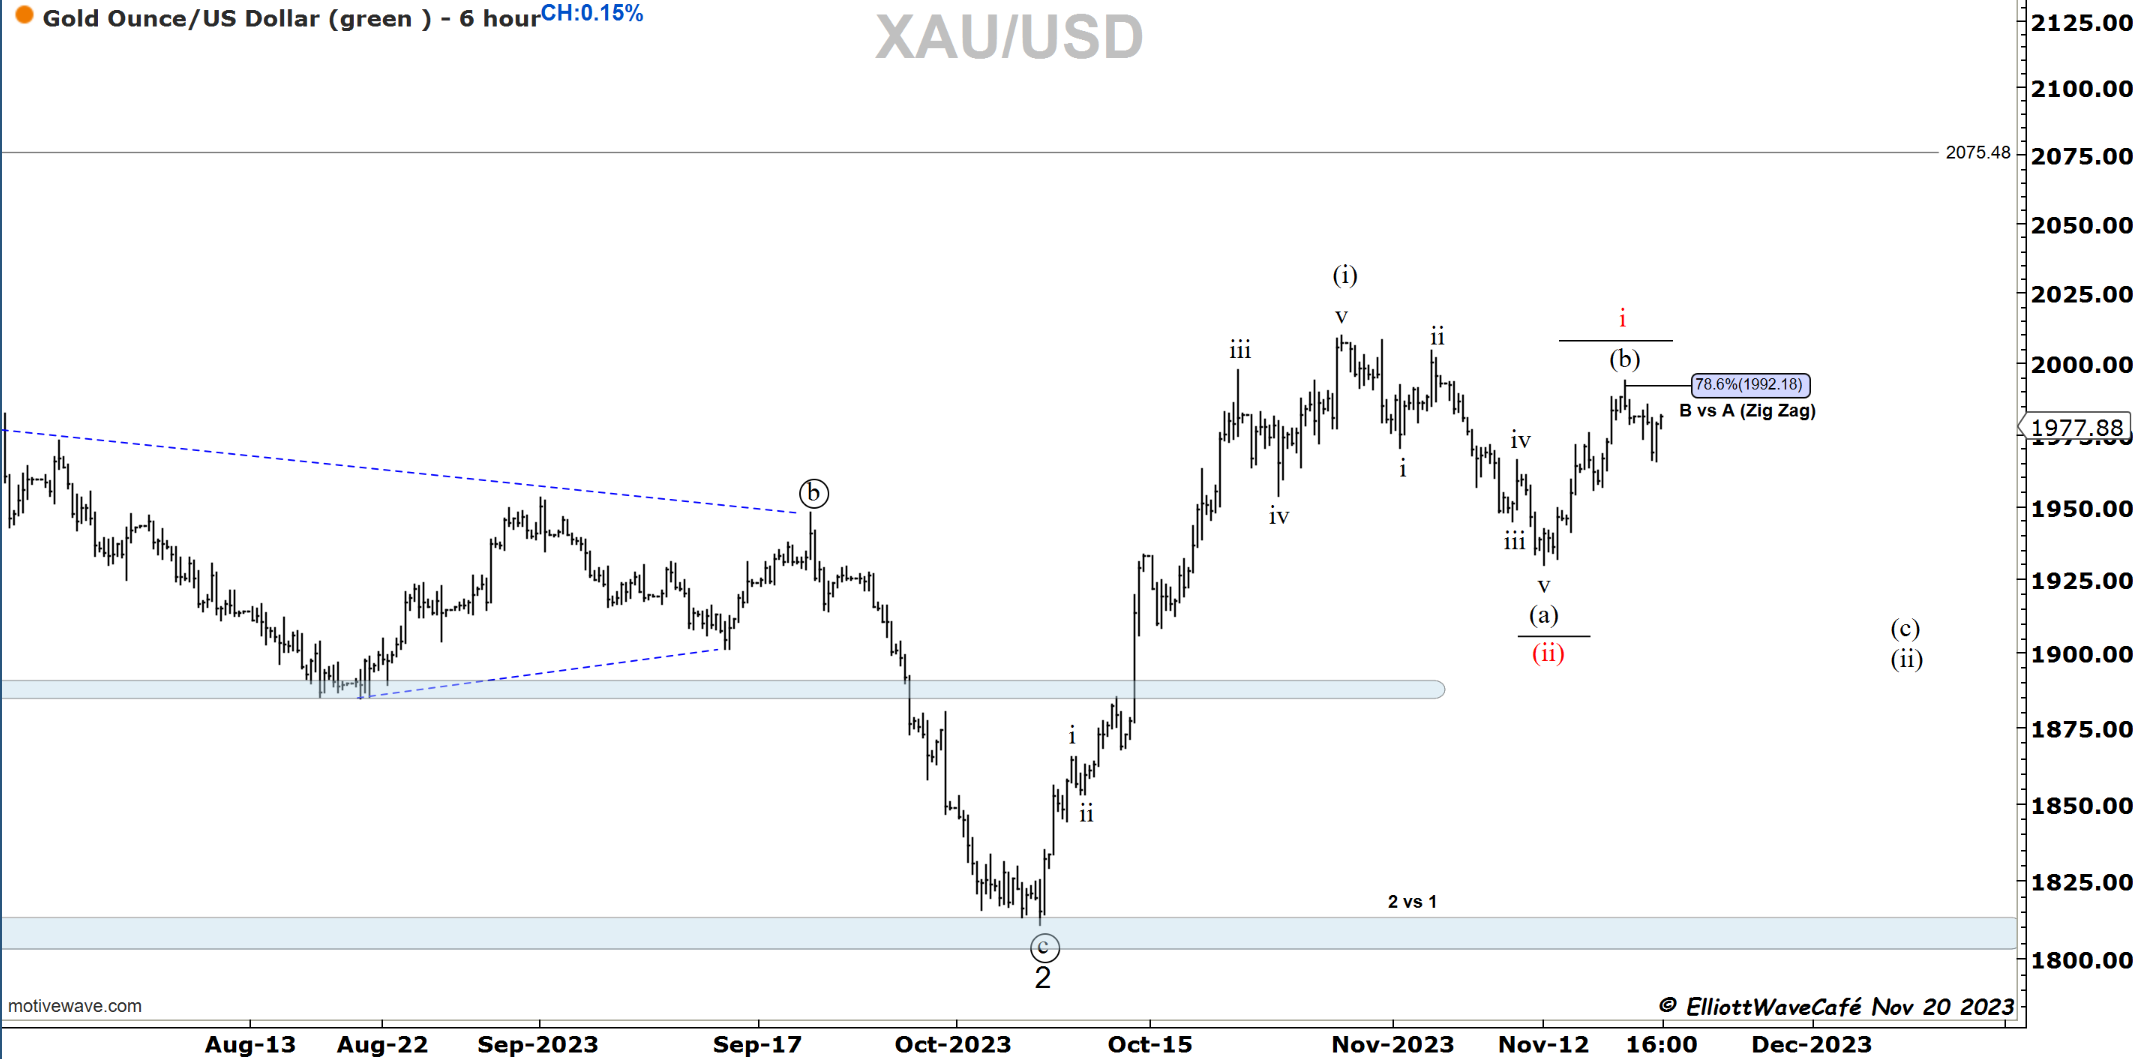
Gold sold off a bit from that 78.6 zone but was not impulsive enough to give confidence for a continuation in wave (c ). If wave (ii) was already complete, then we’re looking at the current rally as wave i and pullback as ii. A break above 2000 will raise those odds. With the dollar at support levels, I want to be cautious about betting too heavily on Gold here.
Bitcoin
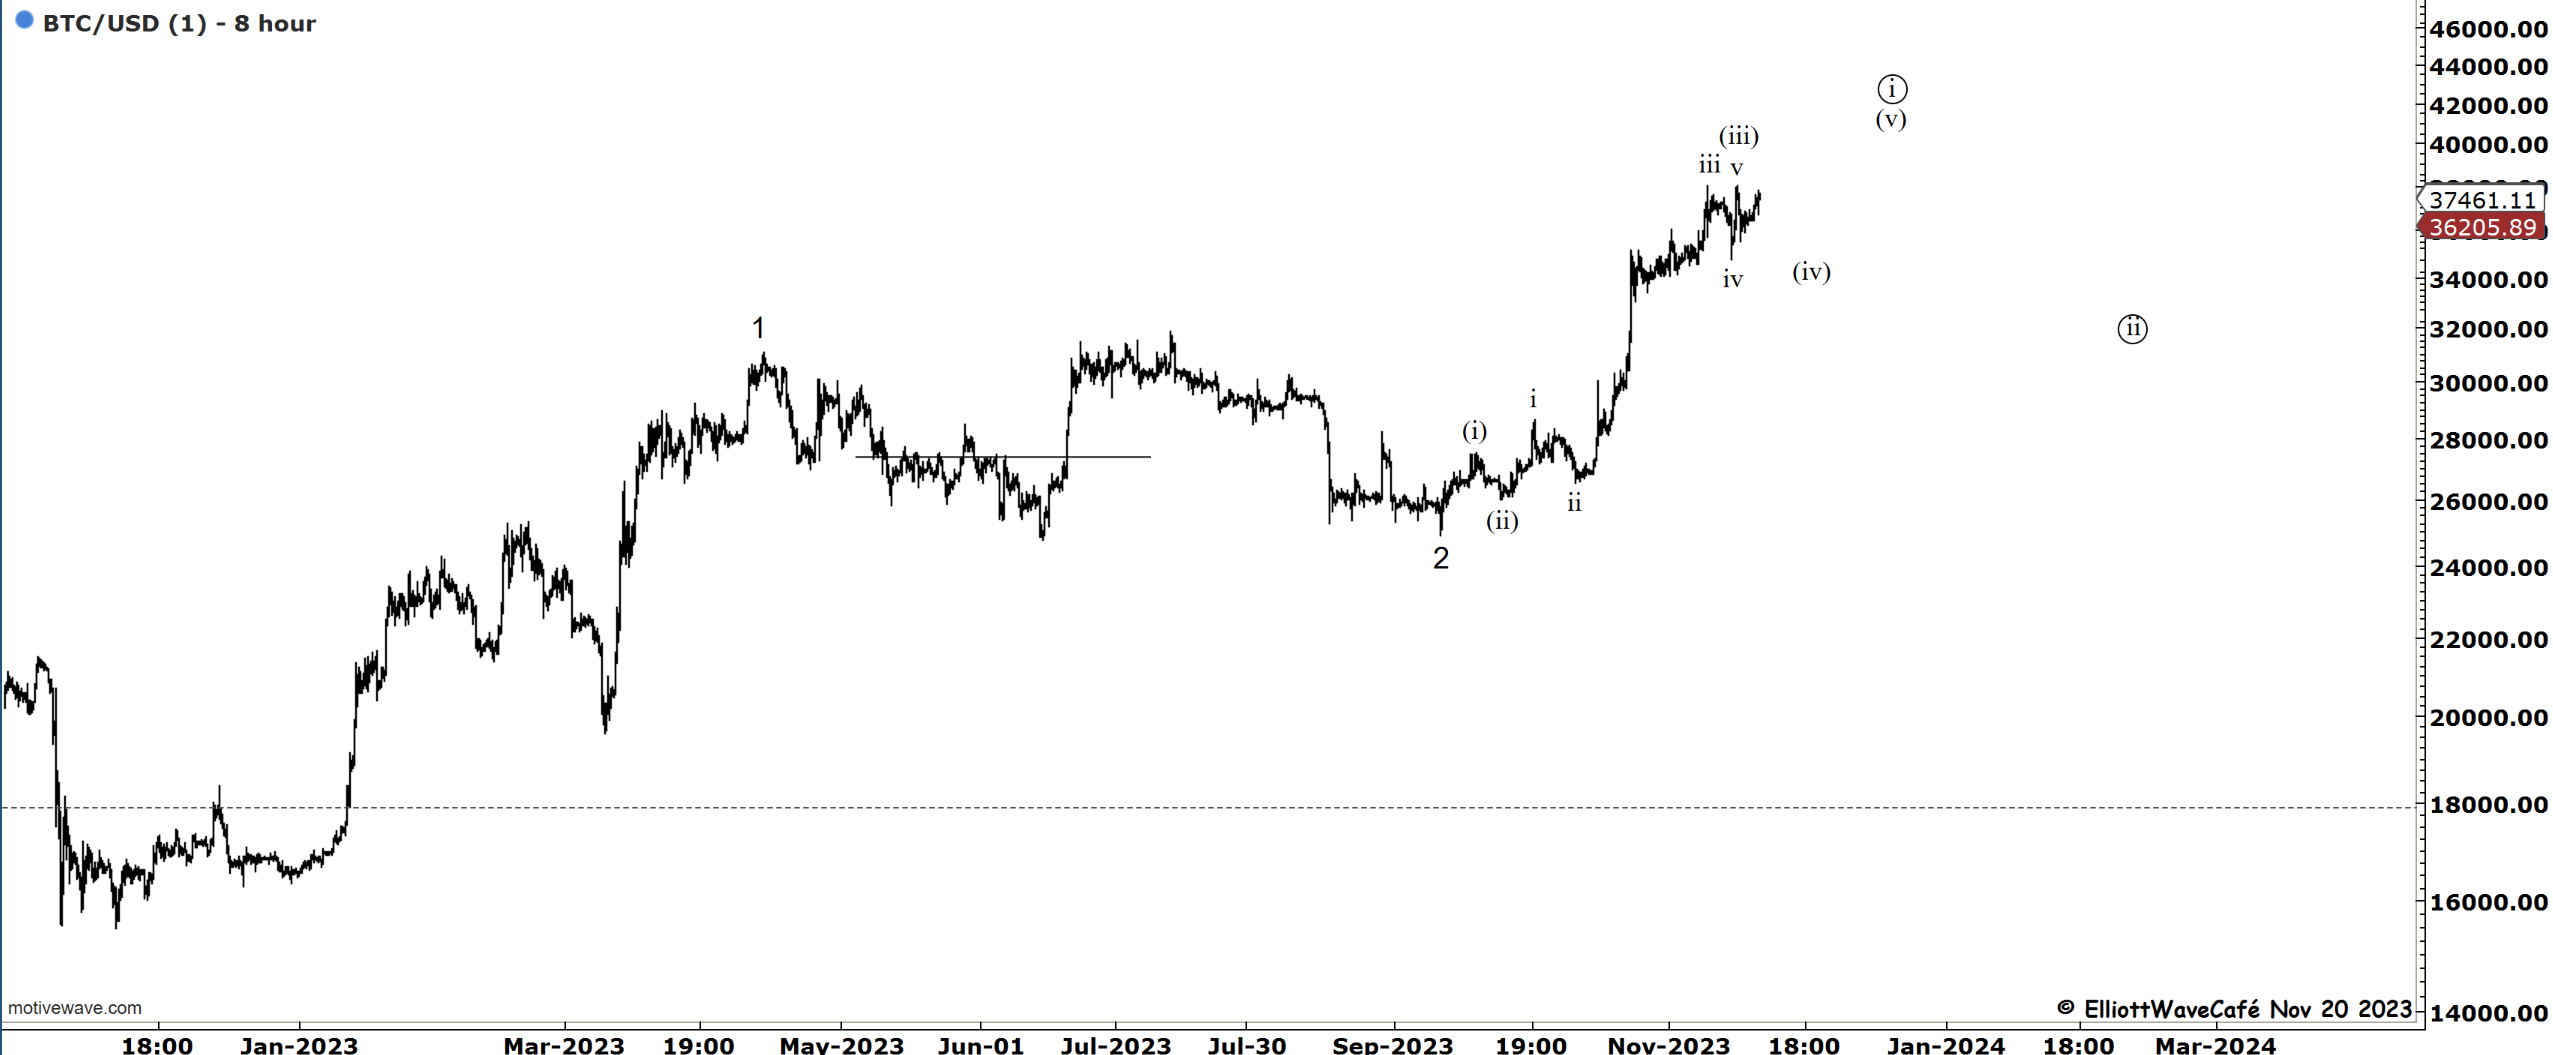
On the Nov 15th edition, I talked about the shorter time frame Btc and how it is still premature for BTC to continue breaking higher without pulling back. We dropped about 2k but managed to gain that back over the weekend. I know we’re trading near the highs, but I am still not convinced that we can have what it takes to break 40k with confidence. If we move towards those levels it will be to complete a wave (v) of a potential wave ((i)). That wave (iv) seems to still be forming.
I will be publishing tomorrow and Wednesday this week.
Daily video coming up next for members,
Have a great day wherever you are! - trade well, and don’t forget to subscribe and drop a like if this letter helps you in any way.
Cris
email: ewcafe@pm.me