
The Daily Drip
Markets review, strategy and analysis
Note: The EW counts on the right edge are real-time, and they are prone to adjustments as price action develops. Elliott Wave has a fluid approach, is evidence-based, and requires constant monitoring of certain thresholds.
In the counts below, this (( )) = circle on chart
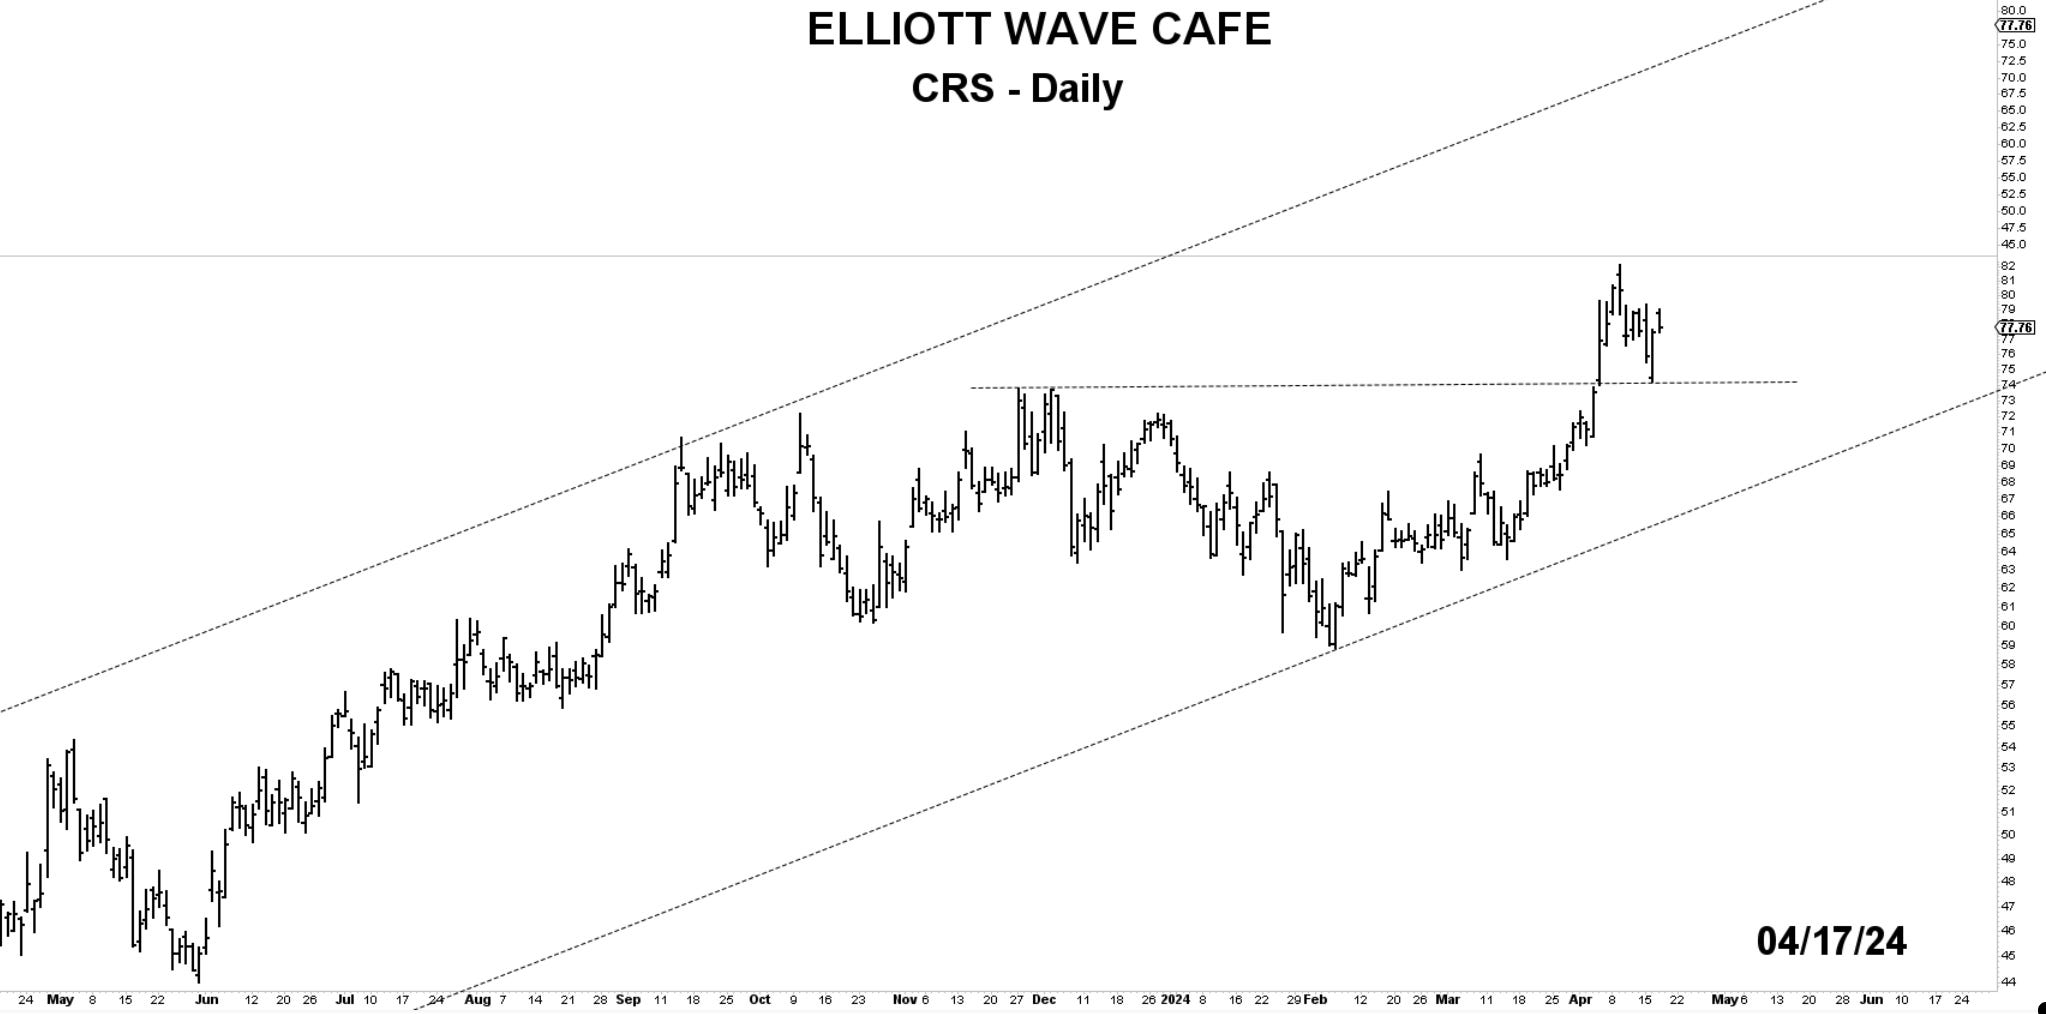
Chart of the Day—CRS—In the Materials/Steel arena and with a market cap of 3.8 billion, this stock has shown great relative strength vs. the SP500. The break of 74 seems significant and should lead to further upside after a corrective decline re-tests the breakout zone. Below that zone, I would cut it and wait for the next setup using EW combined with a technical buildup.
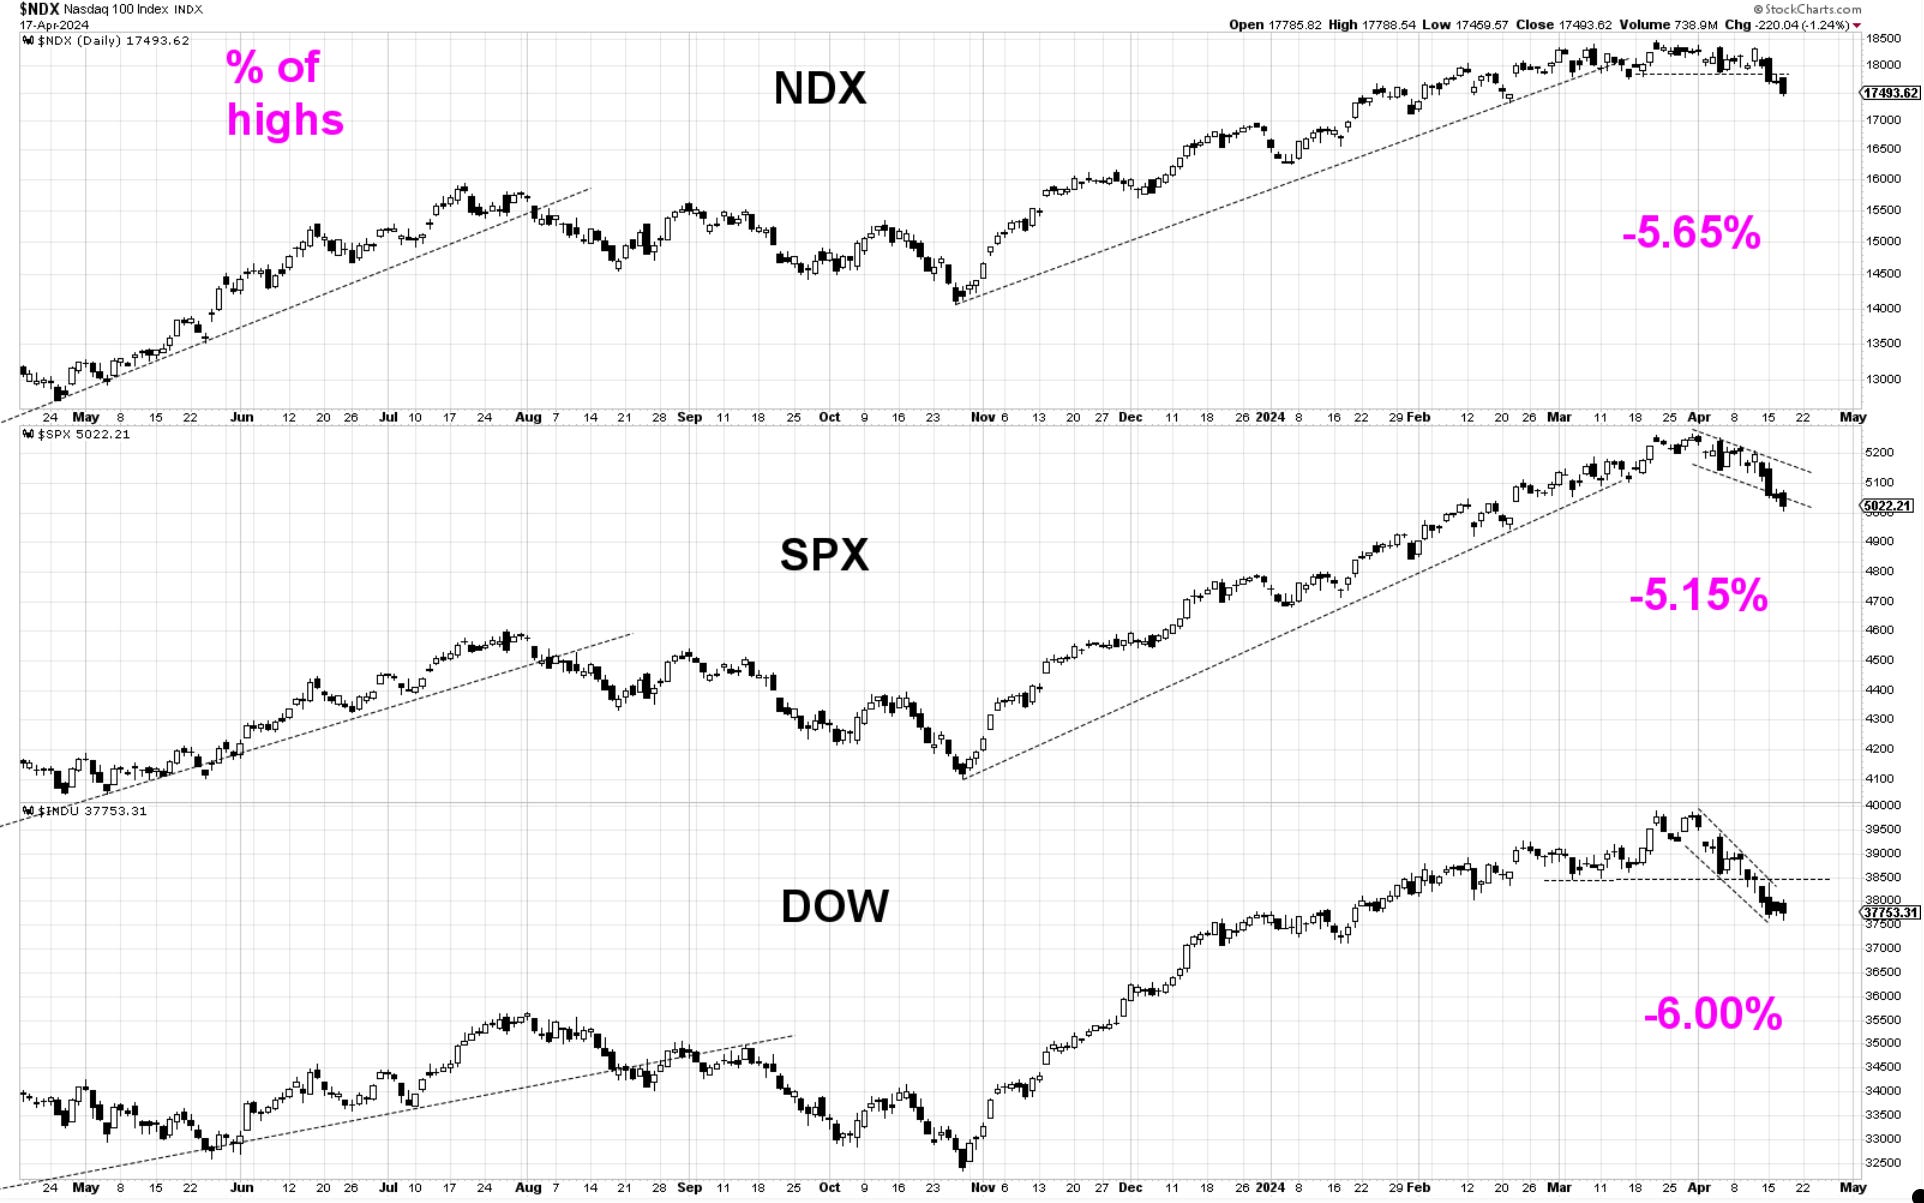
Bottom Line: The corrective decline has continued into today. Those who have reduced their long exposure based on previous warnings are finding this selloff much easier to manage. We are now more than 5% below the highs in the main indices, with no signs of aggressive buying. Of course, those can appear at any moment, but it will not mean that we are out of the woods right away. I go over the signs I am looking for daily in the video updates and written commentary.
Let’s dive into charts and further analysis below…
