
The Daily Drip
Markets review, strategy and analysis
Note: The EW counts on the right edge are real-time, and they are prone to adjustments as price action develops. Elliott Wave has a fluid approach, is evidence-based, and requires constant monitoring of certain thresholds.
In the counts below, this (( )) = circle on chart
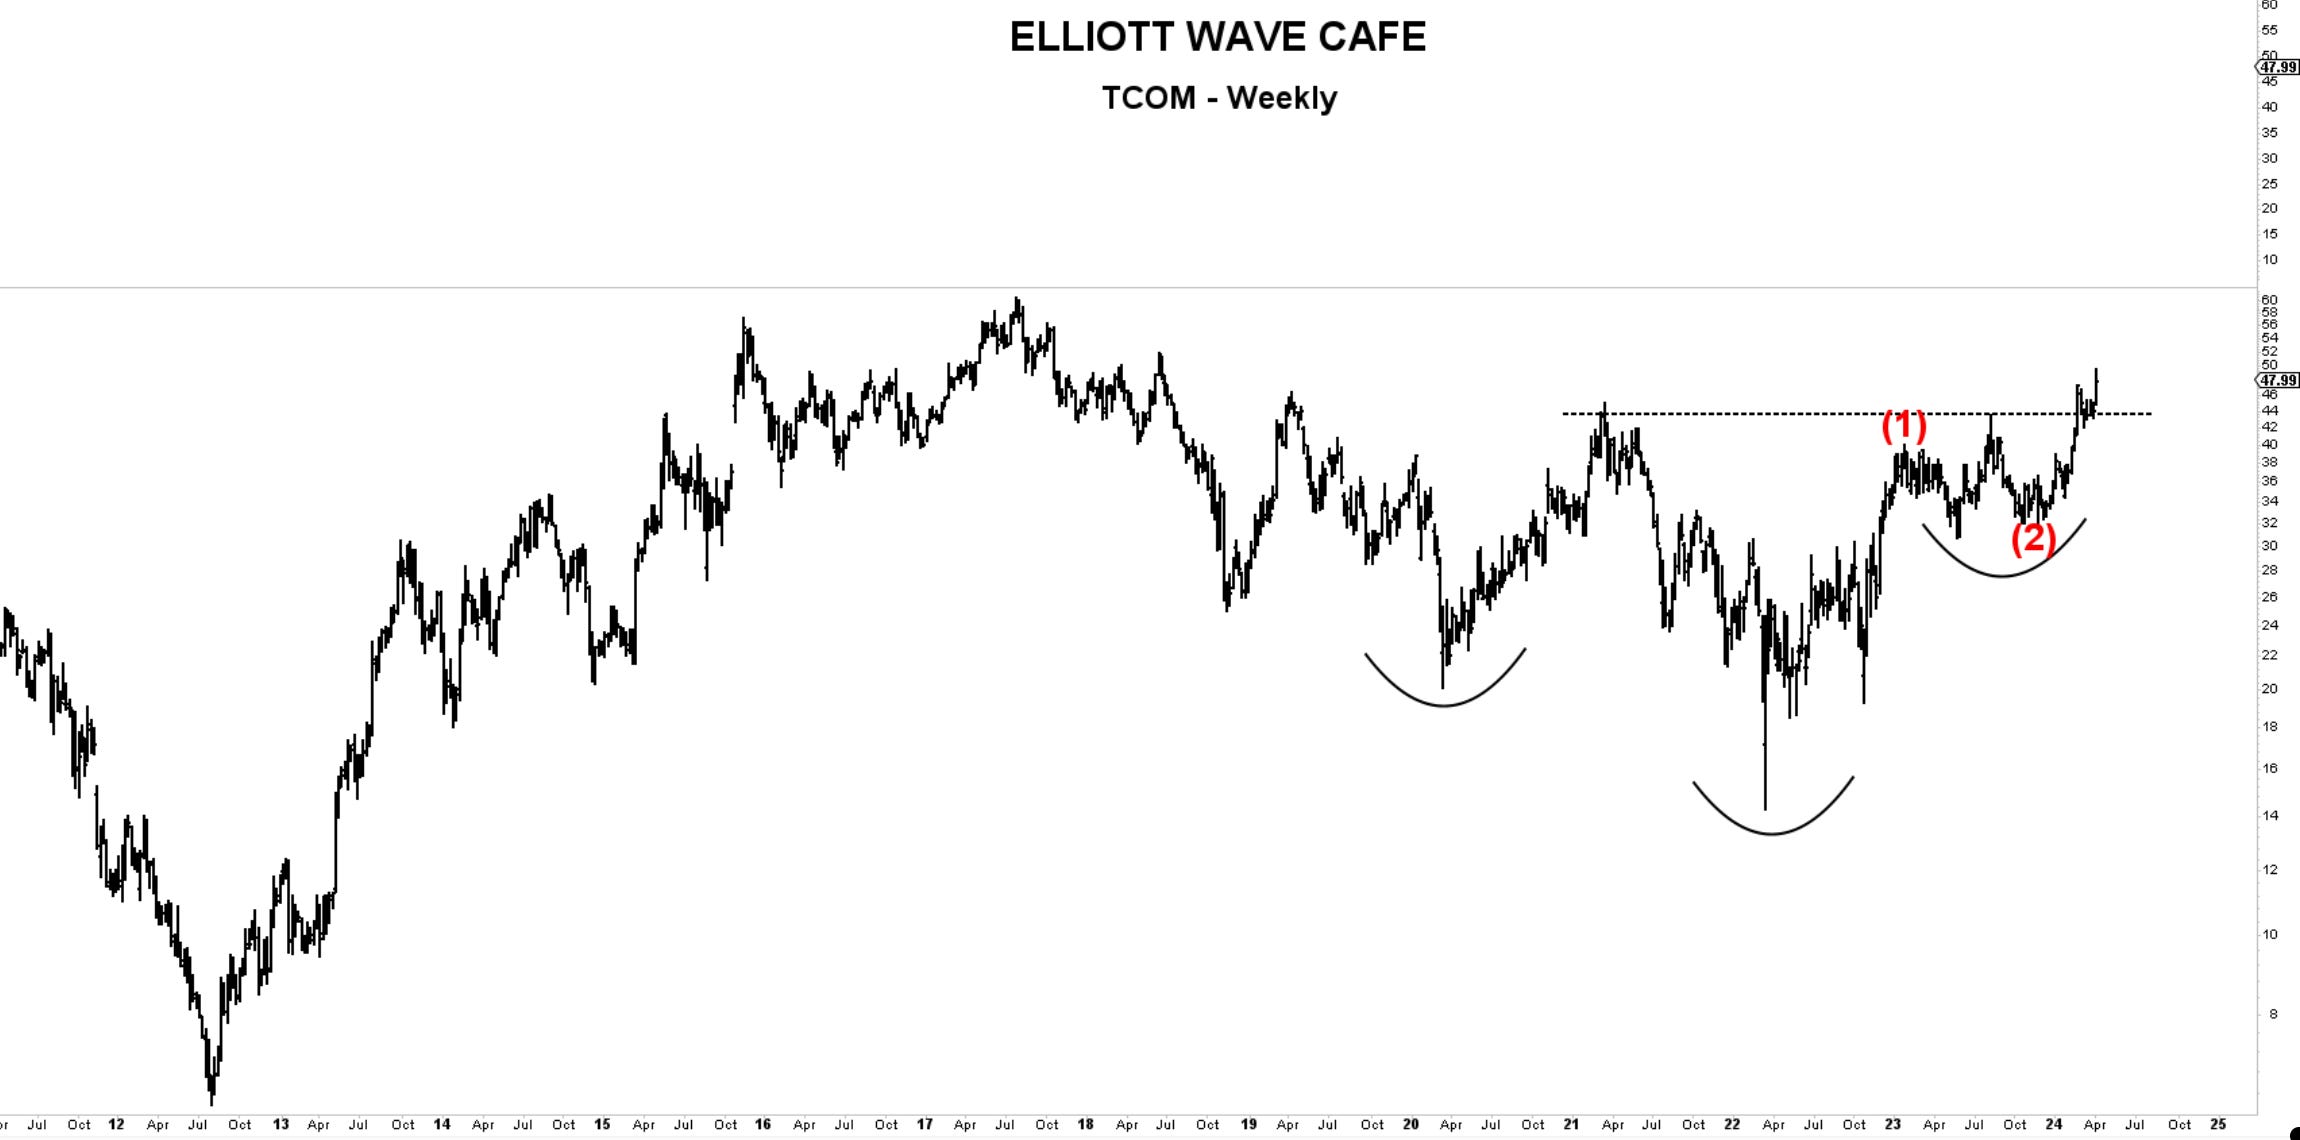
Chart of the Day—TCOM—This stock has a bullish reversal and a nice break of a key resistance level. It has made an impulsive move from the Oct 2023 lows. My take is LONG above 39.
Yesterday, I reviewed the 11 sectors that make up the SP500 and discussed their trends and trade levels.
The markets pulled a selloff today, so I will examine the chart structures to see if anything major changed.
In today’s video, I will discuss some stocks with good setups that can open the prospects of a third-wave rally.
Let's dive into the charts below …
