
The Daily Drip
Core markets charts updates and commentary
Note: The counts on the right edge are real-time, and they are prone to adjustments as price action develops. Elliott Wave has a fluid approach, is evidence-based, and requires constant monitoring of certain thresholds.
In the counts below, this (( )) = circle on chart
SP500
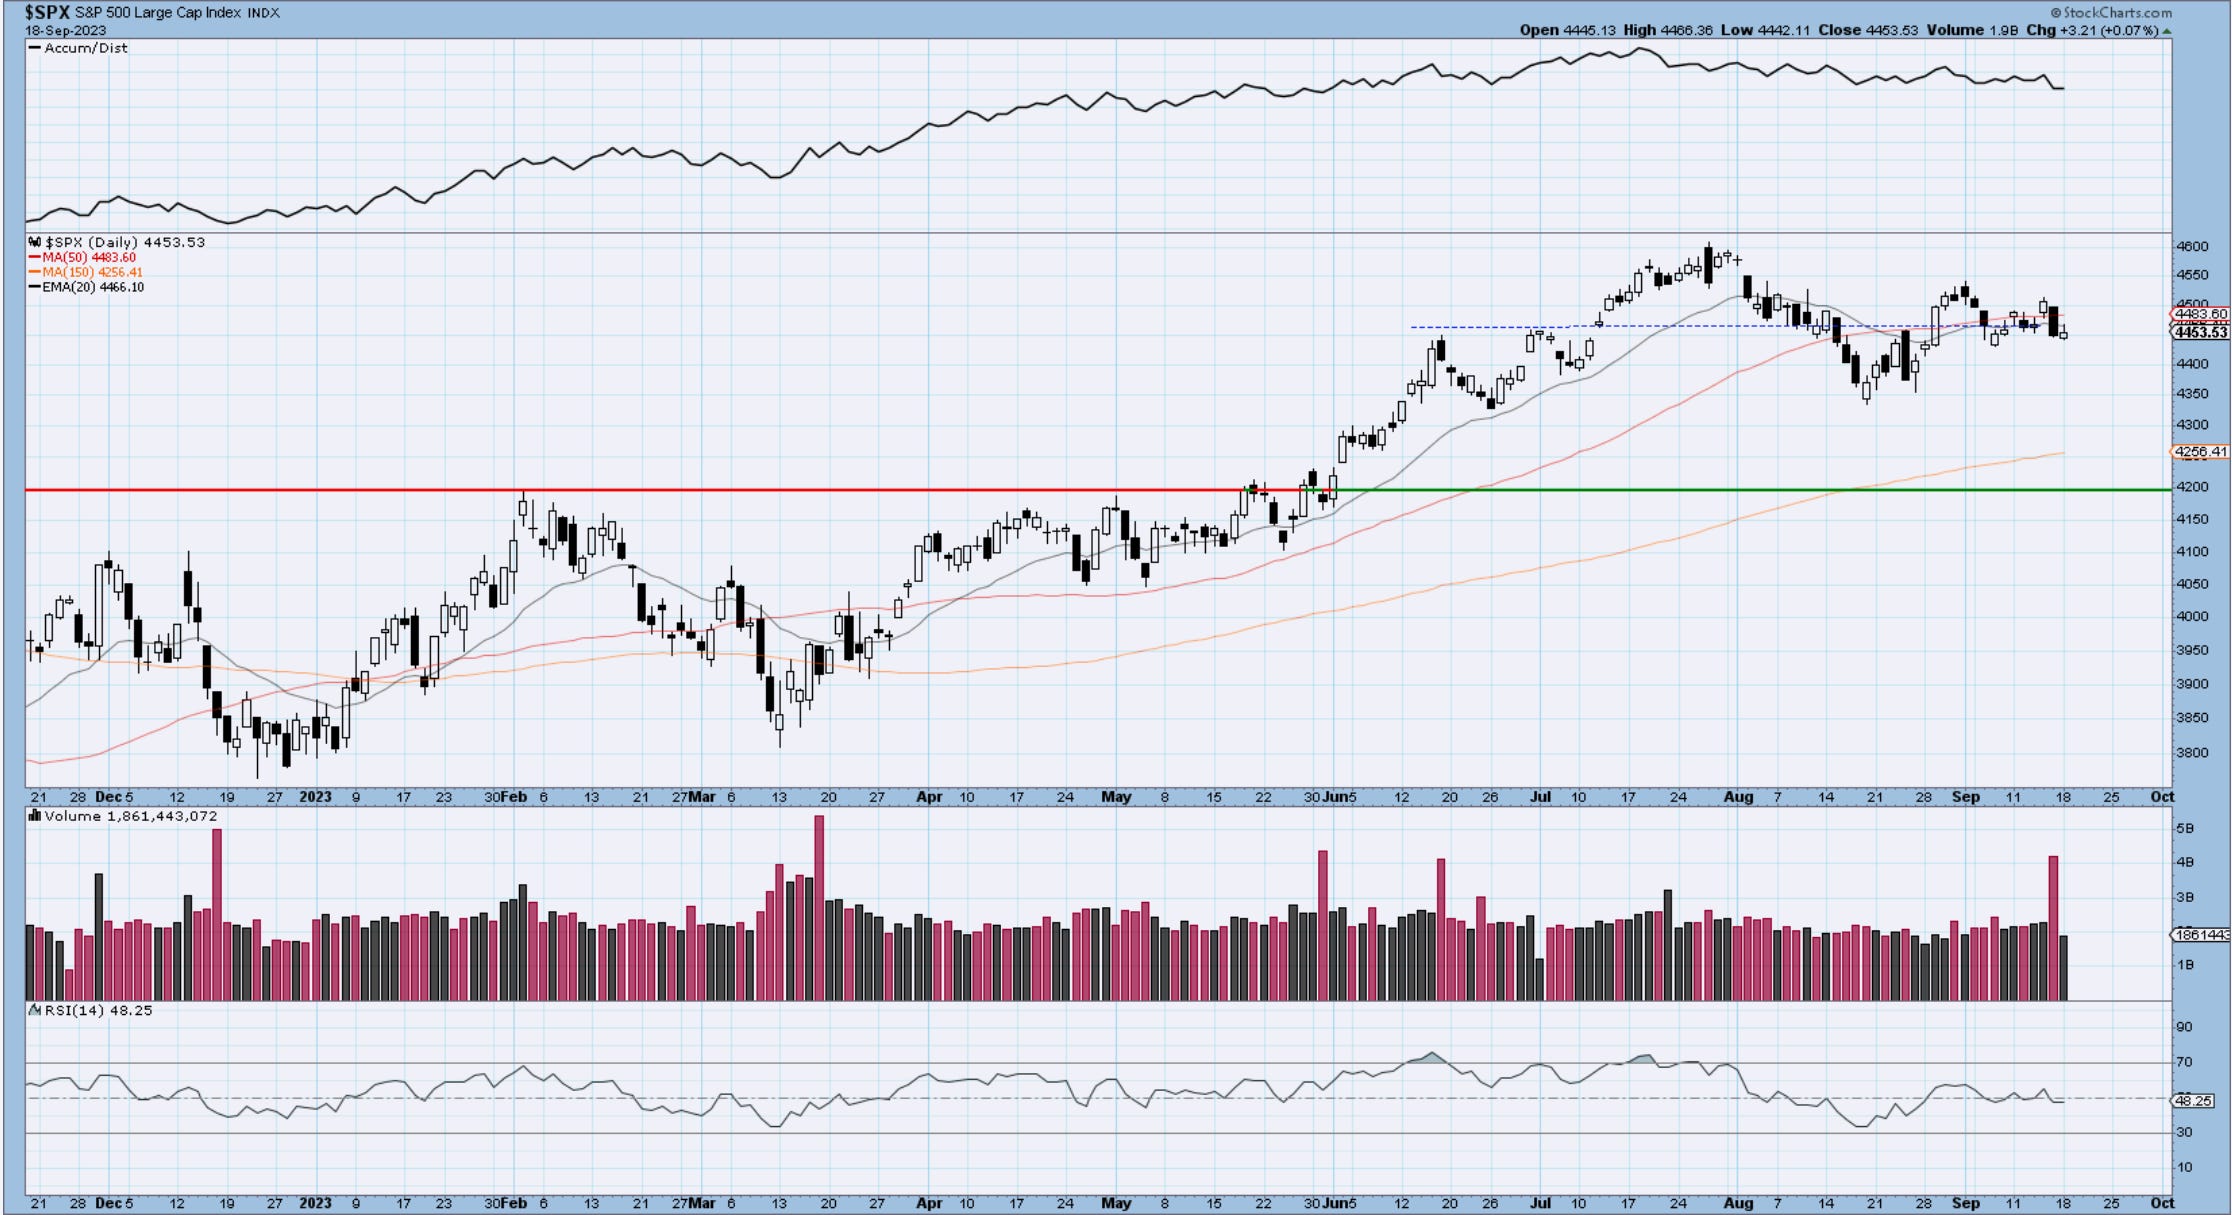
The index remains glued near the key fighting zone of 4450. The blue corrective box mentioned in the last update resolved higher first, followed by the current drop as most likely part of wave c decline. It looks more and more as a developing triangle or a complex correction. Friday’s action brought a lot of volume, but that’s always the case with large option expirations. We continue to monitor Wave a low and Wave b top for further directional clues. The daily chart bring nothing worth mentioning, other then a trendless market with flat moving averages. Being above the 150day MA keeps the bullish outlook intact.
Nasdaq100
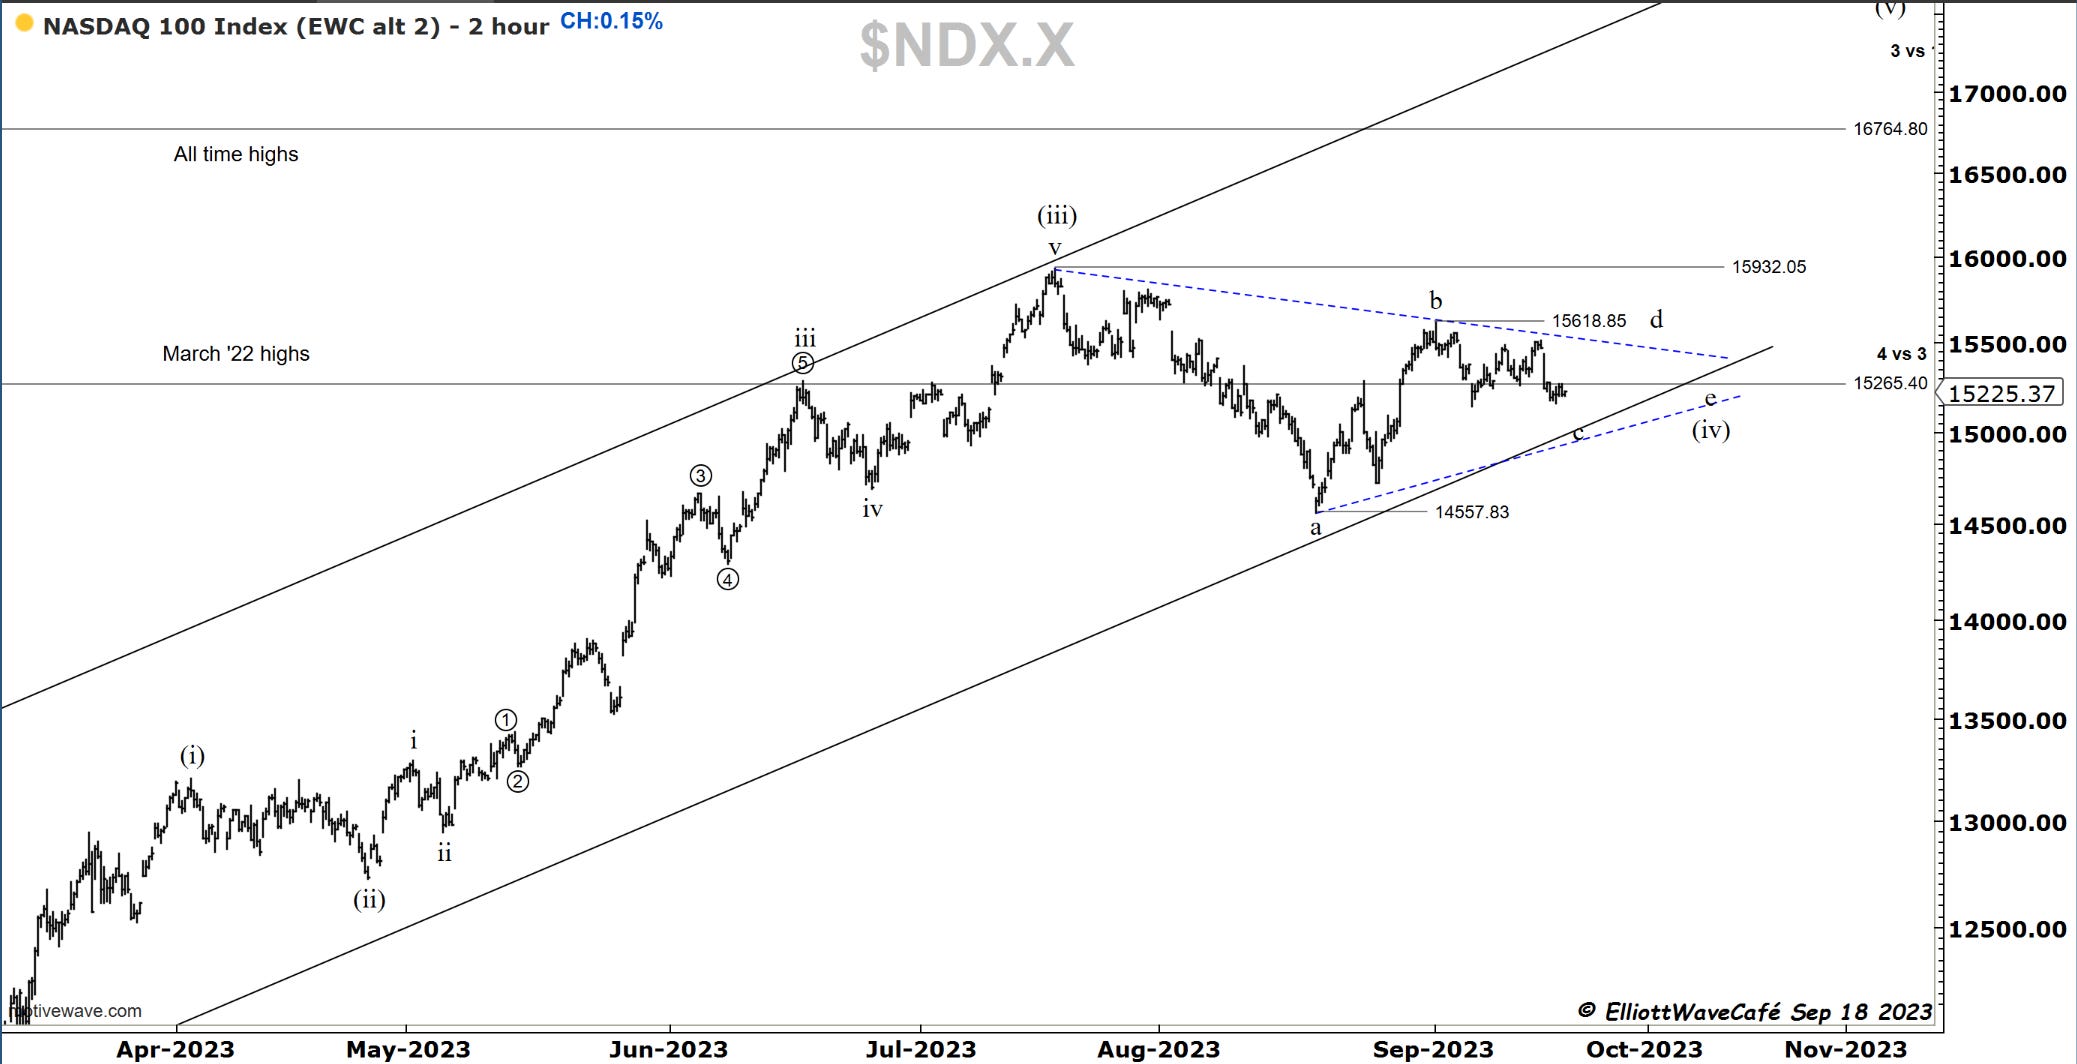
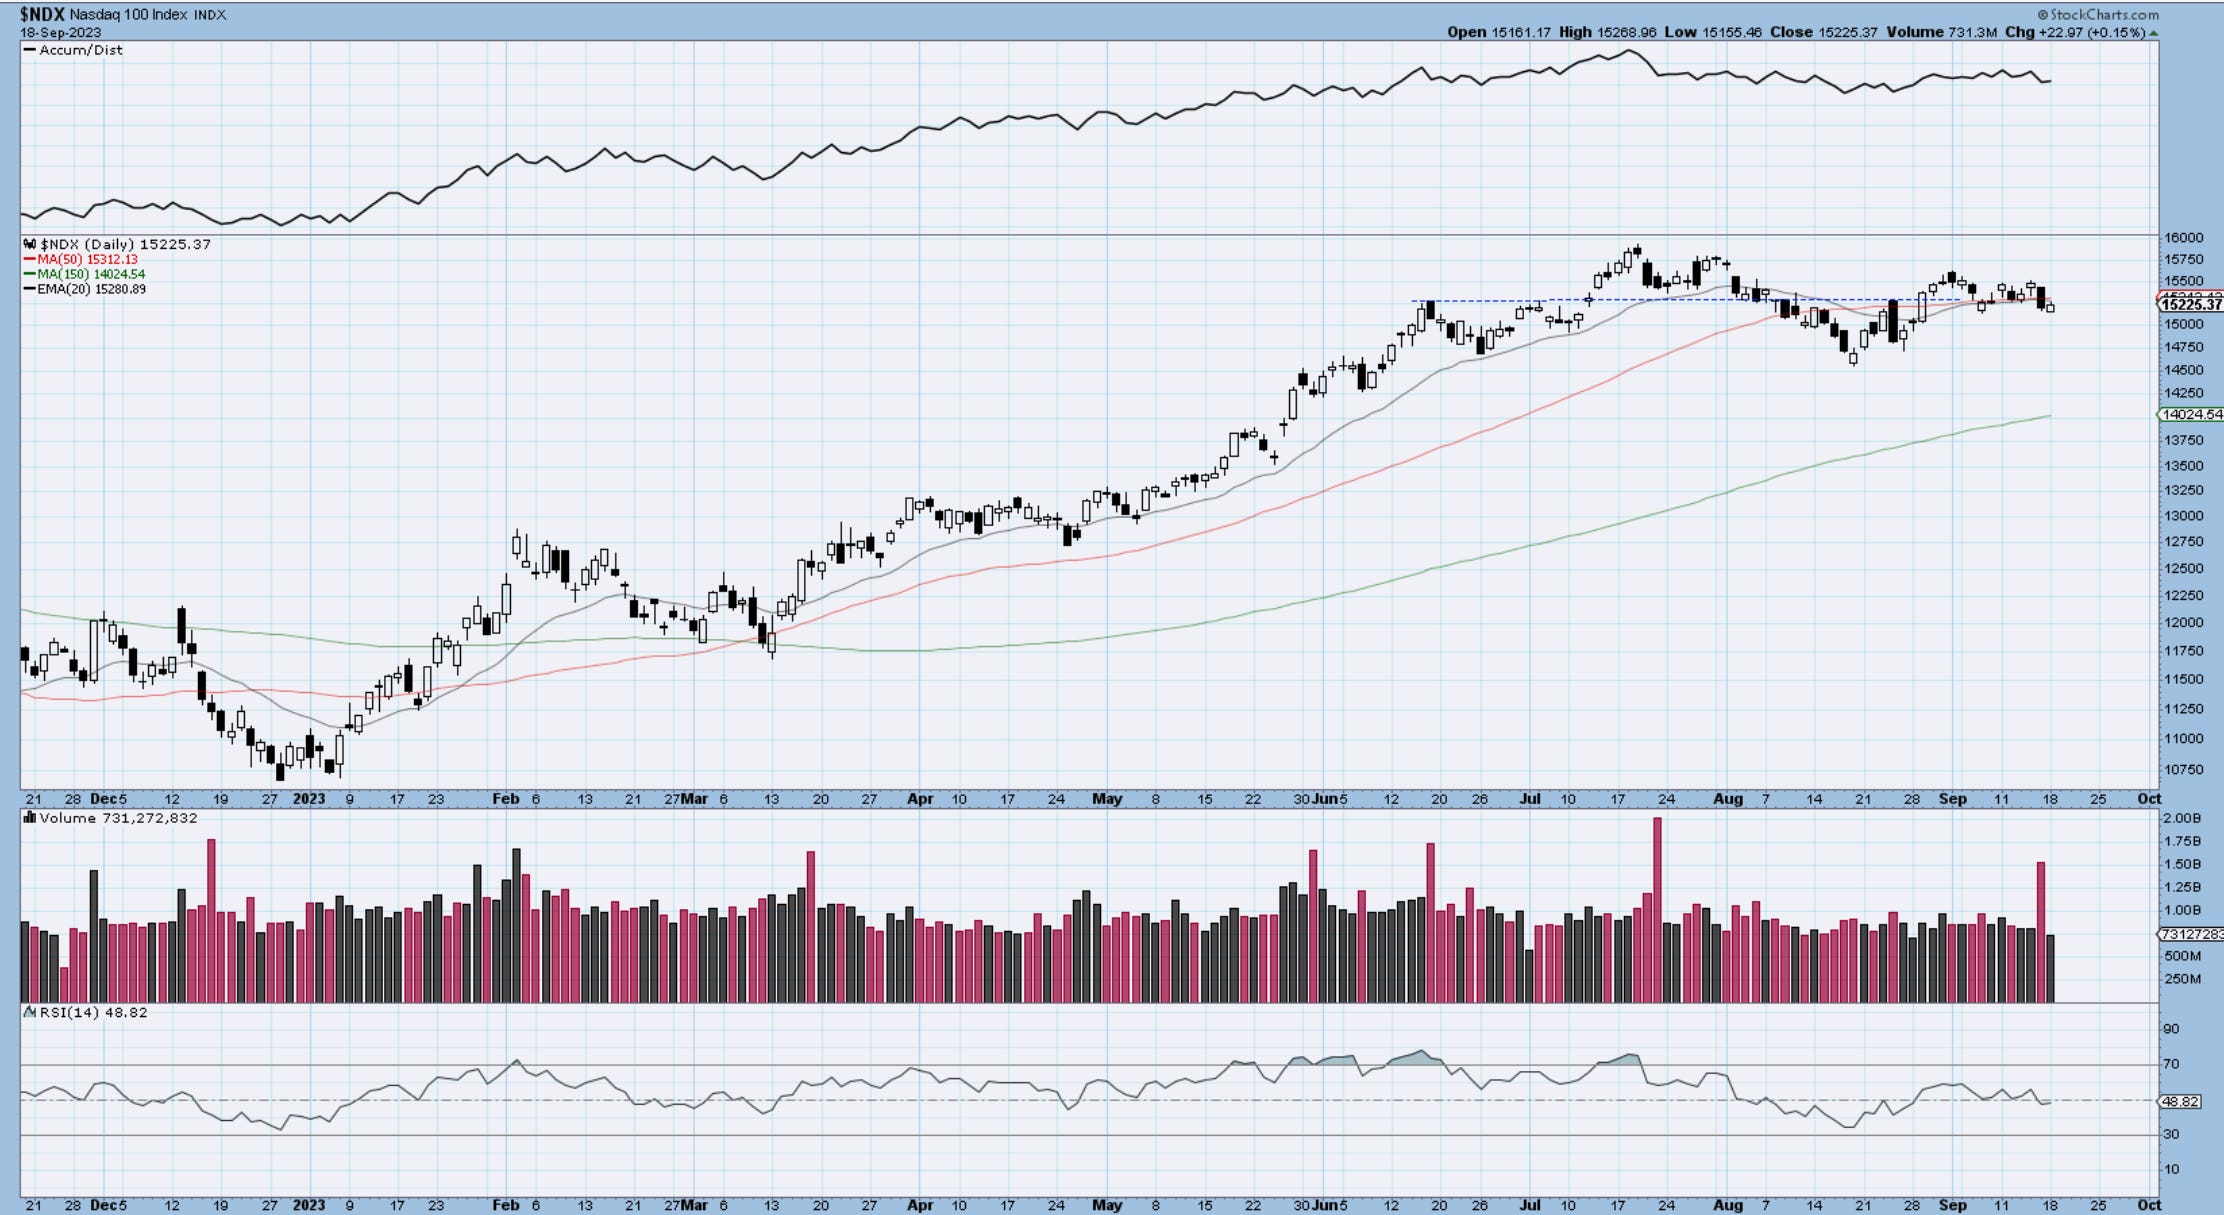
Nasdaq was just a touch stronger today but overall is displaying the same price action as the spiders. If you squint you will notice that we have closed below support but we have done that on Sept 7th before jumping back above. Will patiently await a resolution here with either above 15,618 or below 14,557. We can look at different options once any of those levels get challenged.
Dow30
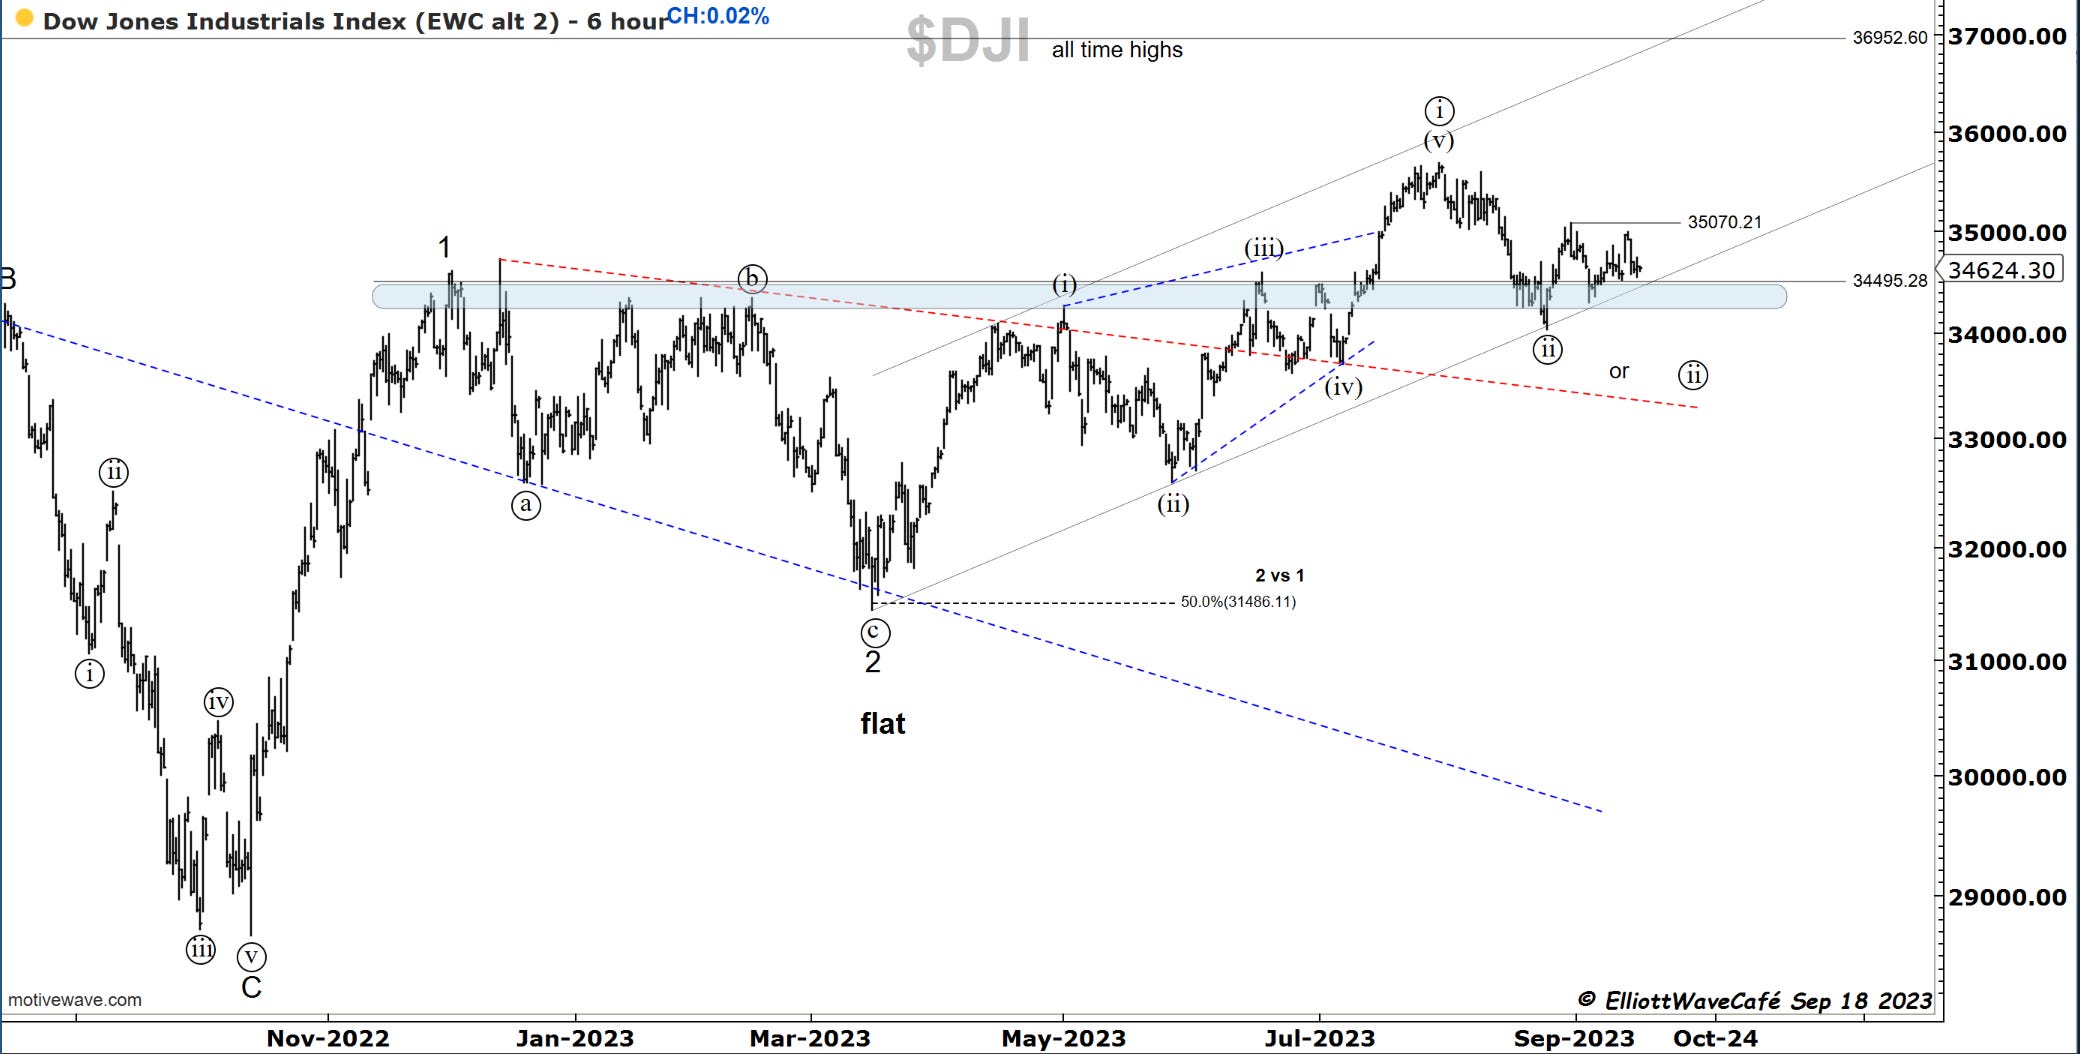
Dow Jones is cool as a cucumber just above the large S/R line. The bounce last week looked corrective but we have yet to break lower. There are options here too, but will stay with wave ((ii)) idea for now until we get some more clarity. The Fed decision will be announced on Wed, and they are expected to hold tight this time. I would assume some of the lower/upper levels will get tested and wave completions will take place. I maintained long exposure to the Dow in the ETF portfolio, due to it likely holding better in the event of market weakness.
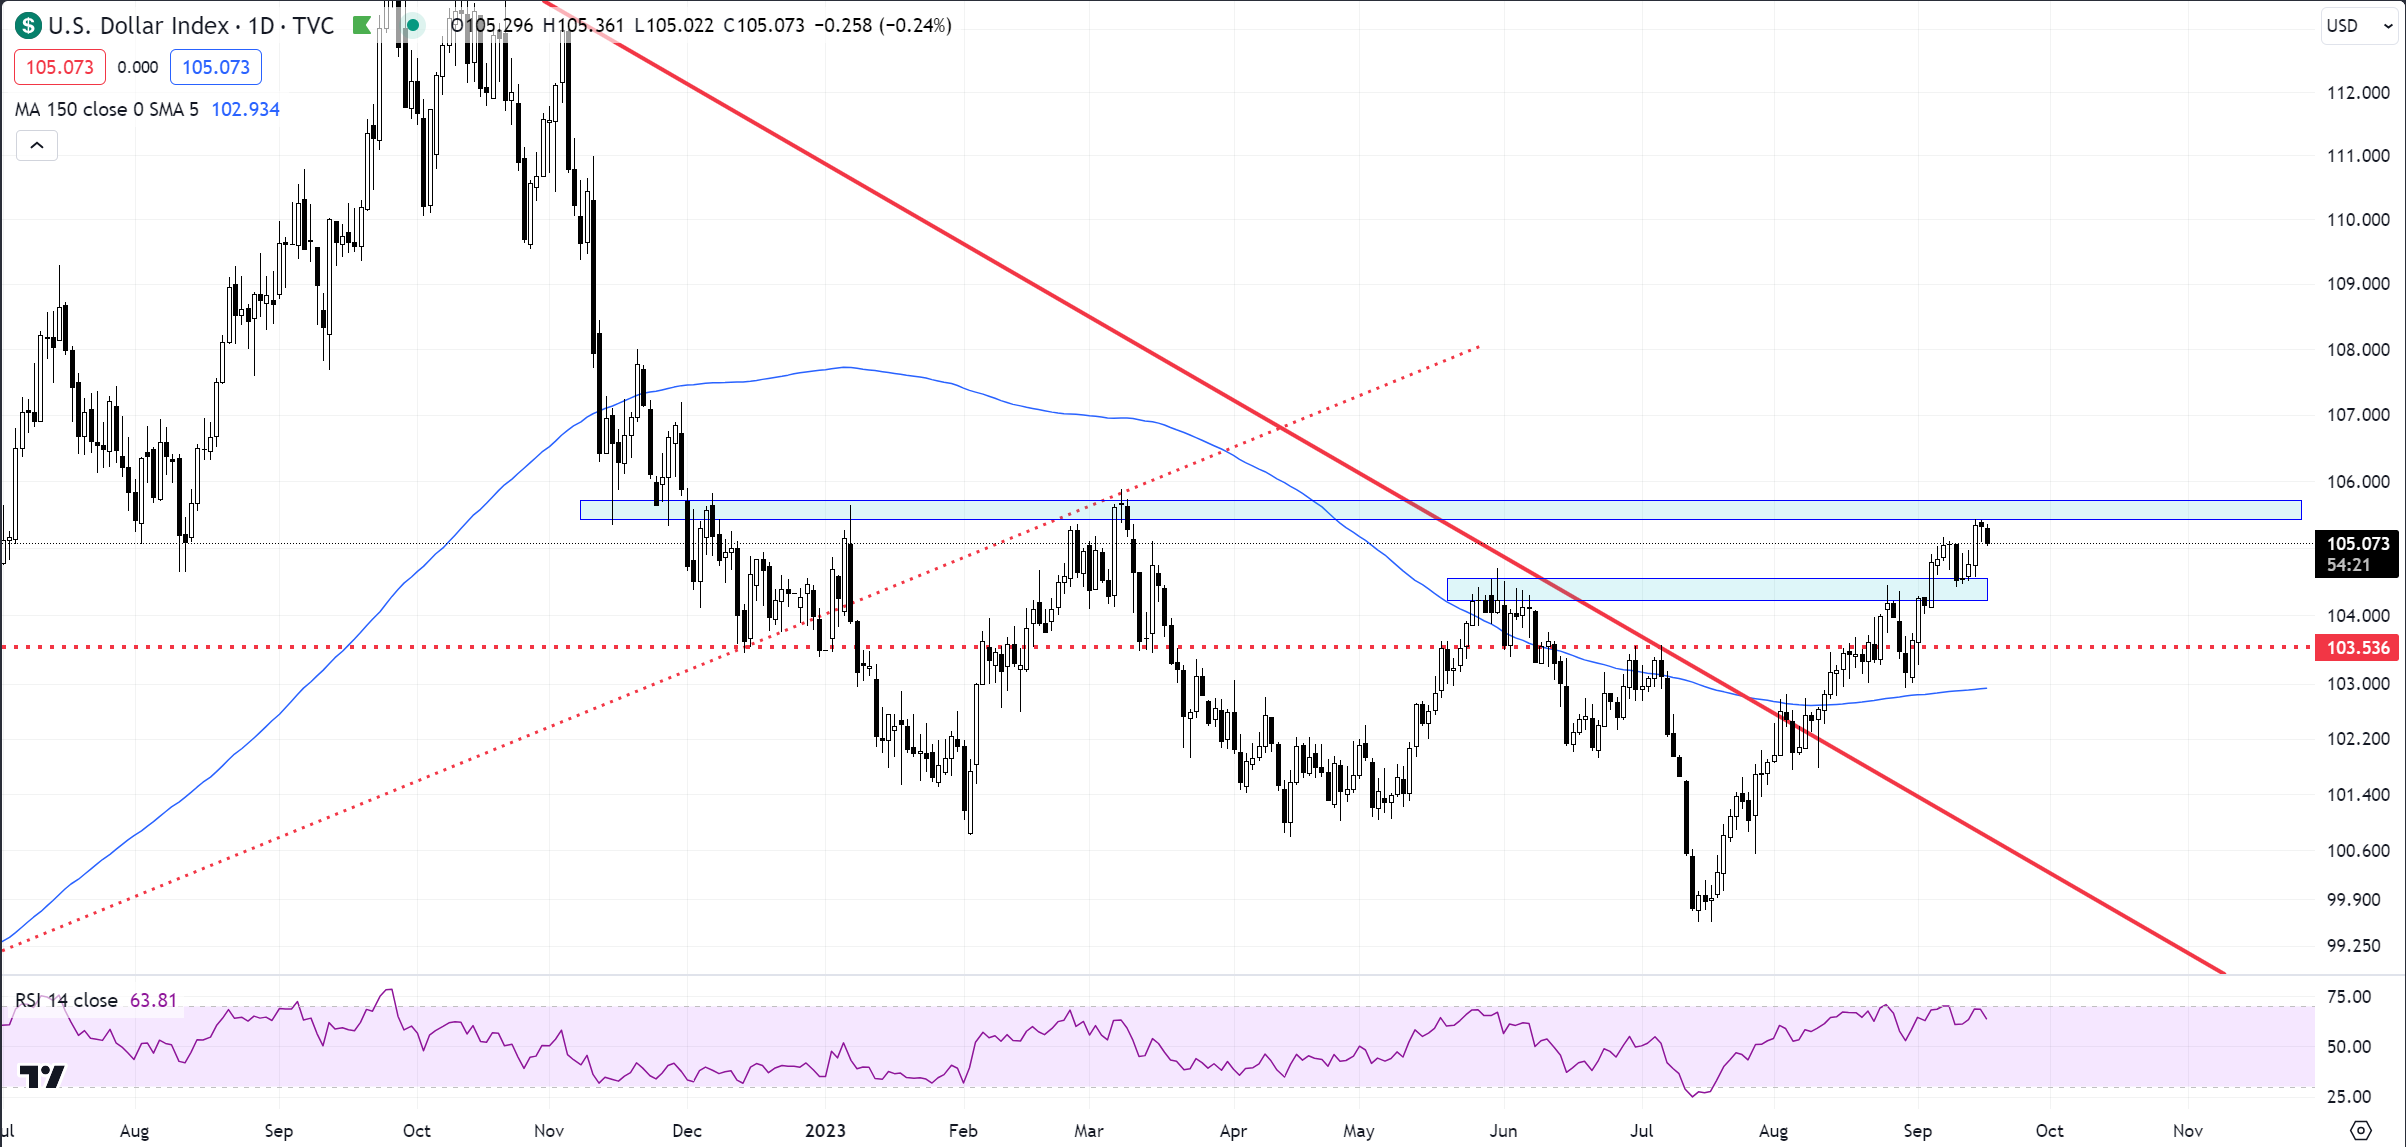
US Dollar
The index finally bounced and touched to near perfection the next upper resistance zone seen in blue. It might be very tough to get through this before actually retreating some of this 9-week advance. Both Gold and Silver have been smelling this zone and actually jumped in anticipation. I would not be surprised to see them hold even under a dollar sell-off next. The question is, what will equities do with this information? Of course, the surprise would be a break and large move higher in the dollar, which can be triggered by hawkish fed comments at any time. However, the chart says that you want to be selling, trimming, or not buying dollars at the current juncture.
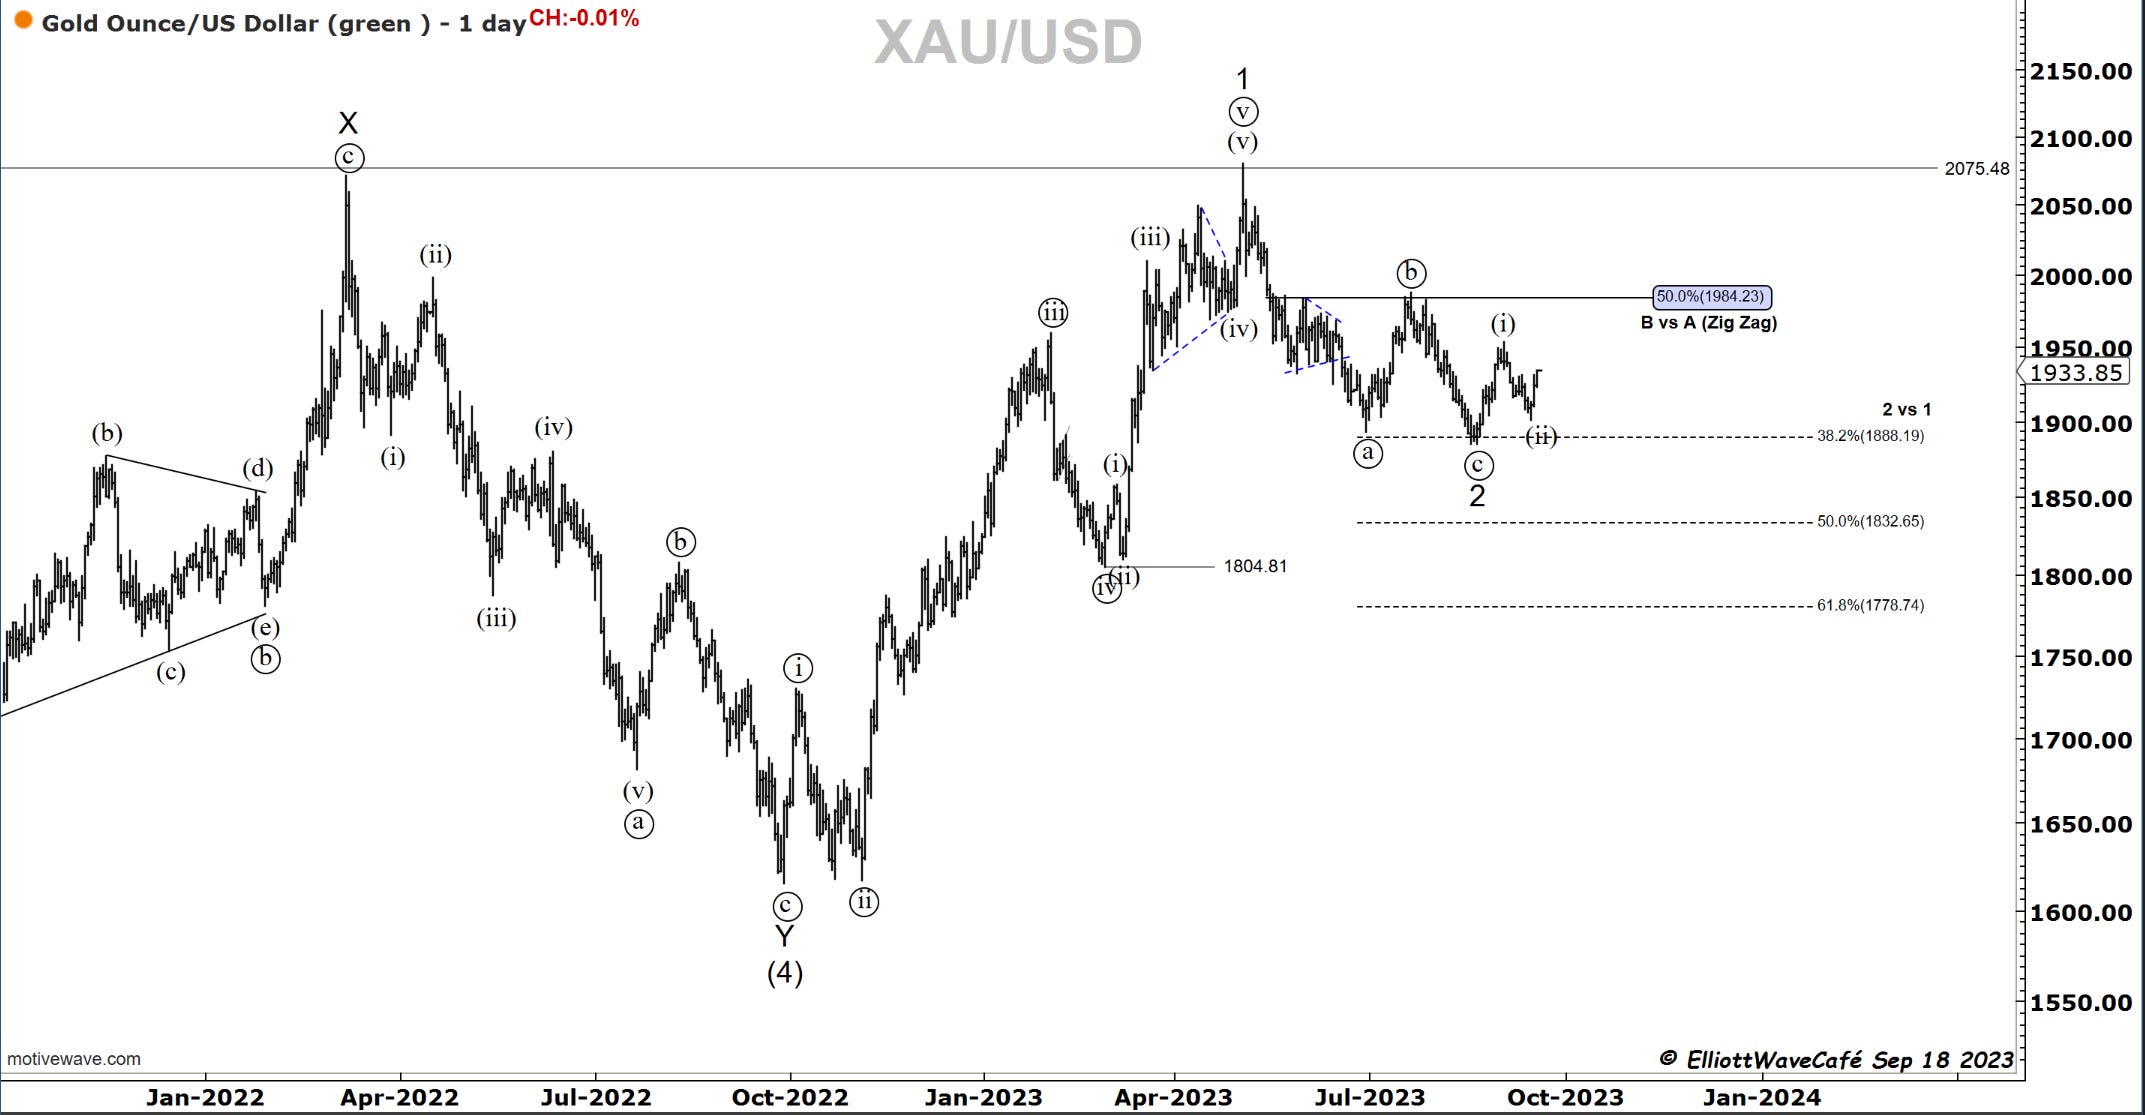
Gold
Decent rally in gold over the past three days, without actually touching the lower side of the trading range. I dare to label the moves as a (i) (ii), but until we break 2000 with conviction I reserve the right to change it. As a long trading play, we don’t want the price to drop below 1900, or else we’re running into extending the wave 2 correction. Anything dovish from Jay and gold will moon while the dollar tanks. Powell has been pretty good at keeping his composure tho, so come Wed it might just be a non-event with sprinkles of intense trading in between.
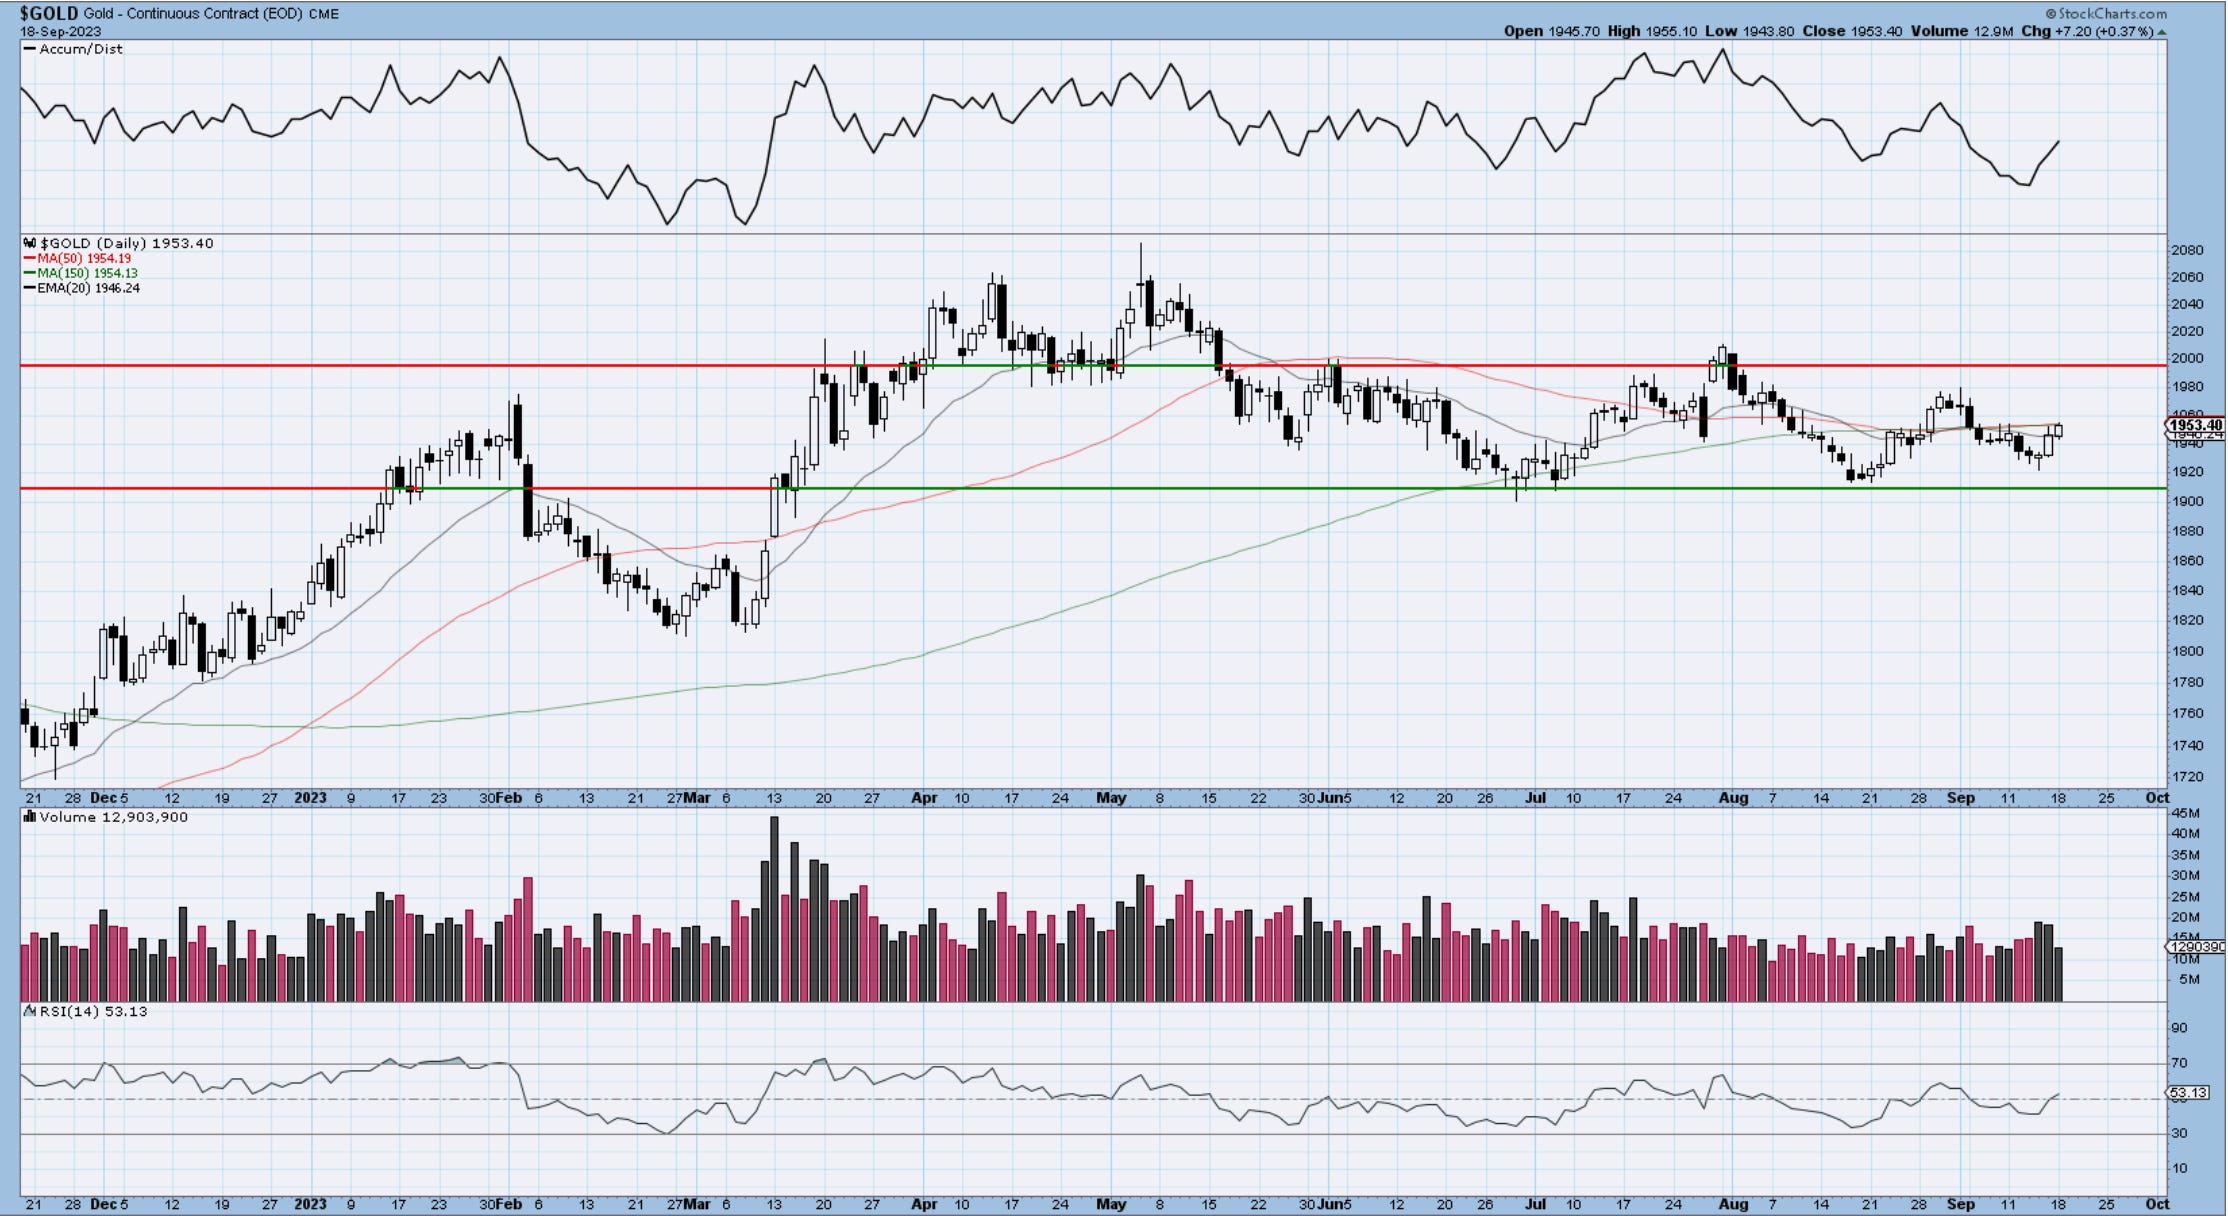
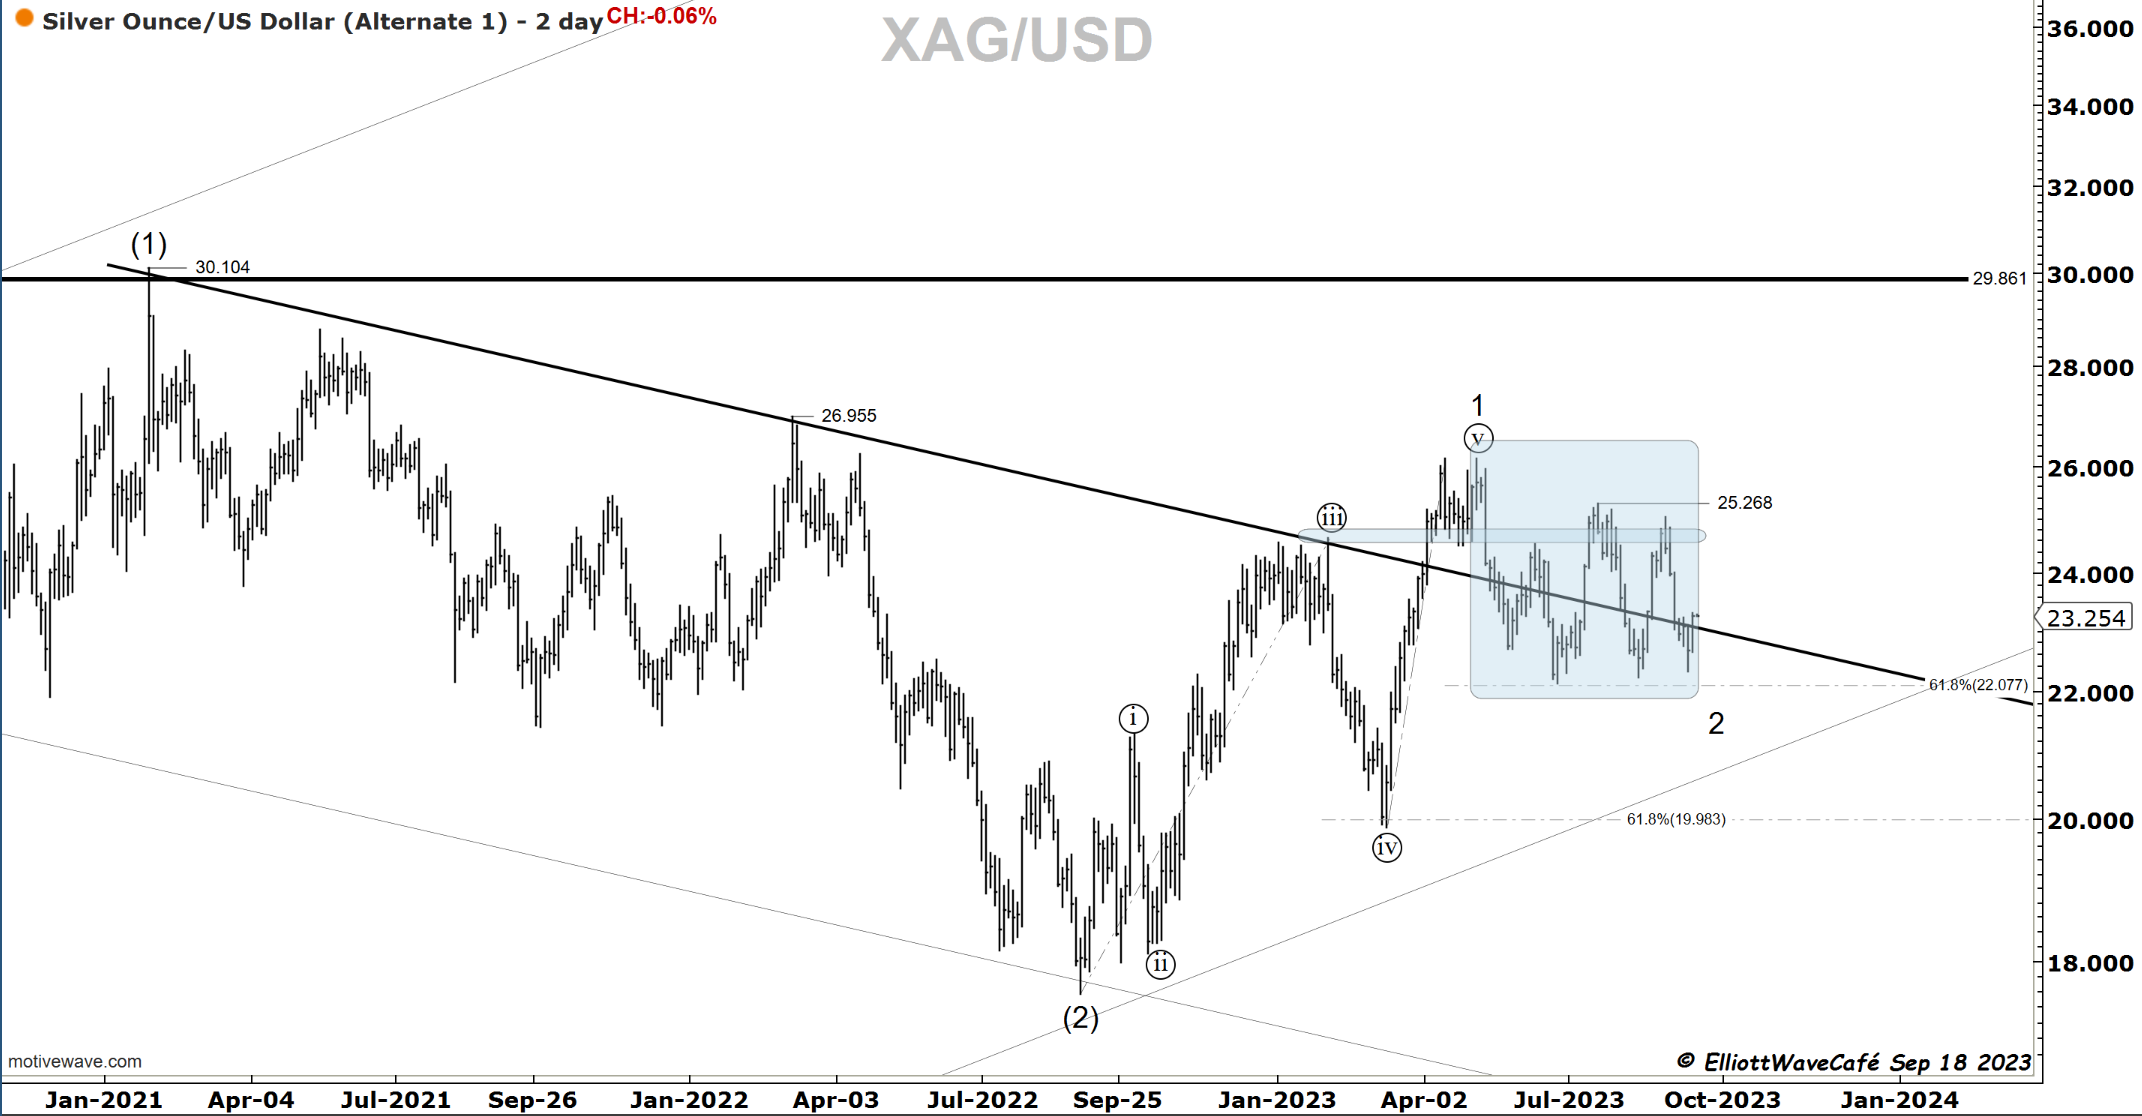
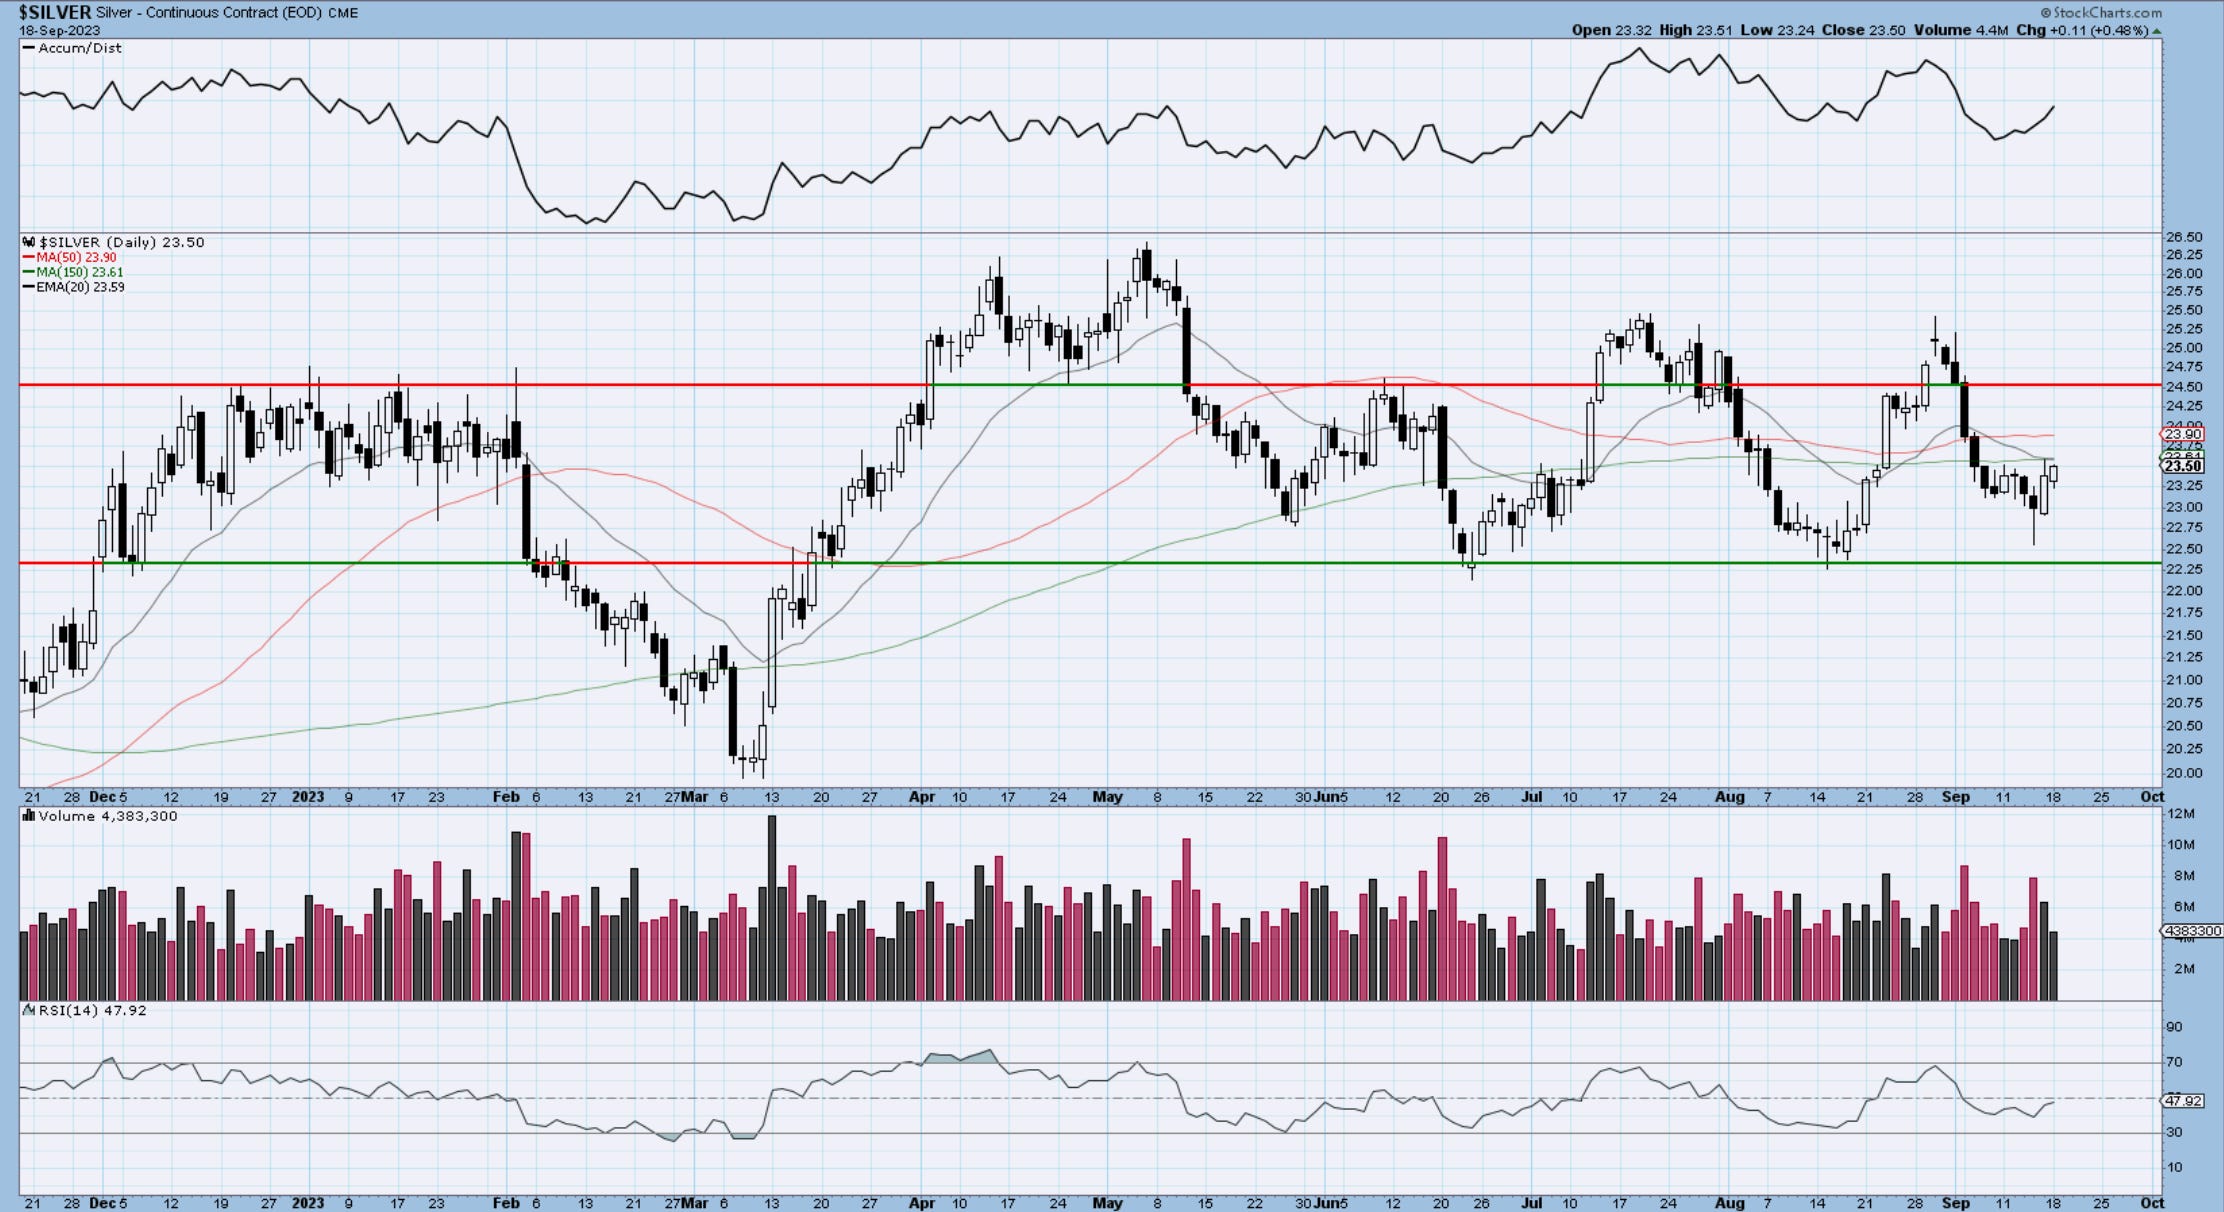
Silver
That whole box is a complex correction. It can resolve lower and wave 2 extends some more, or it can start breaking 25.26 and we could be starting the 3rd. Below on the daily chart, you can see the beautiful trading range we find ourselves in. I can tell you that some decent moves in metals could be around the corner. Long against 22.50 low is not a bad idea, but I would personally sit tight for a bit more data, even if you have to pay up.
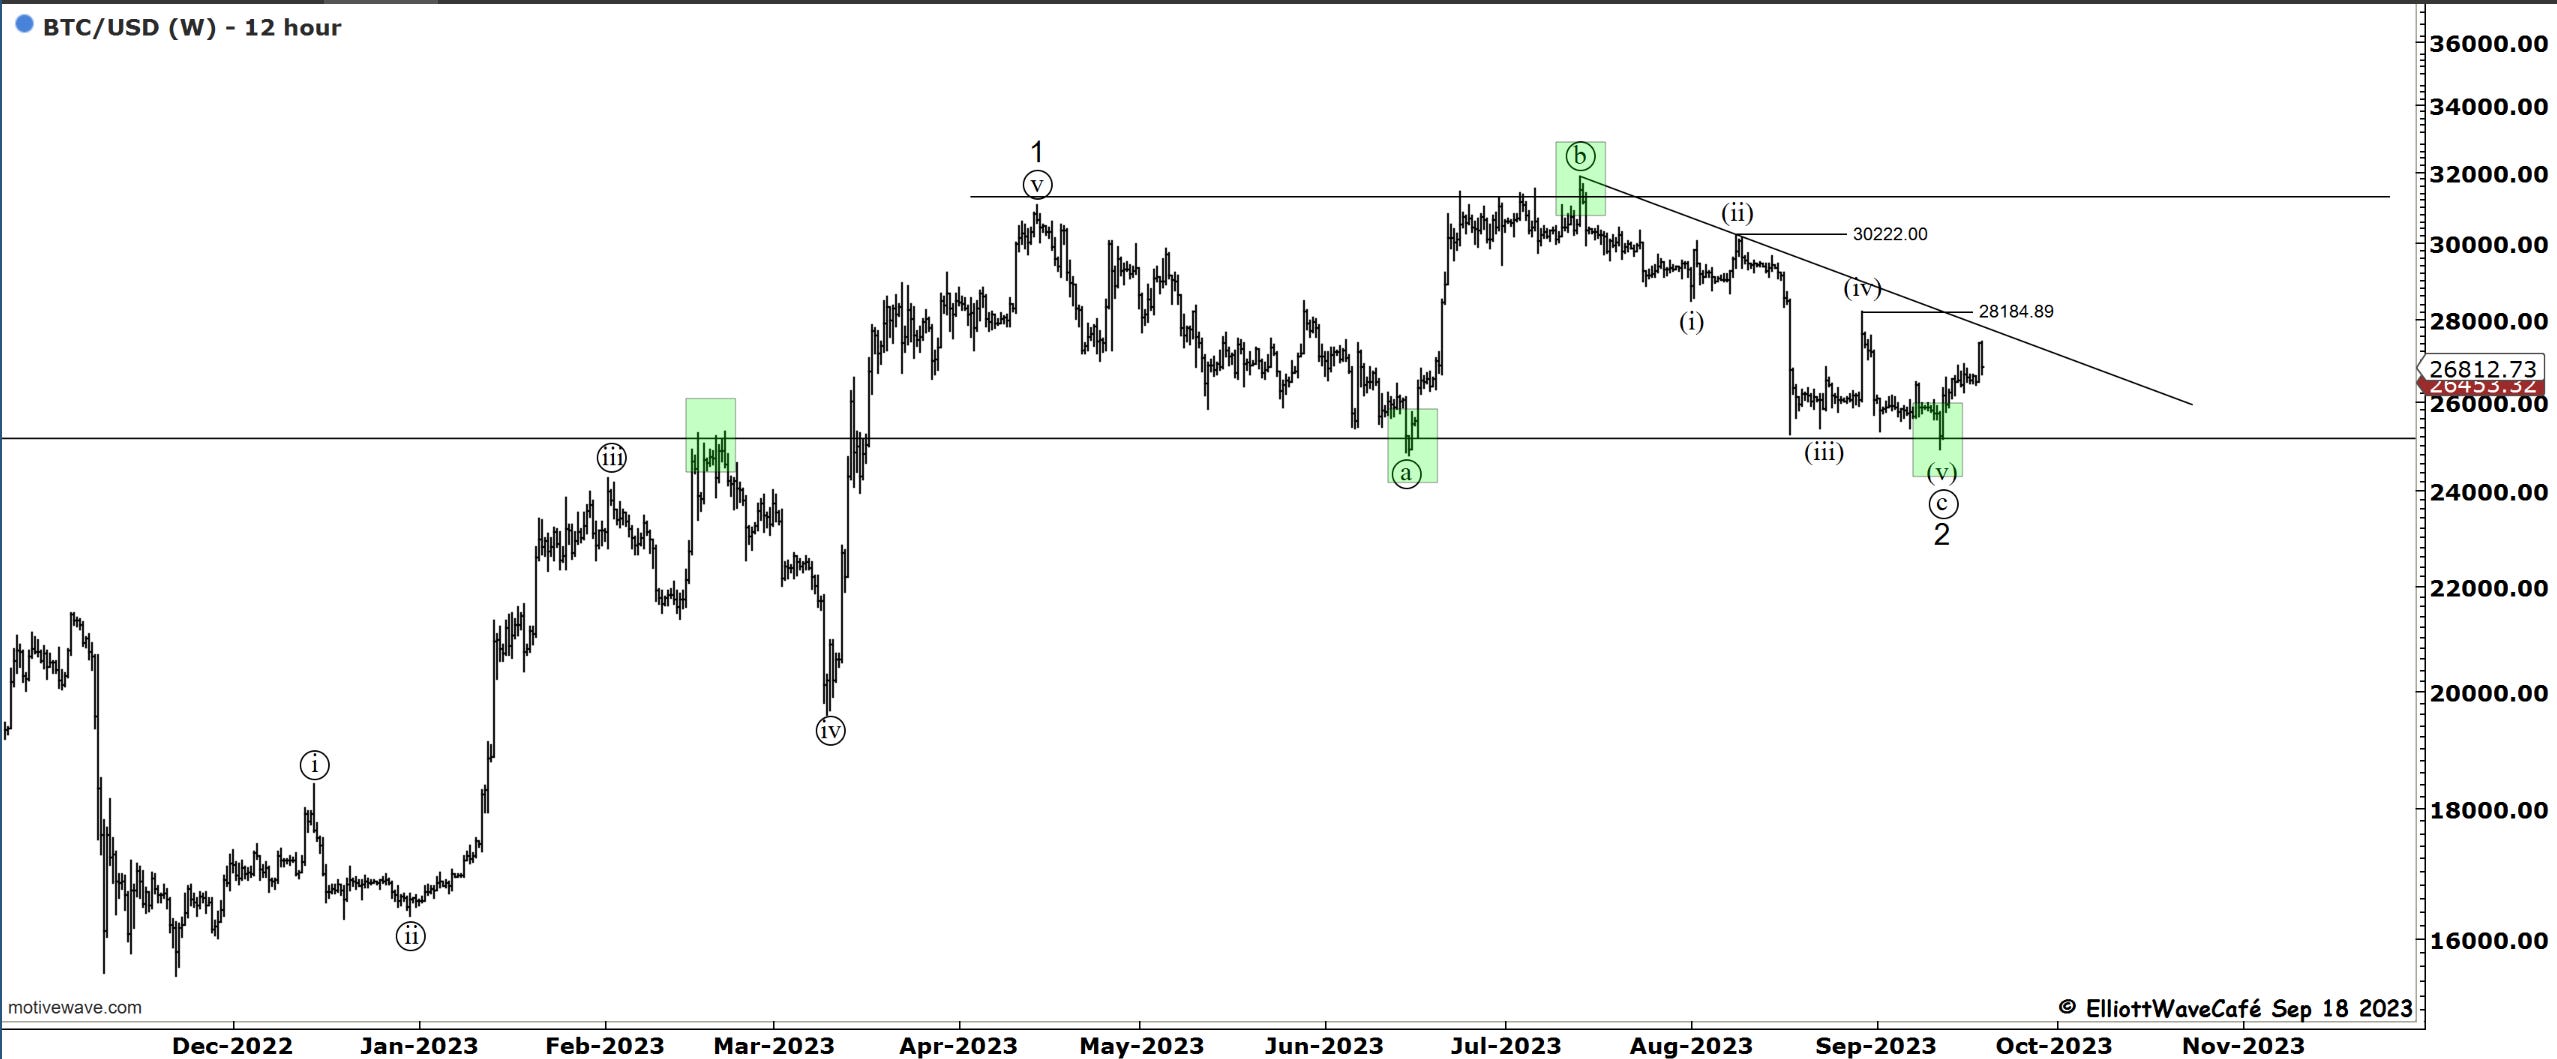
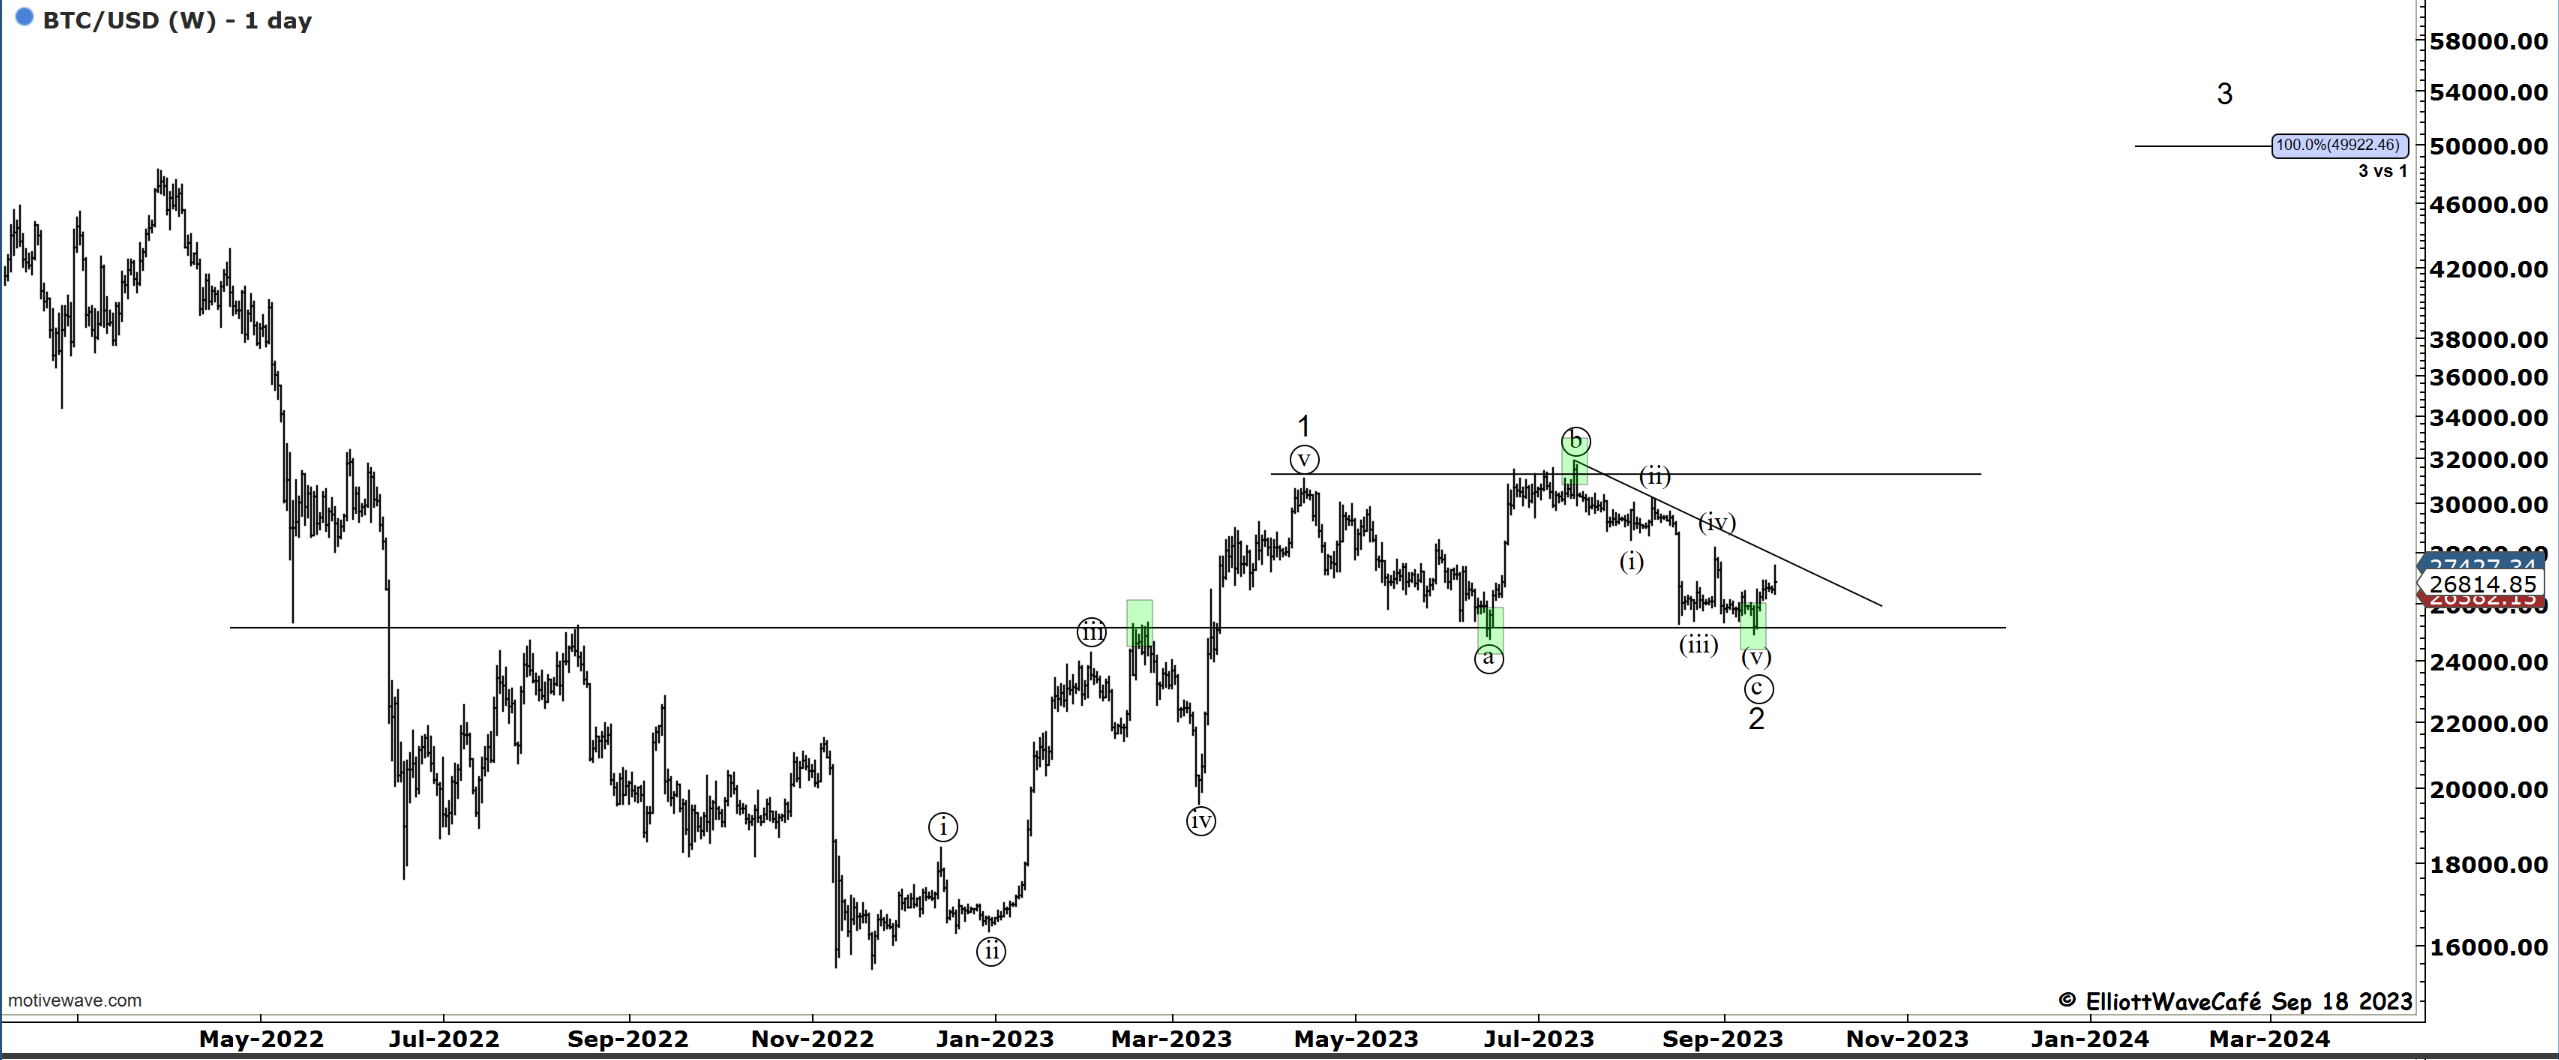
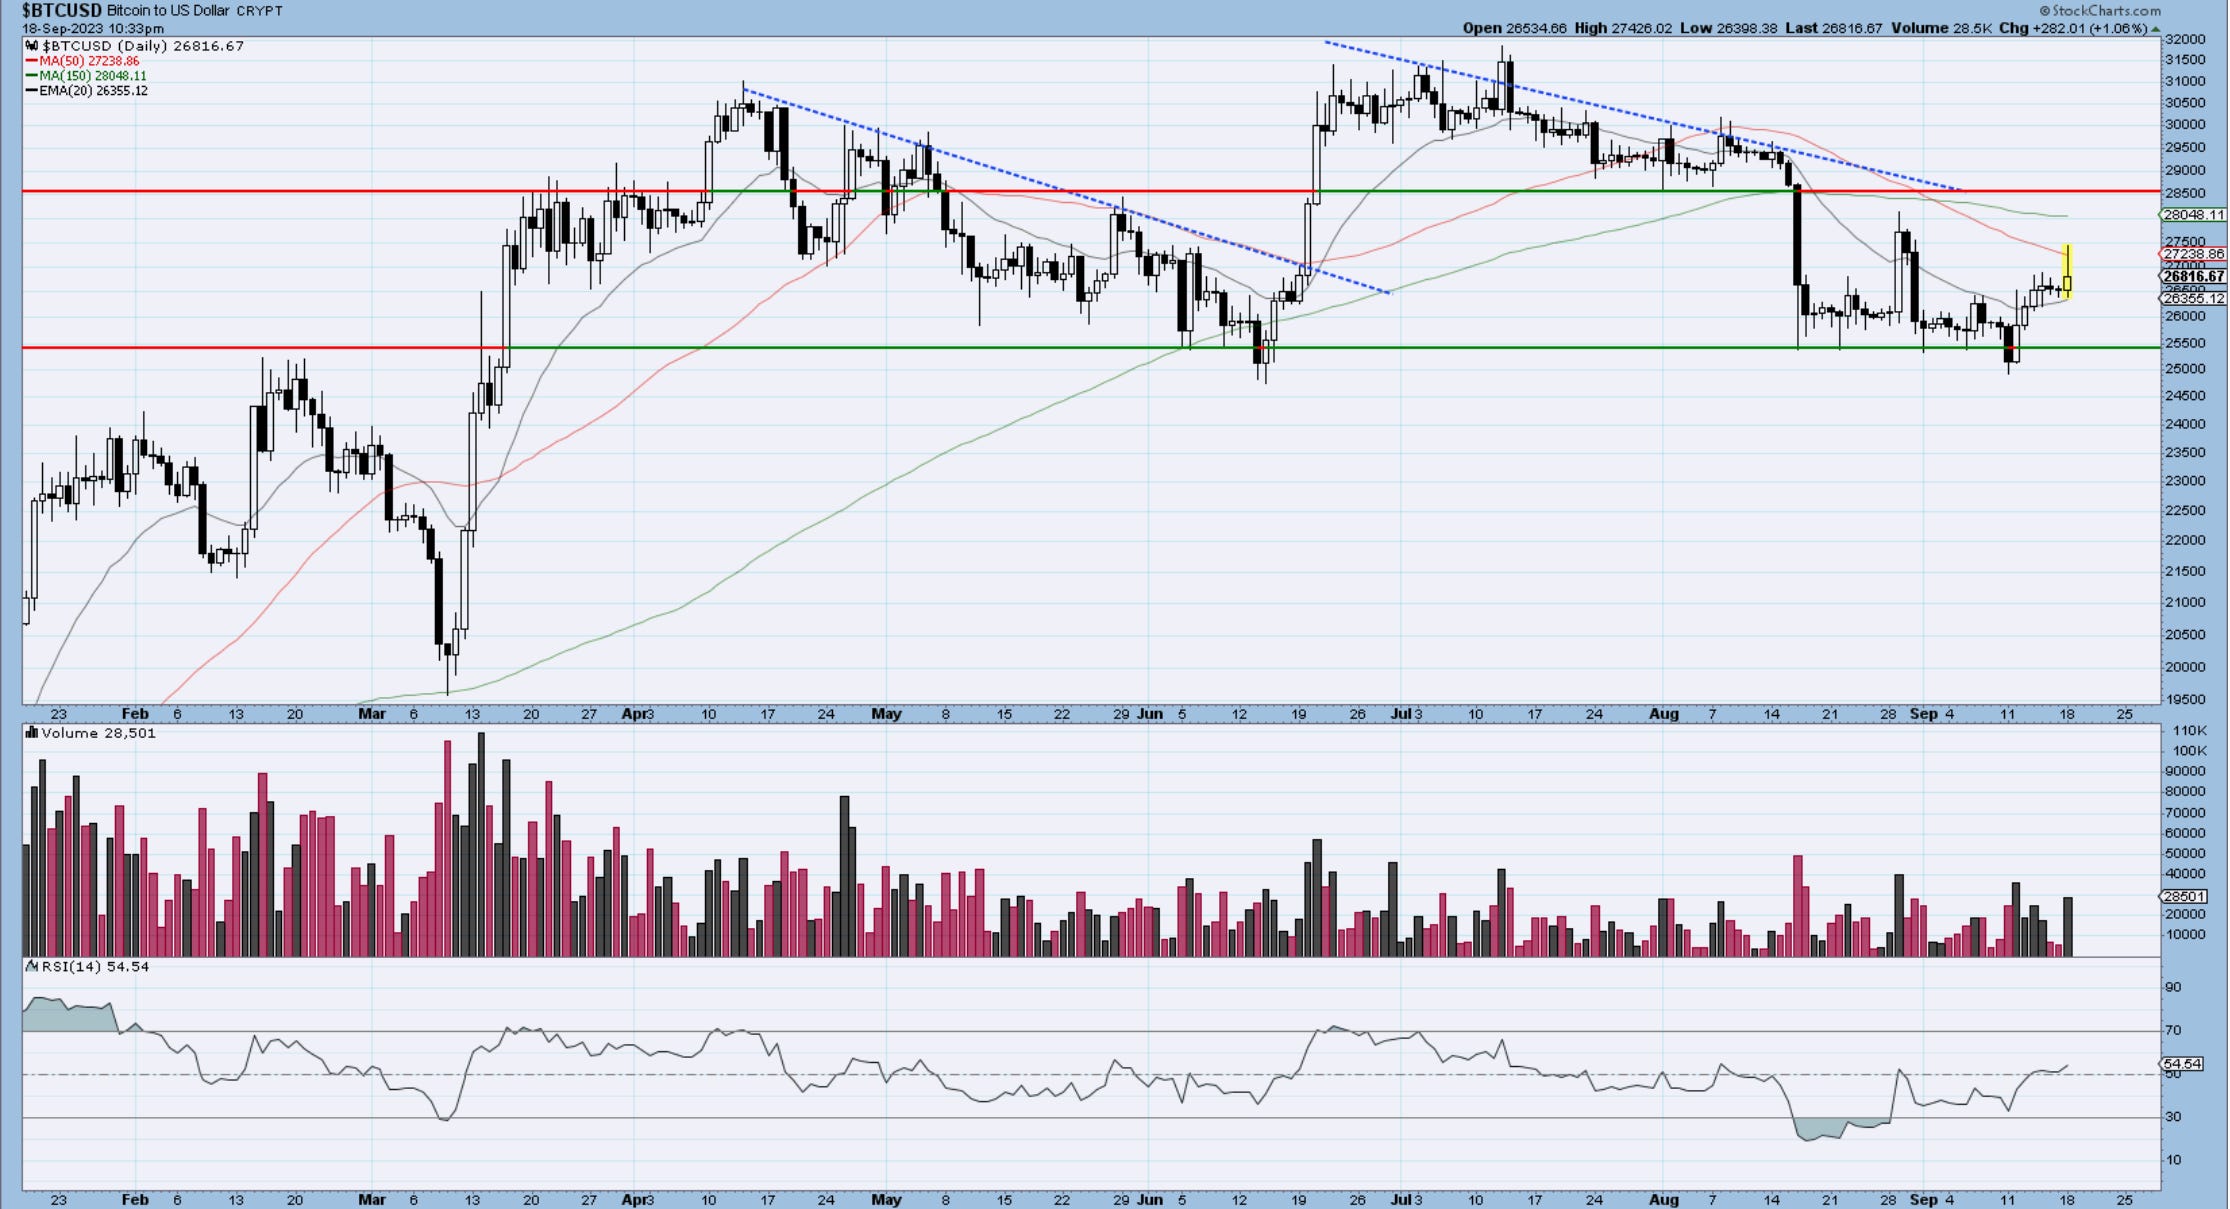
Bitcoin
As it’s usually the case with fake breakups/breakdowns, they elicit decent moves in the opposite direction. The same was the case for BTC here, something we discussed in last week’s updates. I am noticing a little selling coming in on the charts from the previous swing-up zone near 28k. There is a good supply zone there, along with a declining trendline and a declining 50-day MA. If we can manage to crack 28.5, I think the current flat count can start to come alive. Dollar selling will help out, along with a dovish Fed. The targets for wave 3 would at a minimum be 50k in case this trend gets going. If we lose 25k, we have a different problem that will discuss when appropriate. My tilt remains long and boring for now.
Video coming up shortly.
See you tomorrow- trade well,
Cris
email: ewcafe@pm.me