
The Daily Drip
Markets review, strategy and analysis
Note: The EW counts on the right edge are real-time, and they are prone to adjustments as price action develops. Elliott Wave has a fluid approach, is evidence-based, and requires constant monitoring of certain thresholds.
In the counts below, this (( )) = circle on chart
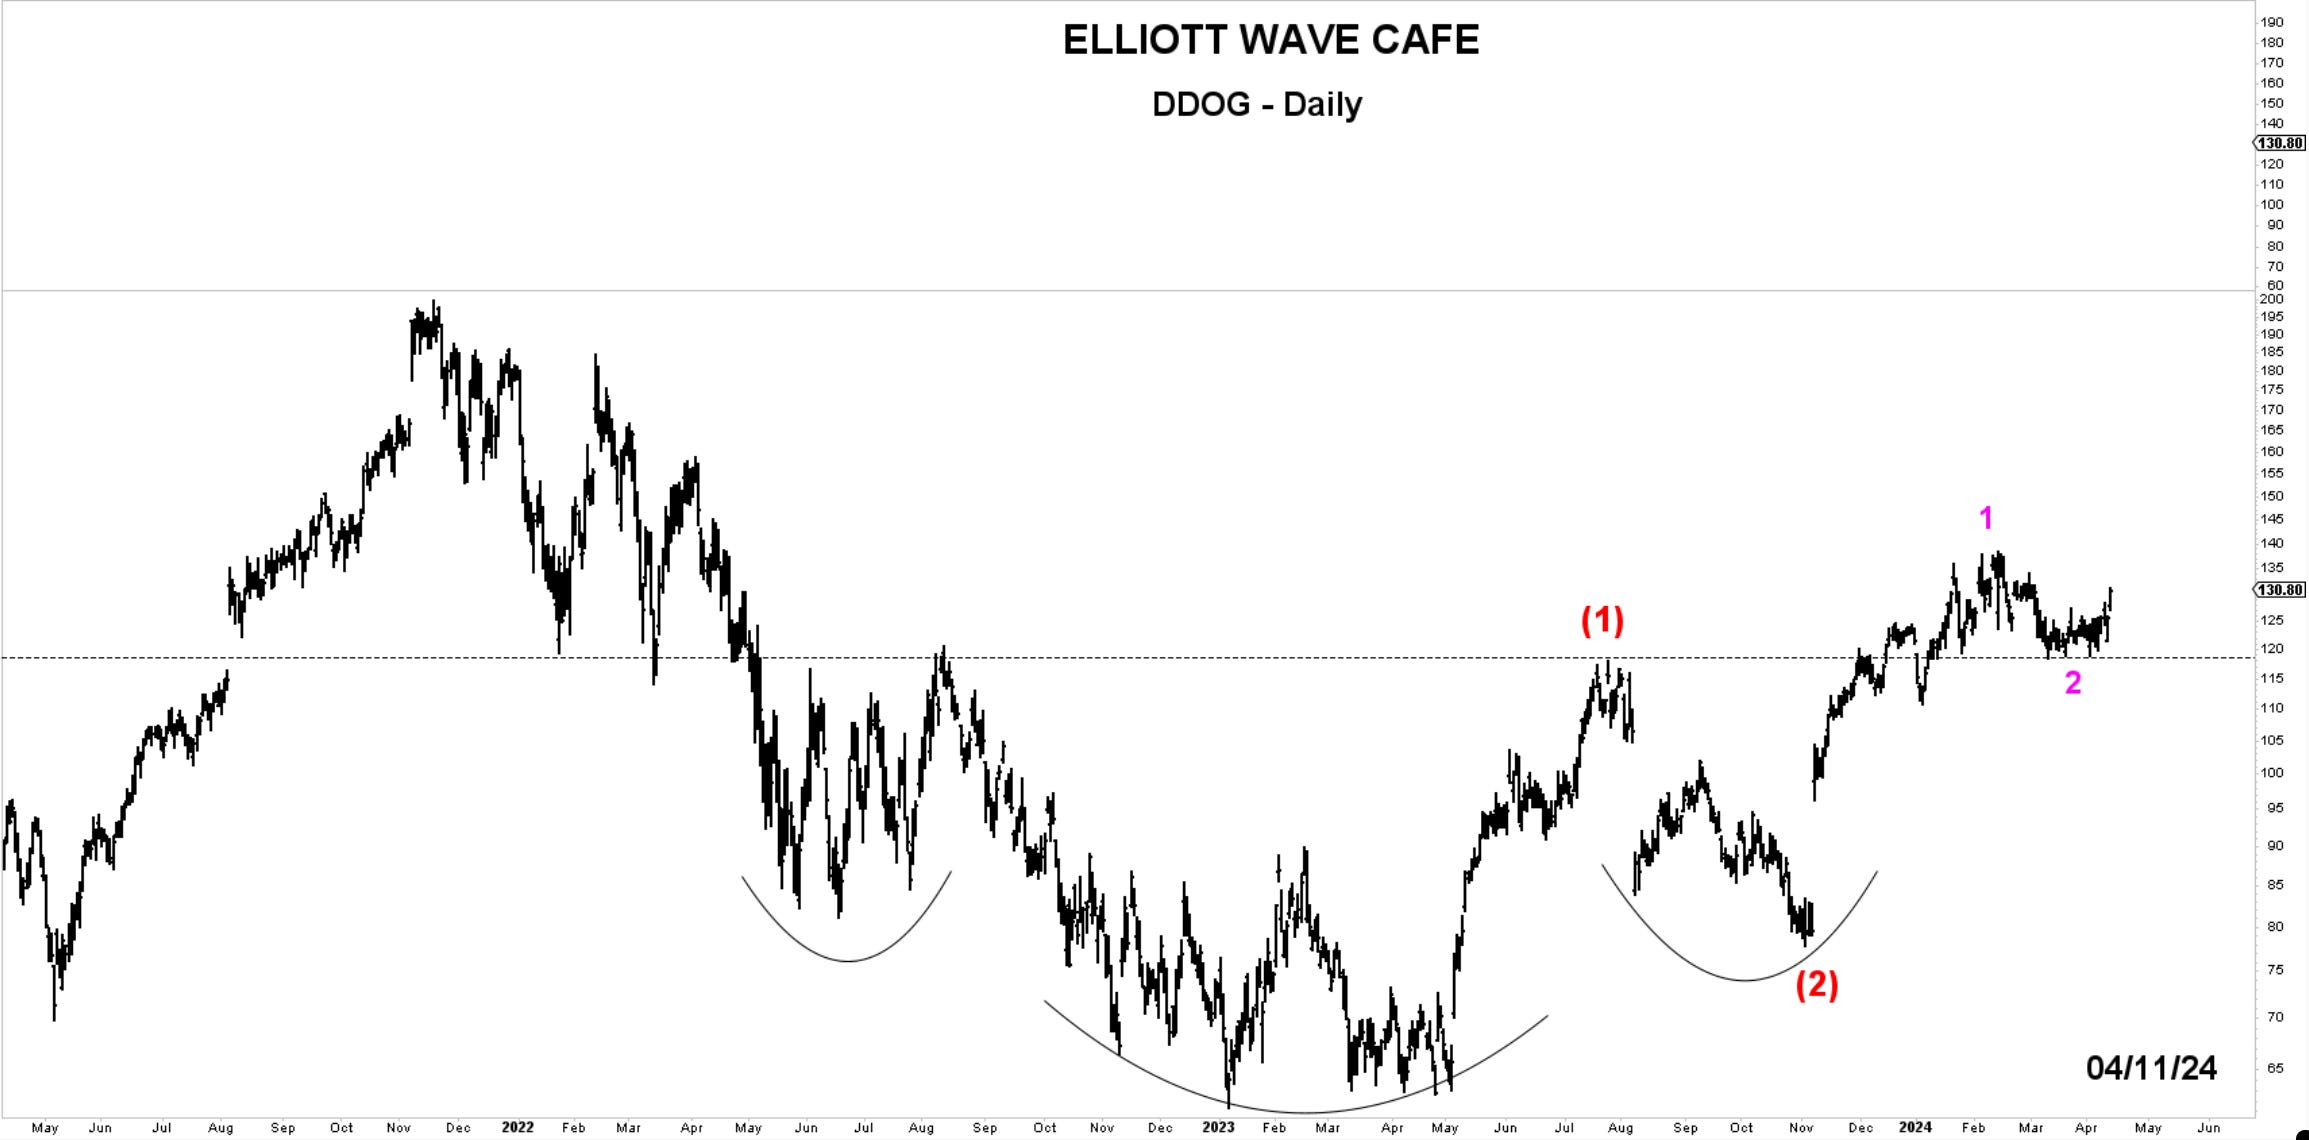
Chart of the Day—DDOG— The break above key resistance brings corrective action and a setup potential for a larger 3rd wave. Below 117, I would exit, give Wave 2 room to finish, and wait for the price to recover above 135 before re-entering.
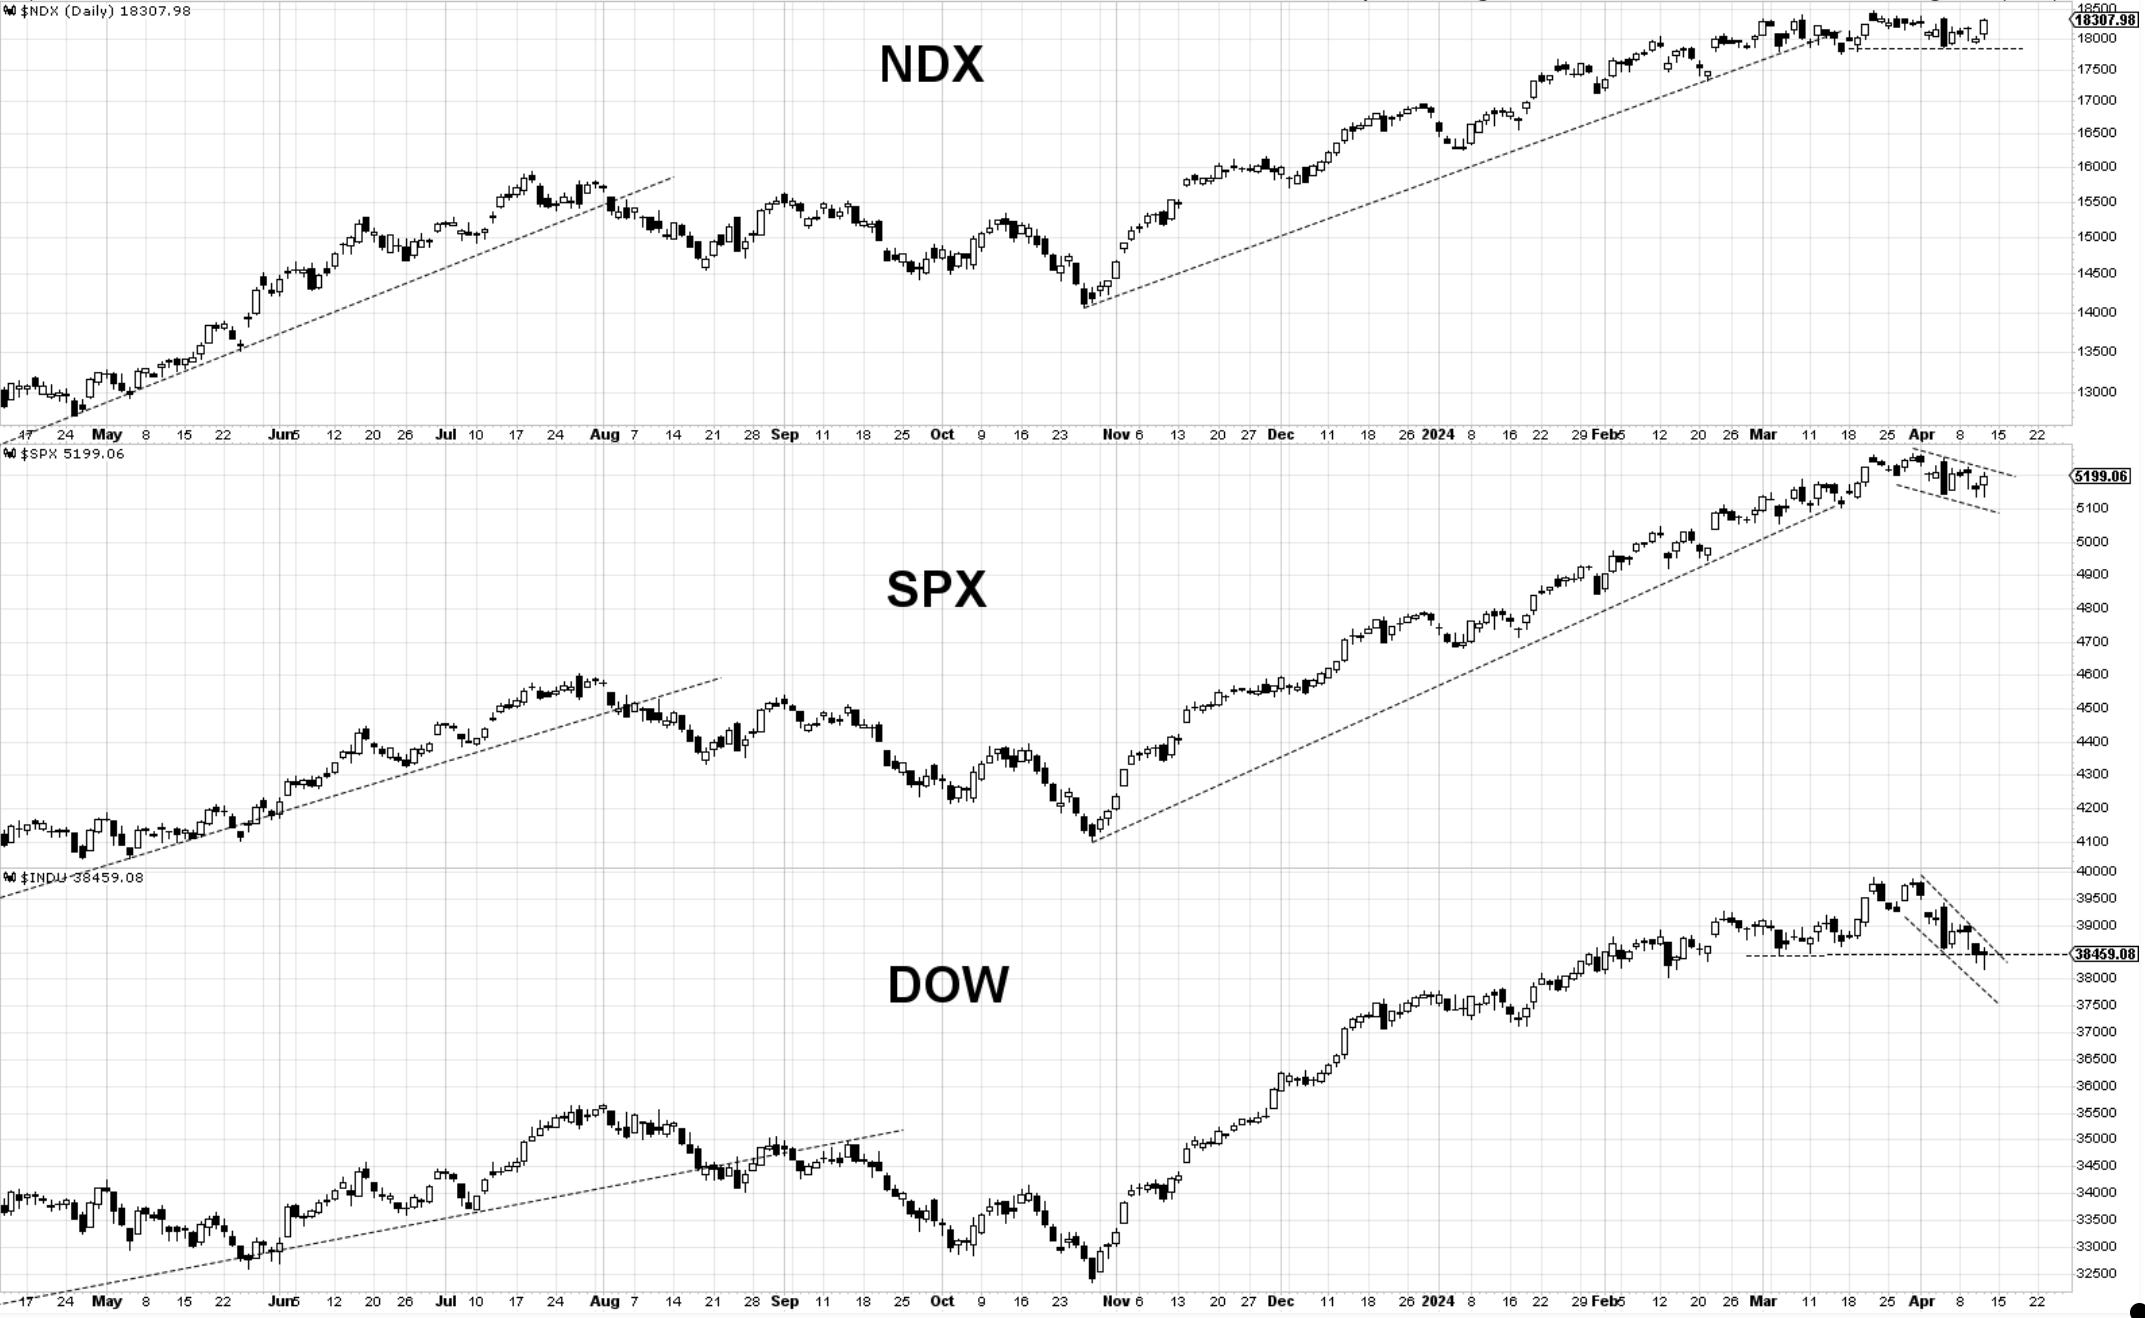
Bottom Line: SPX and NDX recapturing the 20-day MA suggests buyers are back in control and could intend to take this to new highs. IWM and DOW need further recovery. Heavy buying in semiconductors led today’s rally and elevated investors’ confidence. NDX appears to be the leader in terms of chart structure.
Let’s dive into charts and further commentary below…
