
The Daily Drip
Markets review, strategy and analysis
Note: The EW counts on the right edge are real-time, and they are prone to adjustments as price action develops. Elliott Wave has a fluid approach, is evidence-based, and requires constant monitoring of certain thresholds.
In the counts below, this (( )) = circle on chart
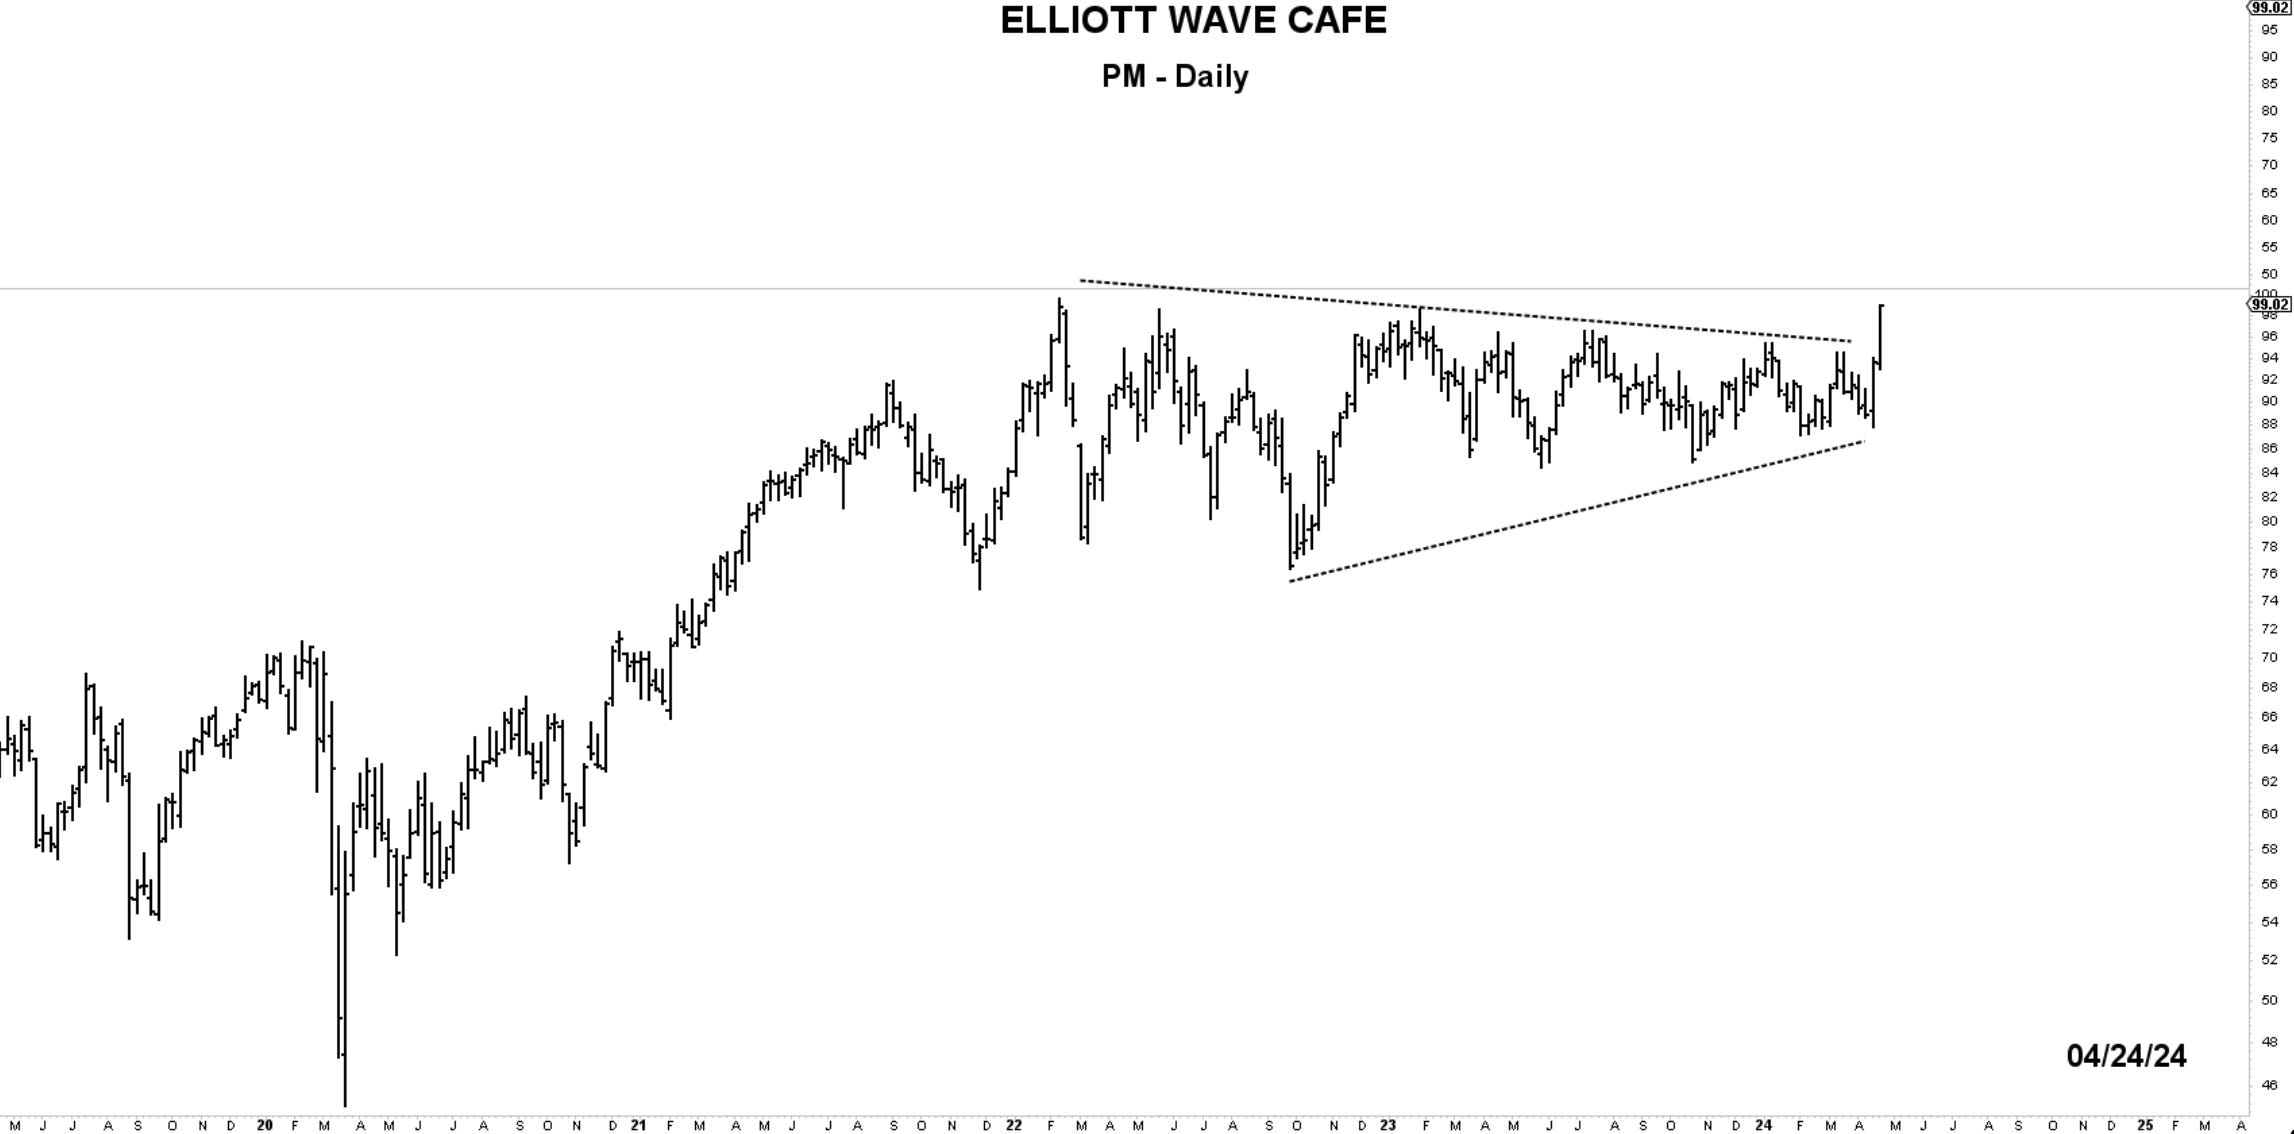
Chart of the Day—PM—Philip Morris is attempting to stage a breakout after more than two years of sideways corrective action. Have fun labeling this chart; it’s a good exercise. I will discuss it in tonight’s video.
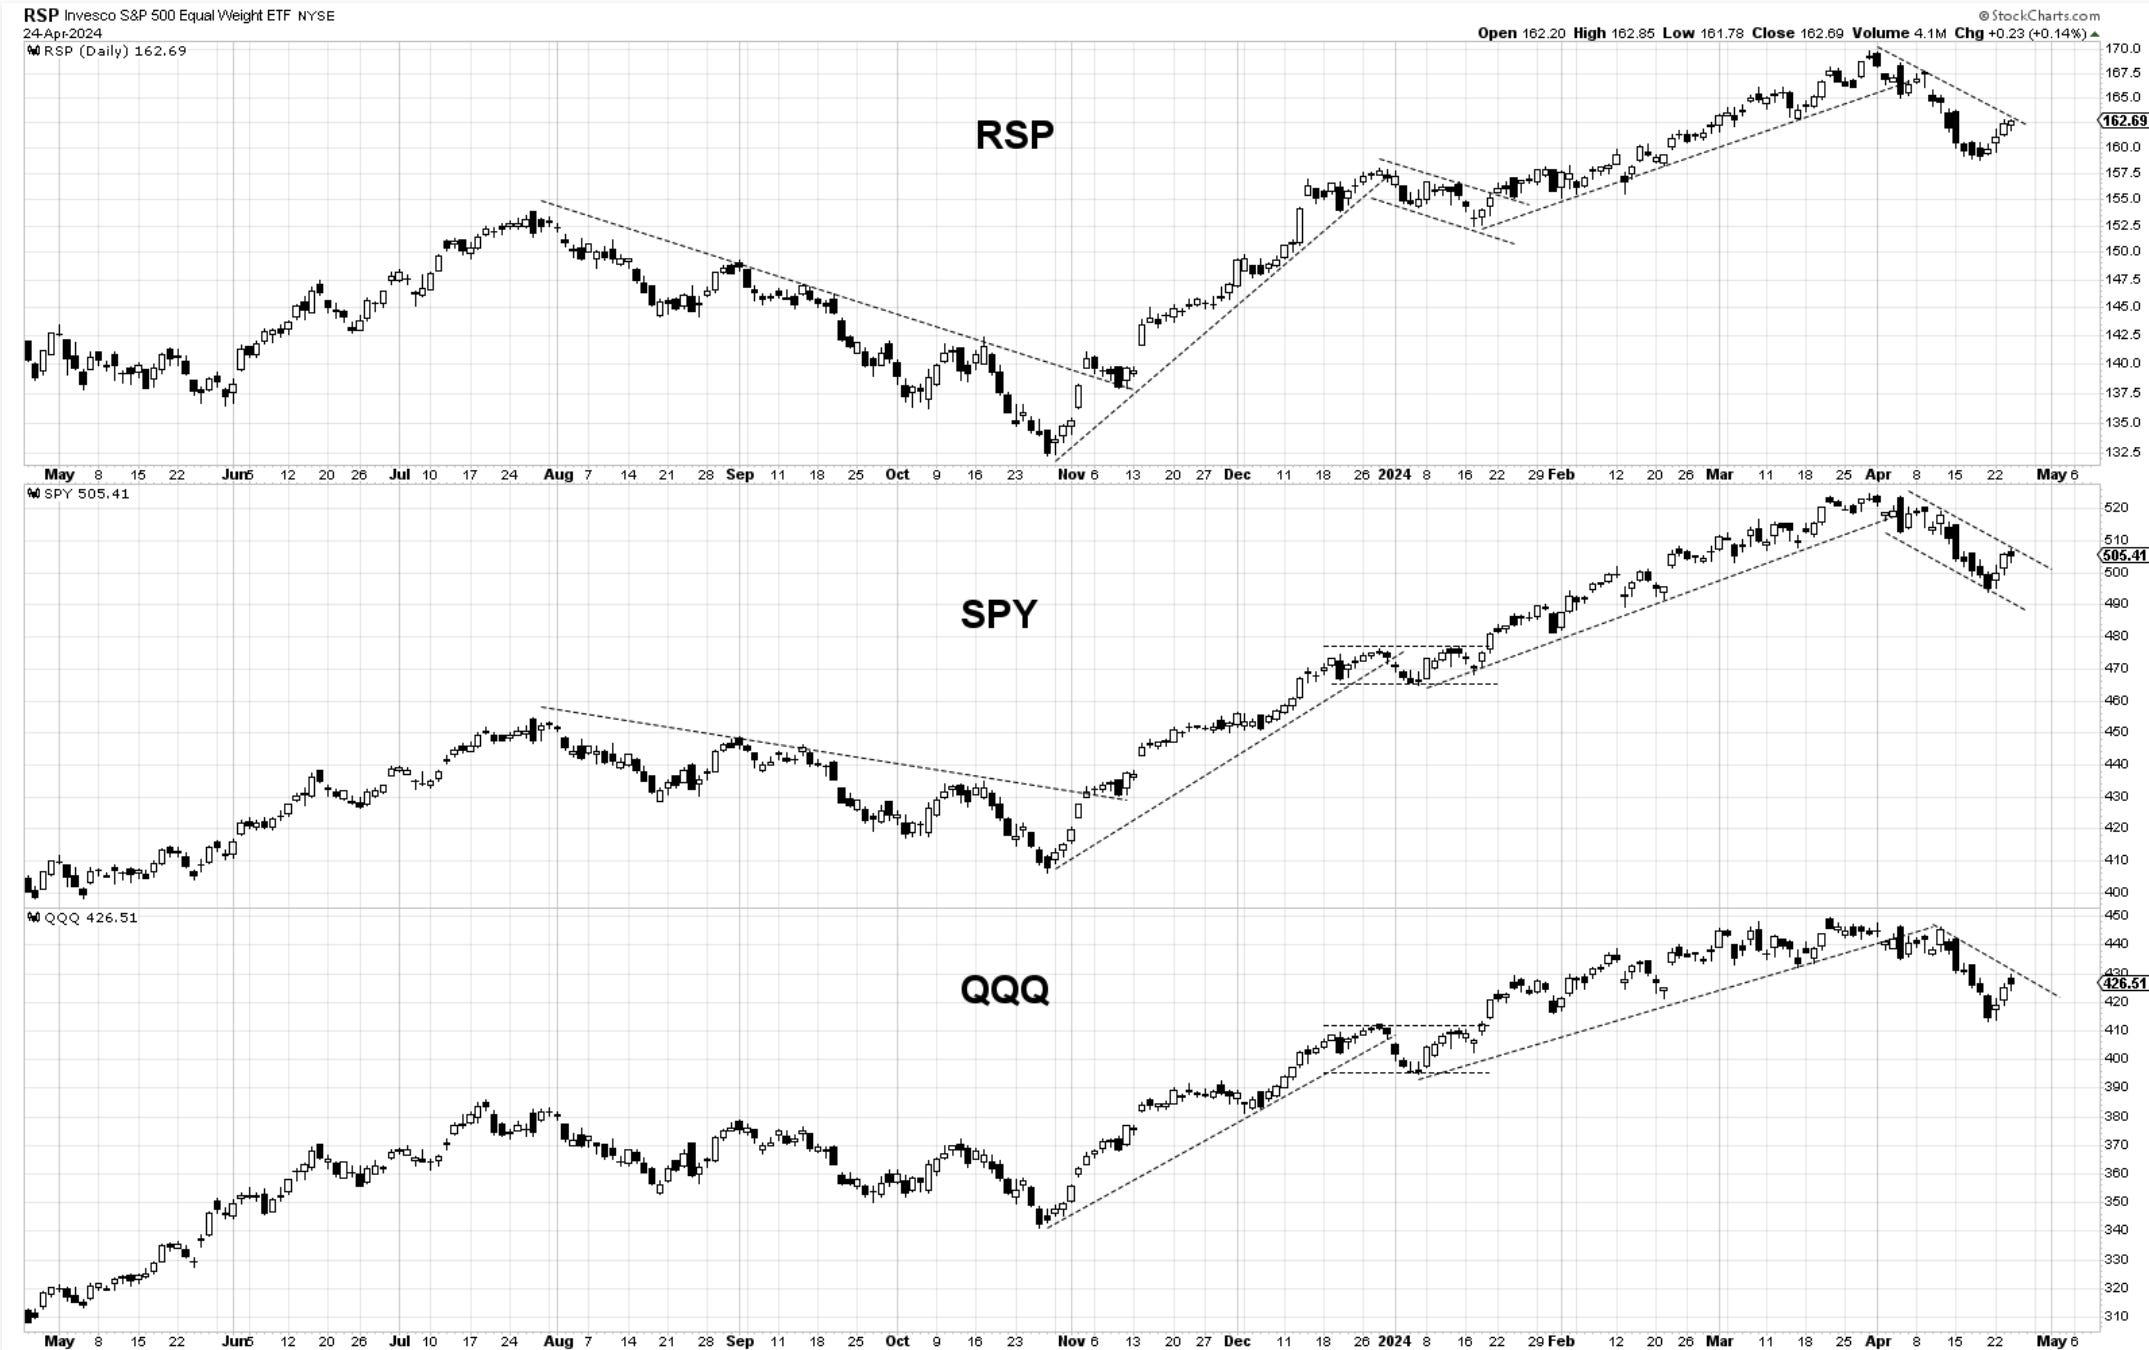
Bottom Line: With heavy earnings hitting the tape these couple of days, markets are stalling just below resistance levels, waiting for further catalysts. Two days of buying brought some short-term relief, but reduced long exposure is still suggested until more proof is brought forward by the price action. During extended corrective phases, rallies are quite prone to failure due to a change in market character.
Let’s dive into charts and further analysis below…
