
The Daily Drip
Elliott Wave and technical market updates on SPX,NDX,DOW,IWM,DXY,BITCOIN
Note: The counts on the right edge are real-time, and they are prone to adjustments as price action develops. Elliott Wave has a fluid approach, is evidence-based, and requires constant monitoring of certain thresholds.
In the counts below, this (( )) = circle on chart
For the new readers “The Daily Drip”update is now available as part of a lower subscription tier $8/month or $6.67/mo yearly. Here is a free preview….
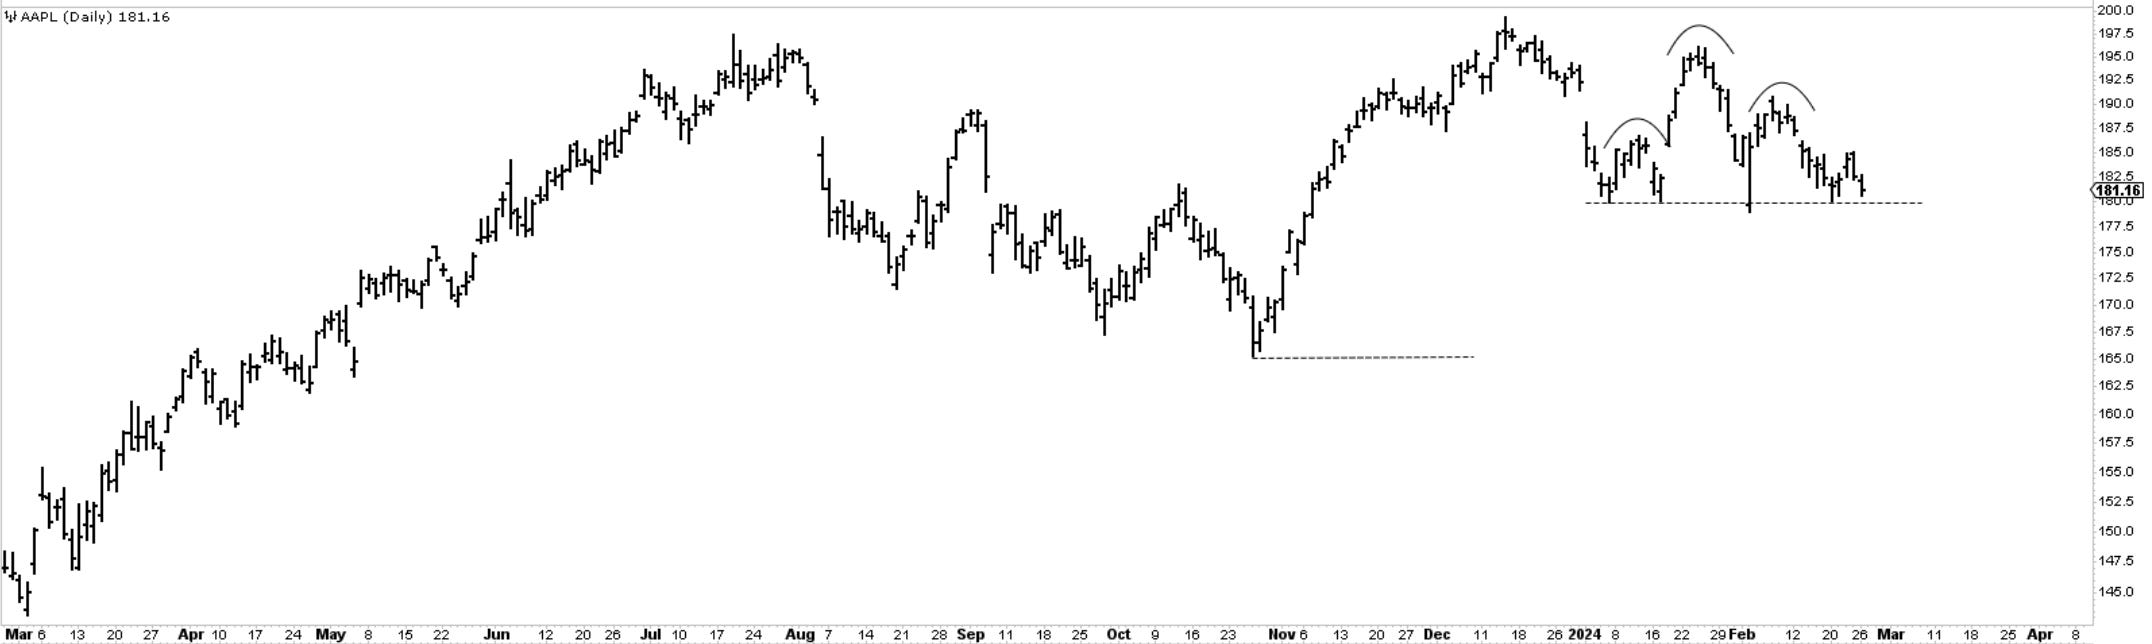
Chart of the Day AAPL 0.00%↑ - Traditionally, a continuation pattern of weakness. 180 is the neckline, a breakout of which has the potential to send it to 167.
SP500
Since last week’s Thursday breakout, the markets have not done much. We have spent the last two trading days digesting the prior gains, allowing traders to think about their positioning. The bulls are probably pretty content that higher rates, an uptick in inflation, a higher dollar, and February seasonality were nowhere near enough to put a dent in the advance. The bears continue to search for clues on why this price action does not make sense, how we’re in a bubble, and how only Nvidia is at fault for such gains in the indices. The truth is, as always, somewhere in the middle, but the hard facts on the charts are that we have hit 5100, and there are no solid signs of trend damage at the current stage. Yes, we have stalled here; we’re due for some correction, but from which levels and how deep it will run are not answers easily found.
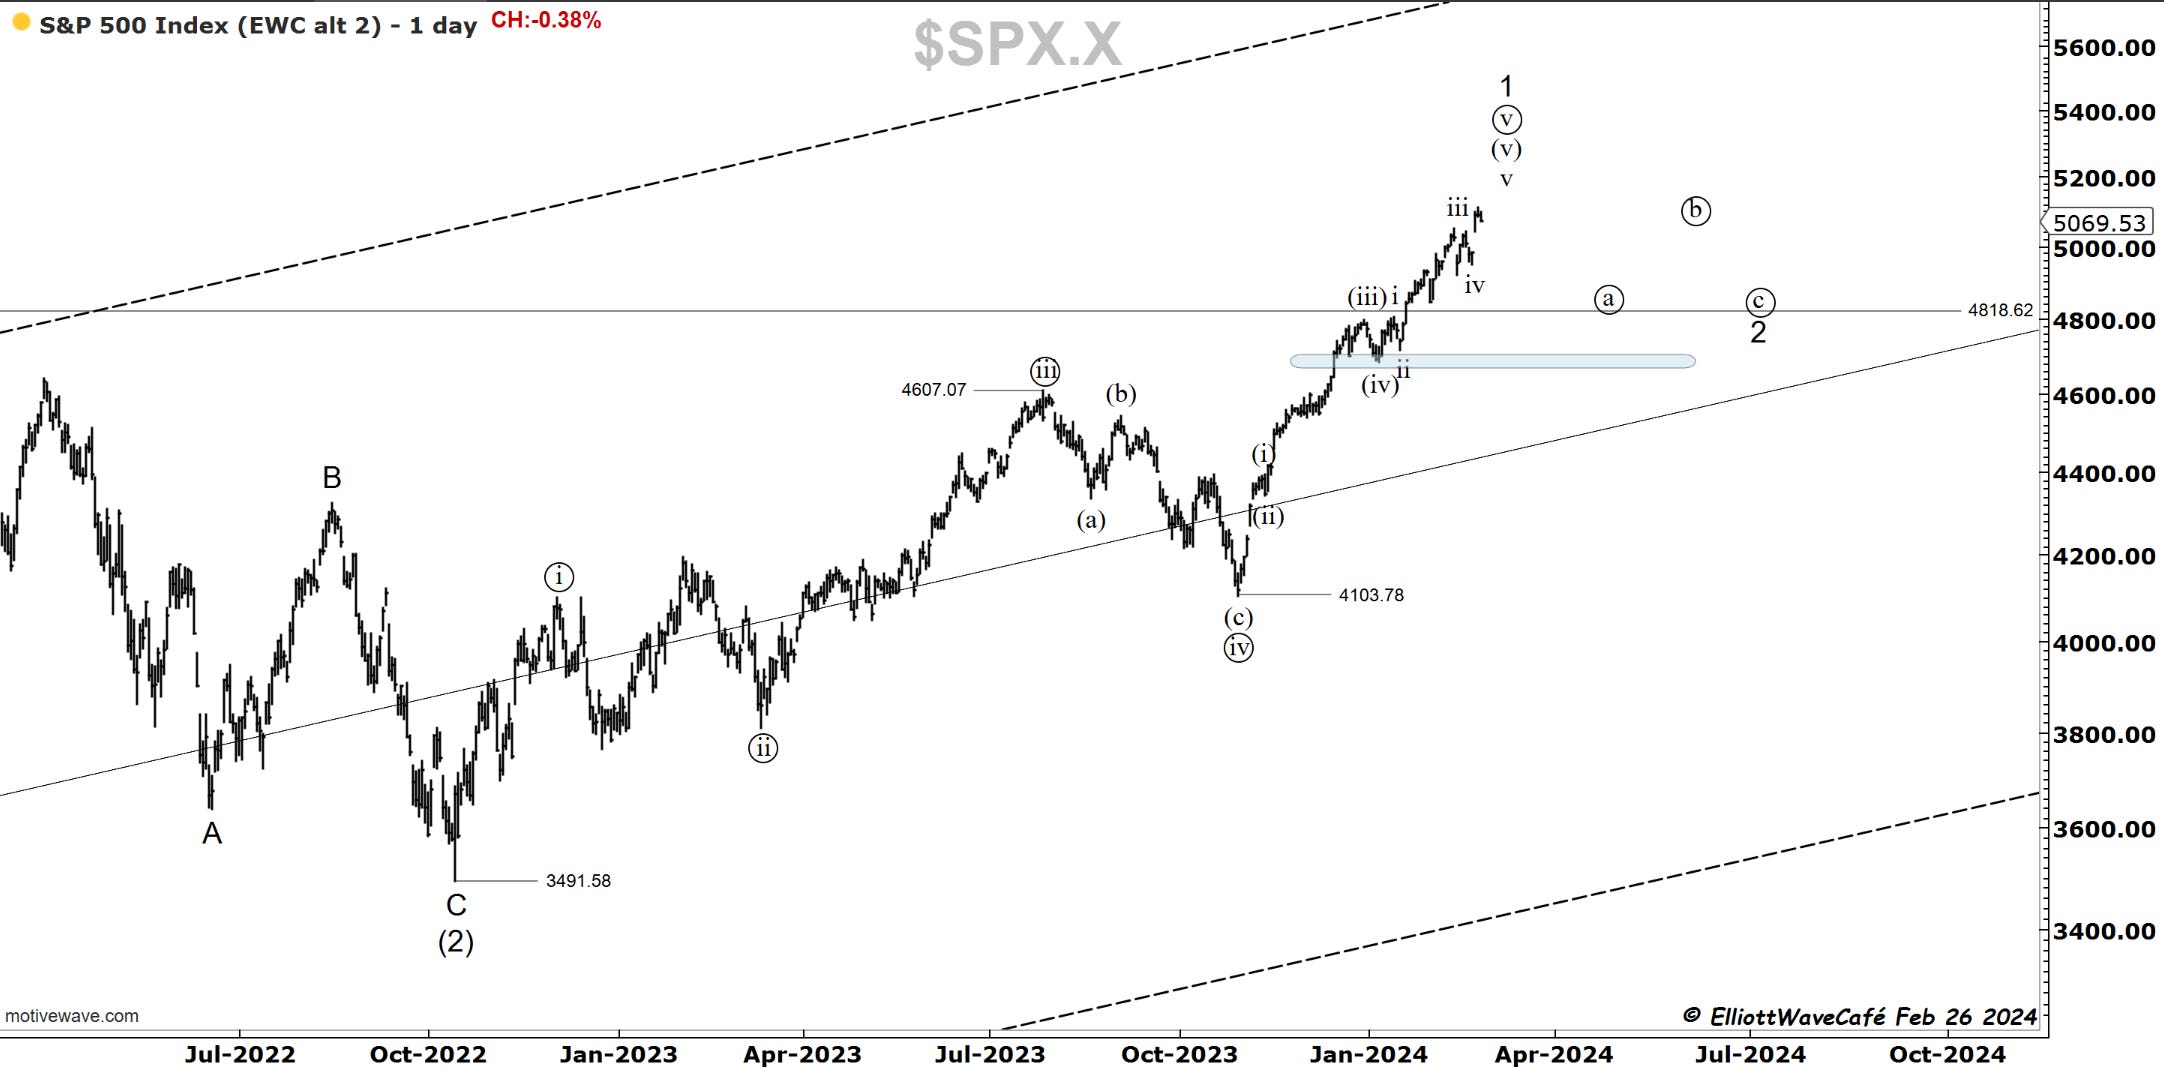
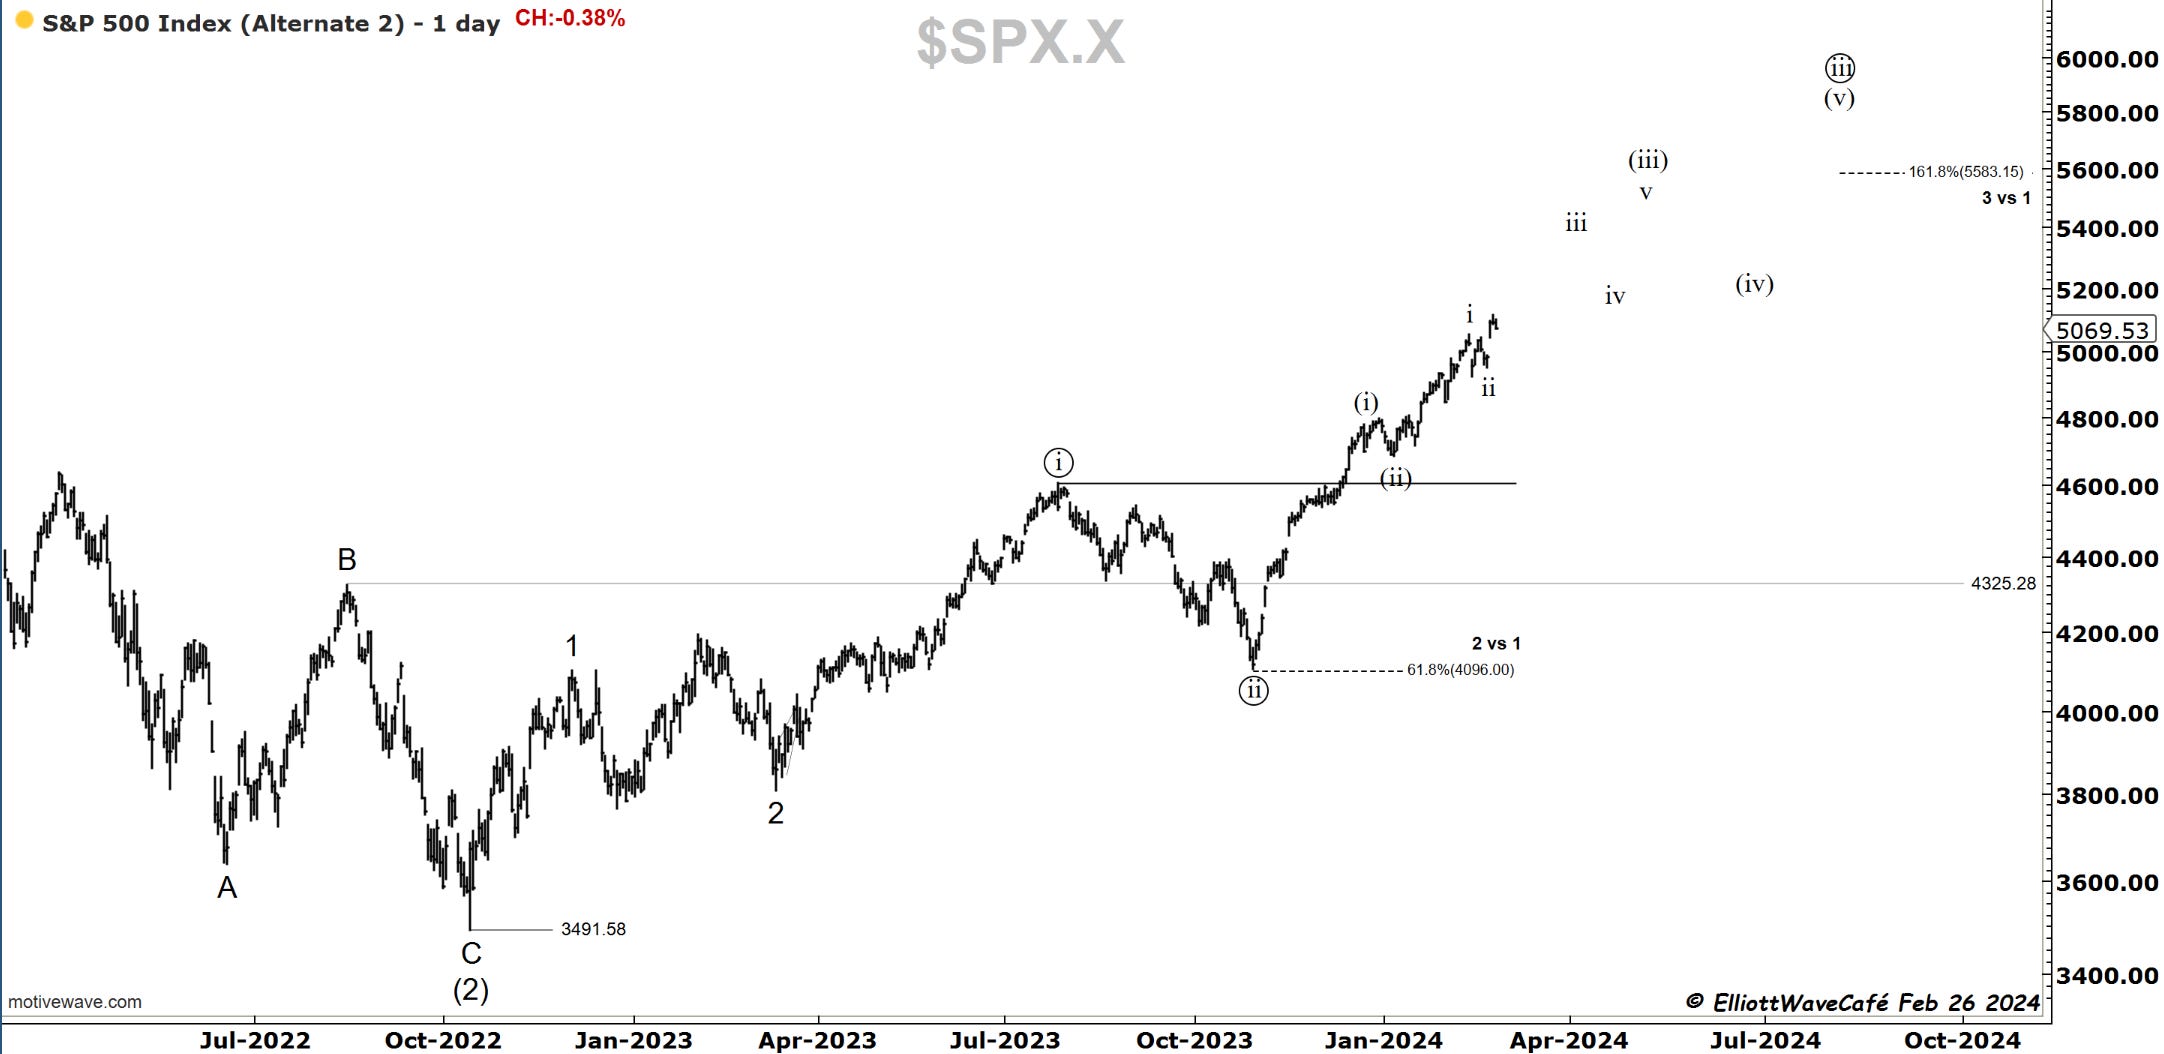
I must continue to present two versions of wave counting to you so you can see how tricky the market is when it’s trending. We can be in the final stages of this rally, as per the first chart, trying to find a top in this wave (v), or we can still be within a larger wave (iii) of an even larger wave ((iii)). I would not blame you for counting either one, but know this: counting waves and making actual trading decisions based on this are two different things. The first is helping create a road map, and the second is about which bus to take and at which bus stops to get out. The knowledge of levels, invalidation, clues of failure, and odds at different stages are all things that must be learned to deploy the elliott wave in a practical manner. I will discuss more in tonight’s video.
As seen below, the trend is intact, with the price above all key moving averages and the RSI trending above the 50 mark. If you’re long, I will use 4950 as a defense for the short term ( days). . 4800 is a defense for the medium term. ( weeks). 4500 is defense for longterm ( months).
Let’s continue to analyze the rest of the markets; BTC is breaking out; the Daily Video is also attached below.
