
The Daily Drip
Core markets charts updates and commentary
Note: The counts on the right edge are real-time, and they are prone to adjustments as price action develops. Elliott Wave has a fluid approach, is evidence-based, and requires constant monitoring of certain thresholds.
In the counts below, this (( )) = circle on chart
SP500
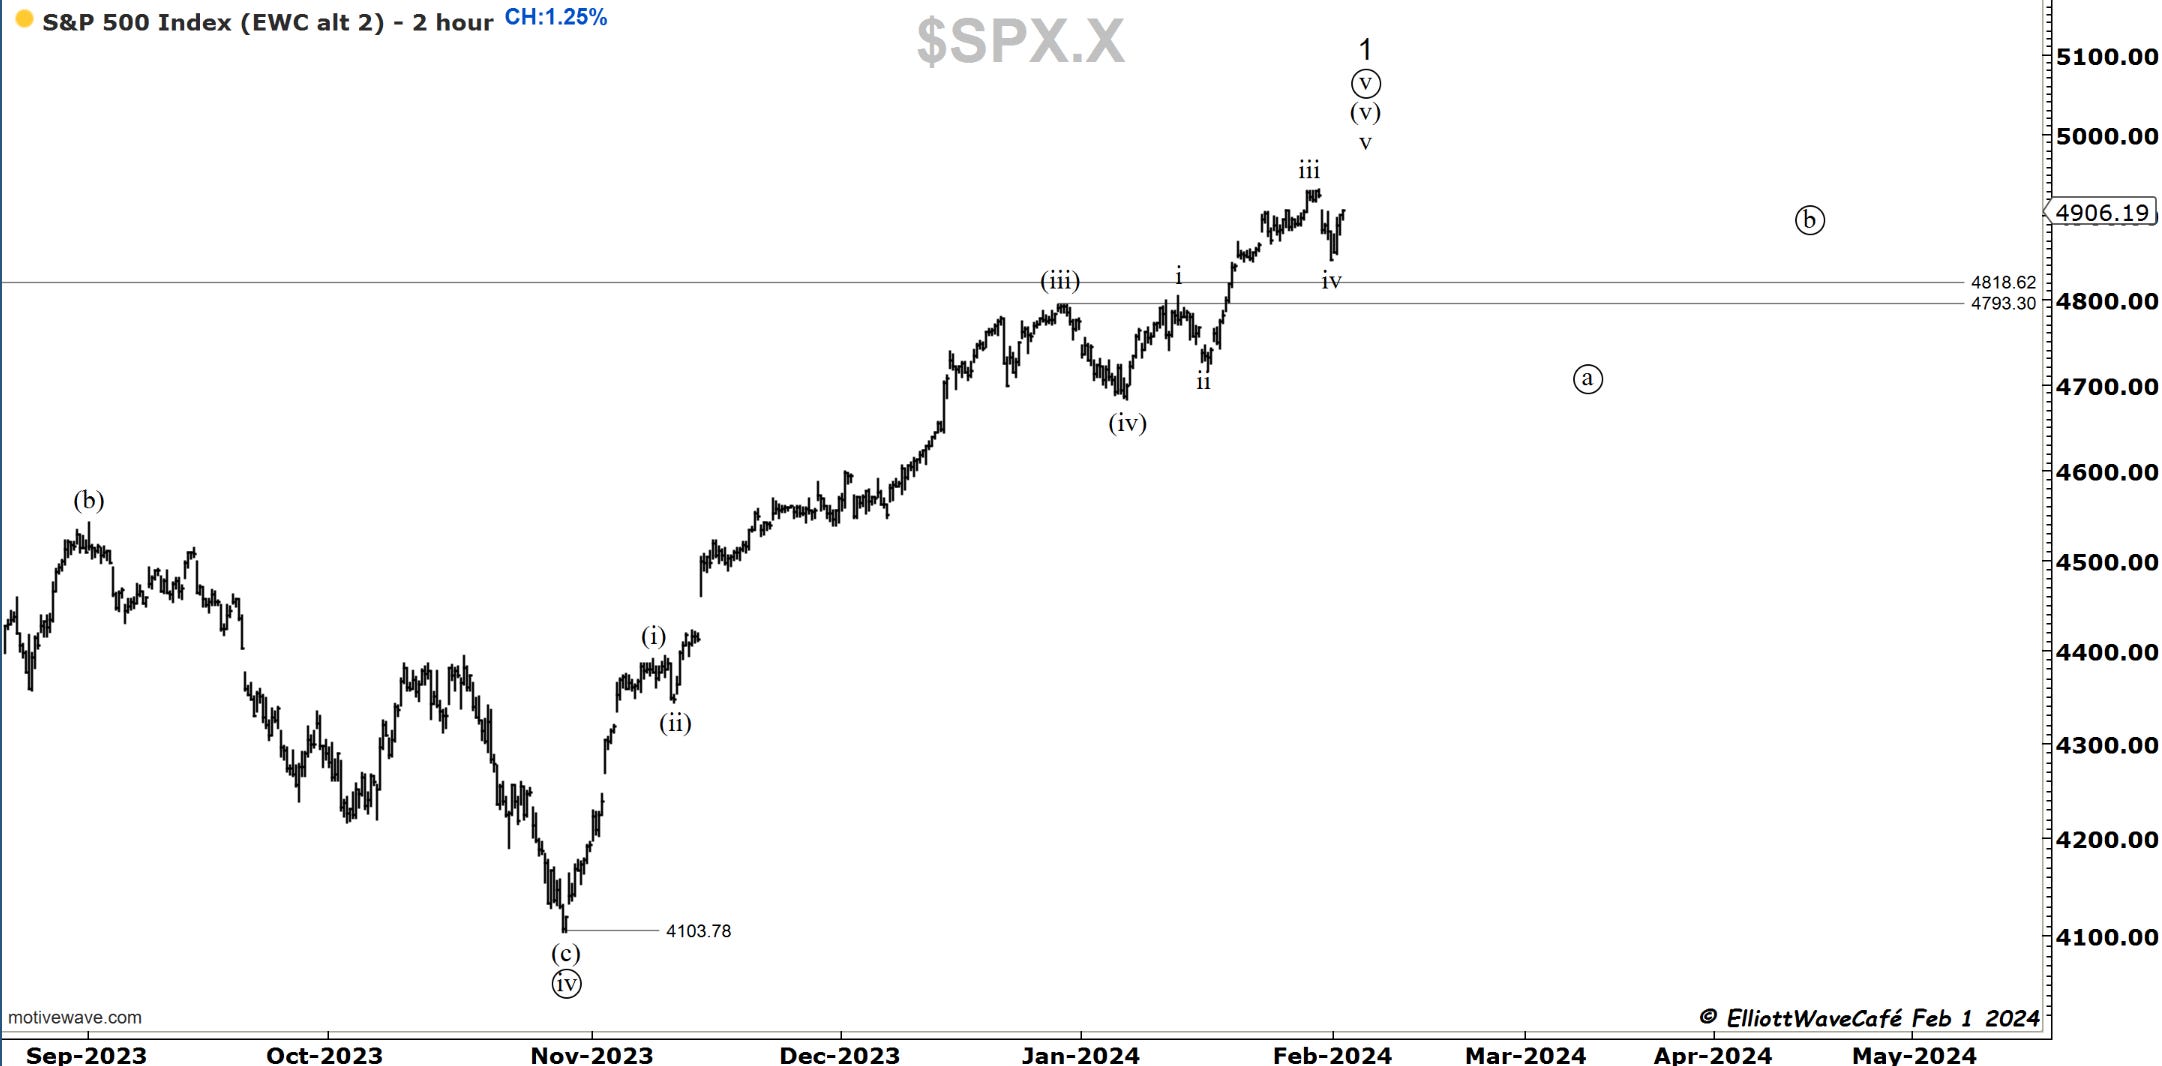
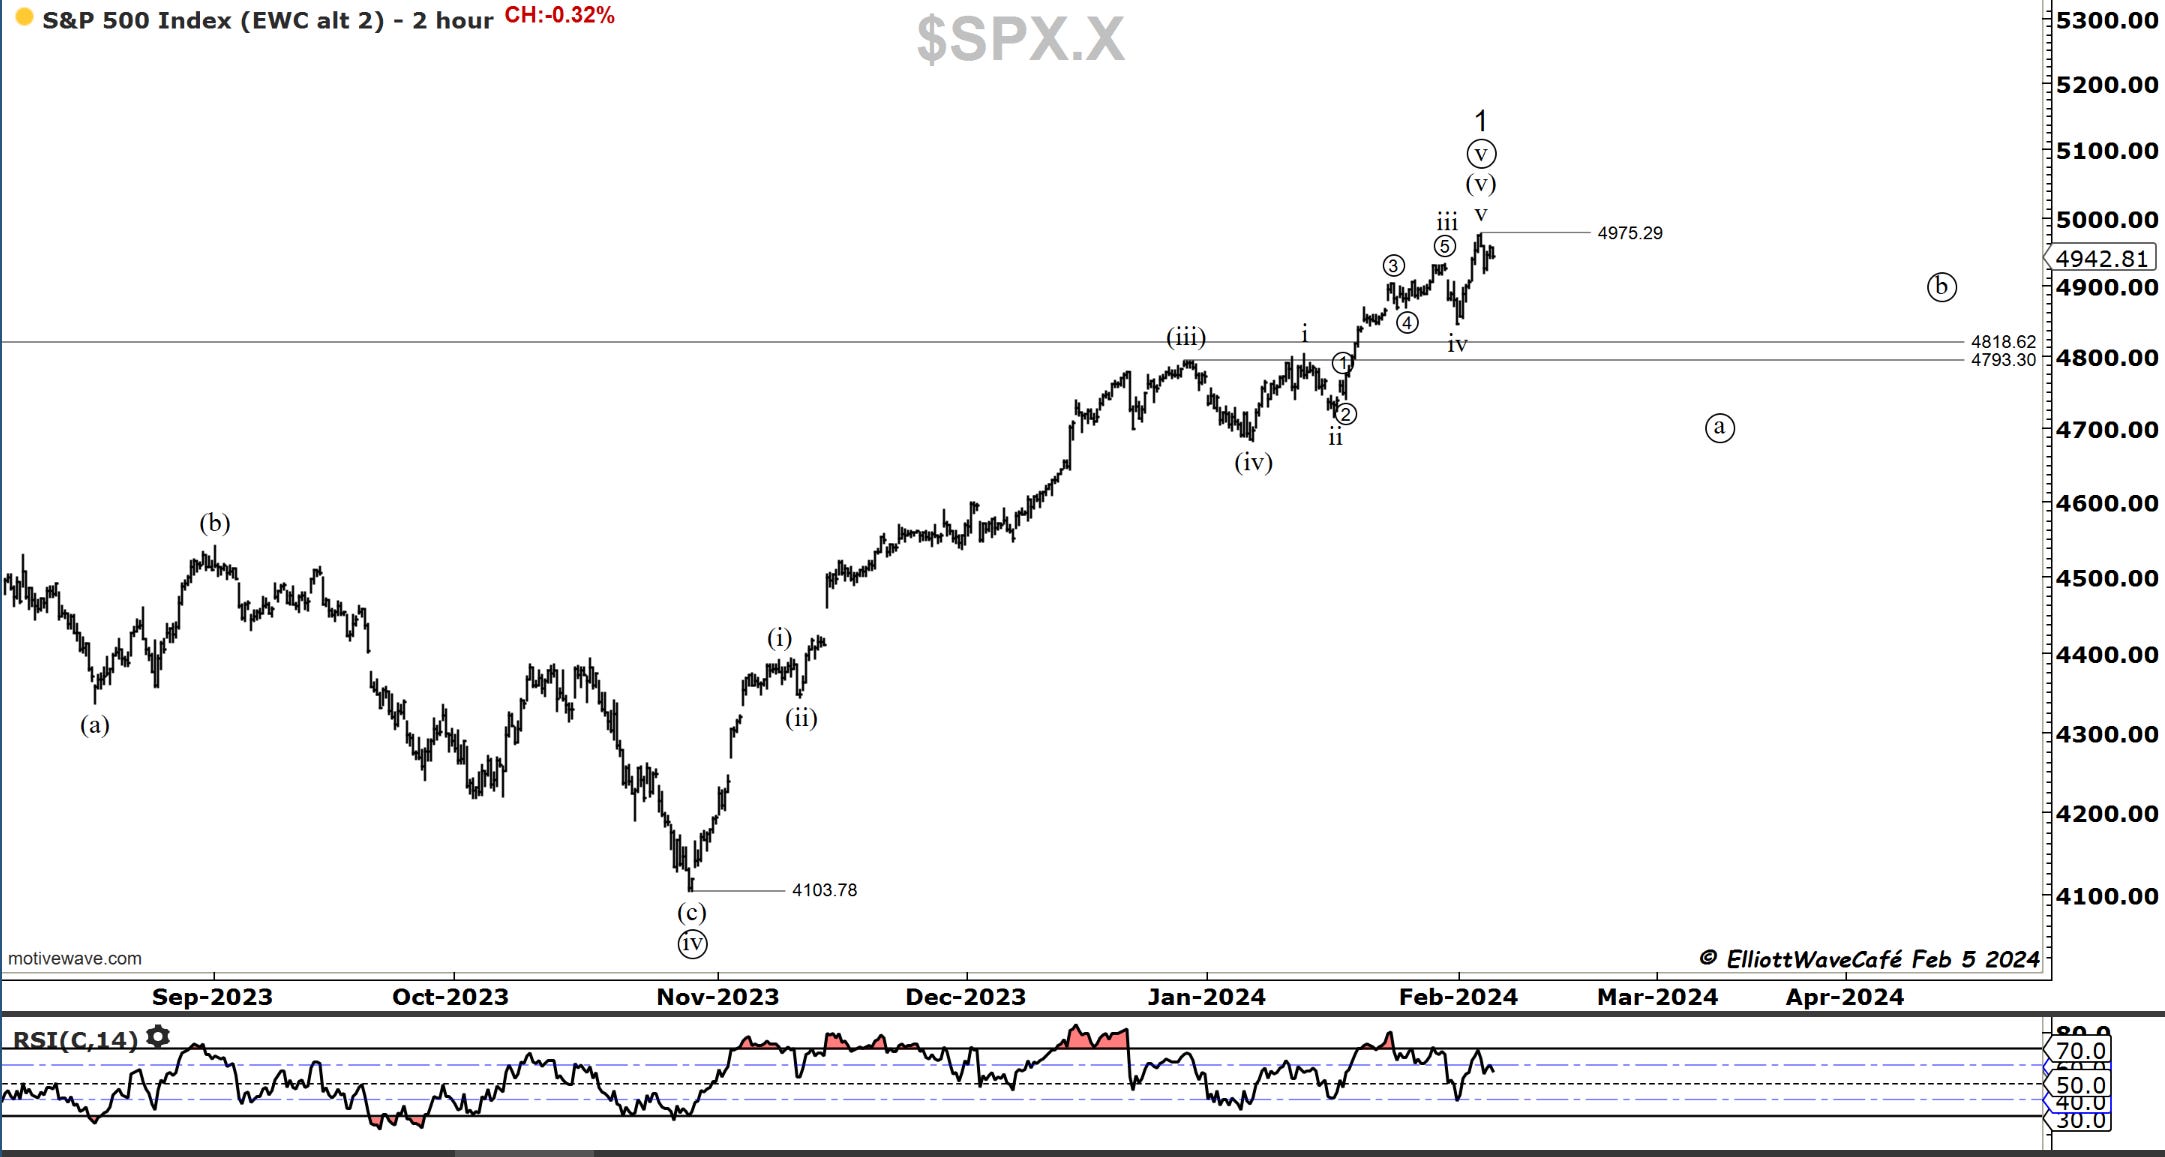
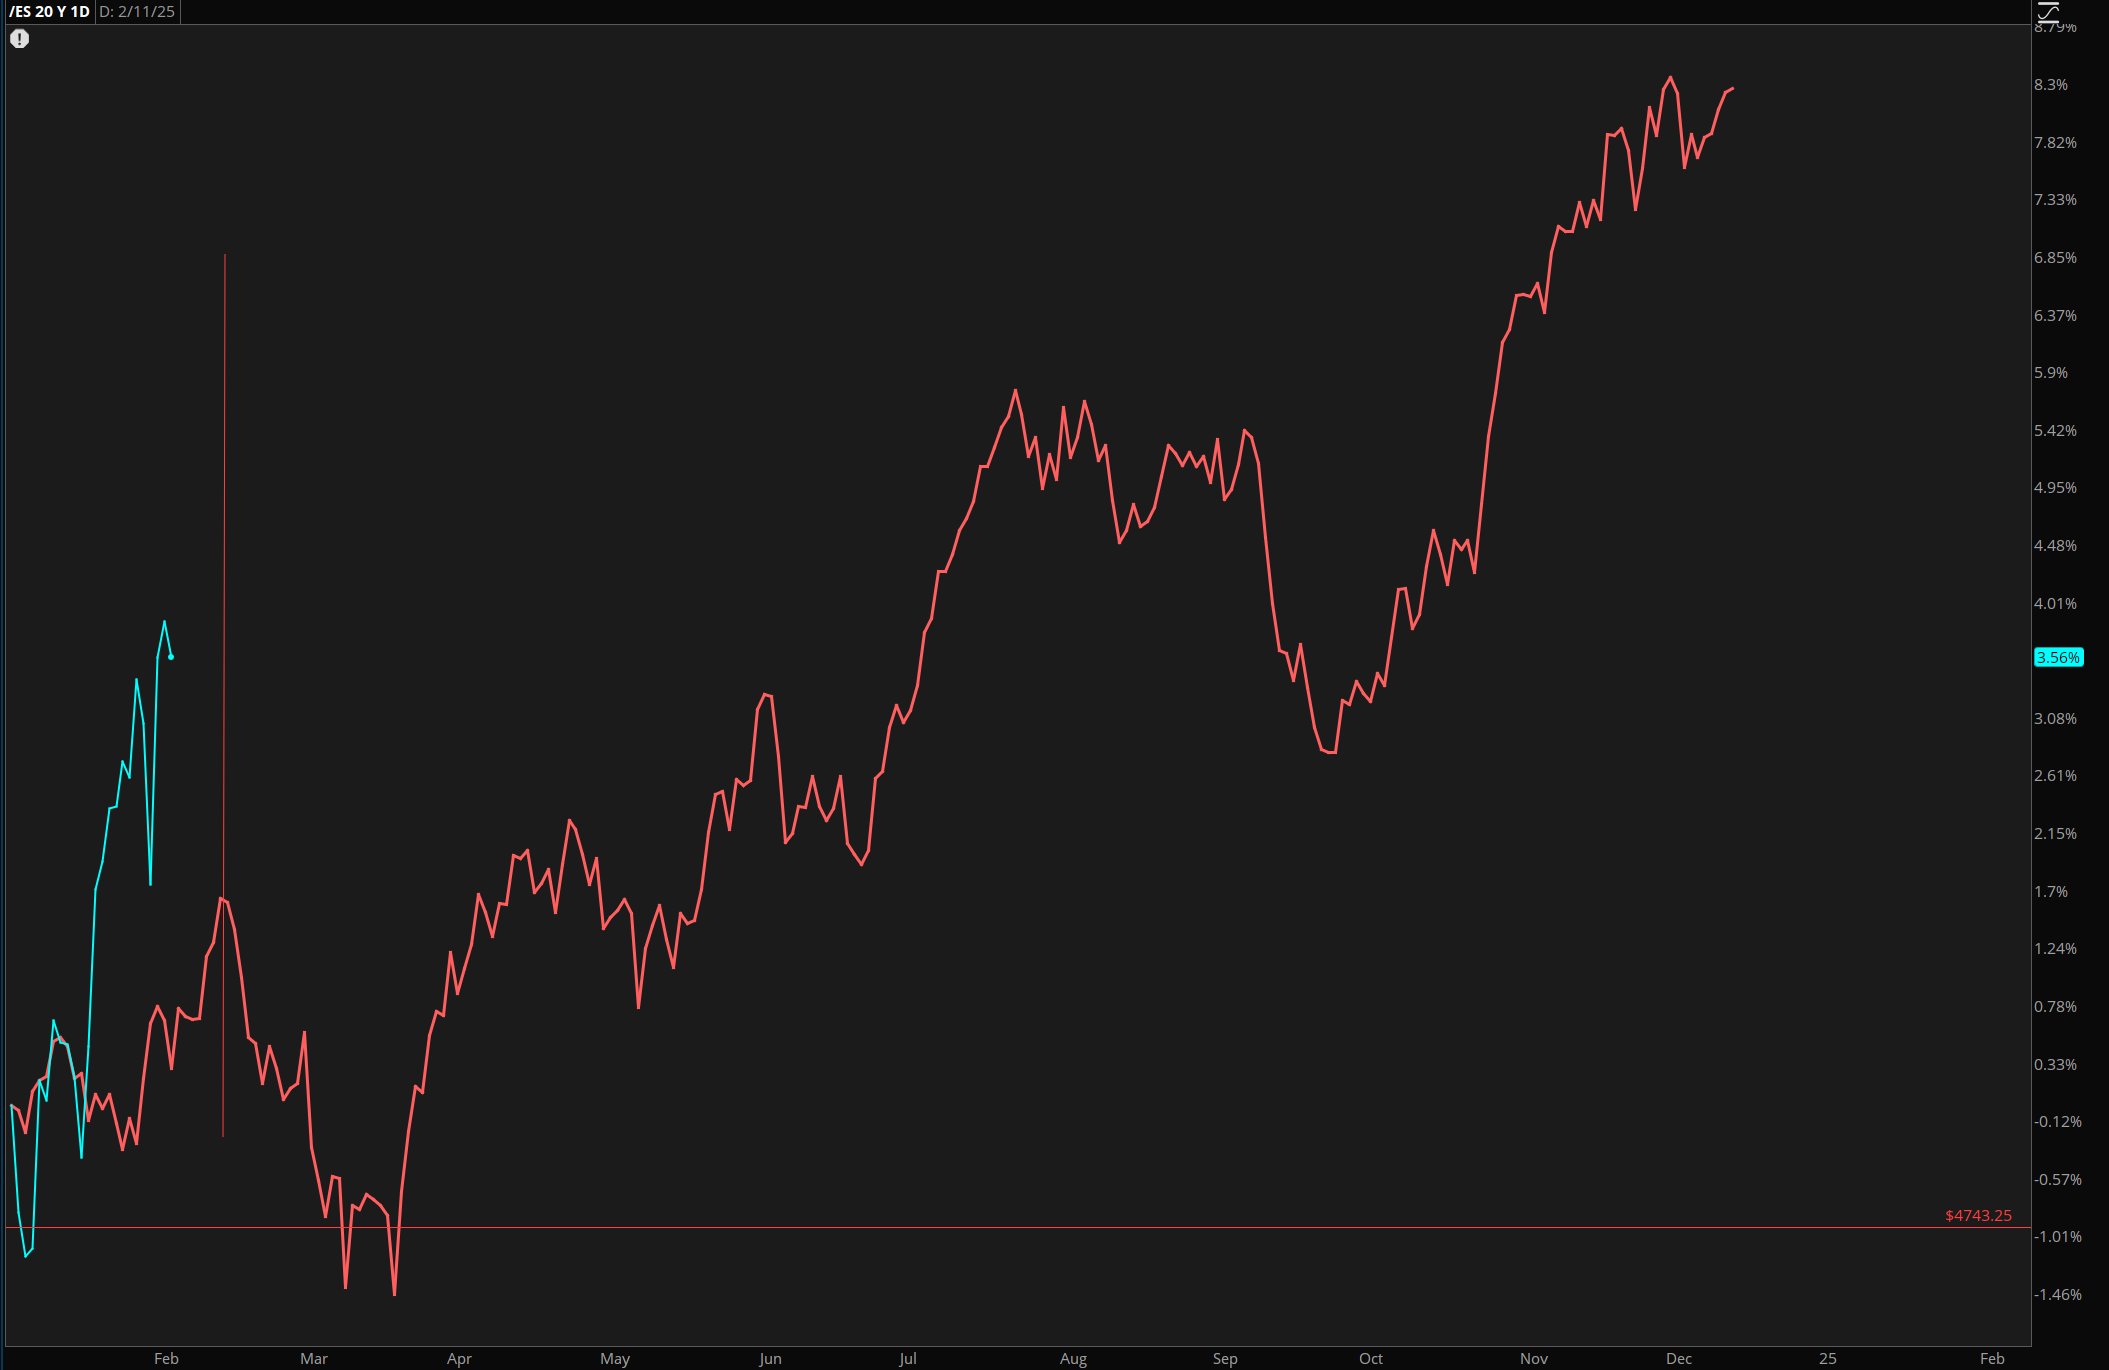
The strength of the job report on Friday last week created some initial selling on calls for lower chances of rate cuts, but then it quickly made a fresh new high towards 4975. This unfolded in line with the expectations for another wave up in (v). The markets pulled back into Friday’s close and followed with a bit more weakness today by failing to register a new high. On the NYSE, we had about 5 times as many declines as gains on decent declining volume. This deteriorating breadth has been a signature event for a while now. Few strong stocks continue to support the tape. In addition, both dollar and yields have risen strongly, supporting a case of risk-off mode approaching rapidly.

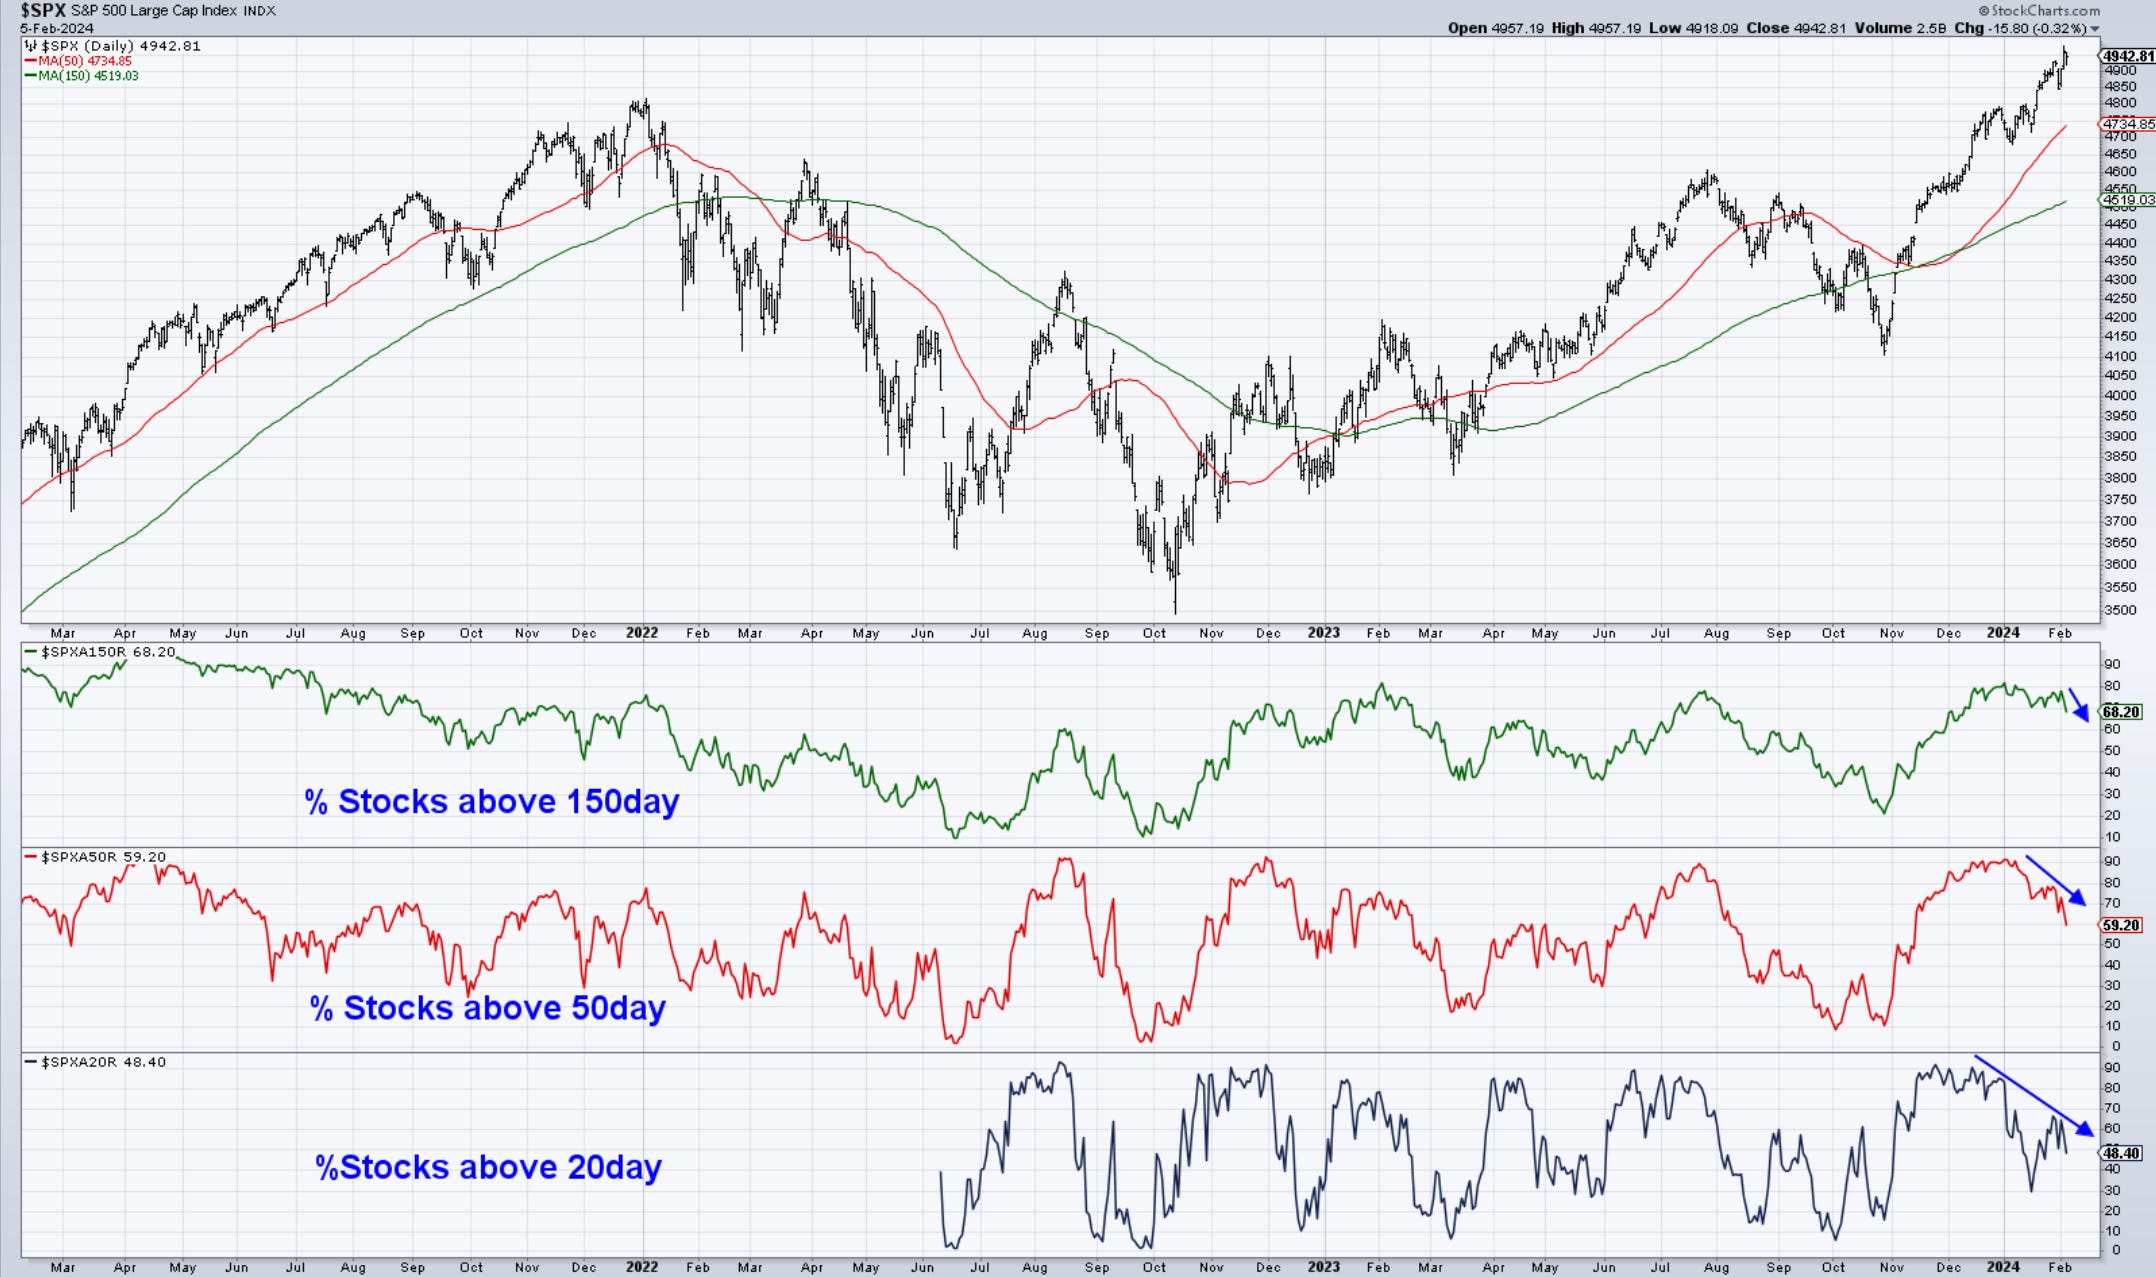
Problems with breadth can also be seen in the number of stocks above certain moving averages. The drop below 200 is starting to accelerate, while the 50day has now more and more stock below it. Of course, the SP500 has been climbing in its nominal value due to the increasing weight of top stocks. It is a bit of a distorted perception of the US stock market.
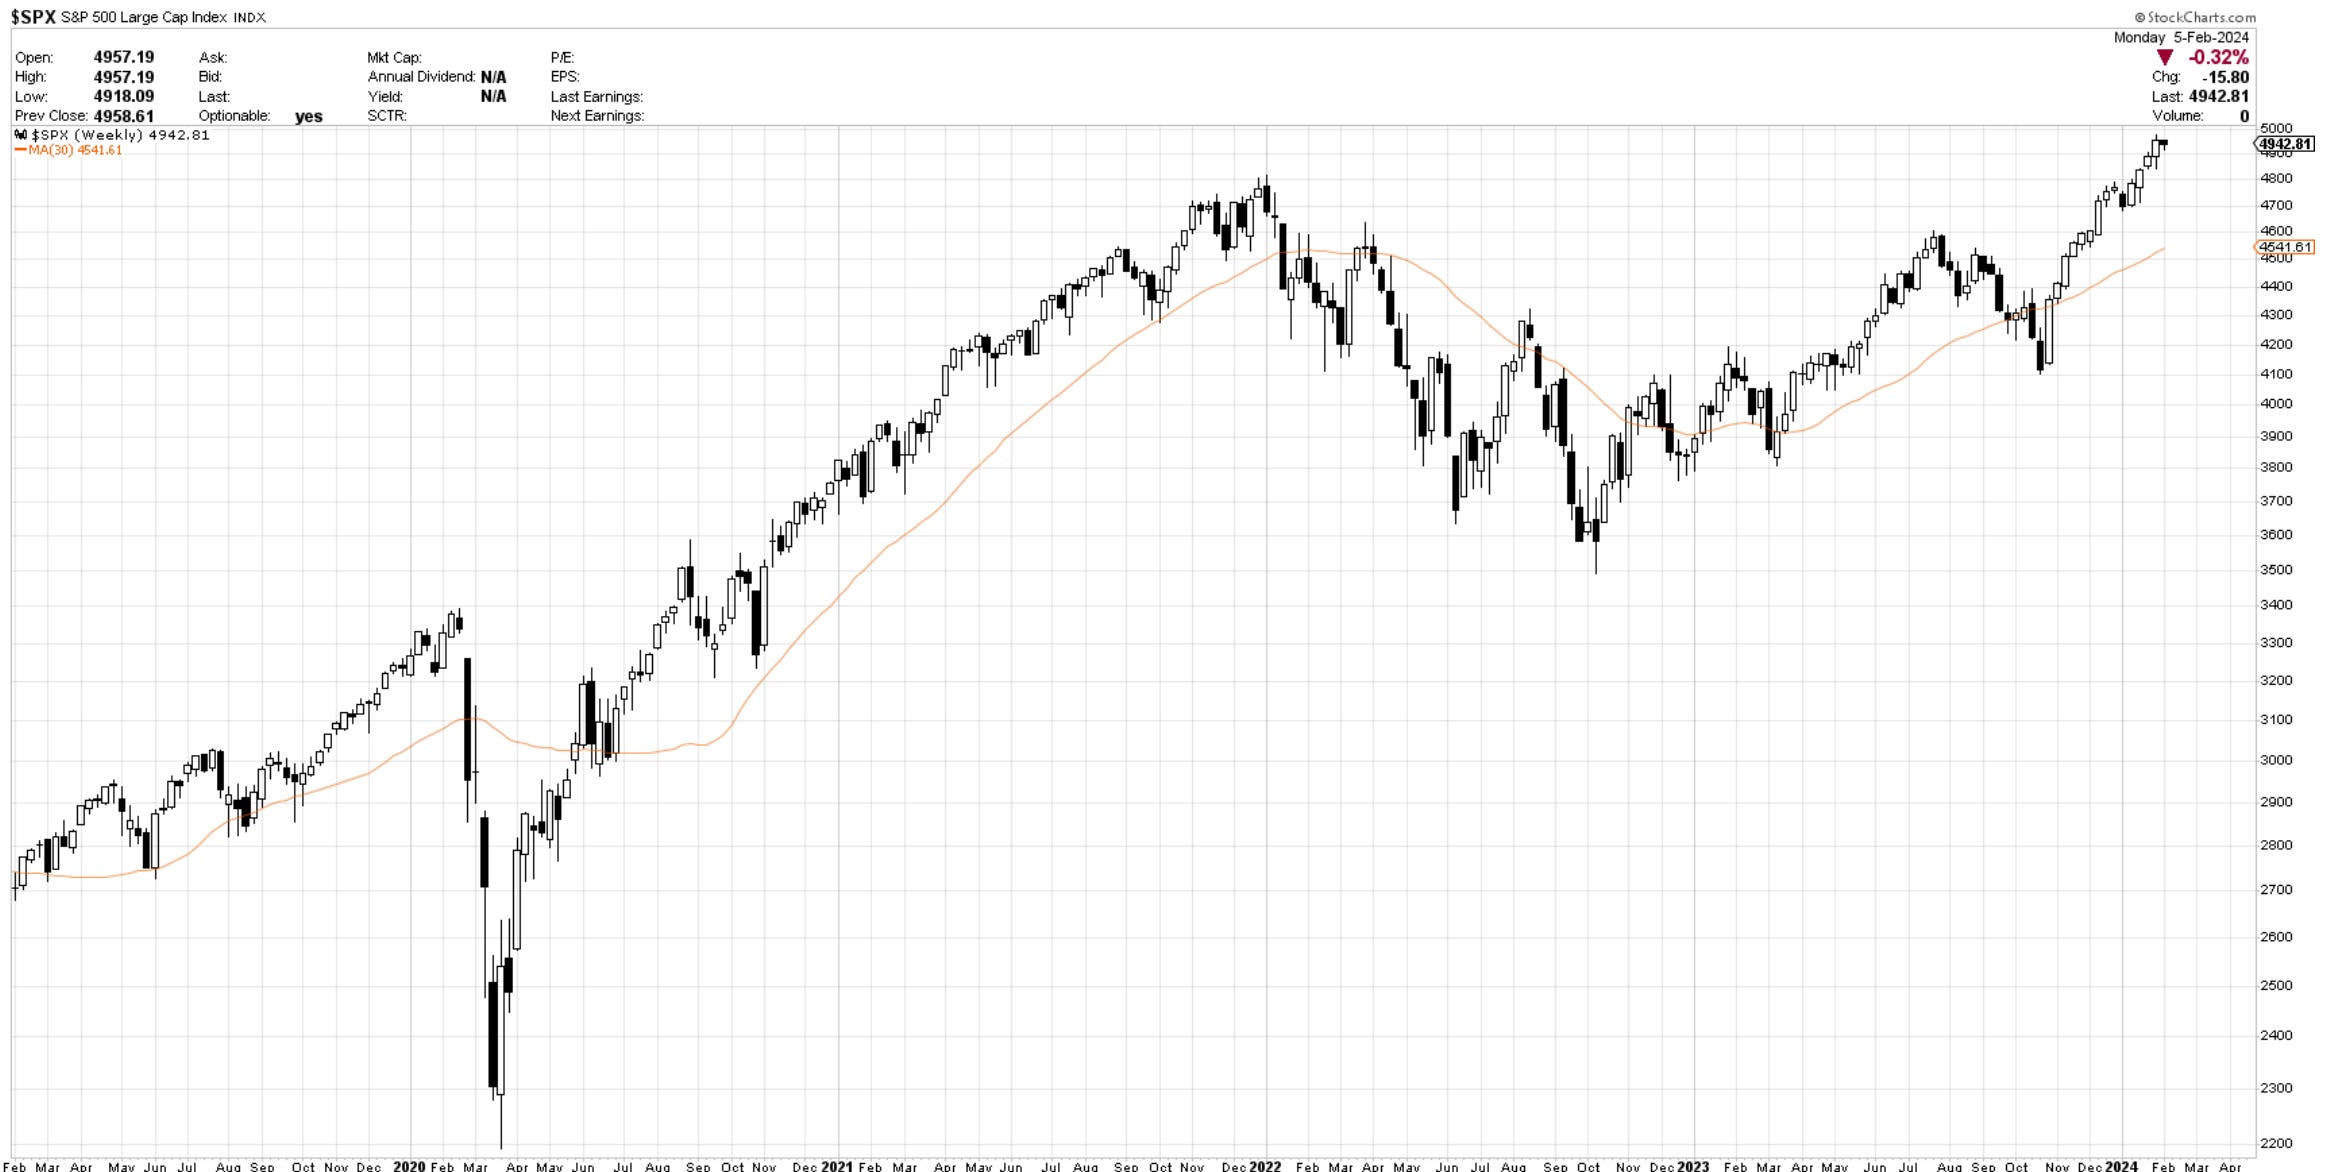
Pricewise, looking at a weekly chart of the SP500, we have very little evidence of anything correcting on the horizon. 4800 is the peak from two years ago. Getting below there is needed to get thinking about 4600, which would equate with a basic 7-8% correction.
When we look at seasonality, we are now roughly a week away from entering a period of historical weakness that lasts until the end of March.
01/30 - Channels are sometimes imperfect, but just a quick glance below suggests that the odds of a pullback would be higher than the odds of a continuous breakout. At this juncture, I would continue to be a trimmer, call seller, put buyer, and straight seller.
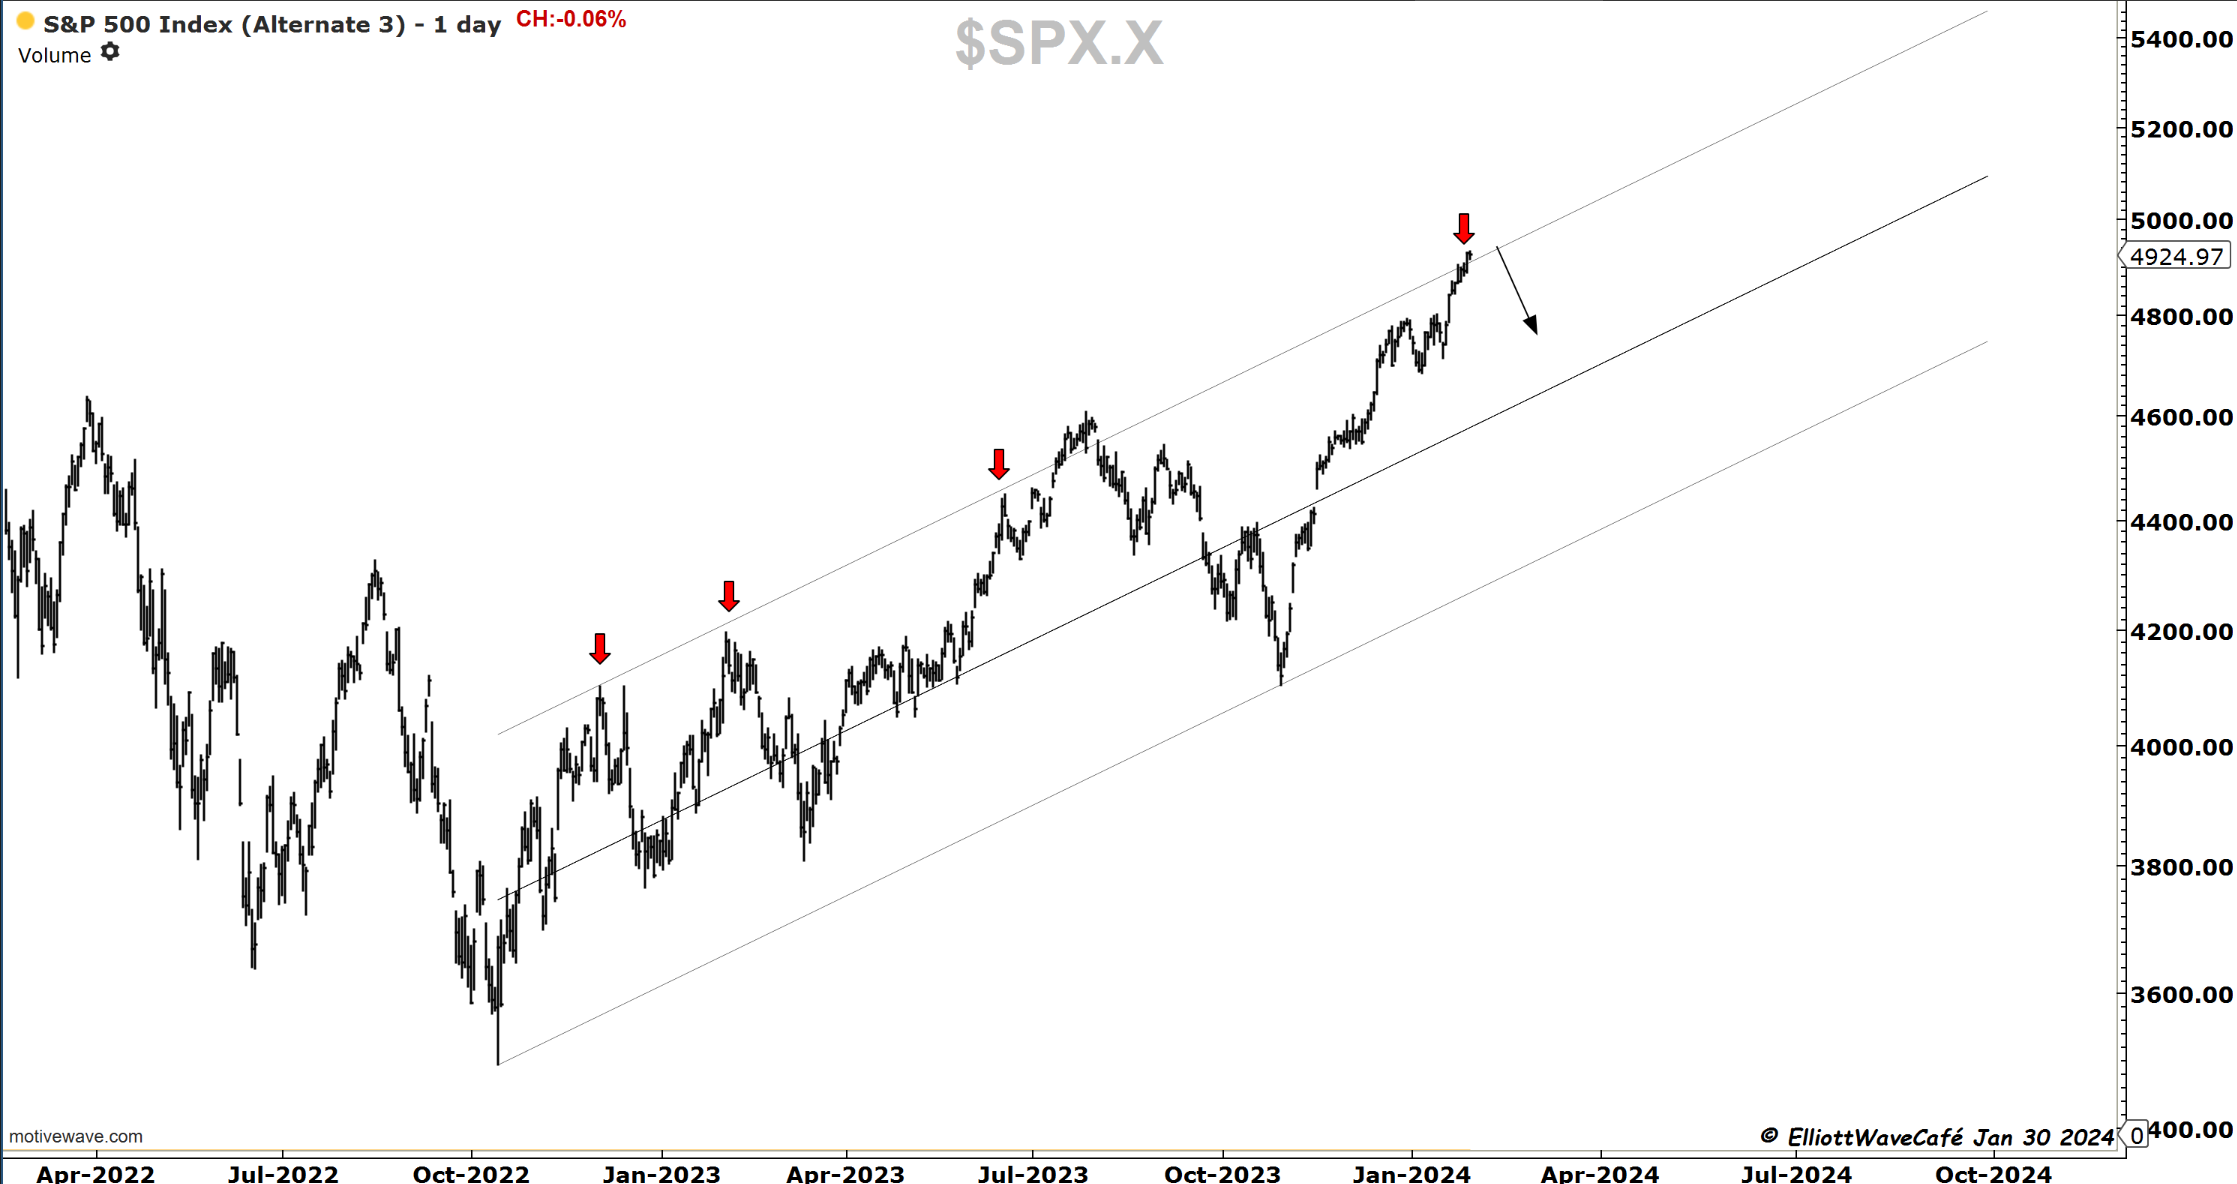
The bottom line is that I am wary of this market and its behavior at these highs. My bet is that we will see a corrective move unfold over the next couple of months. The pure price evidence still remains inconclusive and will remain so until we break some of the key levels mentioned.
Nasdaq100
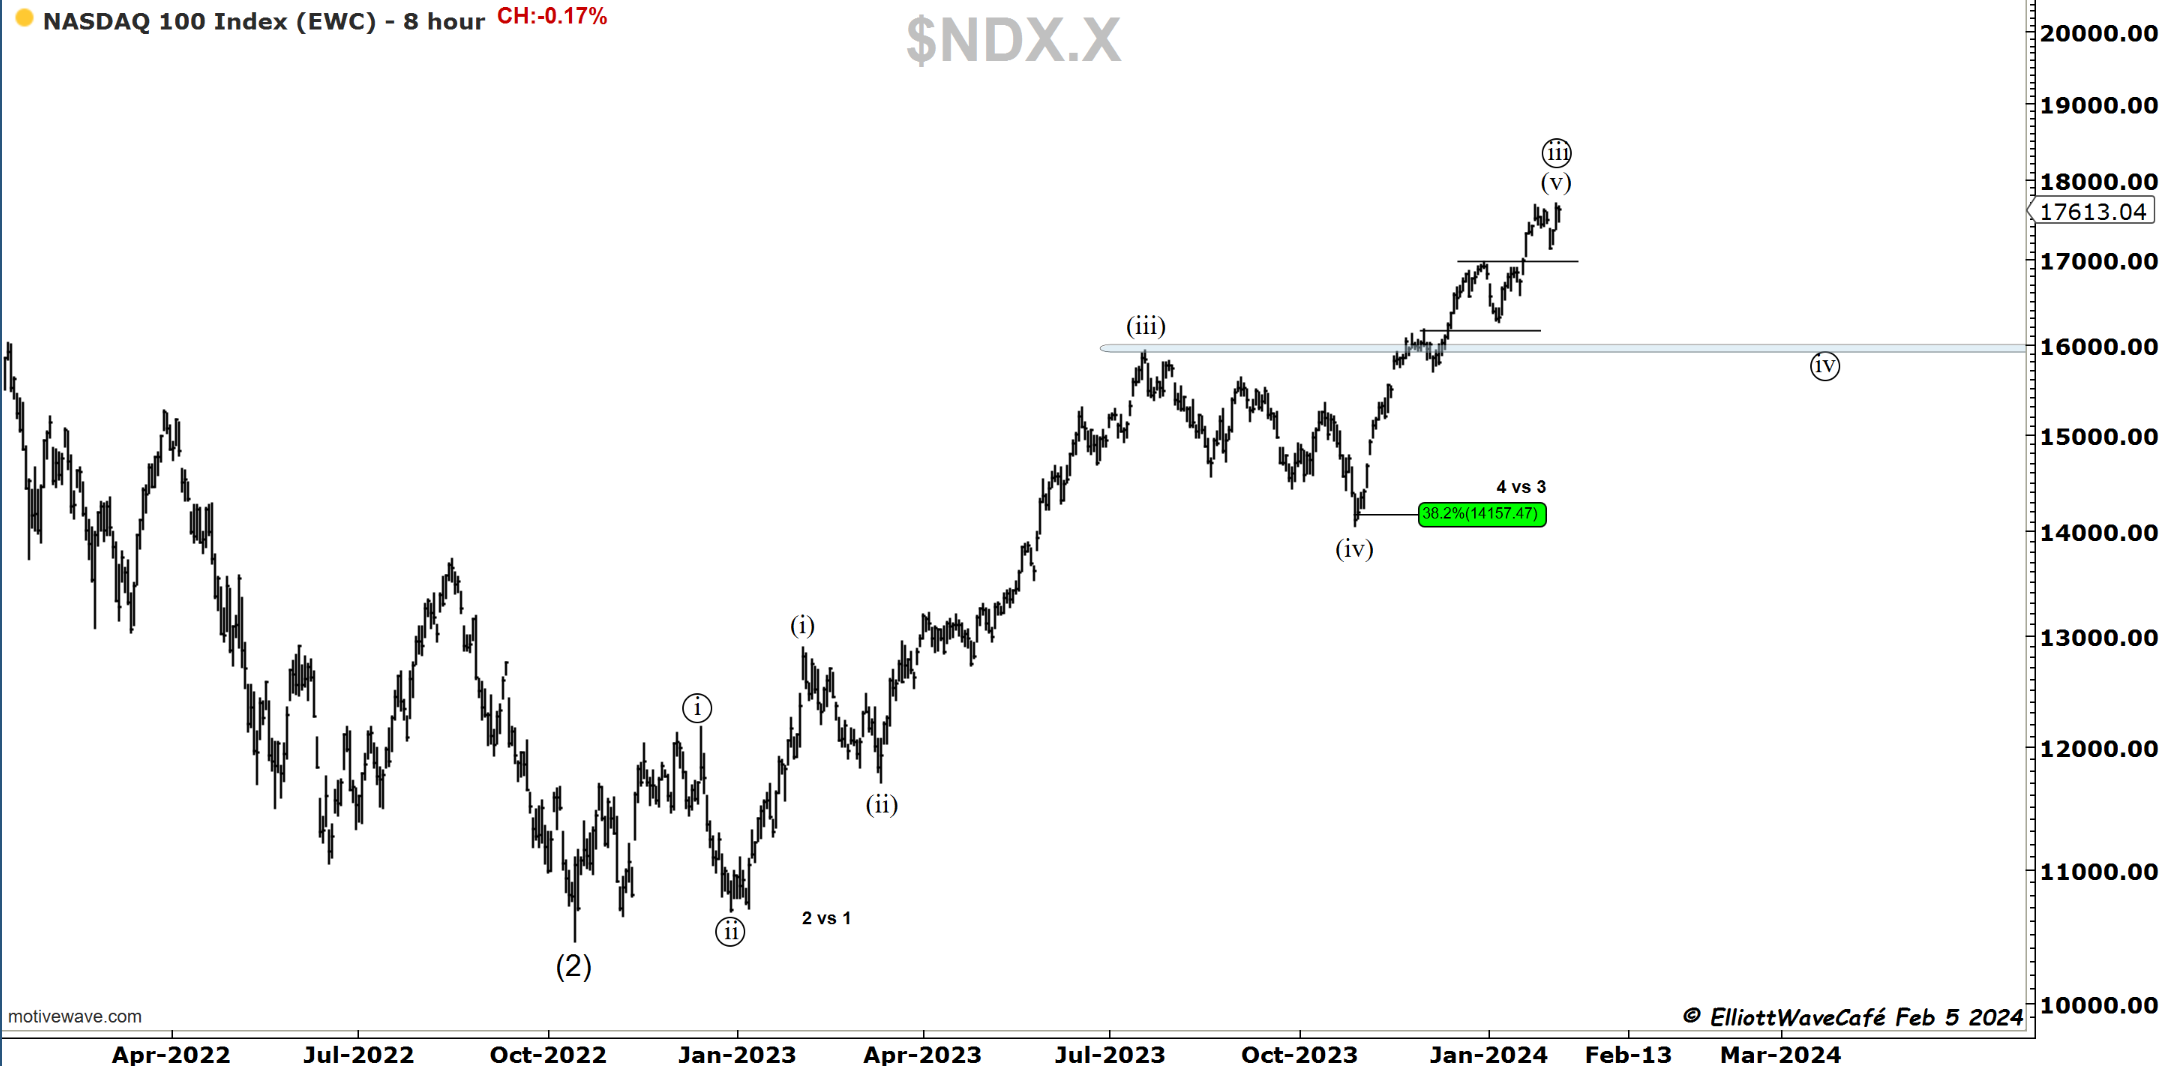
In the Nasdaq composite, we had about 3 times as many declines as advances, with the market closing down -0.17%. It has been about nine days now since this index was able to stage anything significant. My count remains focused on the completion of a wave (v) to be followed by a correction towards 16000. A higher high and higher low tape continues to be well defined.

RUSSELL 2000
The Russell was the weakest today, an act clearly seen in the number of stocks declining above. That failure to break 2000 is now taking its toll on price as we’re approaching the lows from Jan 17th. Not holding here and dropping below those lows will make securing wave ((i)) top much easier. 1830 would be the next level of importance for markets.
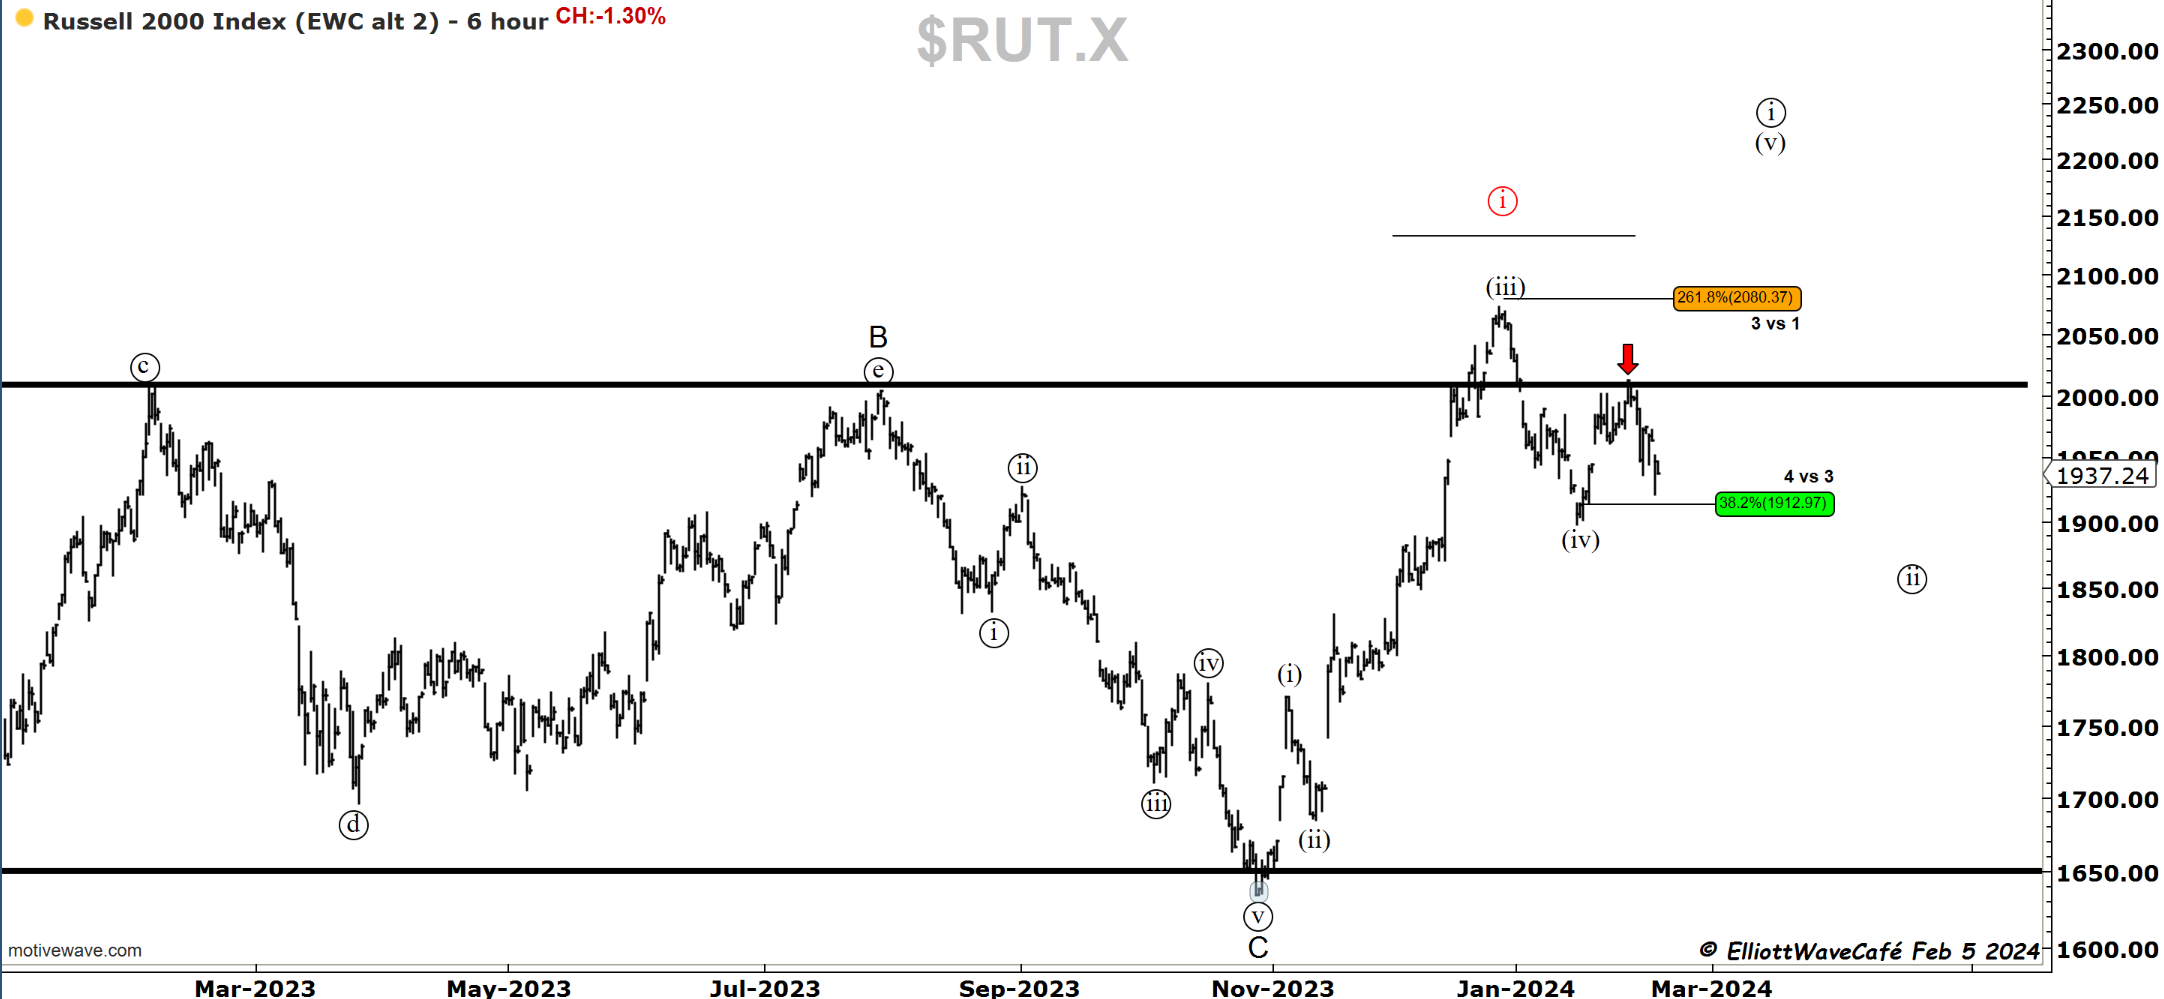
I want to give you something to think about as an alternative to the bullish view on small caps. The chart below depicts a corrective move unfolded in wave (X), and it won’t be until a final flush in wave (Y) that this market will truly become ready for upside primetime. Looking at the chart, this happening is not at all out of the realm of possibilities. We will keep this on the back burner and monitor it closely.

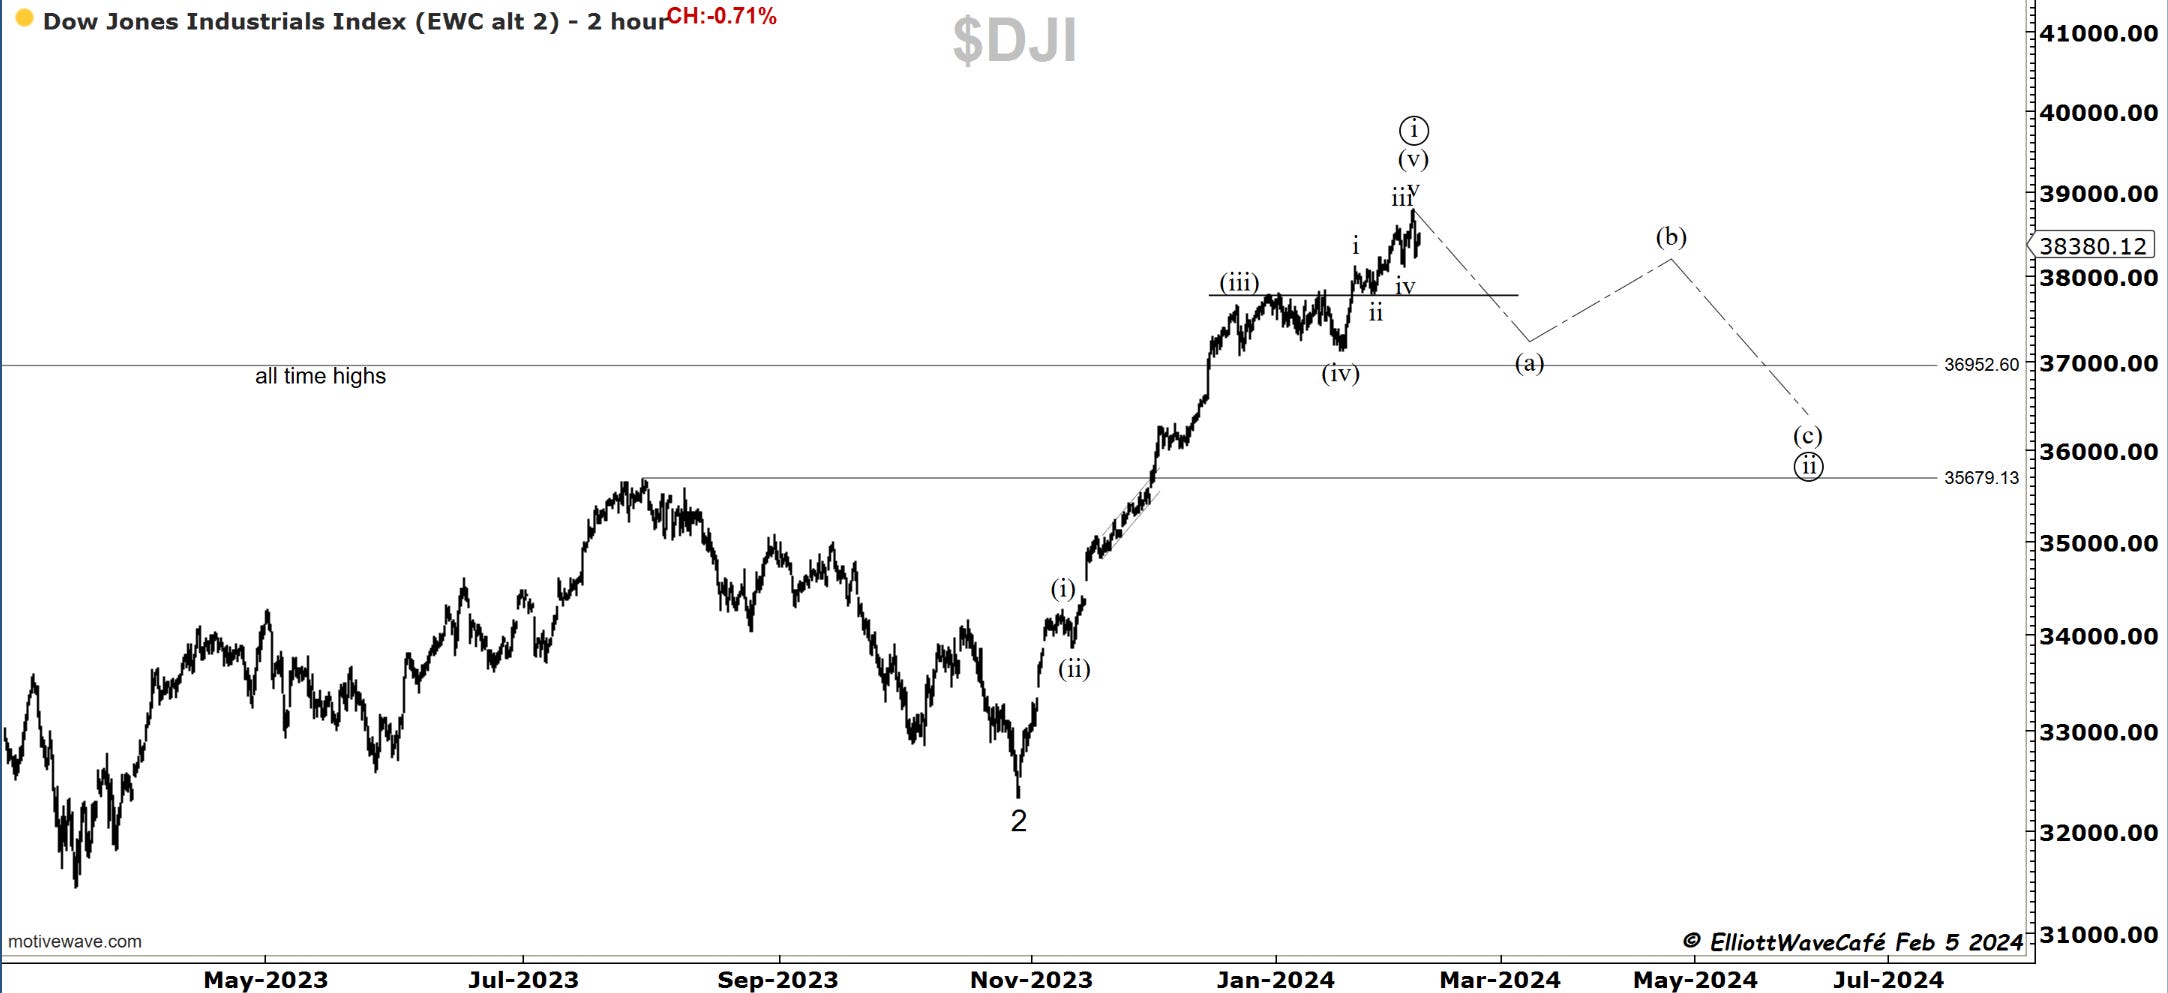
Dow30
Dow continues to hold in a higher low tape, but it looks truly tired. If it loses 38,106, we can quickly see 37,800 where the stronger gates are. That wave (iv) stands out more and more as the correct labeling.
US Dollar and Yields
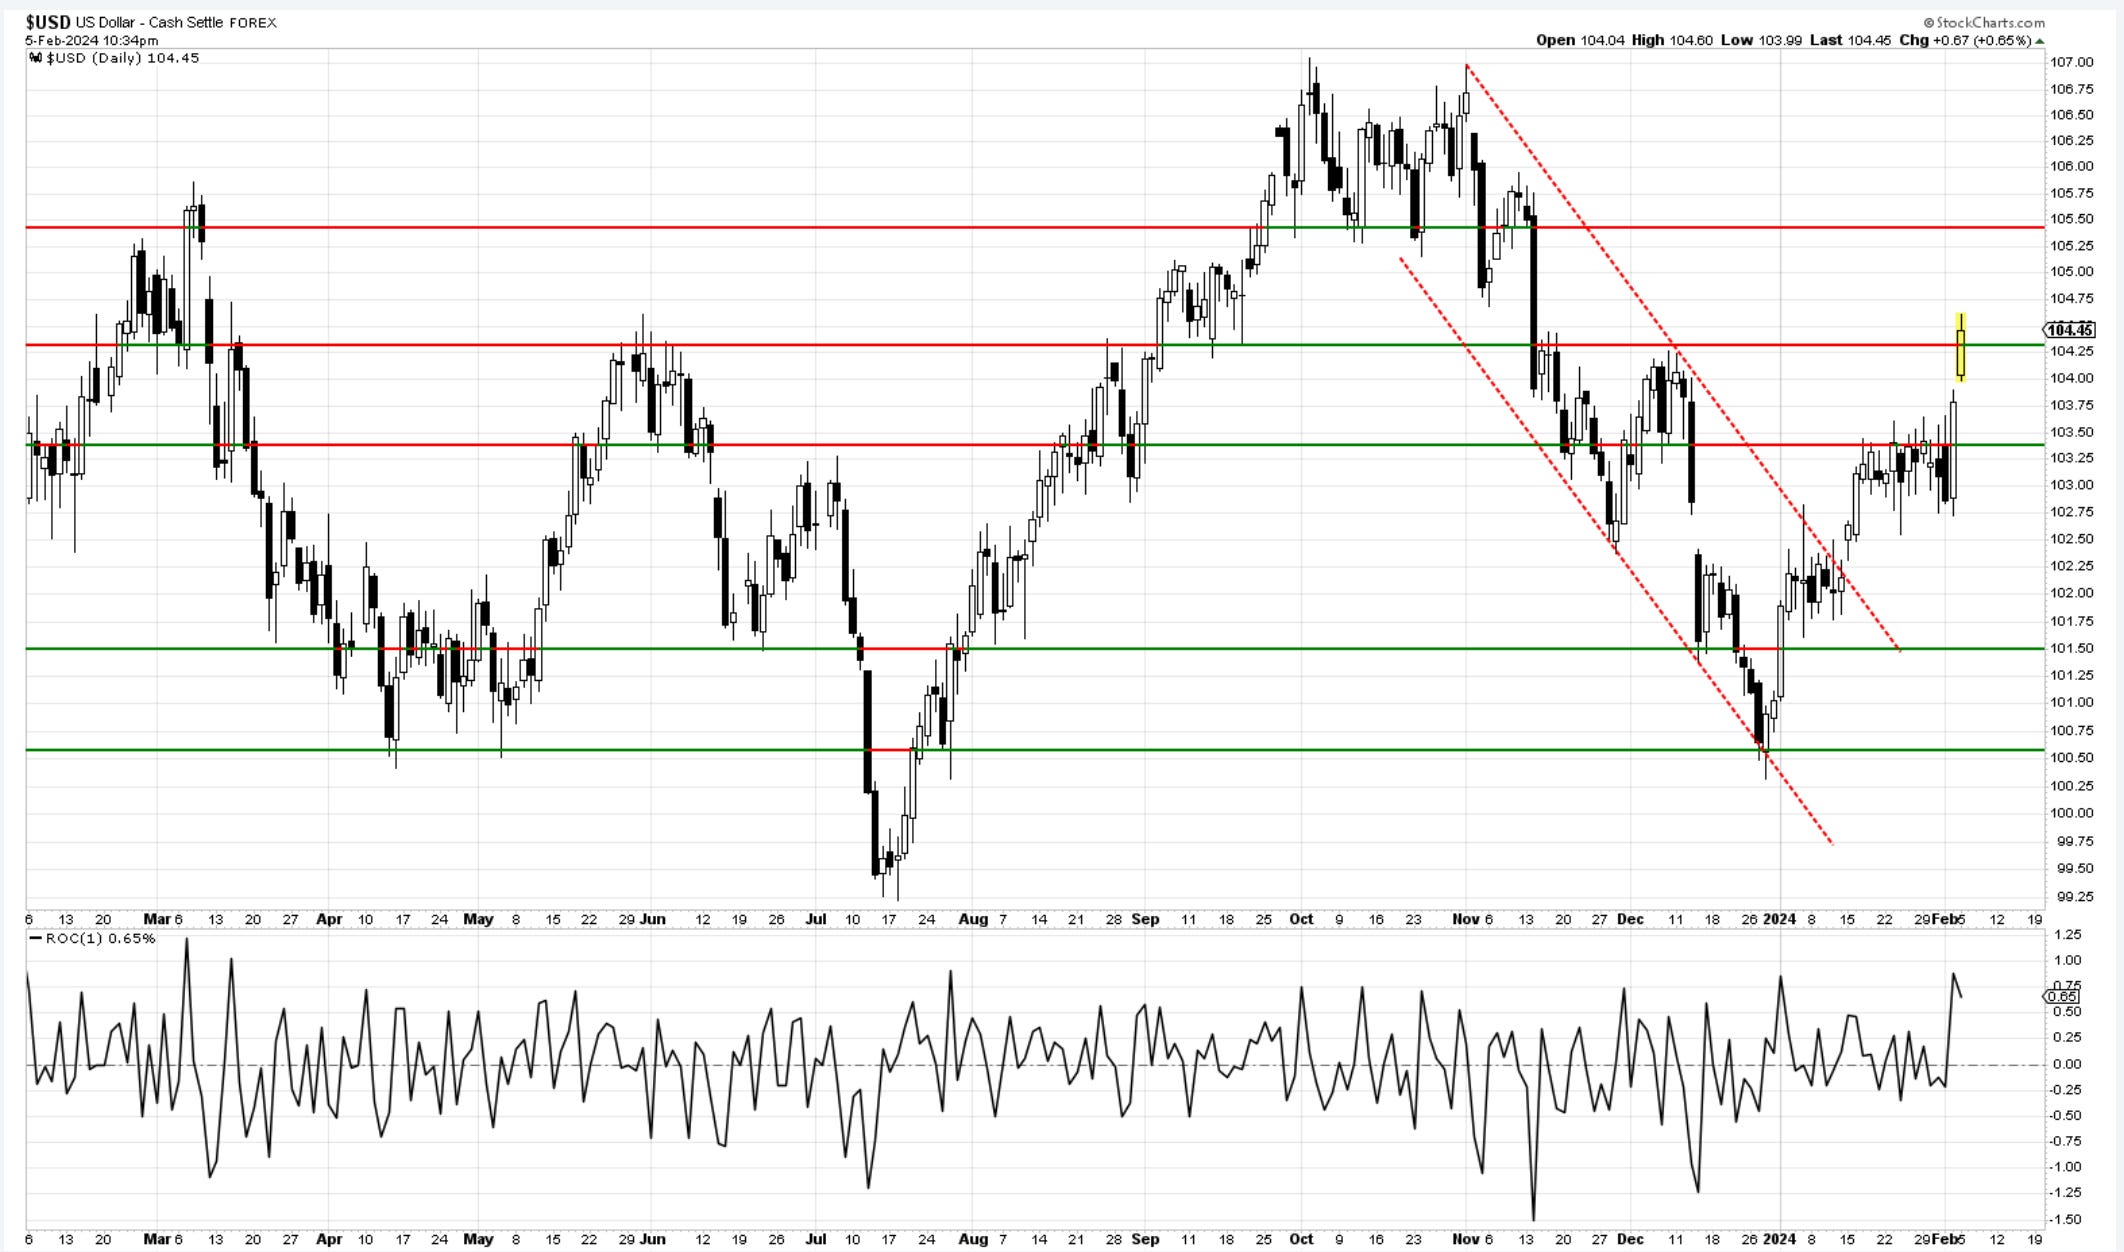
The dollar liked the NFP report on Friday. It shot higher and broke above that messy consolidation we observed last week. Today, there was more following, which adds to the significance of the breakout. In the currency world, rate differentials are a big deal. In simple terms, if the Greenback offers more yields than its counterparts, then money will flow to it. How do we calculate this? By looking at central banks around the world and seeing where they are in their monetary cycles. With Fed not needing to cut rates right away and Europe maybe needing to, the Euro will get dumped in favor of the dollar. Interestingly enough, since end of last year, both the dollar and stocks have been moving higher. This temporary correlation is unlikely to last much longer. In even more simple terms, the cost of money is going up.
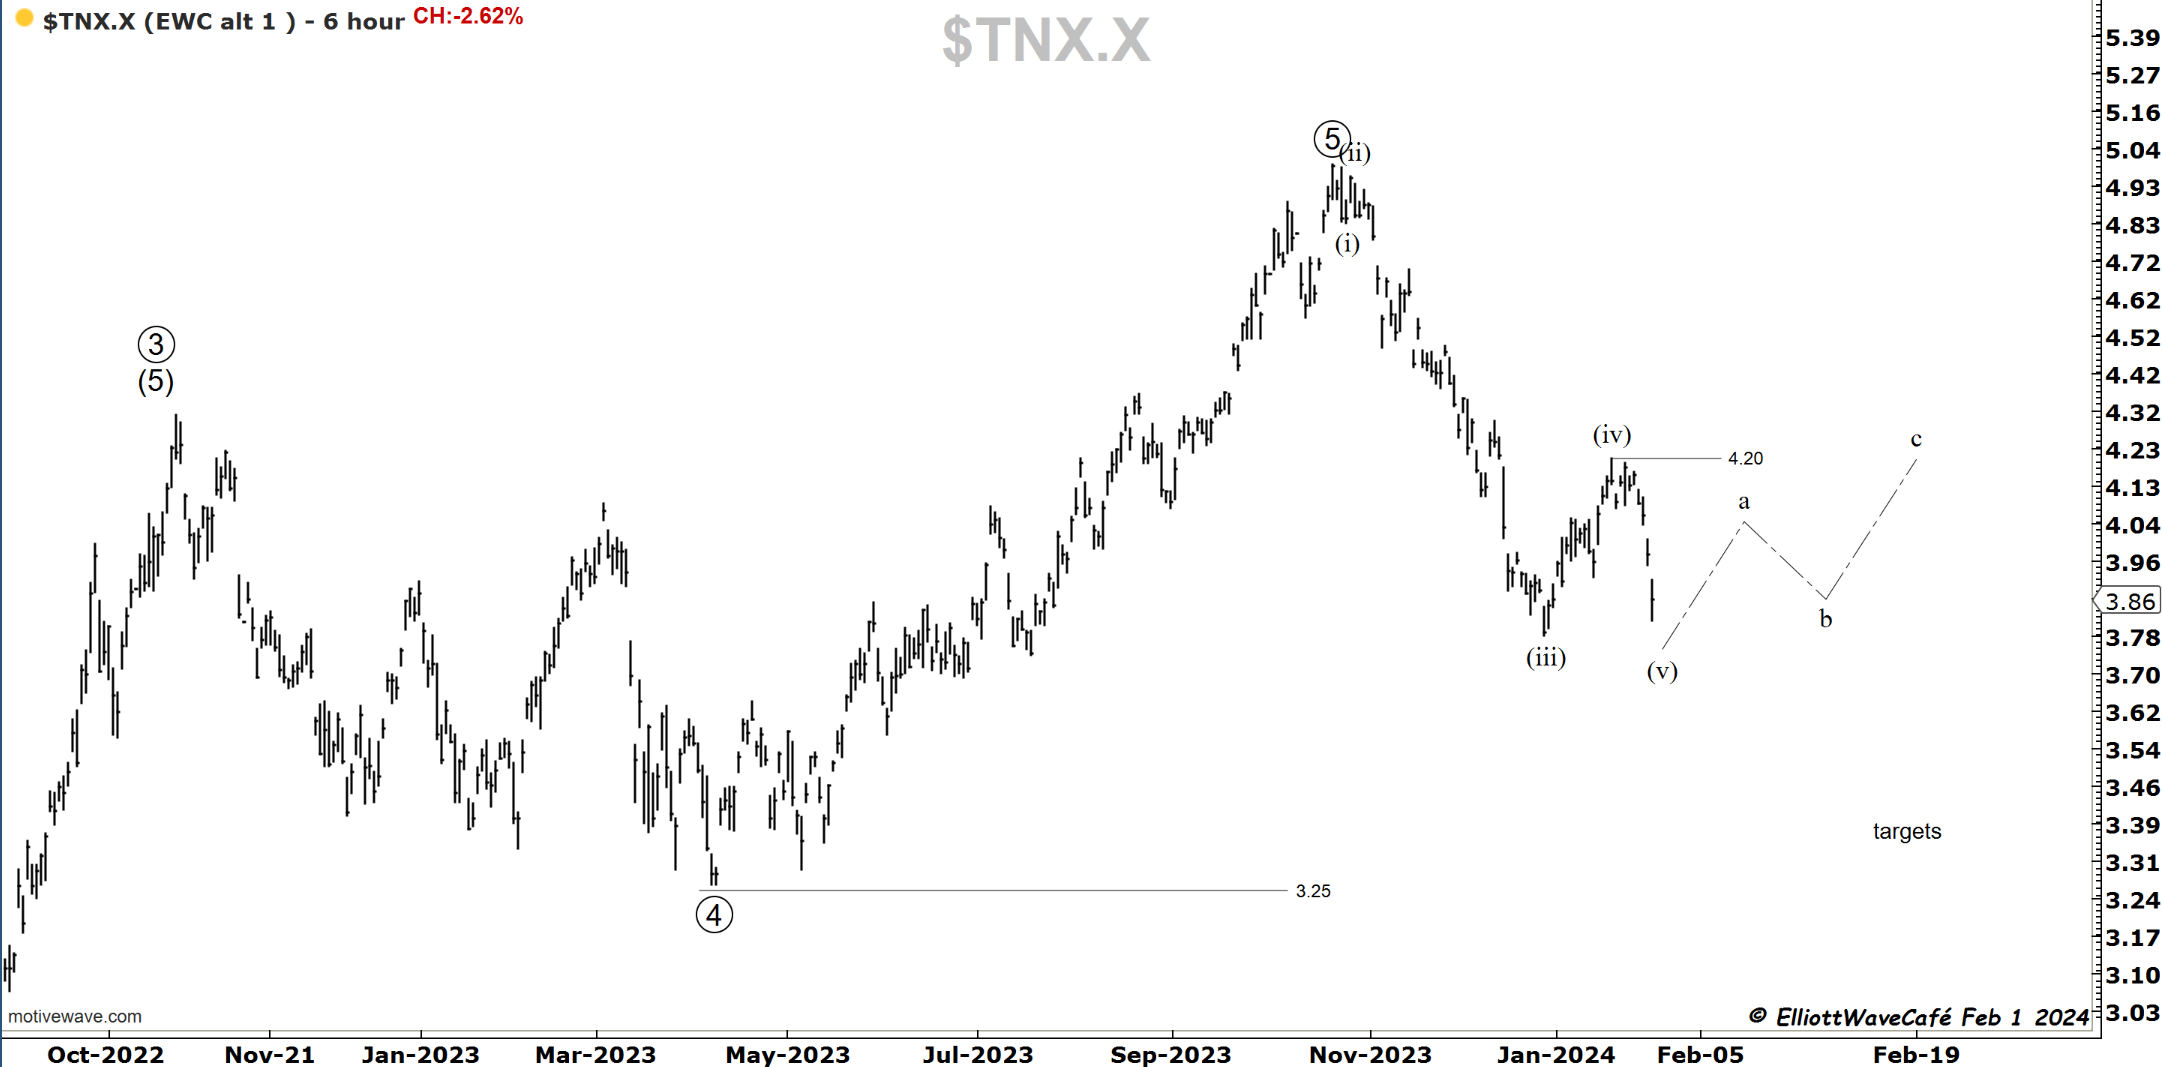
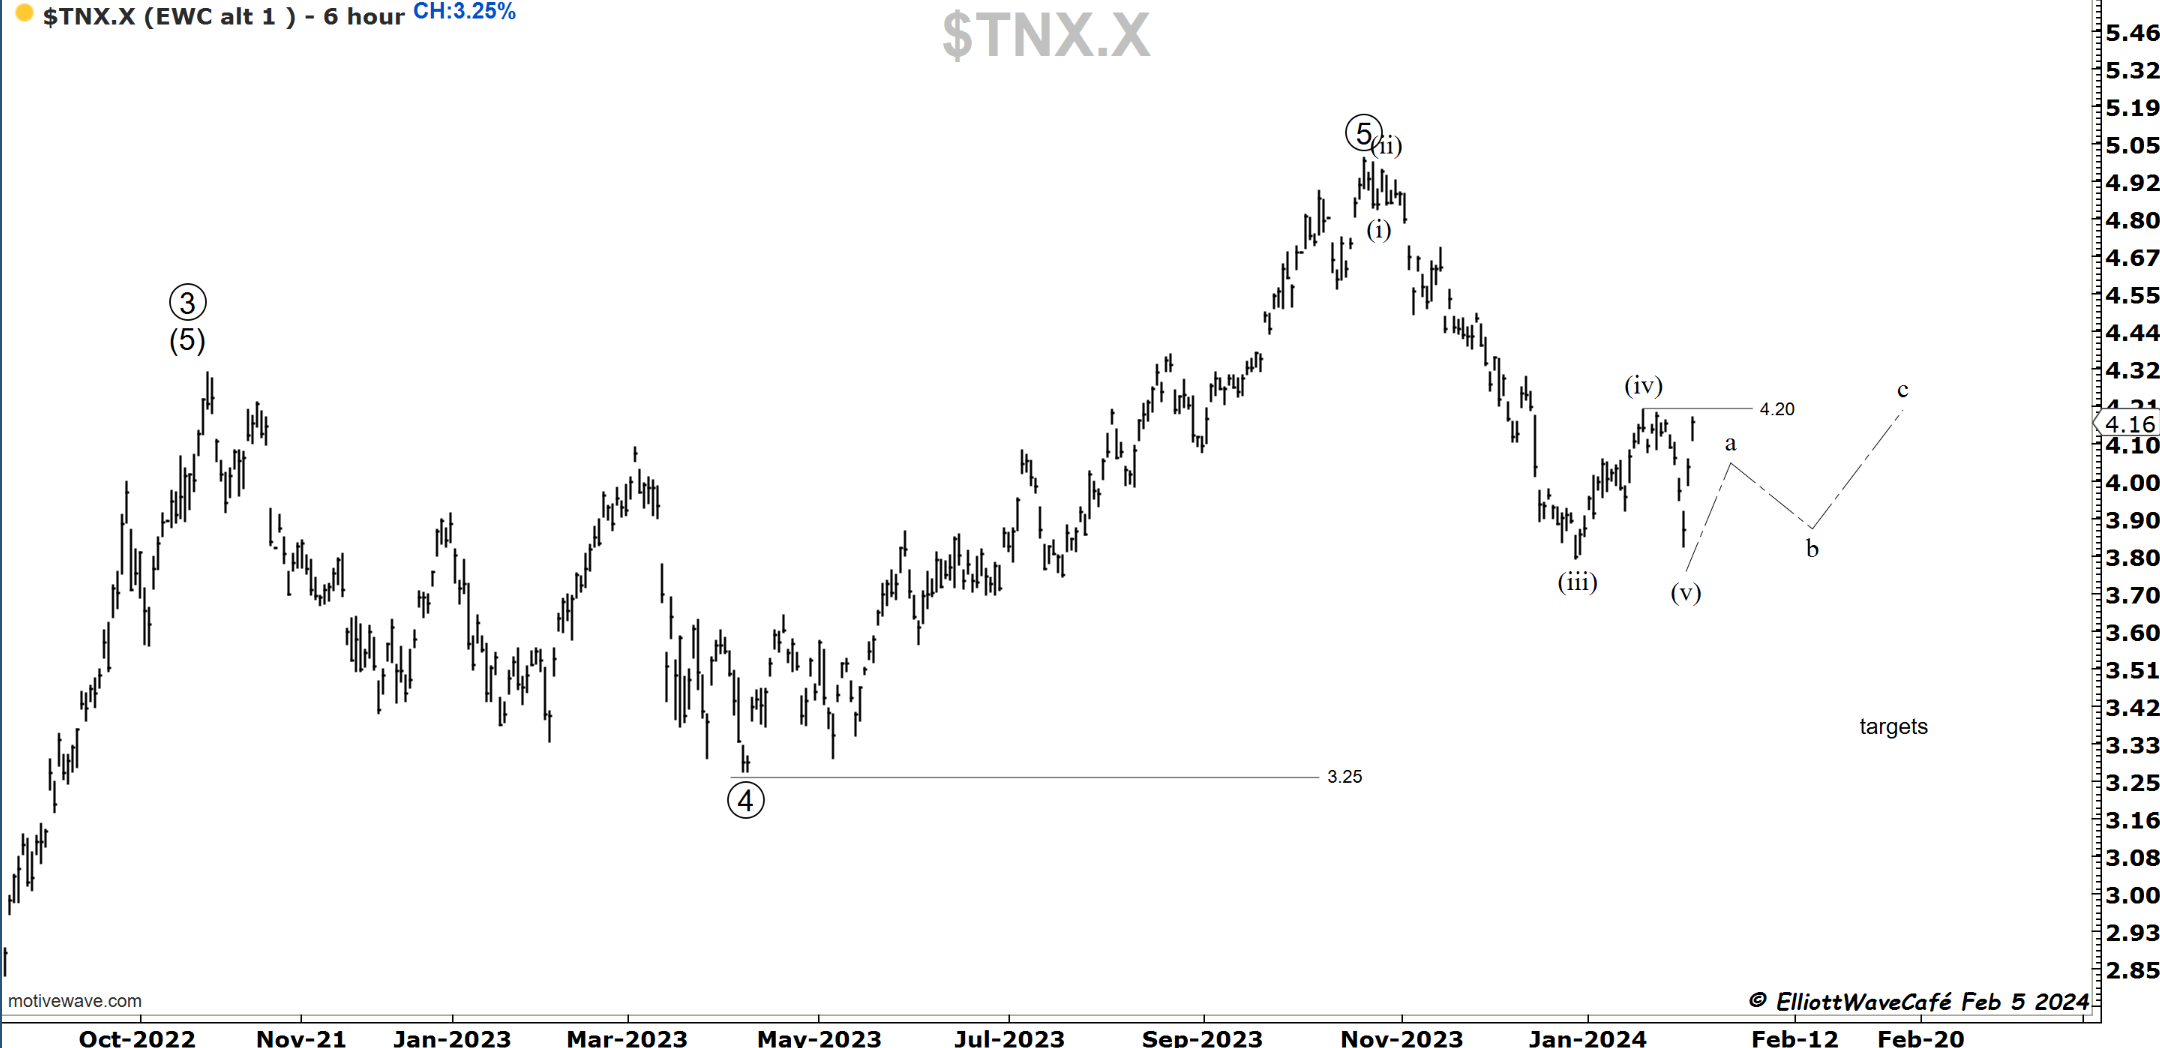
Speaking about the cost of money, take a look at yields and the two charts below. My anticipation that a wave (v) was likely at hand proved timely, and yields rallied back to 4.16%. Previous comments are below.
That was indeed a 3wave rally into 4.20. I thought it was going to be running slightly higher, but it never did. The move lower is sharp and comes at a time when the Fed says there is likely no rate cut in March. Weird move lower. What does the bond market hint at? It’s quite possible it was a wave (v) to get people bearish yields only to be followed by the real correction higher back above 4.20%. It would be in line with the FED and the cycles shown in previous issues.
By the way, small caps do not like higher yields. Keeping a look at those is important if you like to swim in those waters.
Bitcoin
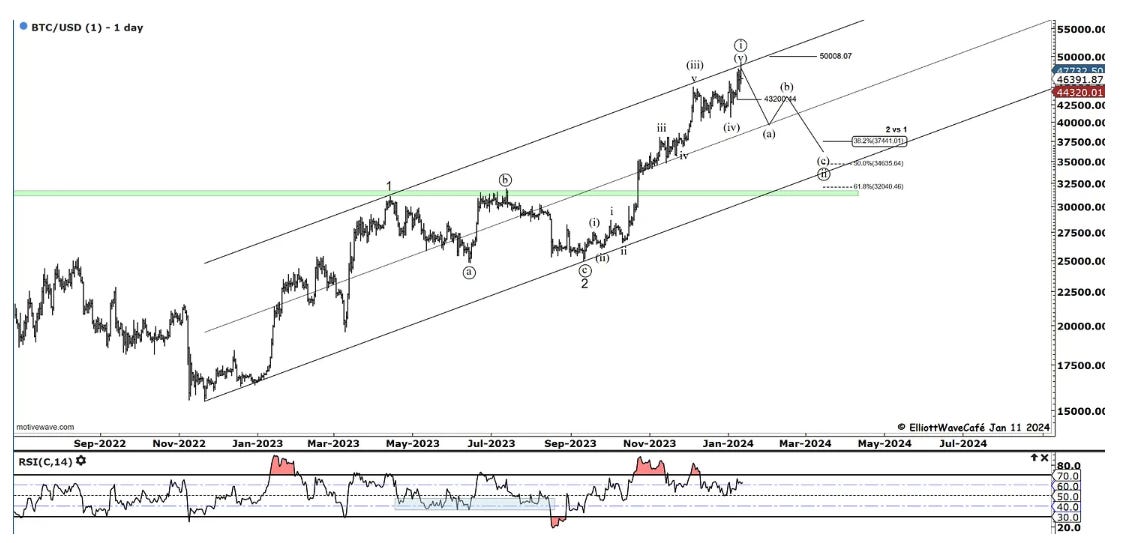
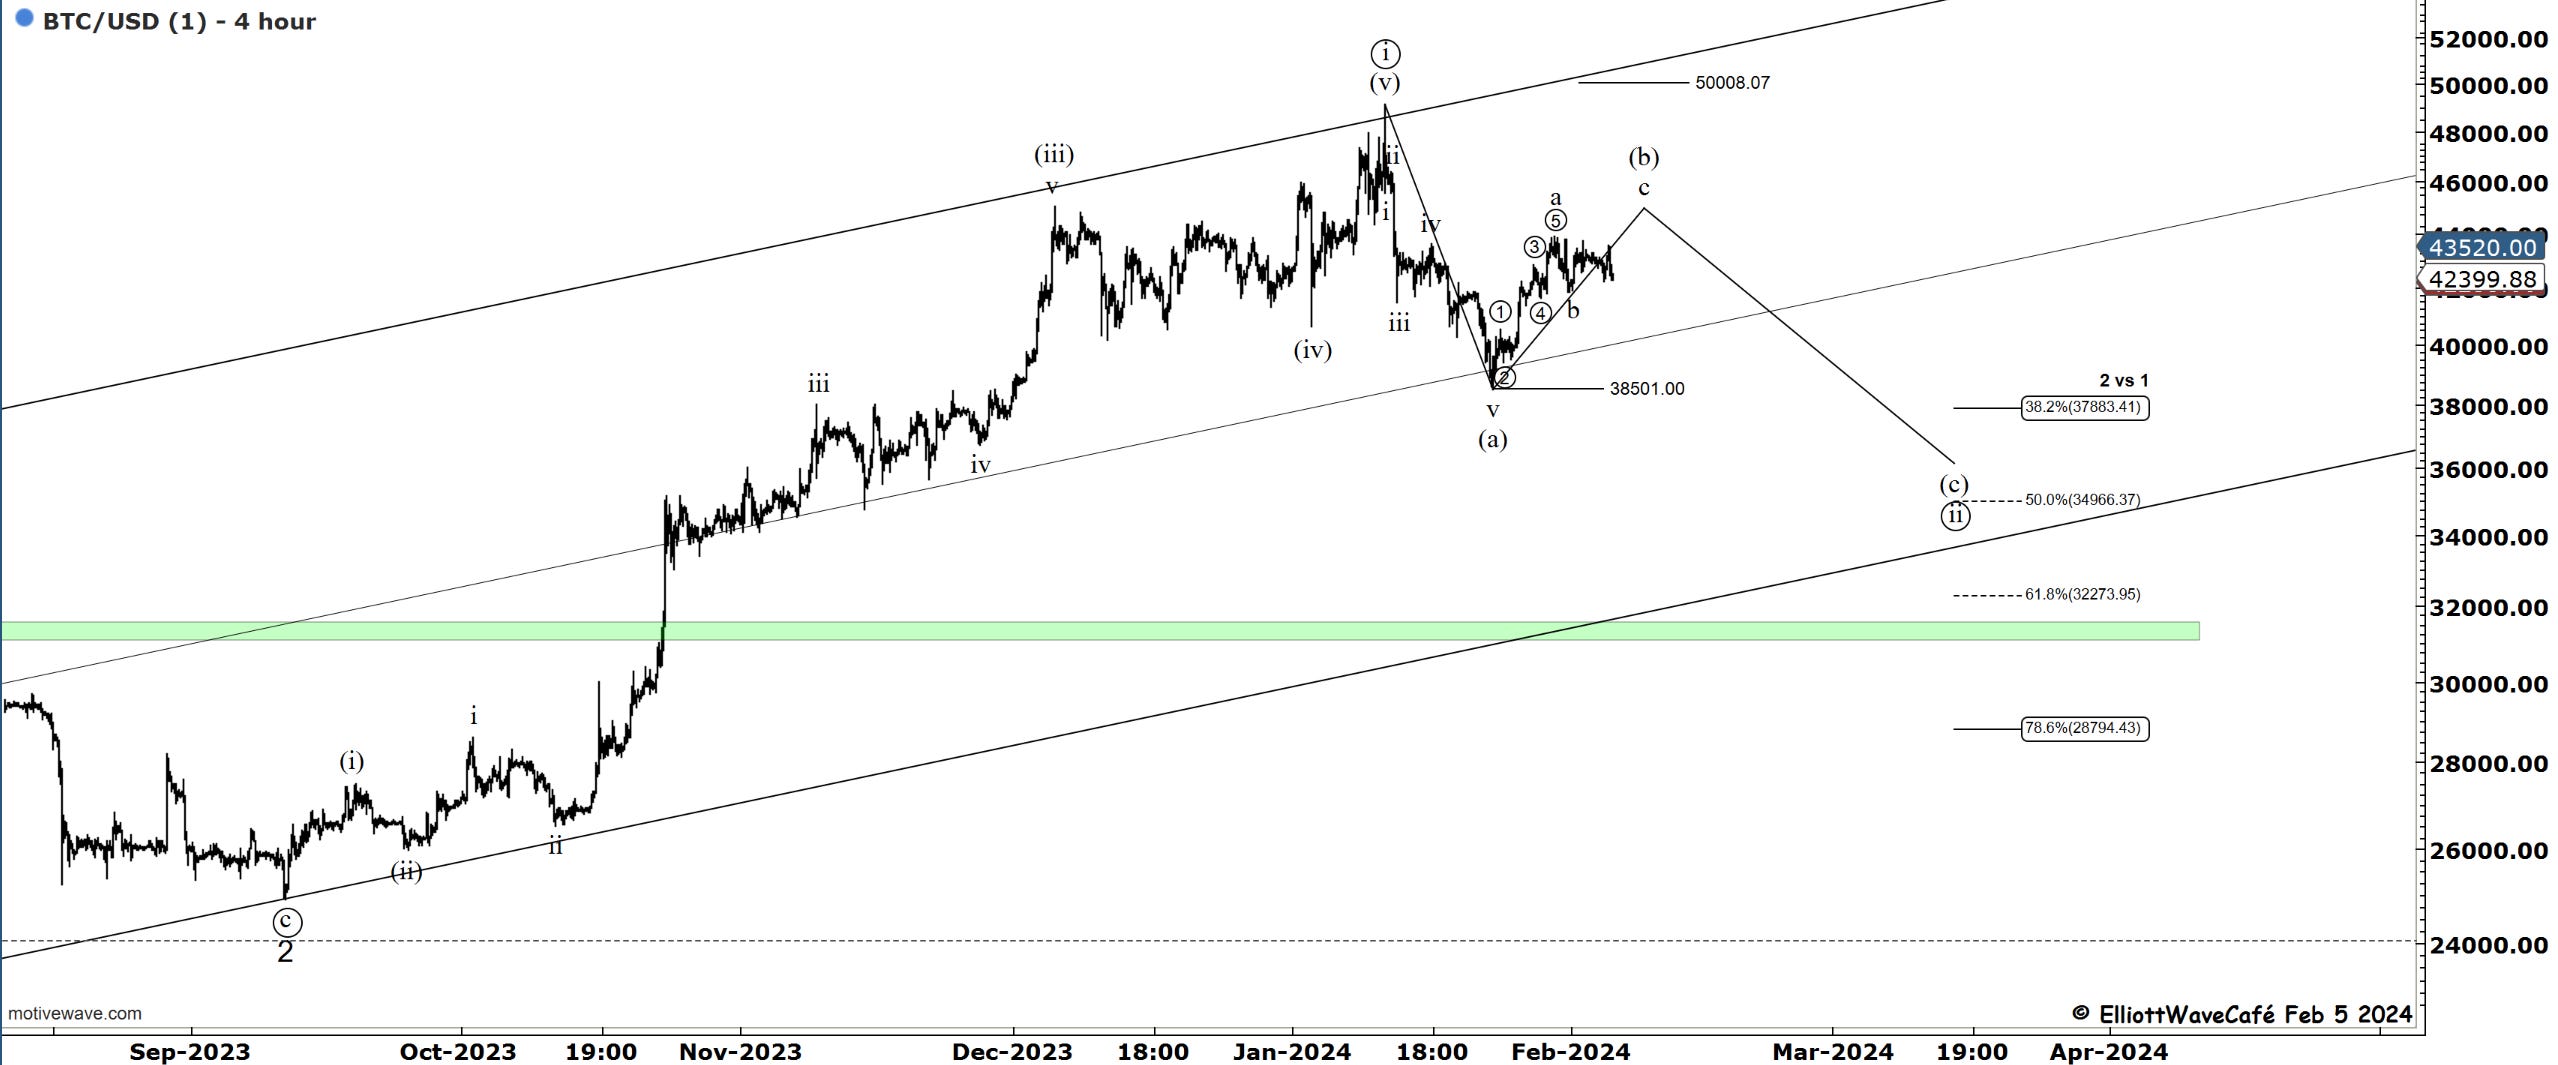
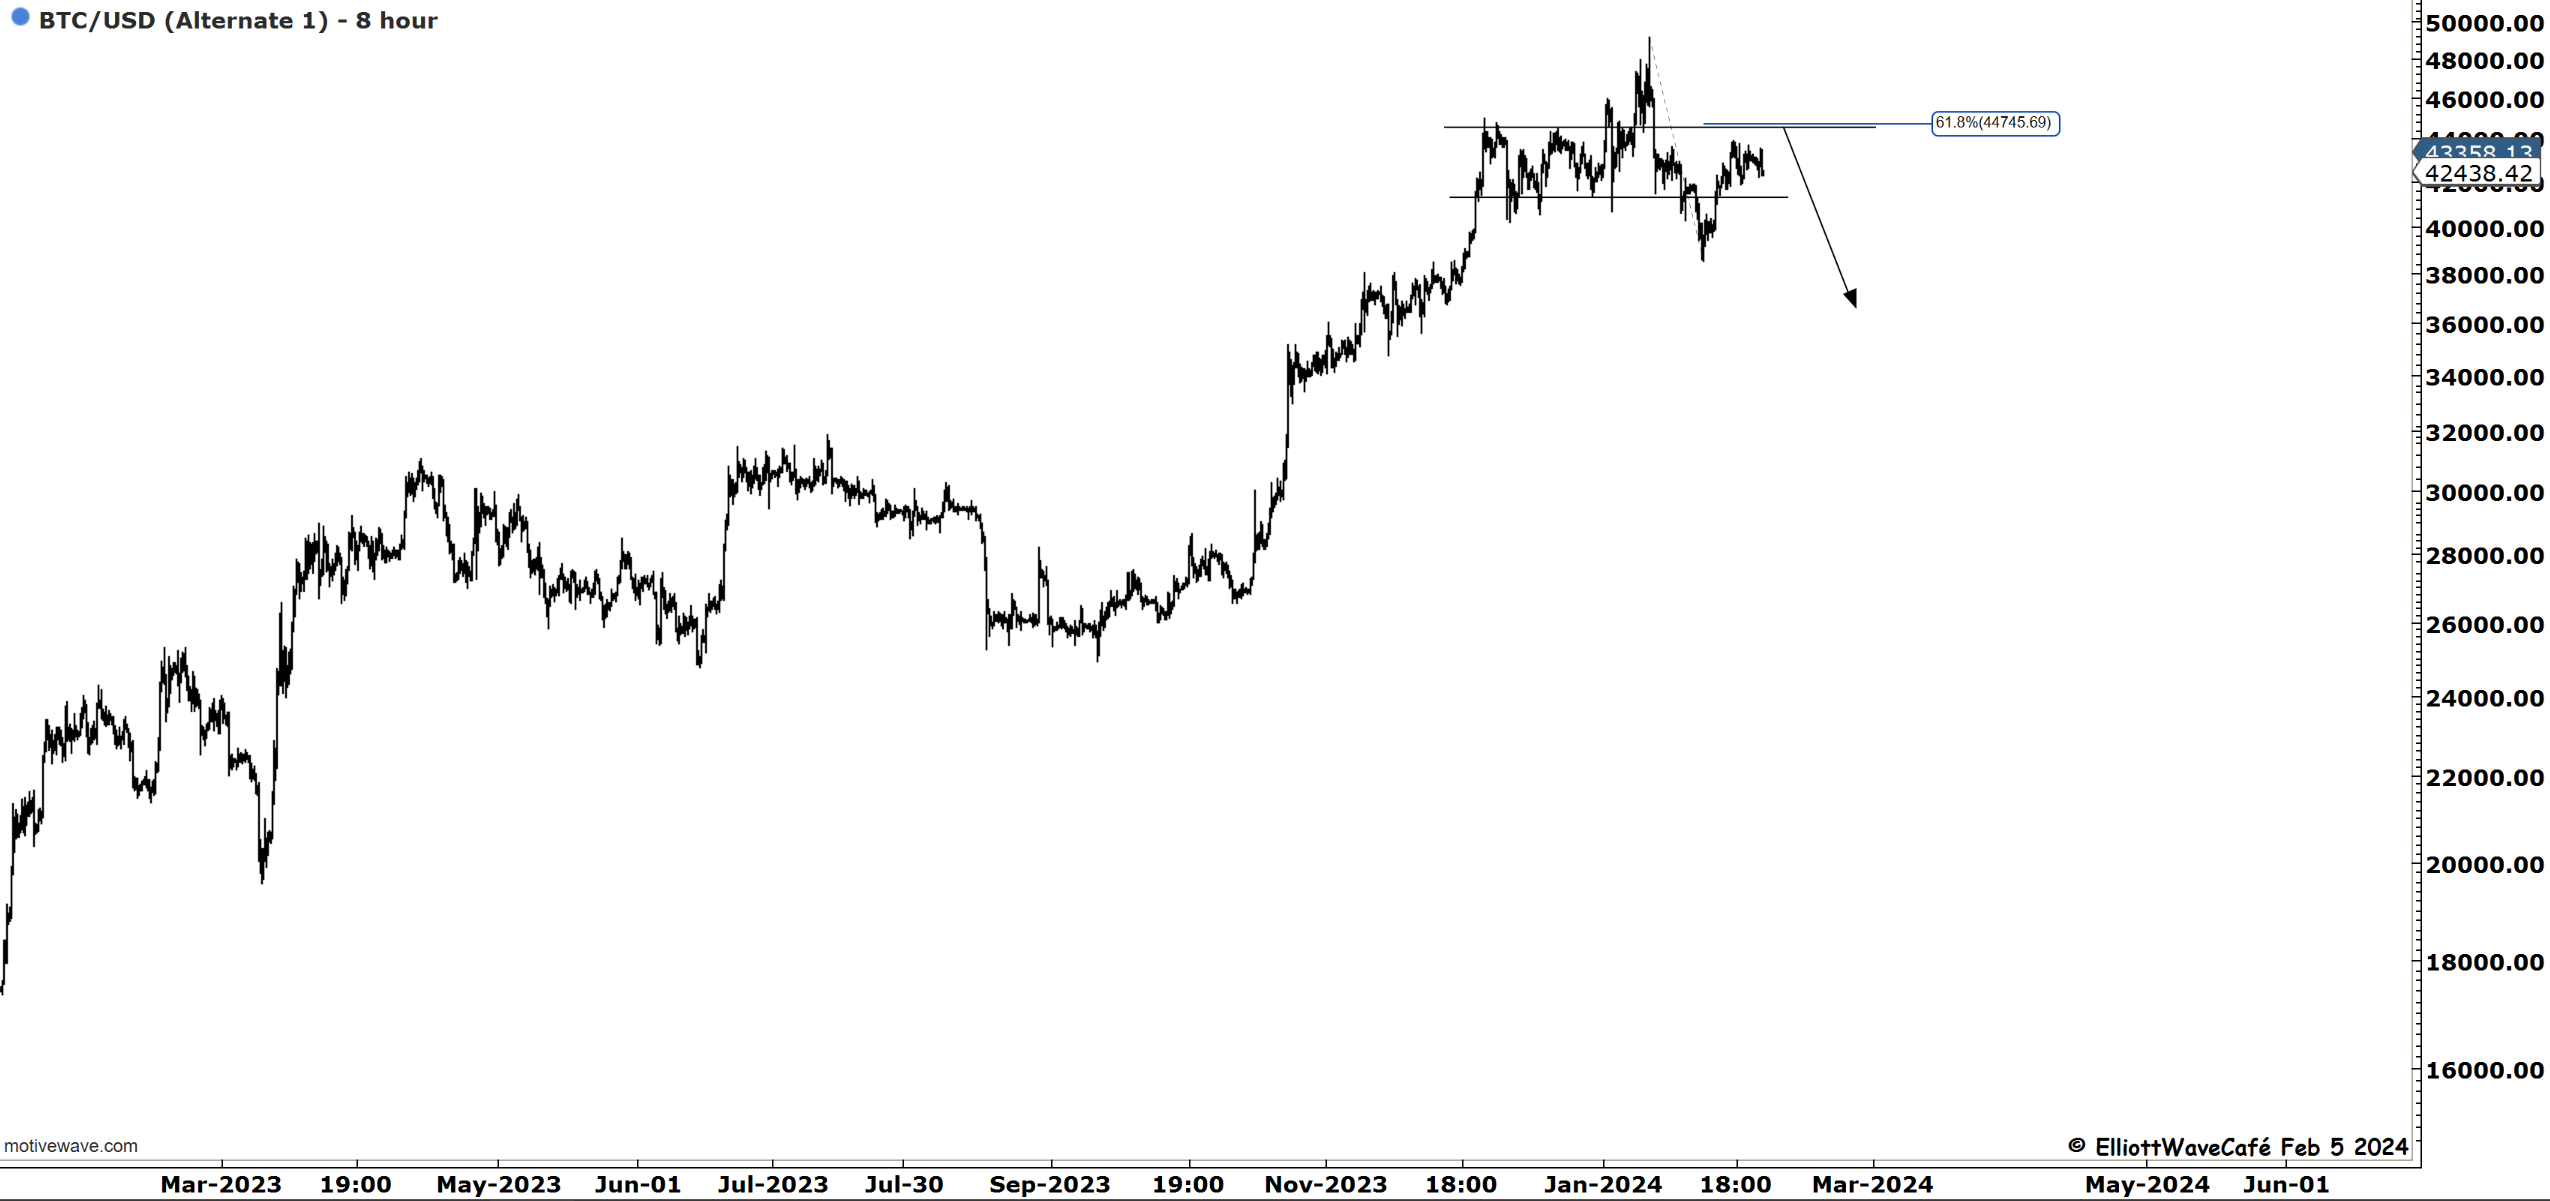
Bitcoin has had several attempts to break 43,800 but has so far been unsuccessful. I think it would make the wave structure a bit cleaner in terms of an abc if it does. I think one is right to think short below 45k and prepare bullish above.
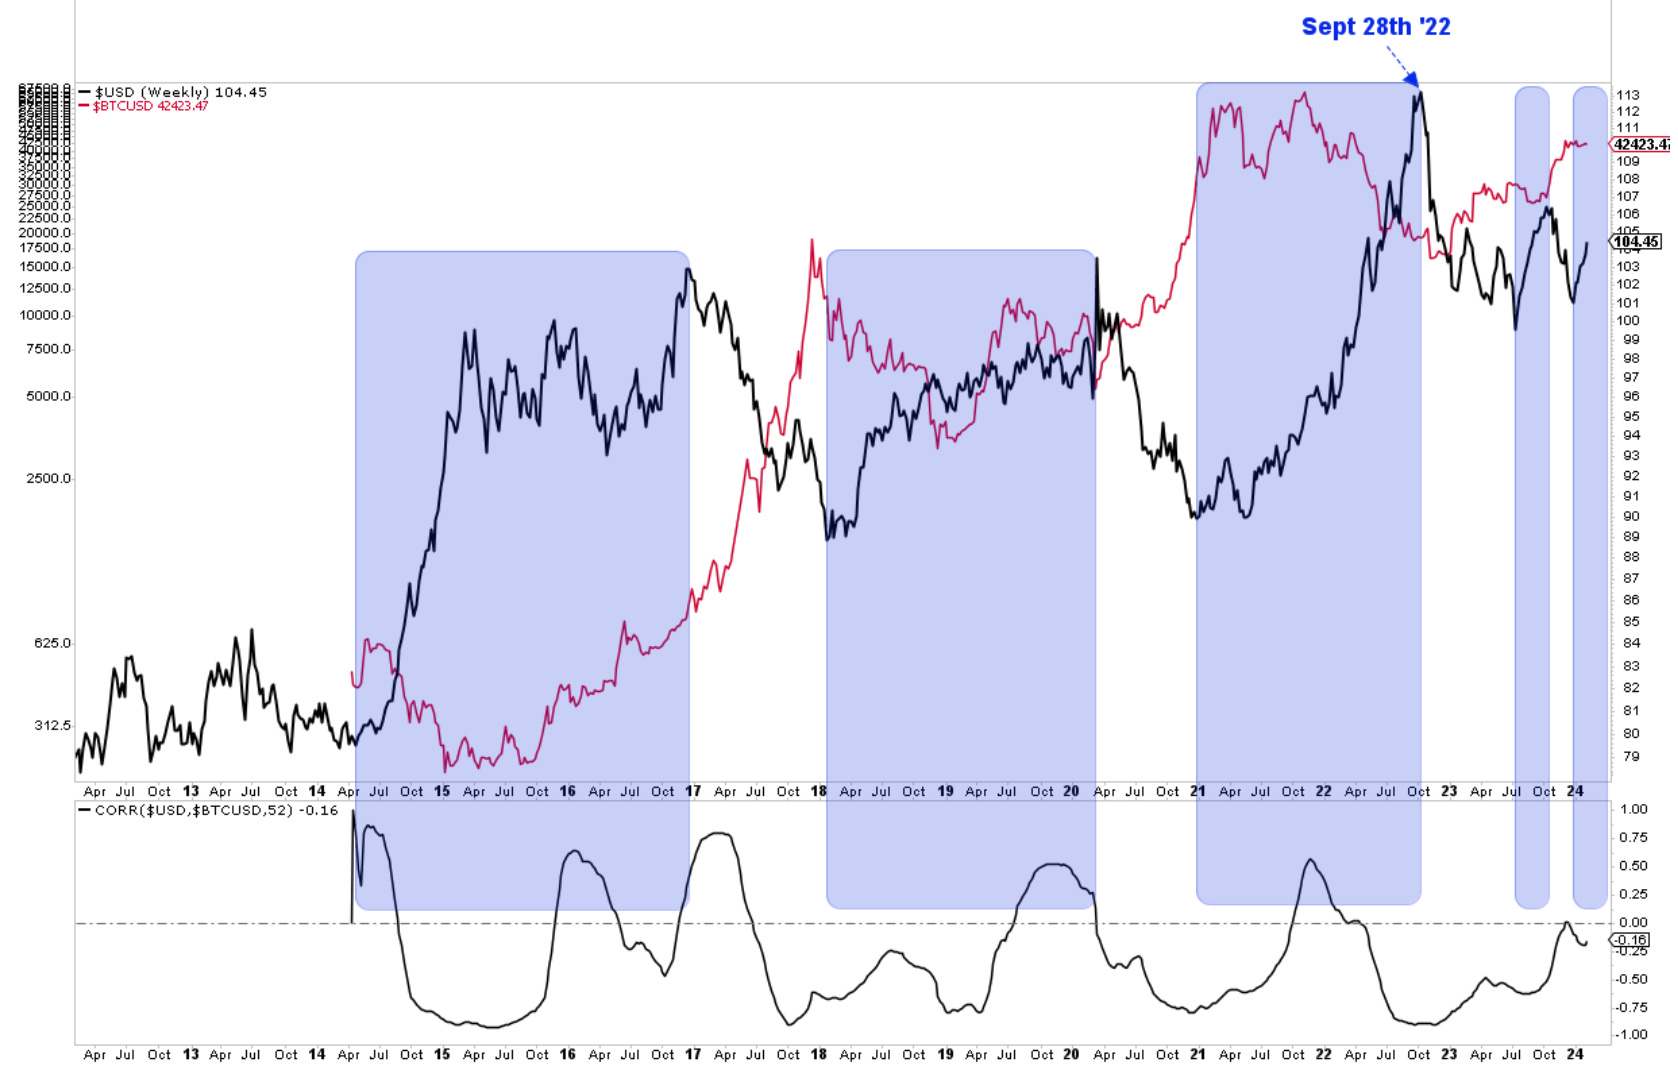
Here is the chart from Jan 11th, which we prepared ahead and at the time of ETF's launch. The second one is updated as of today and remains the main focus until enough bullish evidence creeps in to change that view. I am also thinking of a strong dollar / BTC correlation. You can see that in the last chart. Periods in blue are stronger dollar environments. Bitcoin price action has been actually lackluster since the Dollar bottomed at the end of last year.
“Double shot” Daily member video coming up next,
If you’re new to Elliott Wave or need to refresh, there is a 7-hour video course with downloadable slides under The Coarse tab on the website.
Have a great day wherever you are! - trade well, and don’t forget to subscribe and drop a like if this letter helps you in any way.
Cris
email: ewcafe@pm.me