
The Daily Drip
Core markets charts updates and commentary
Note: The counts on the right edge are real-time, and they are prone to adjustments as price action develops. Elliott Wave has a fluid approach, is evidence-based, and requires constant monitoring of certain thresholds.
In the counts below, this (( )) = circle on chart
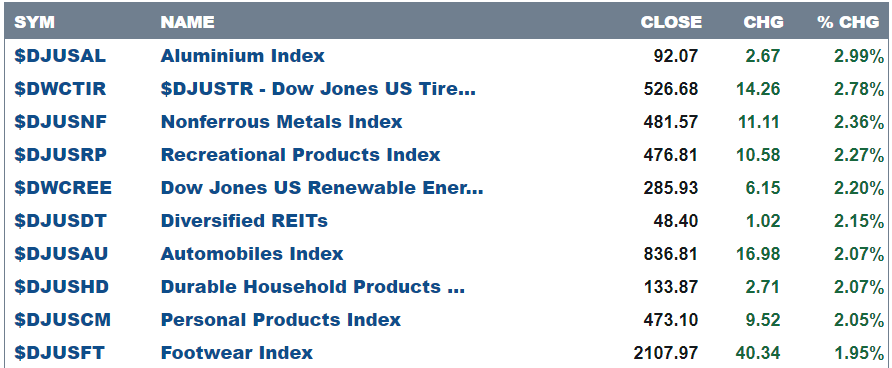
Here are today’s top 10 best performers out of 104 industries.
65 positive closes and 39 negative.
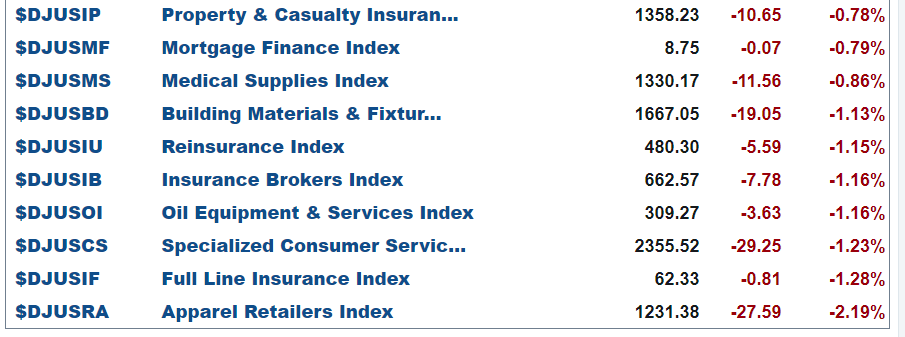
and bottom 10 …
SP500
A day of pause across the board in the markets. There were several tries in the first half of the day to try and continue registering new highs, but the markets failed to sustain the gains.
A technical trader has a great responsibility to study market behavior on a daily basis by looking internally at how price behaves by following some very common metrics. Those are in no particular importance order: VIX, TICK, TRIN, ADD, SKEW, PCALL, VOLSPD, TVOL. Have I confused you yet? No worries, if you’re subscribed here, you will eventually see how all of these work or if you watch my daily videos. It’s like watching the beating heart of the market. It’s quite fascinating. Every once in a while, these metrics diverge, send signals, and give clues to further price behavior.
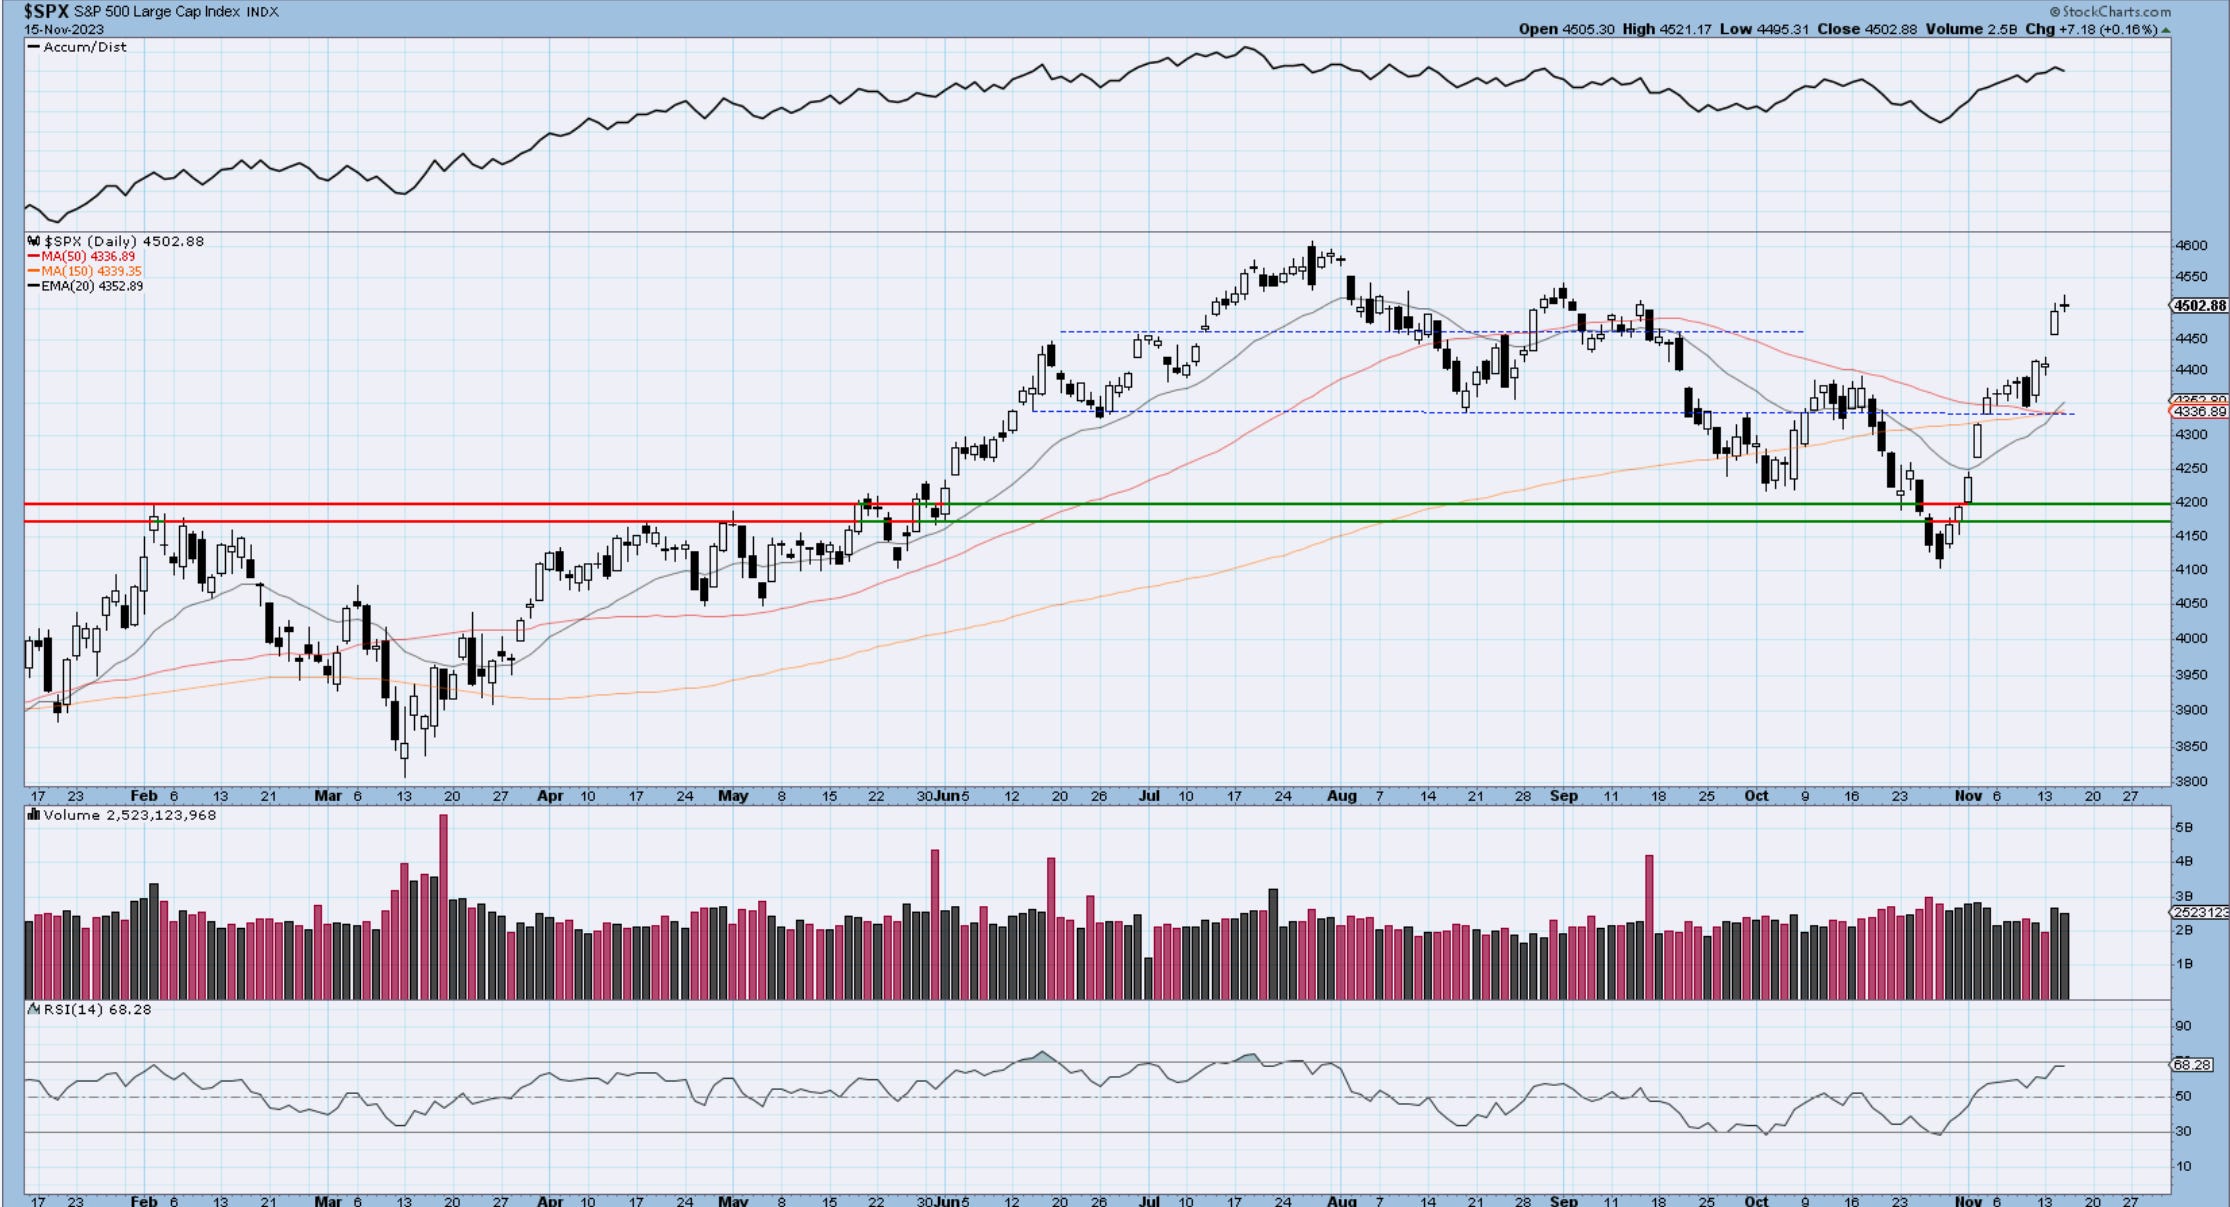
On this daily chart, we see the little indecision candle displayed today at the 4500 resistance. It’s a small clue of further pause and churn. If it is followed by a down close tomorrow, the whole pattern will grow in importance. For now, it’s only a flashing yellow. All the moving averages are converging in the same spot near 4340, so from that perspective we have no established trend in either direction over the past 50 or even 150 days.
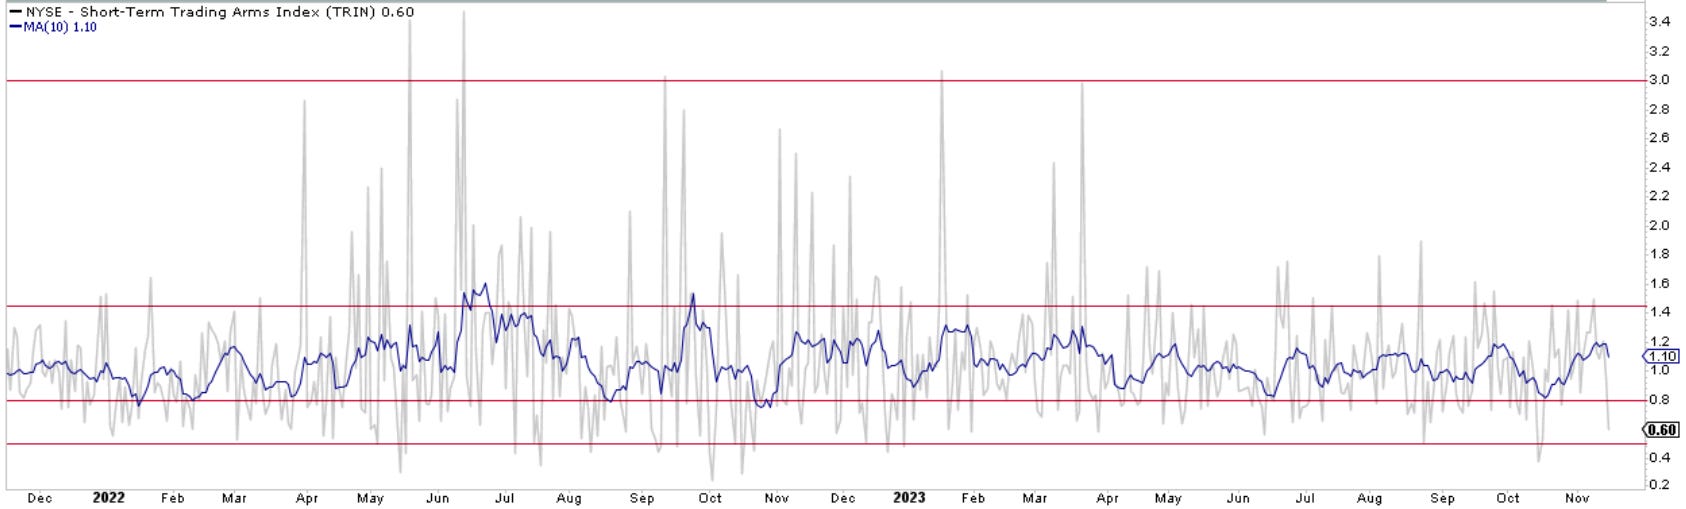
Speaking of market internals, below you see what is called TRIN index. It compares the number of advancing and declining stocks to the volume of both advancing and declining stocks. As you can see below it hit a pretty extreme value of 0.60 today. Previous instances when this happens tend to coincide with nearby market tops. A TRIN value that drops below 0.50 indicates an overbought market with an overheated bullish sentiment. The blue line is just a simple 10-day MA of the indicator to smooth out volatility.
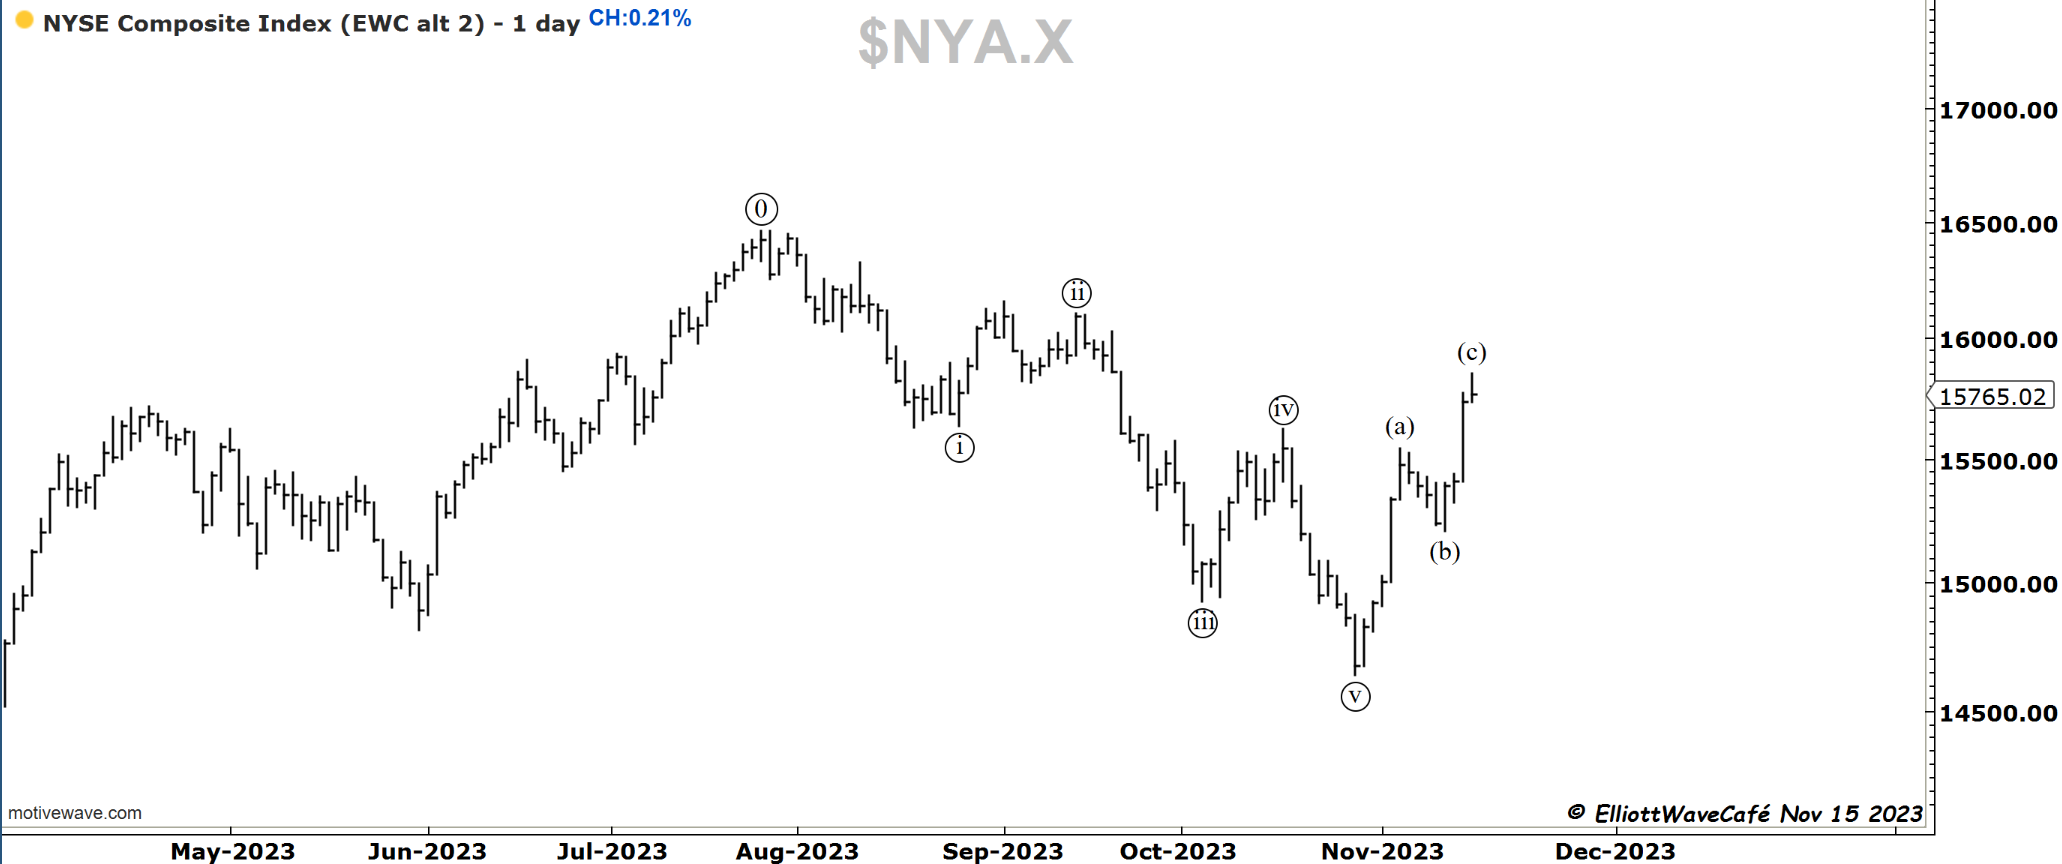
One thing that caught my attention in the hundreds of charts I scan and watch daily was the chart of the NYSE. There is a bit more clarity here in terms of how an alternate count might unfold. The move from July highs can actually be counted without overlaps as 5 waves, followed by what looks to be a 3-wave correction up to this point. The other markets do not distinguish so clearly the three wave advance. You see by my counts on indices that it forces us to count it motive instead of corrective. I will monitor this more closely going forward and if we get a break of (b) wave low we will have our answer.
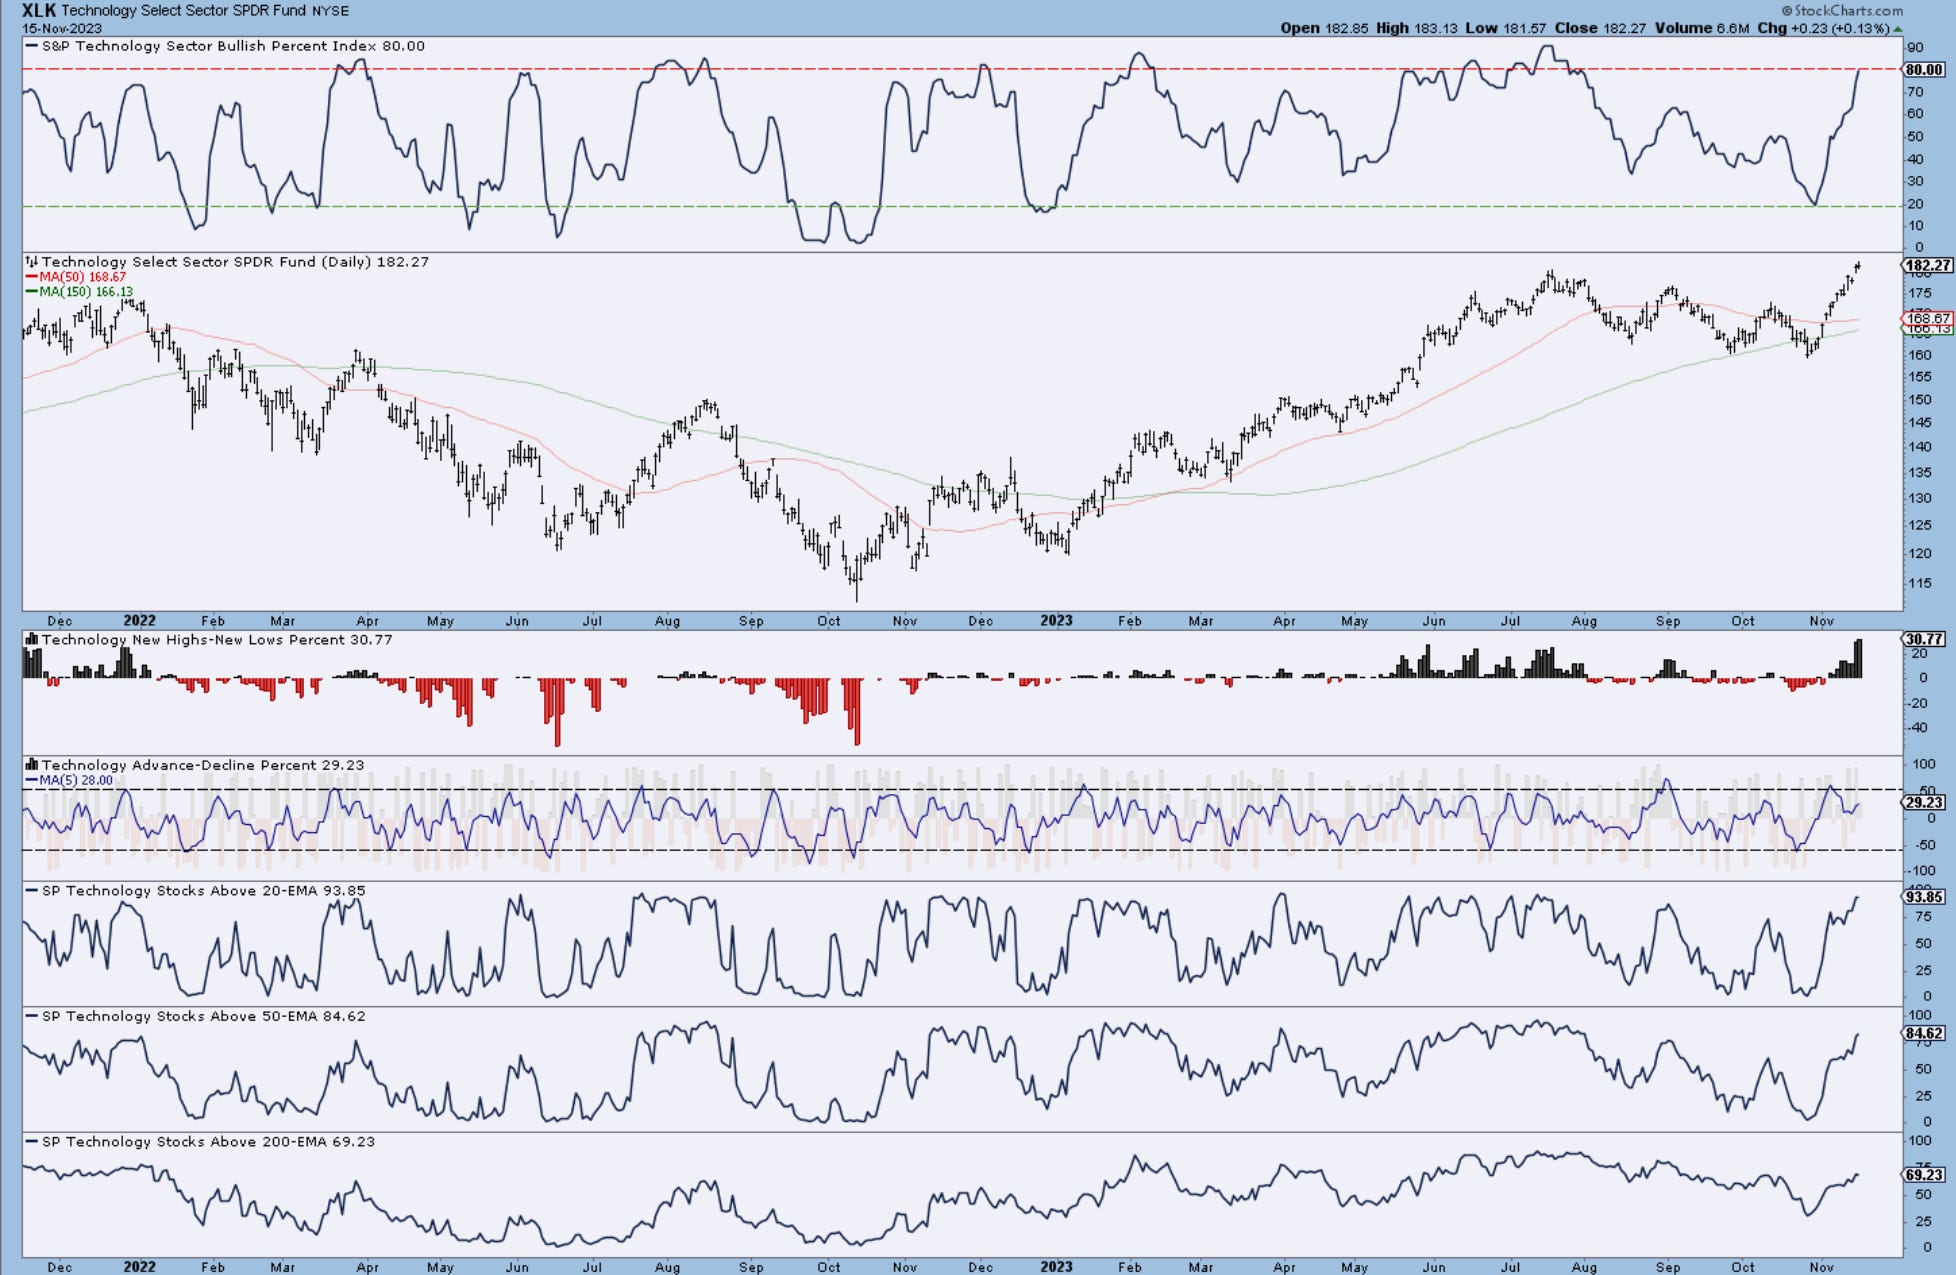
Here is the only sector from the 11 present on the SP500 that’s starting to overheat. I characterize overheating by the BPI ( bullish percent index) above 80. If you remember we turned bullish on the SPY when BPI started to hit lower bands at 30 and 25. This can still trend higher near term and remain overheated, but it’s on the radar for profit-taking and eventually shorting in the near future. Would like to see some breadth deterioration from % above key moving averages, along with advance- declines.
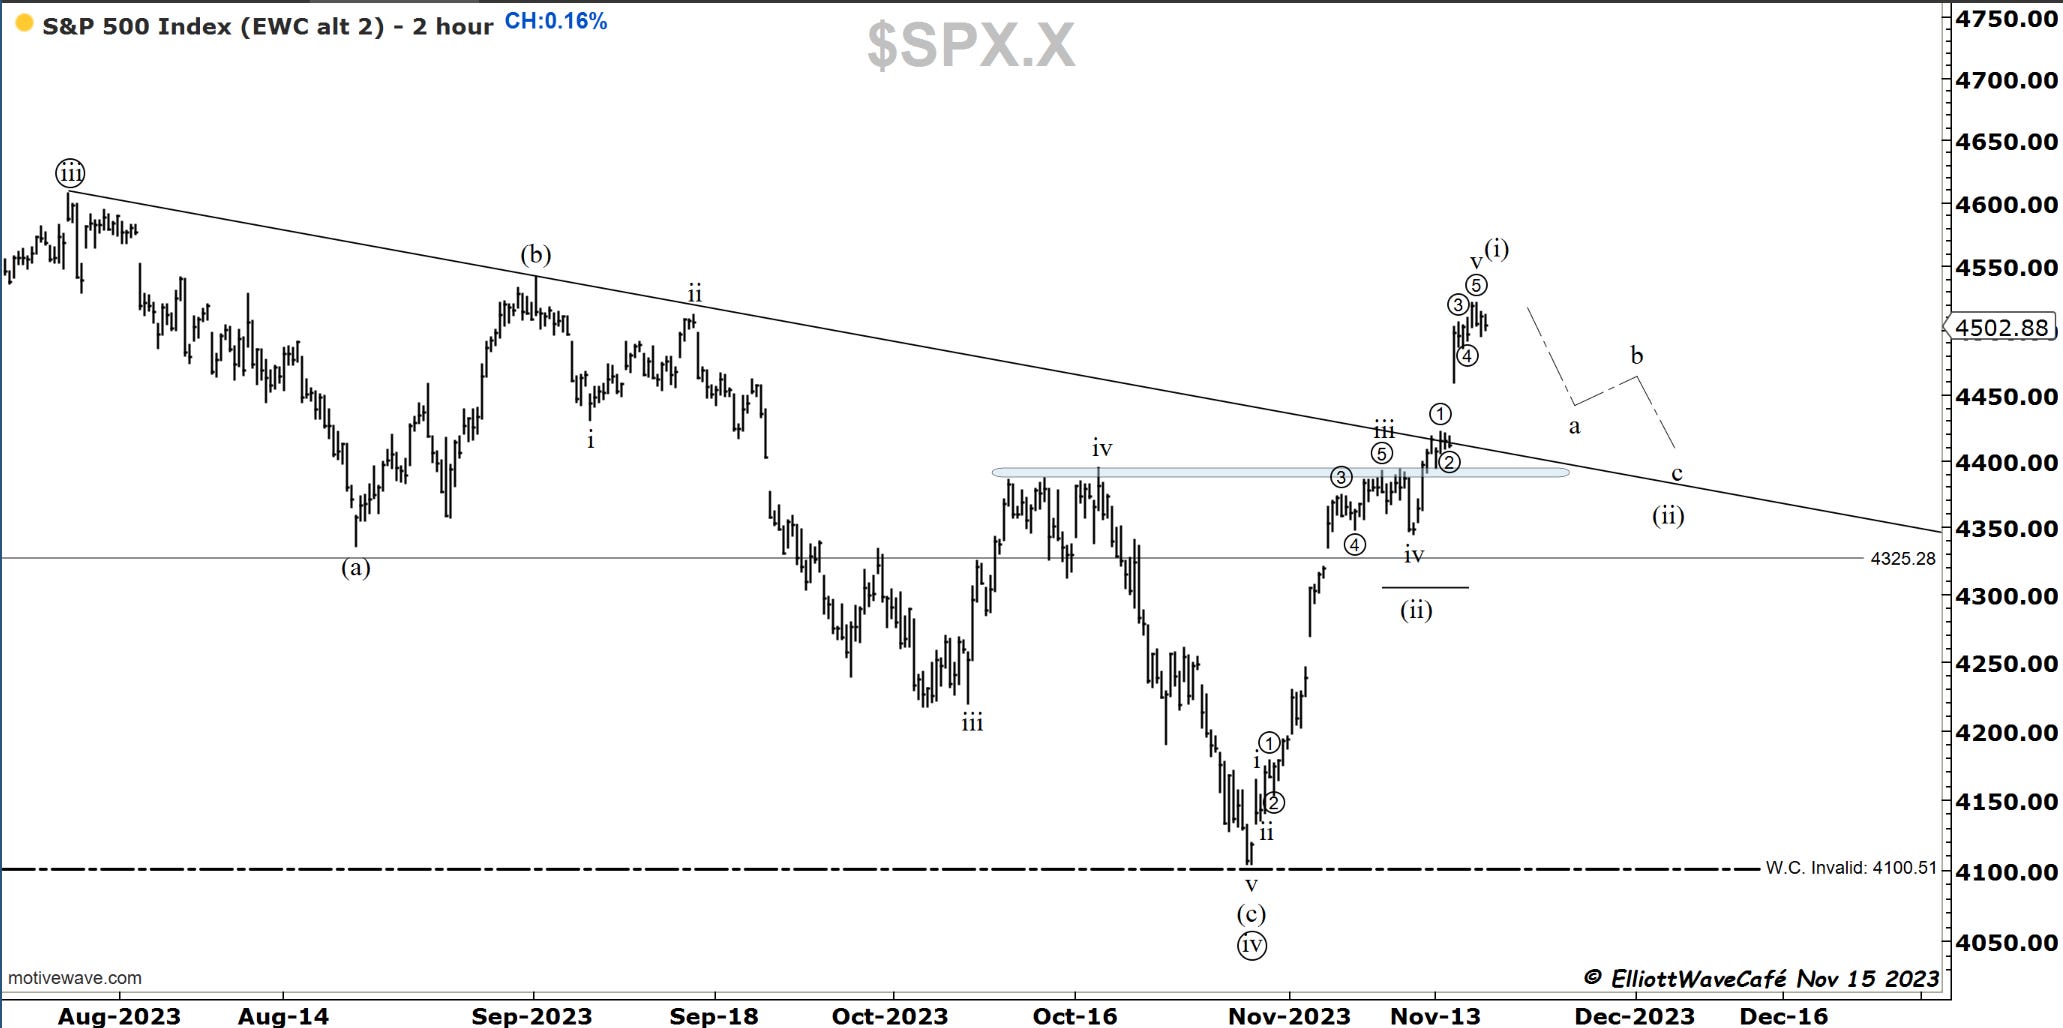
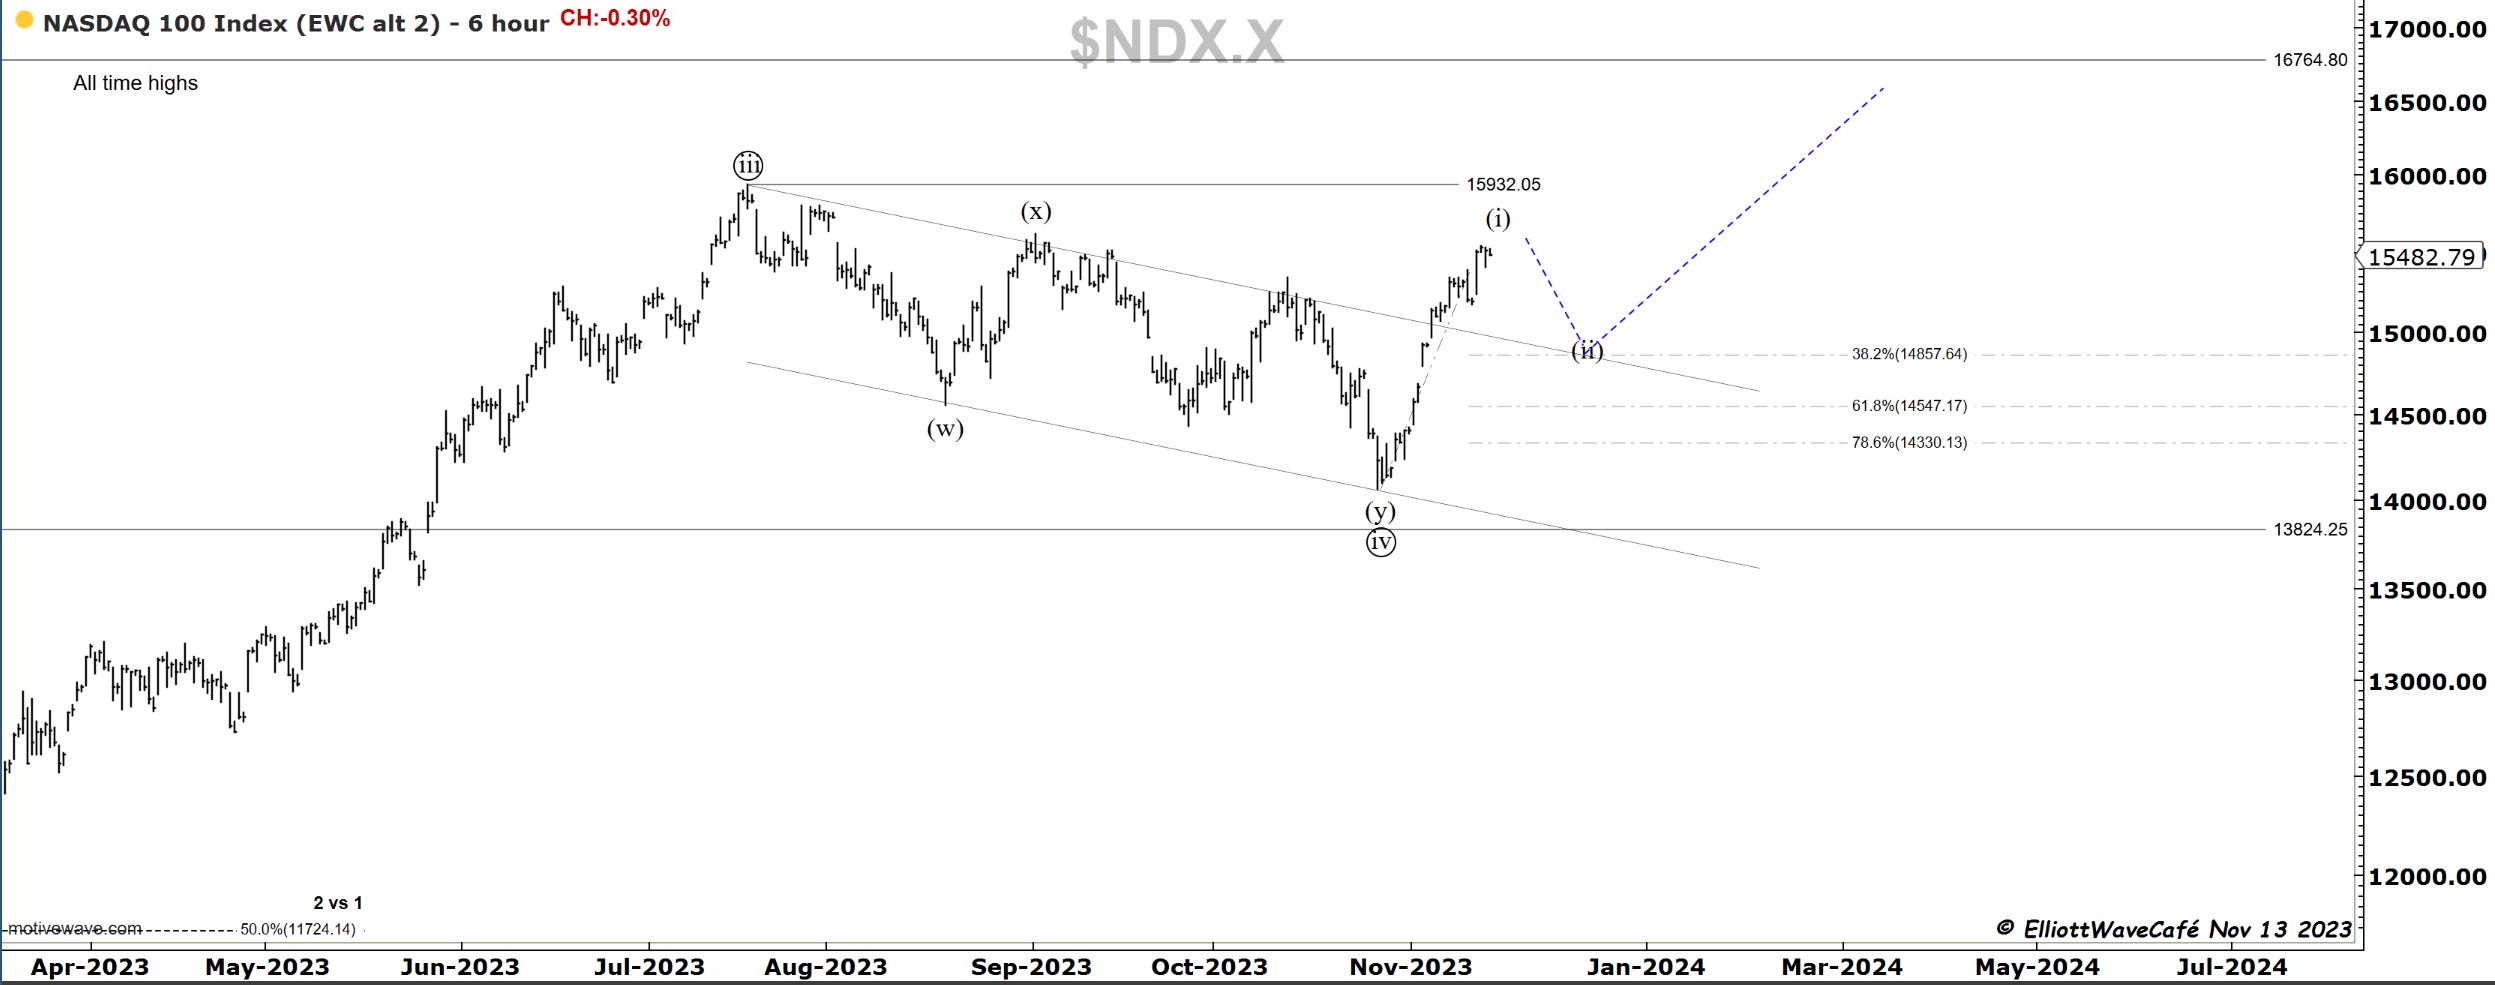
Here is our regular update on the EW counts where I am waiting for a wave (ii) correction to start to initiate. Today’s action was a bit encouraging but needs further follow-through. I don’t have time to present it here, but there as multiple tech stocks with large weightings that have exhaustion buyer signals that have the potential to derail this advance for several weeks.
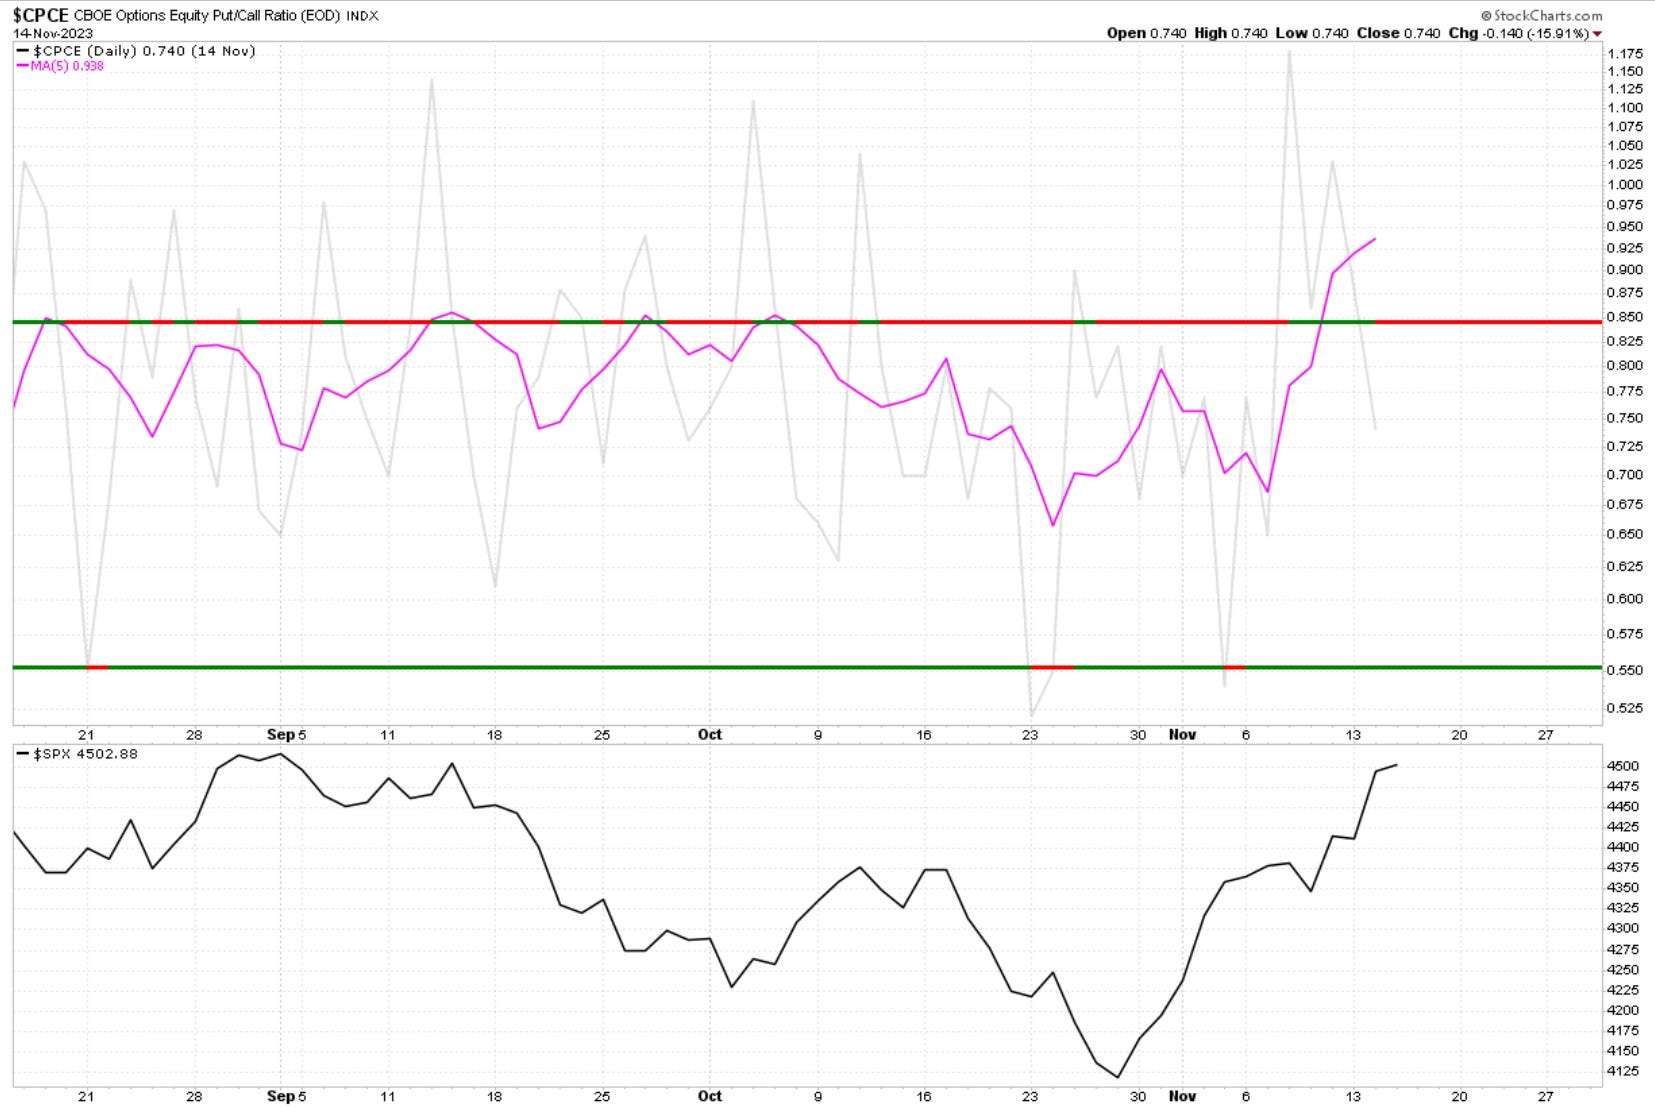
Check out the PCall ratio equity only. I mentioned yesterday how the puts were completely destroyed during this fast rally. Today, a lot of those puts evaporated some more, probably at the same time as call buying started to kick in. This action sent the PCALL ratio in a head dive towards 0.75 from over 1.15 during the start of the rally. Traders are dumping put nad chasing higher via calls. What’s new in this world? Emotions get the best of us in this business and in life.
Nasdaq100
This index closed flat on the day, while the futures that close an hour later than cash, closed negative 25bps. My focus remains on that wave (ii) throwback for a percentage of the entire rally. At least 25% if not 38%.
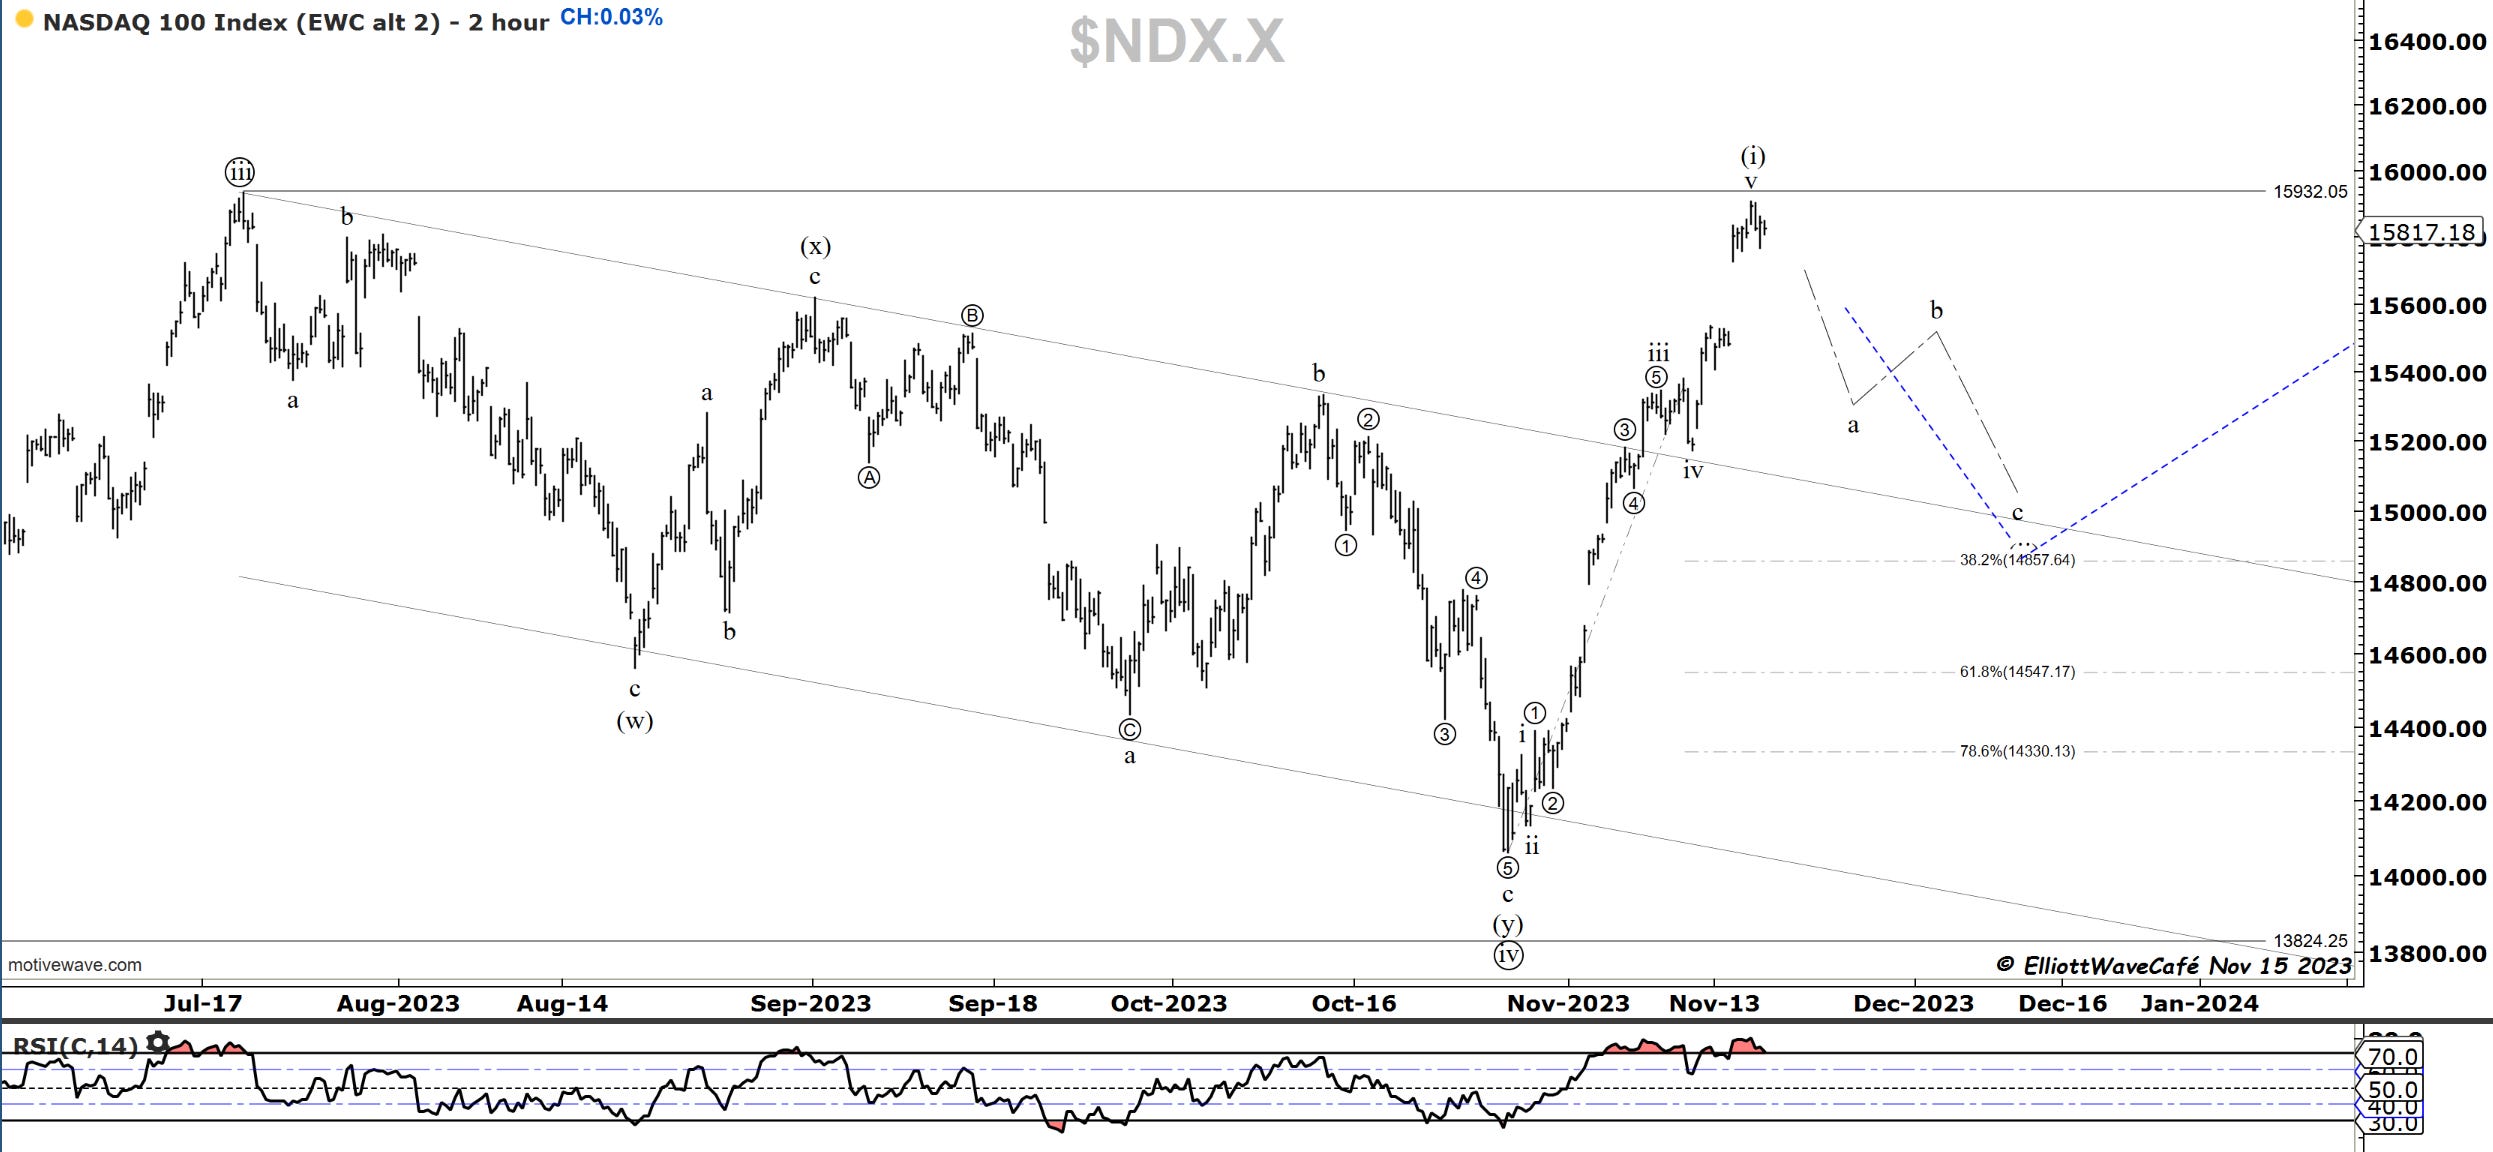
Here is the (i) (ii) idea with a kiss back towards the broken trendline before a larger wave (iii) can ensue.
RUSSELL 2000
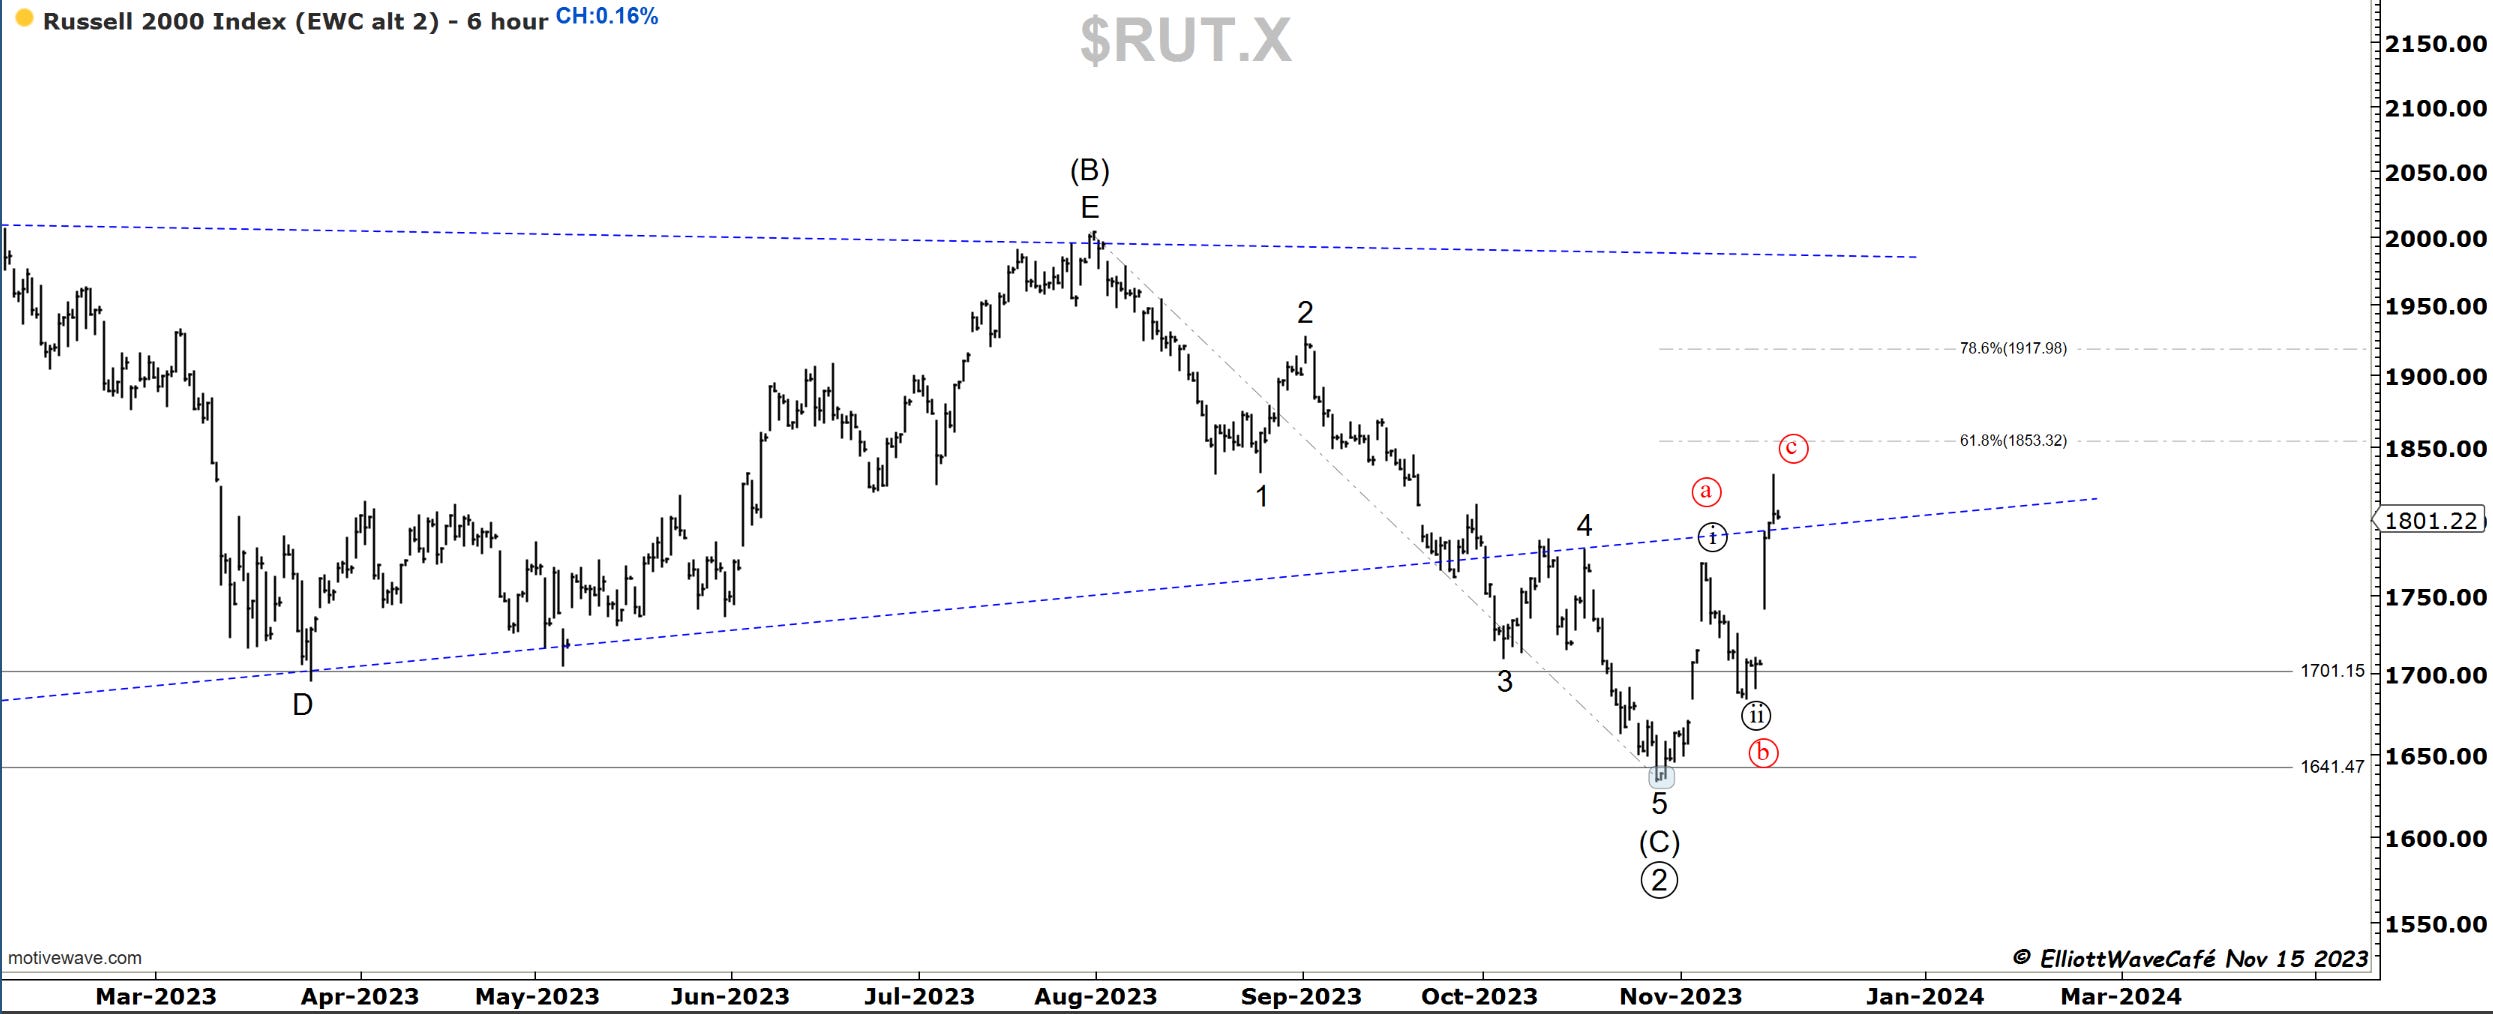
As strong as small caps were the speed of the move is suspicious. A 3 wave so far sends me thinking about ABC as mentioned in prior updates. ( in red here). It will be confirmed by further failures to rally and a drop of more than 61.8% of that proposed alternate ((c)) wave. Below 1700 hold on to your seatbelts. On the opposite side, a climb towards .786 will likely become a 5-wave endeavor and establish the low in Oct.

Dow30
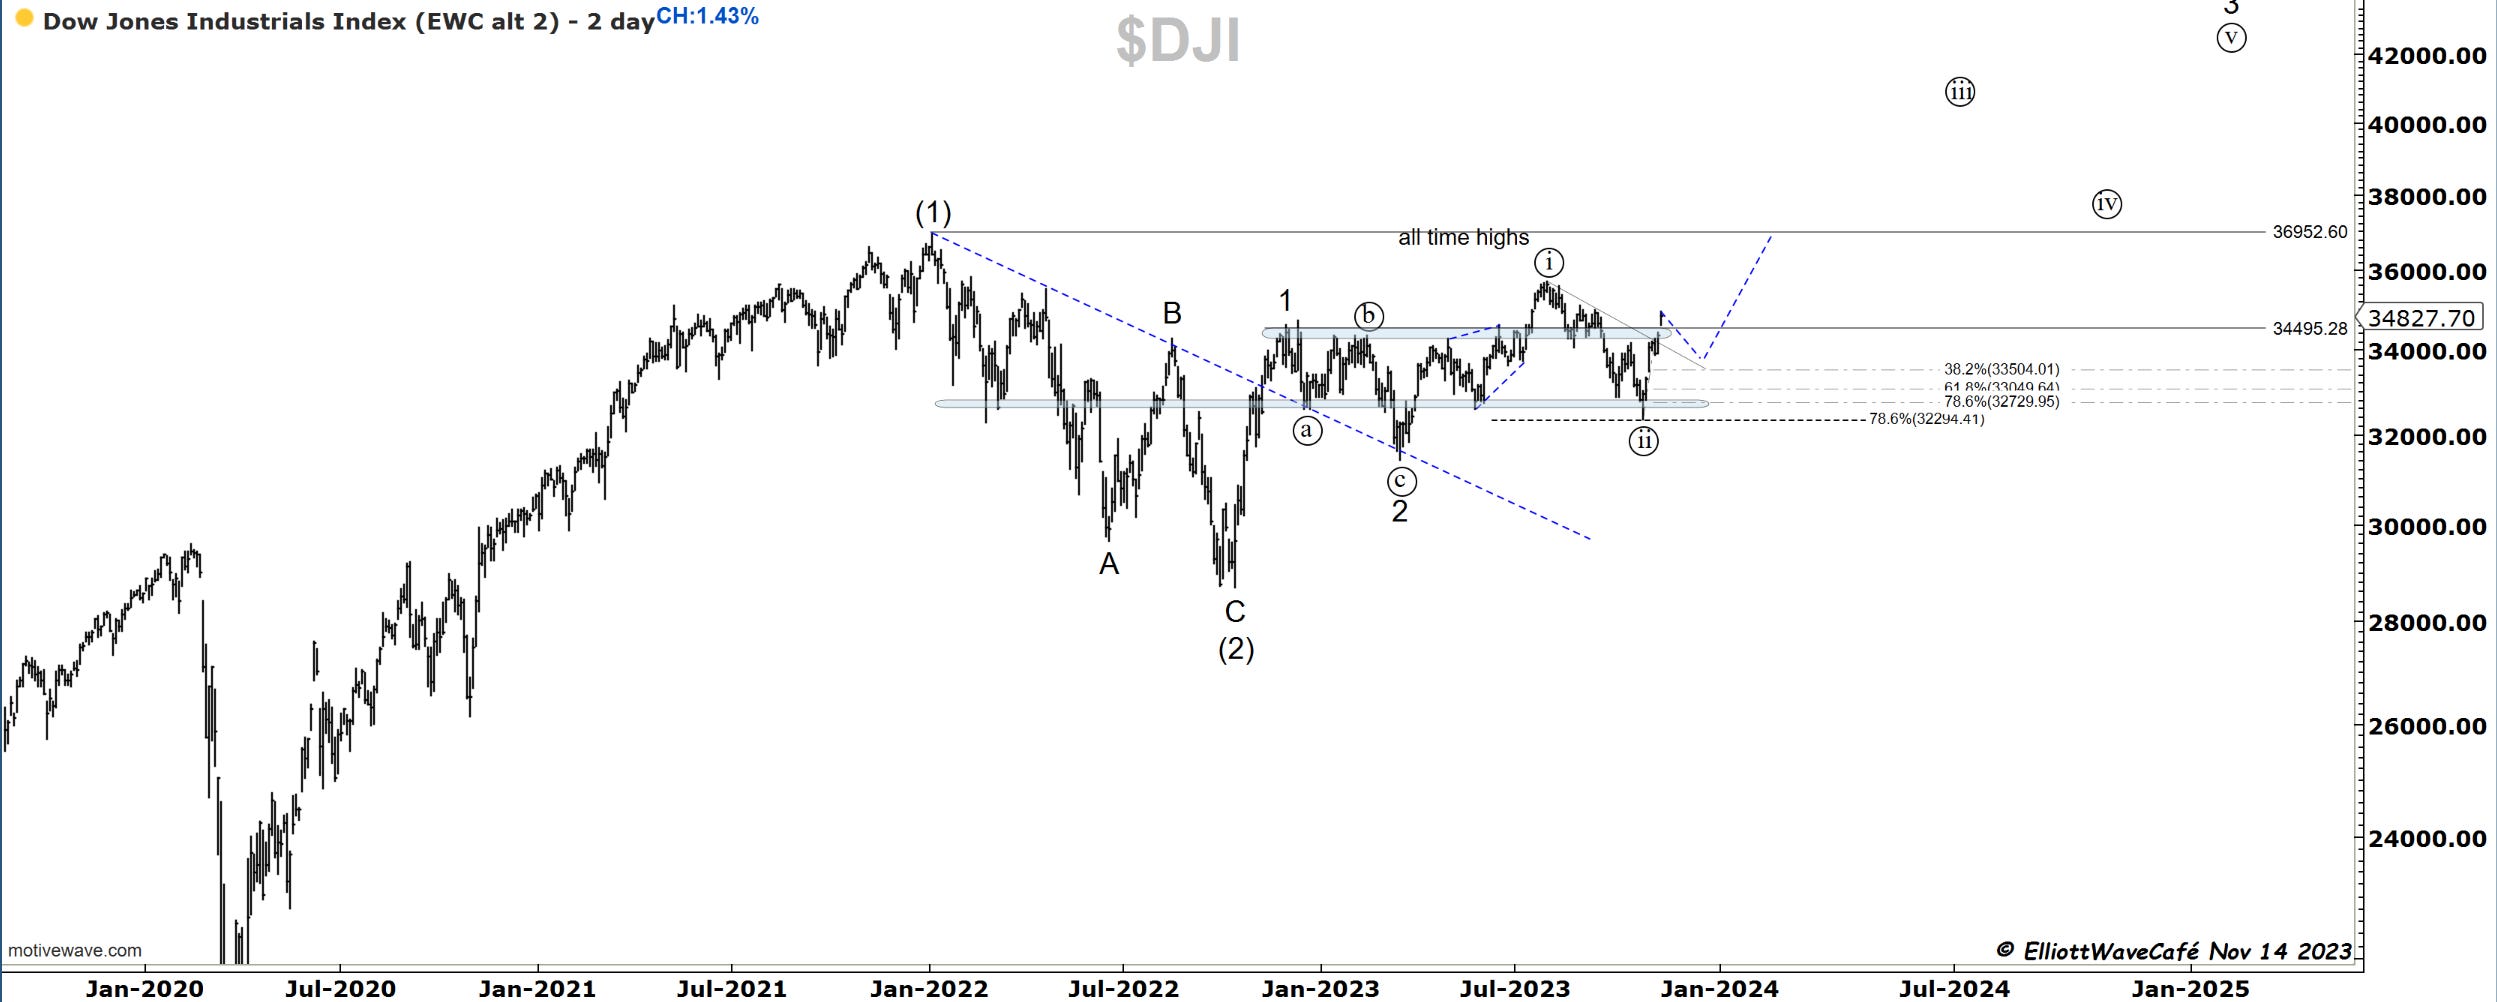
We are approaching the next resistance in the Dow and looking for a wave ii throwback. Do you see the difference between the NYSE chart above and this one? While that one is easier to label as an ABC rally, along with the Russell2k, this one, NASDAQ and sp500 are not that easy. It does look more like a 5wave move. Very curious who’s going to be right here and how we reconcile these waves discrepancies.
Here is the larger count if you haven’t seen it already.
US Dollar and Yields
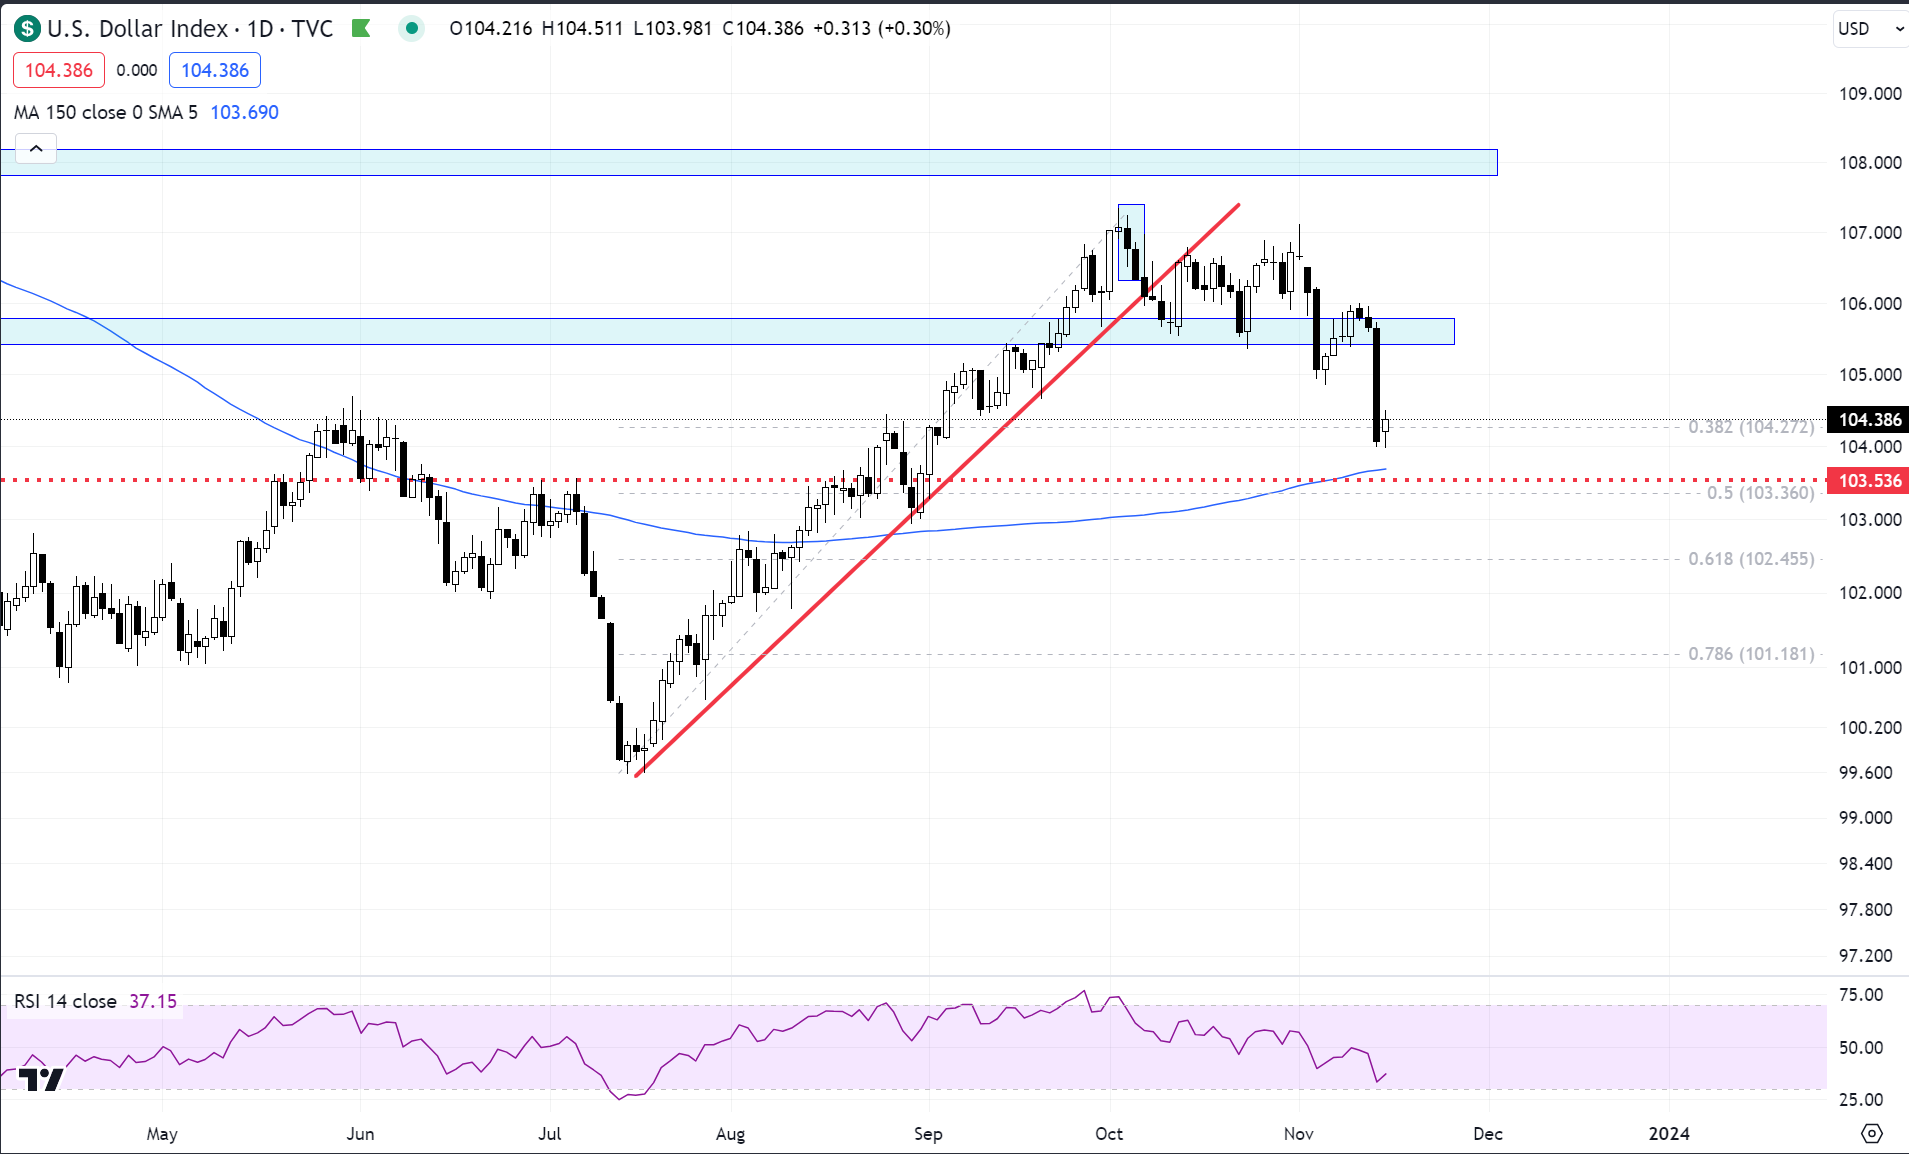
The dollar has taken a pause today just above the key 103.50 level. So it happens that the 150day MA sits there as well. I think we hold here for a while maybe even attempt to get back near 105.
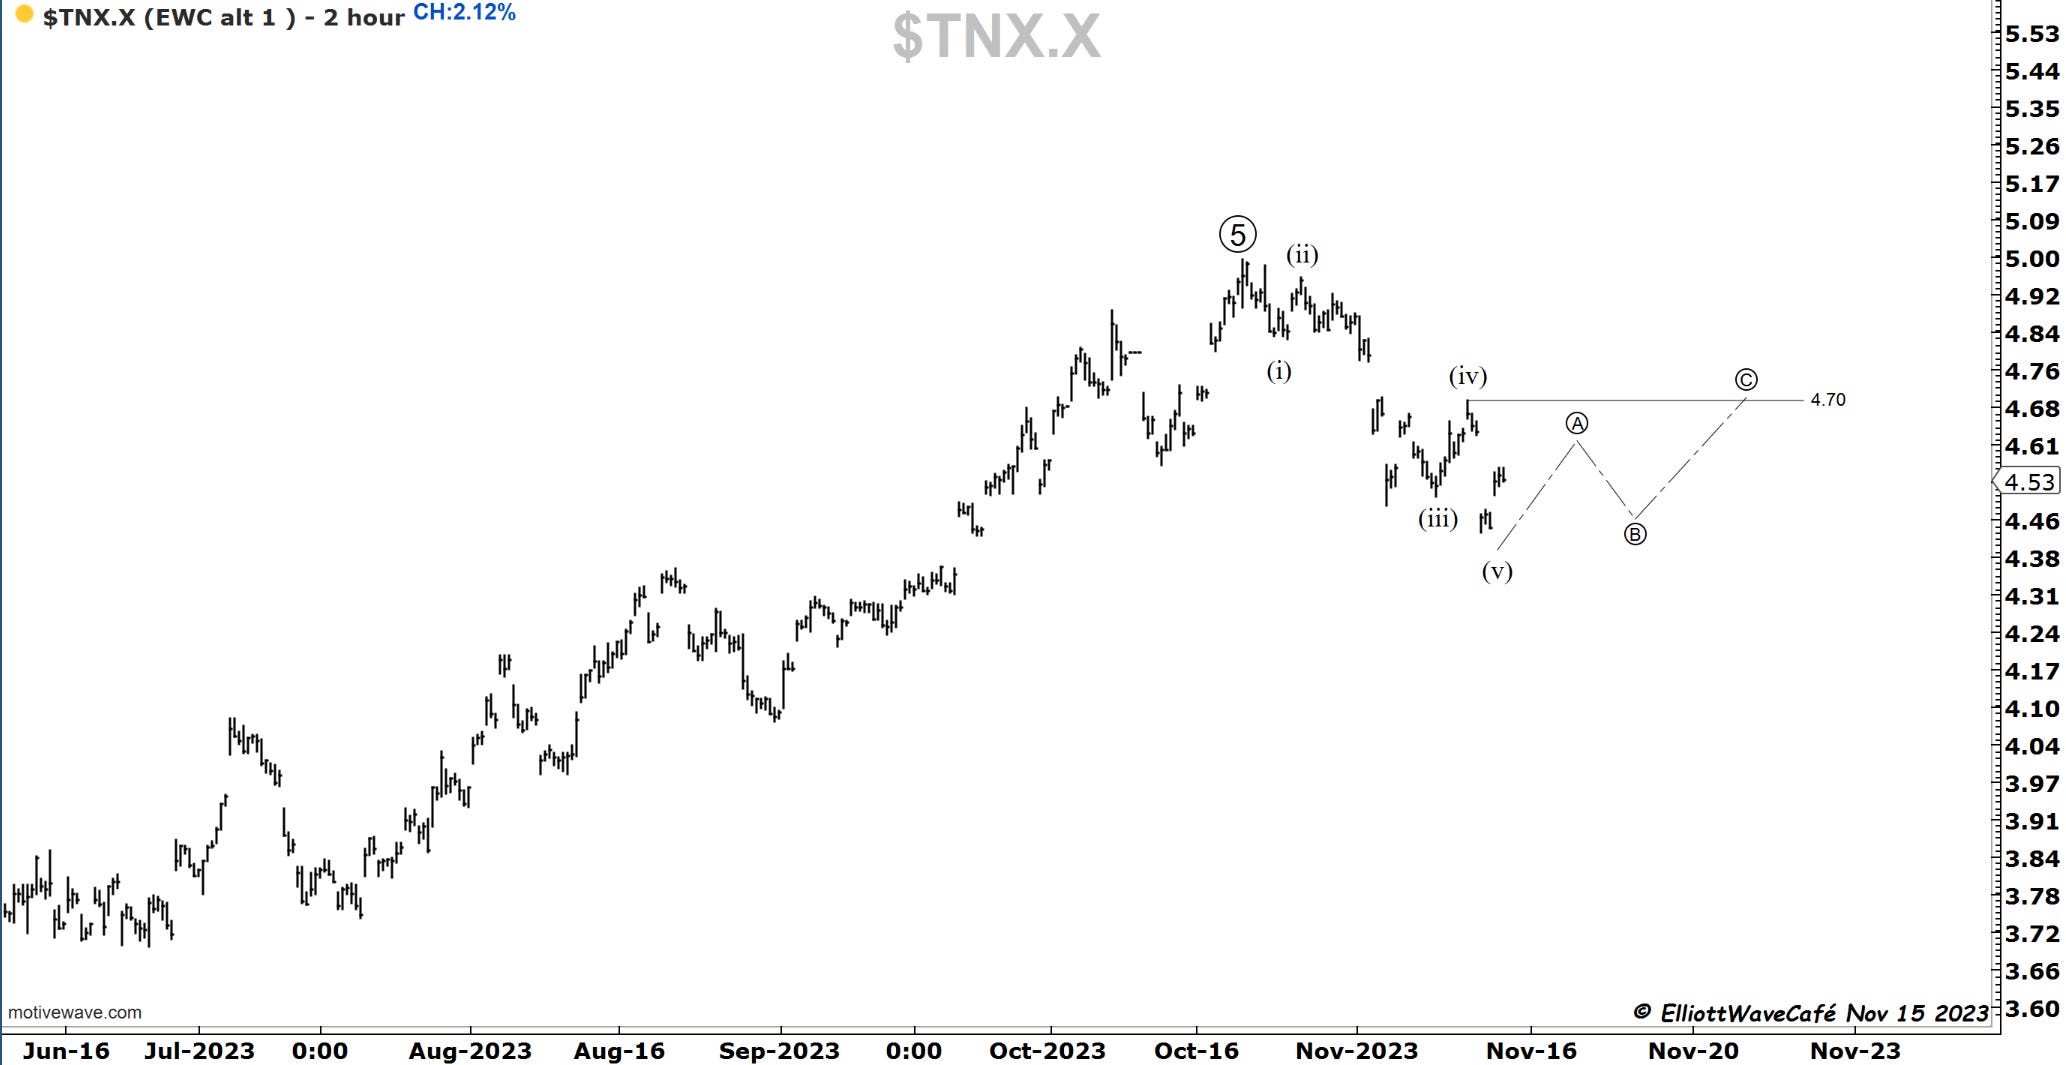
We got a 2% rally in yields today. This is in line with my expectations for a 3-wave setback towards 4.70 or above. Will monitor this, but sentiment toward lower yields straight away and calls for 4% are a bit premature. Markets love to take their time and create frustration. Why would they make it easy?
Gold
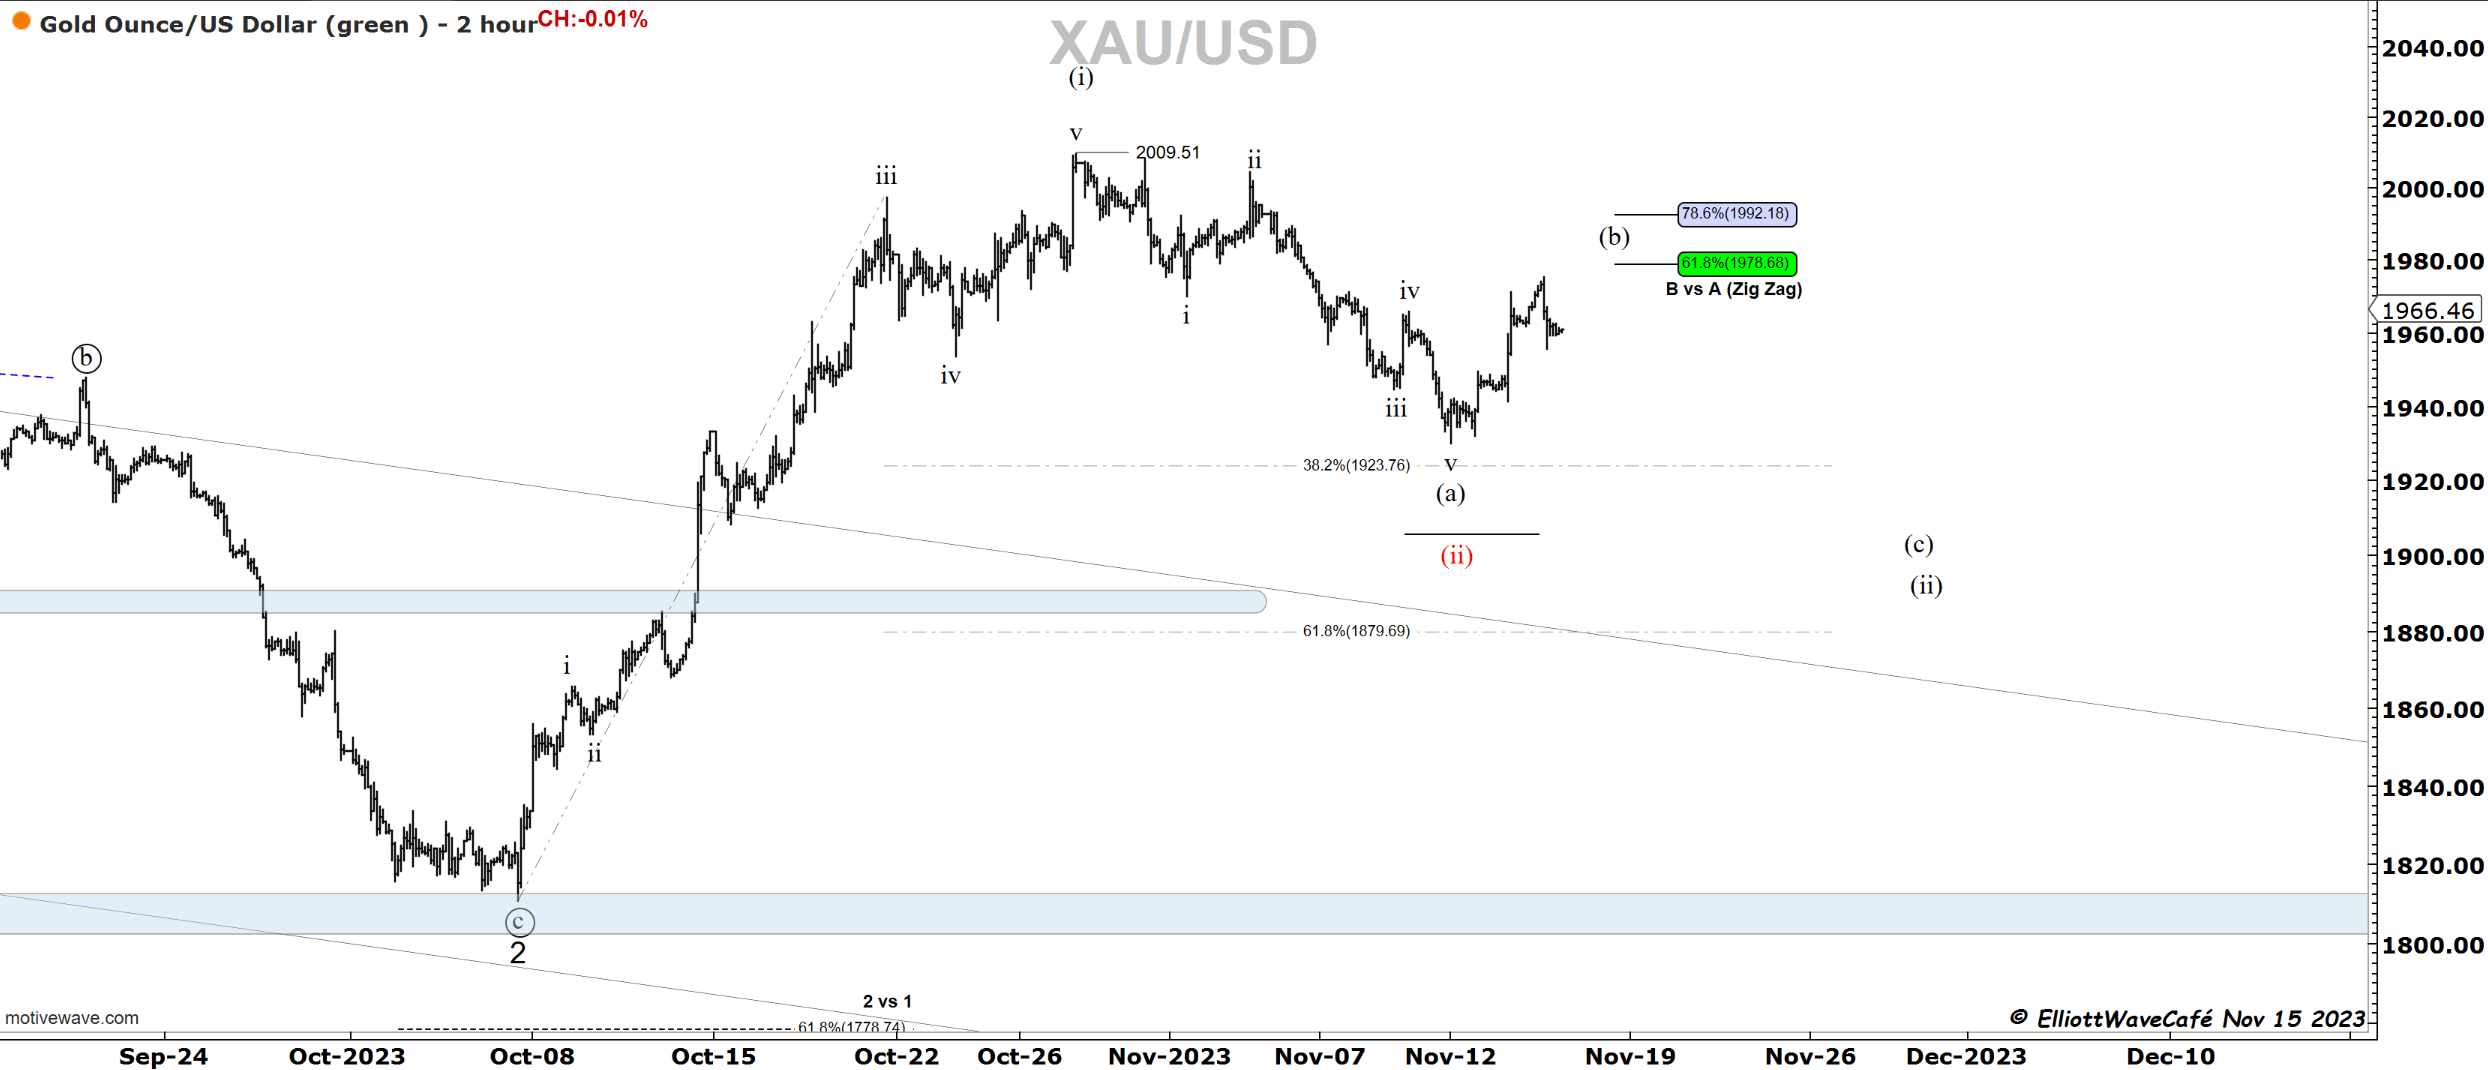
Gold has rallied about 61.8% of the latest decline. It’s about as high as I would like to see wave (b) of a zigzag travel. My expectations are for a wave (c ) to ensue to complete wave (ii). If we travel above 78.6 that expectation will start to diminish and the 5-wave decline might need to be labeled as an ABC. But one thing at a time.
Bitcoin
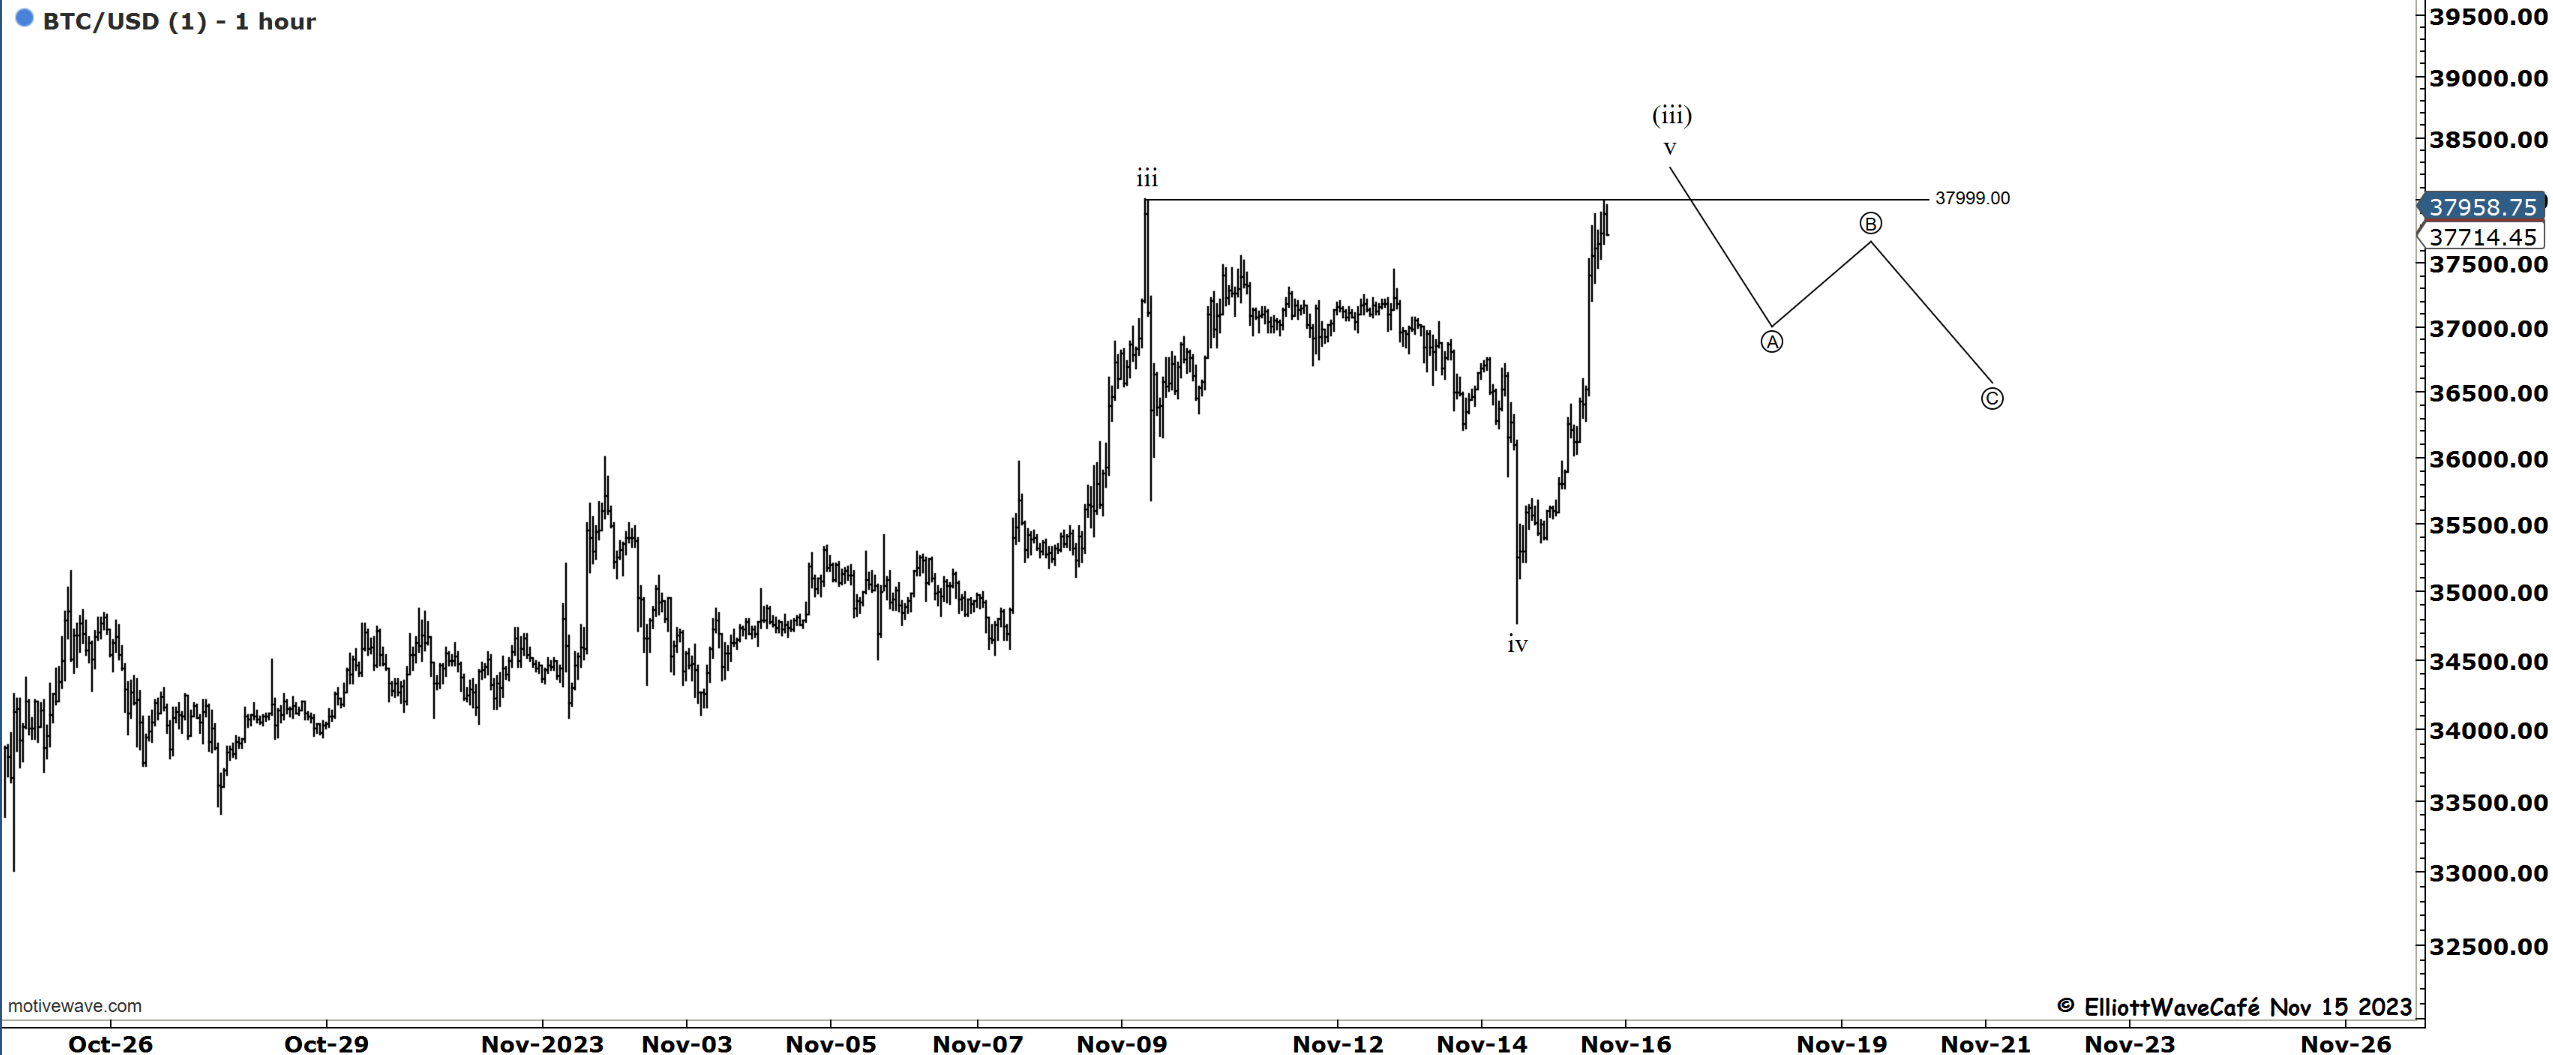
Well, that was a quick run back higher. Was that end of wave ((iv)) already or the wave iv in the second chart? Whichever one it is, it leads to the current move being a 5th wave that should be further followed by another corrective move. So no, I do not think this is the beginning of anything stronger to the upside at this stage. Both the volume and momentum indicators seem to be fading.
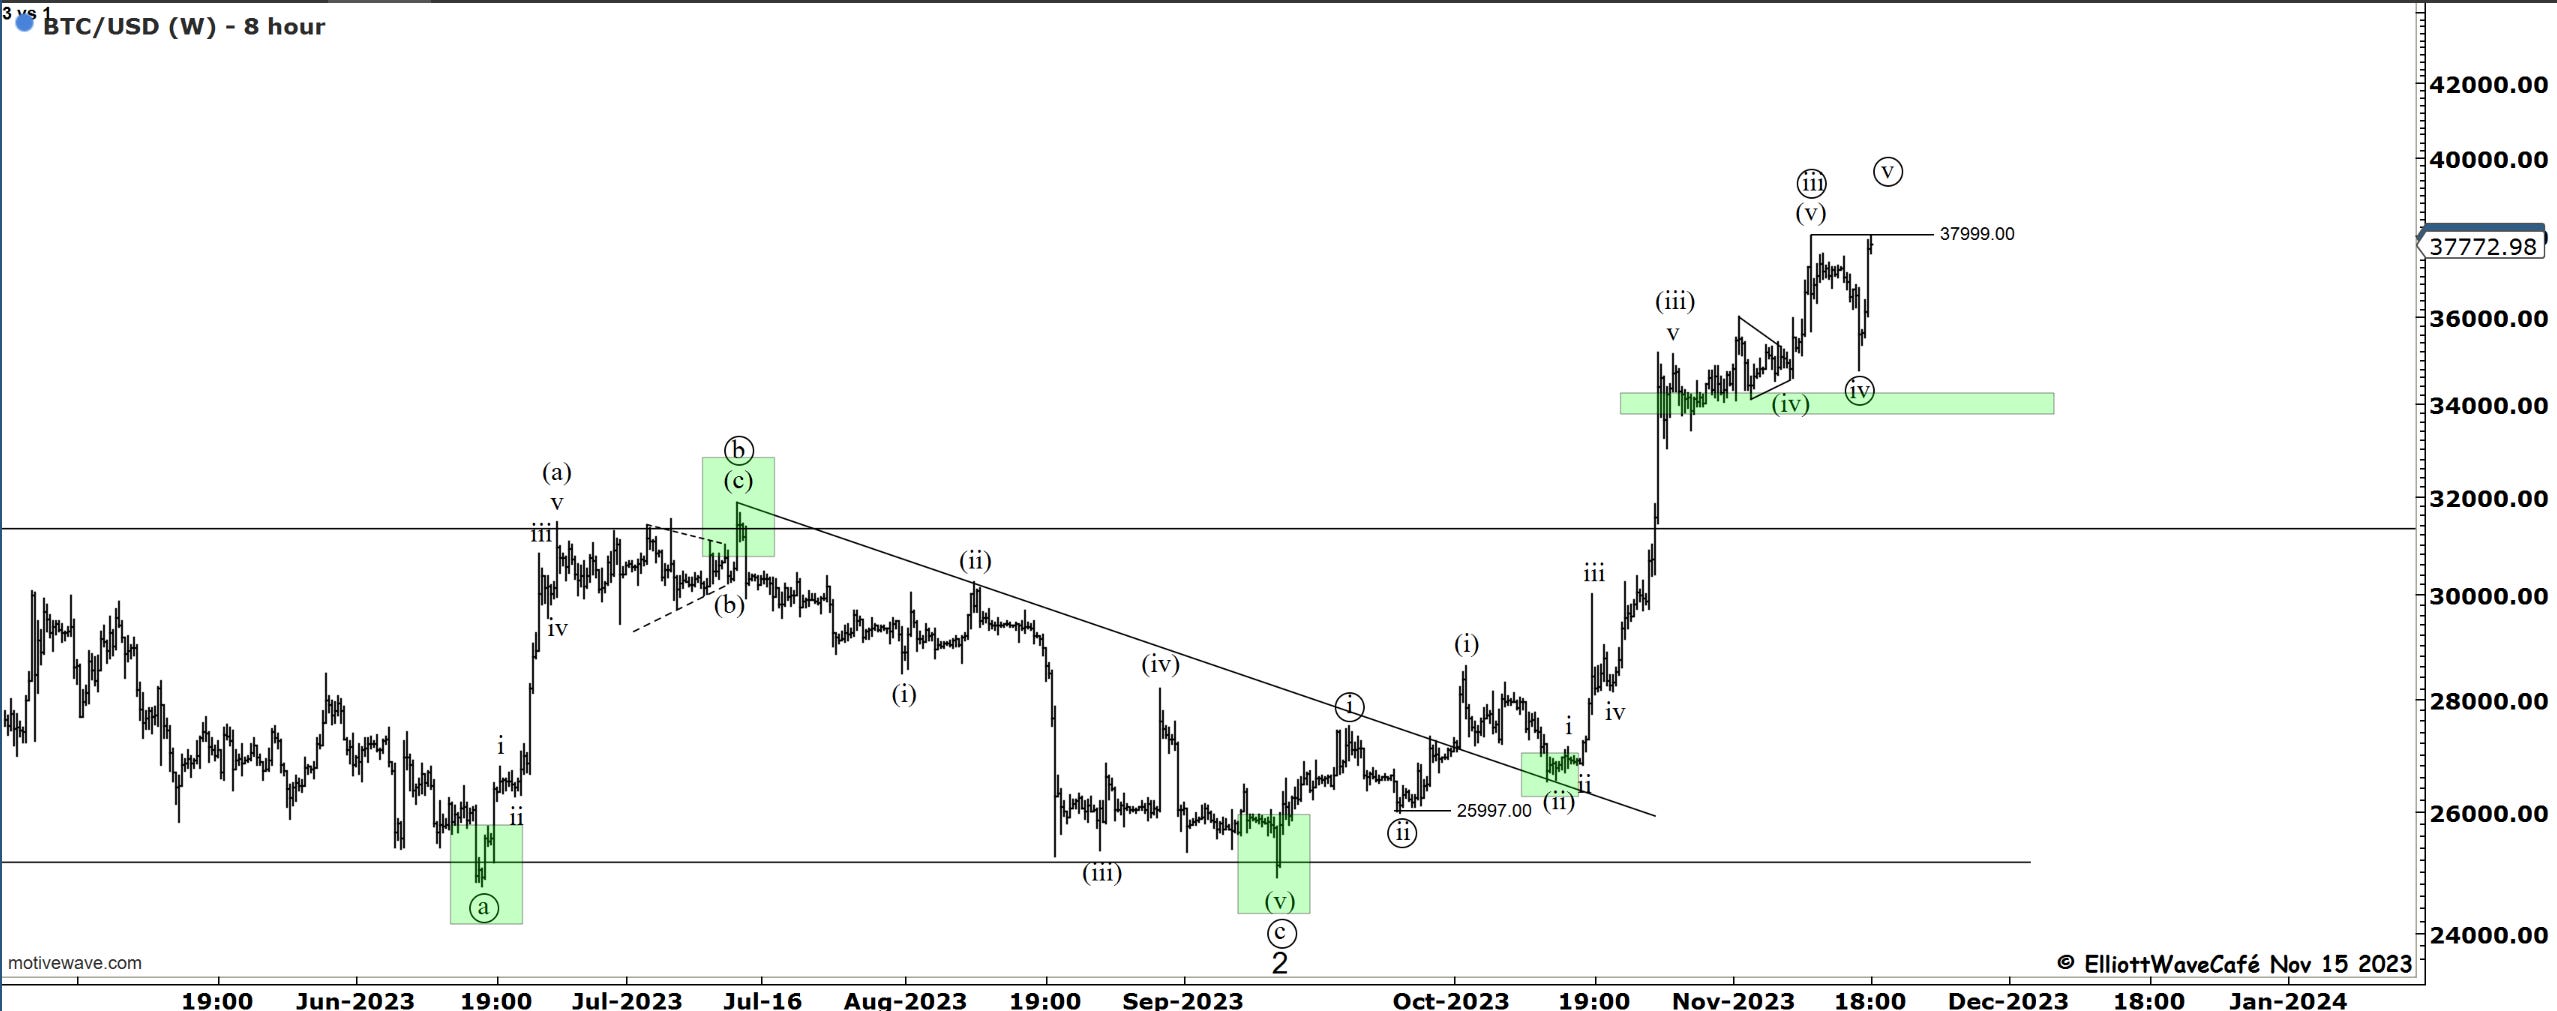
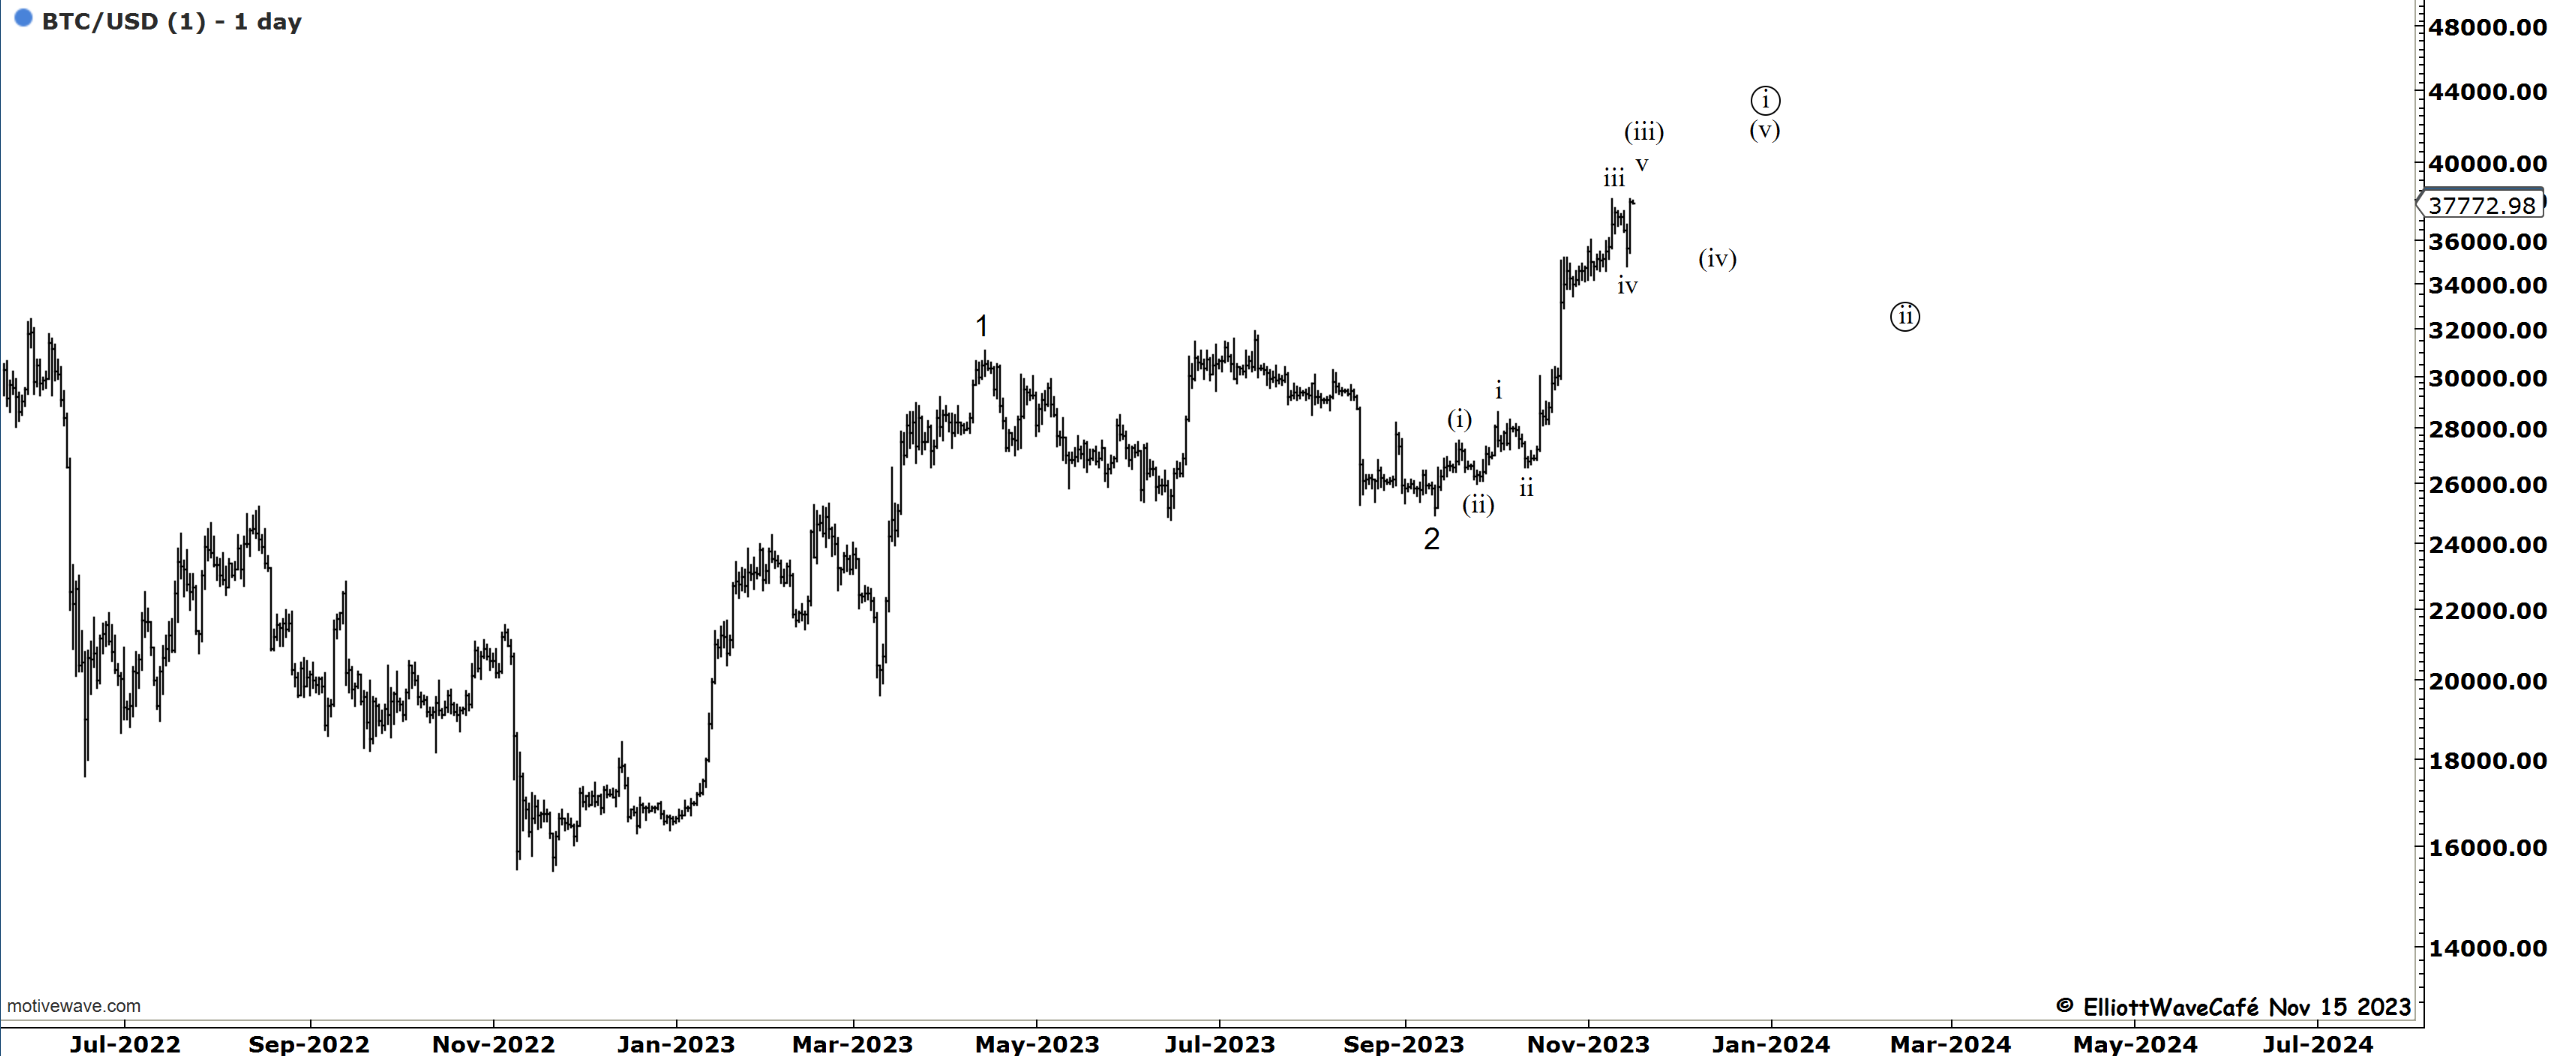
Something like this for the time being when you zoom on the chart above.
Once again BTC seasonality until roughly mid-December.
Daily video coming up next for members,
Have a great day wherever you are! - trade well, and don’t forget to subscribe and drop a like if this letter helps you in any way.
email: ewcafe@pm.me
In my opinion fast and furious upmove happens during wave X when mkt wants to do time consolidation for 6/8 months from recent high