
The Daily Drip
Core markets charts updates and commentary
Note: The counts on the right edge are real-time, and they are prone to adjustments as price action develops. Elliott Wave has a fluid approach, is evidence-based, and requires constant monitoring of certain thresholds.
In the counts below, this (( )) = circle on chart
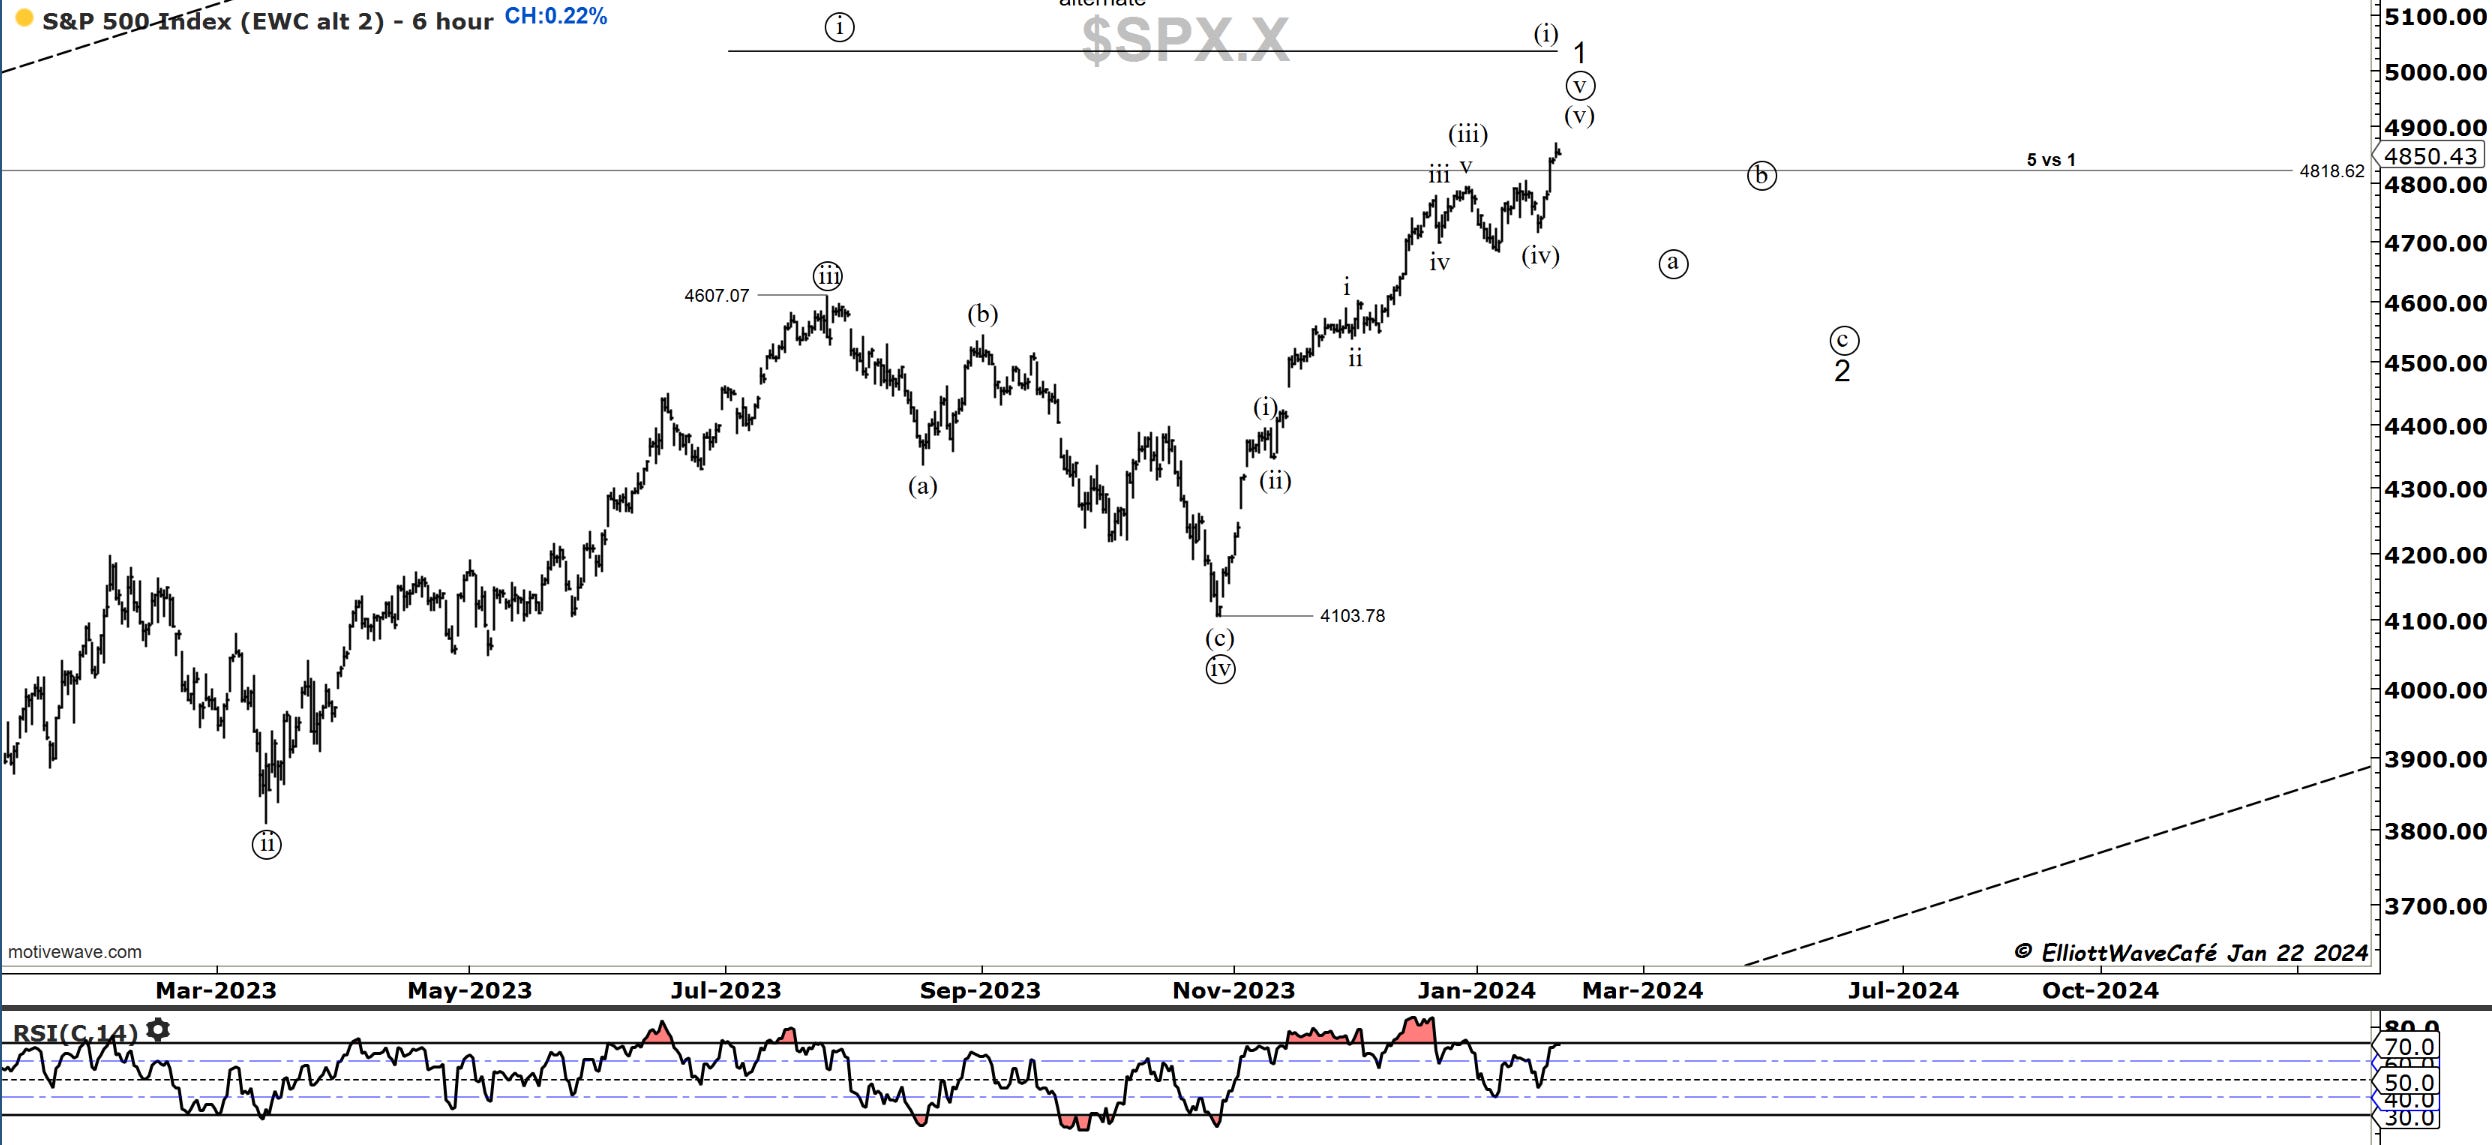
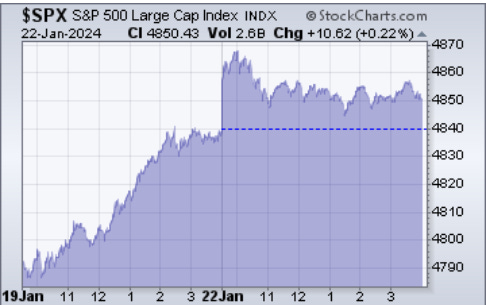
SP500
We made new all-time highs on Friday, and even today’s futures started with a bang, only to run out of steam soon after the opening. I have reworked the SP500 count to allow for better proportion and somewhat cleaner internal legs. The idea is the same: The current rally is nothing else but a 5th wave with a proper corrective structure to follow. For better confirmation, the price would need to break back below that suggested wave (iv) low. The easy money has been more easily made between the end of October and mid-December. Since then, it’s obvious that the market has been struggling to continue advancing at an accelerated rate. The bottom line is that even if we broke to new ATH in what is a larger bullish development, the risks remain elevated, and before we continue on the upward path, we need to see an appropriate wave correction. This should last somewhere until mid-March.
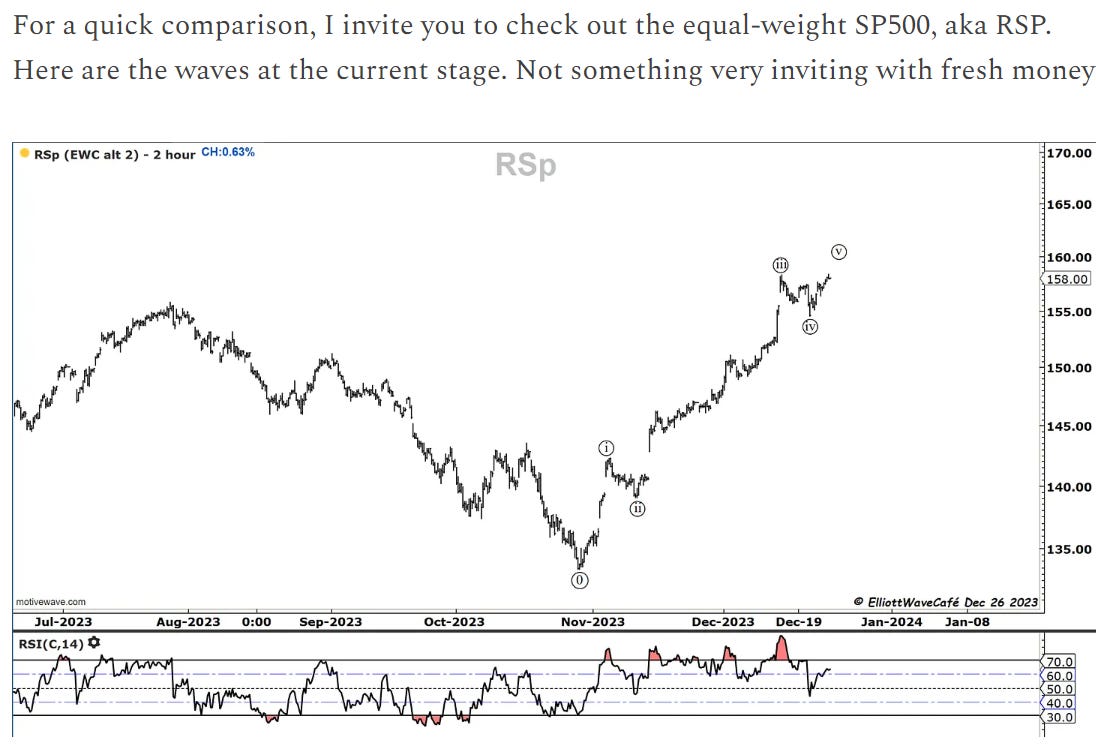
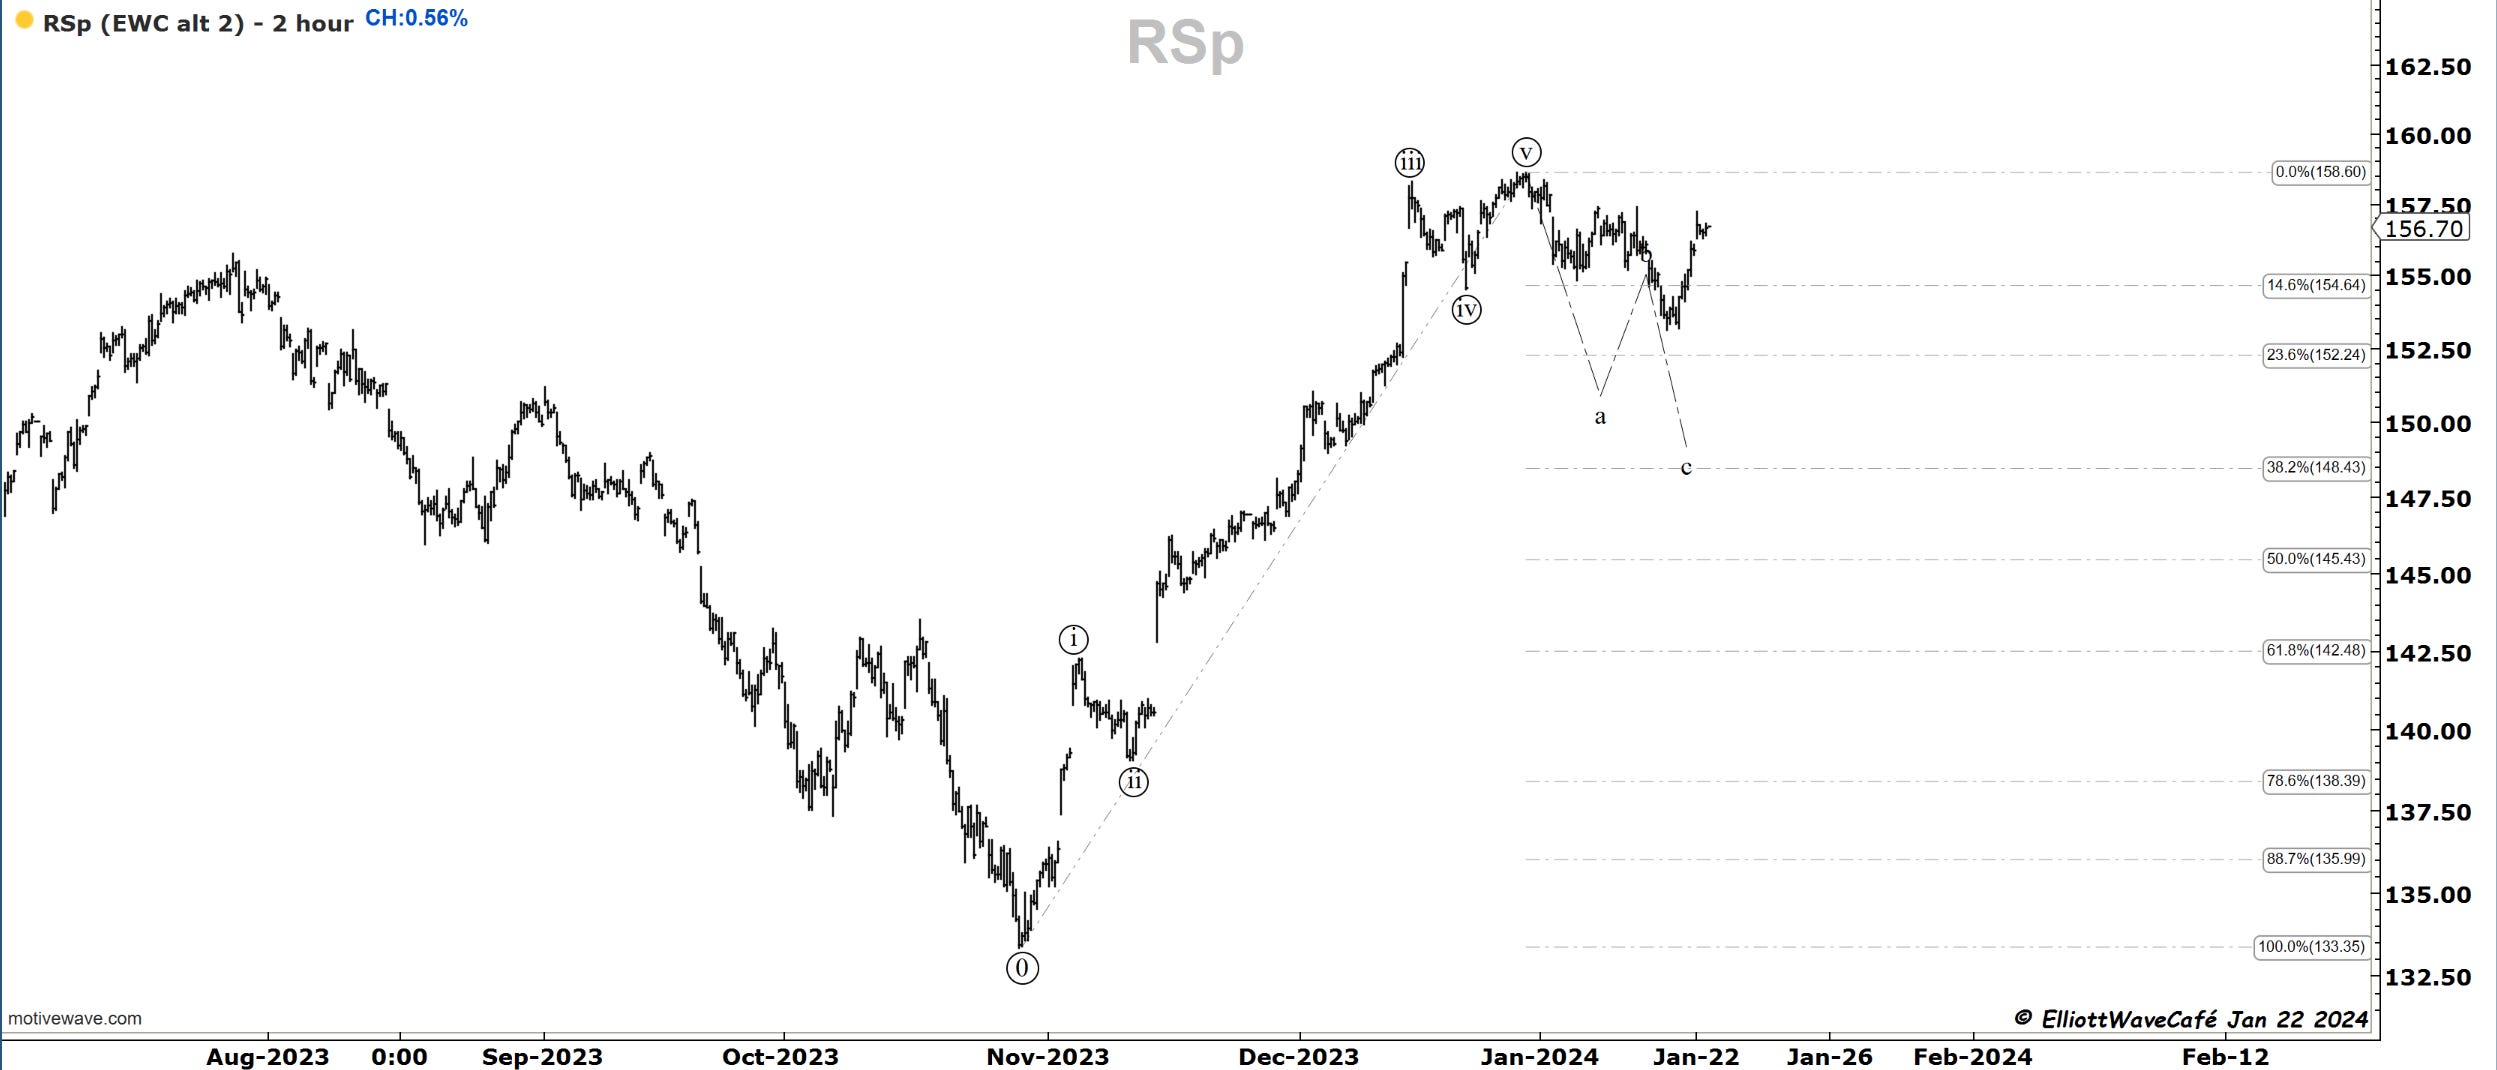
Here is the equal-weighted Sp500 , ticker RSP. We looked at this count back on Dec 26th since it seemed clearer in the wave count.
Here is the updated version. We have done a nice 3-wave correction since then, but only to the tune of 23% fib. One could argue that this is the end, and we’re about to move higher. My bet is that the correction is insufficient both in time and price. Even if it goes to another high, it will likely be a fifth wave, and I mislabeled the end of wave ((iv)). I will cover more in tonight’s video.
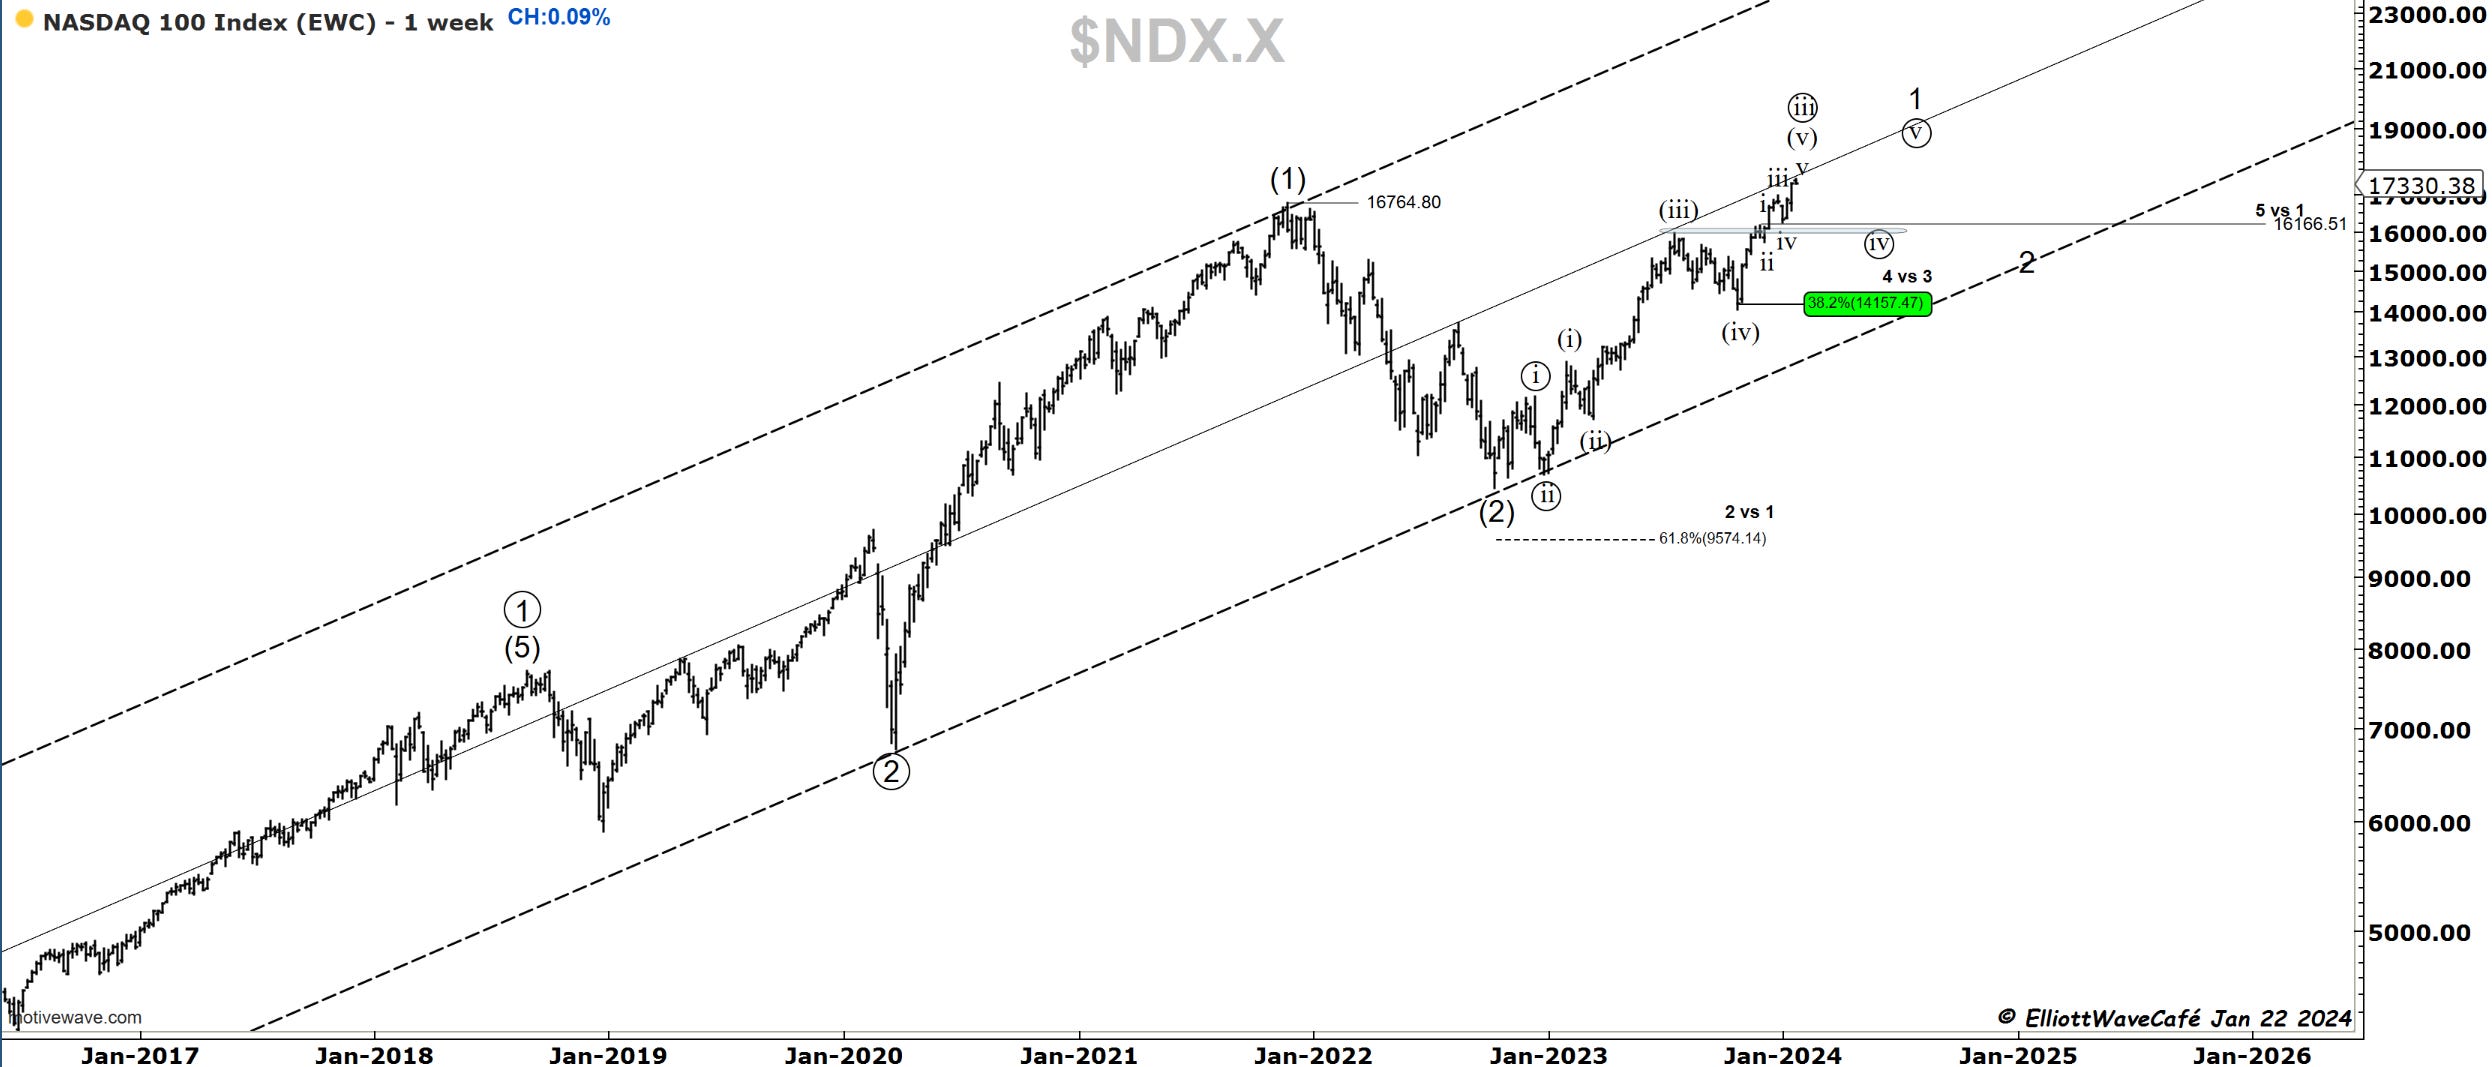
Nasdaq100
Here is the weekly view of the Nasdaq100. We are hugging the middle line of the larger uptrending channel. Since wave (iv) pulled back to 38.2%, I view the current advance as wave (v). This elevates the risk of owning this market at current levels and with the present structure. If we break back below 17k, it would start to confirm this outlook.
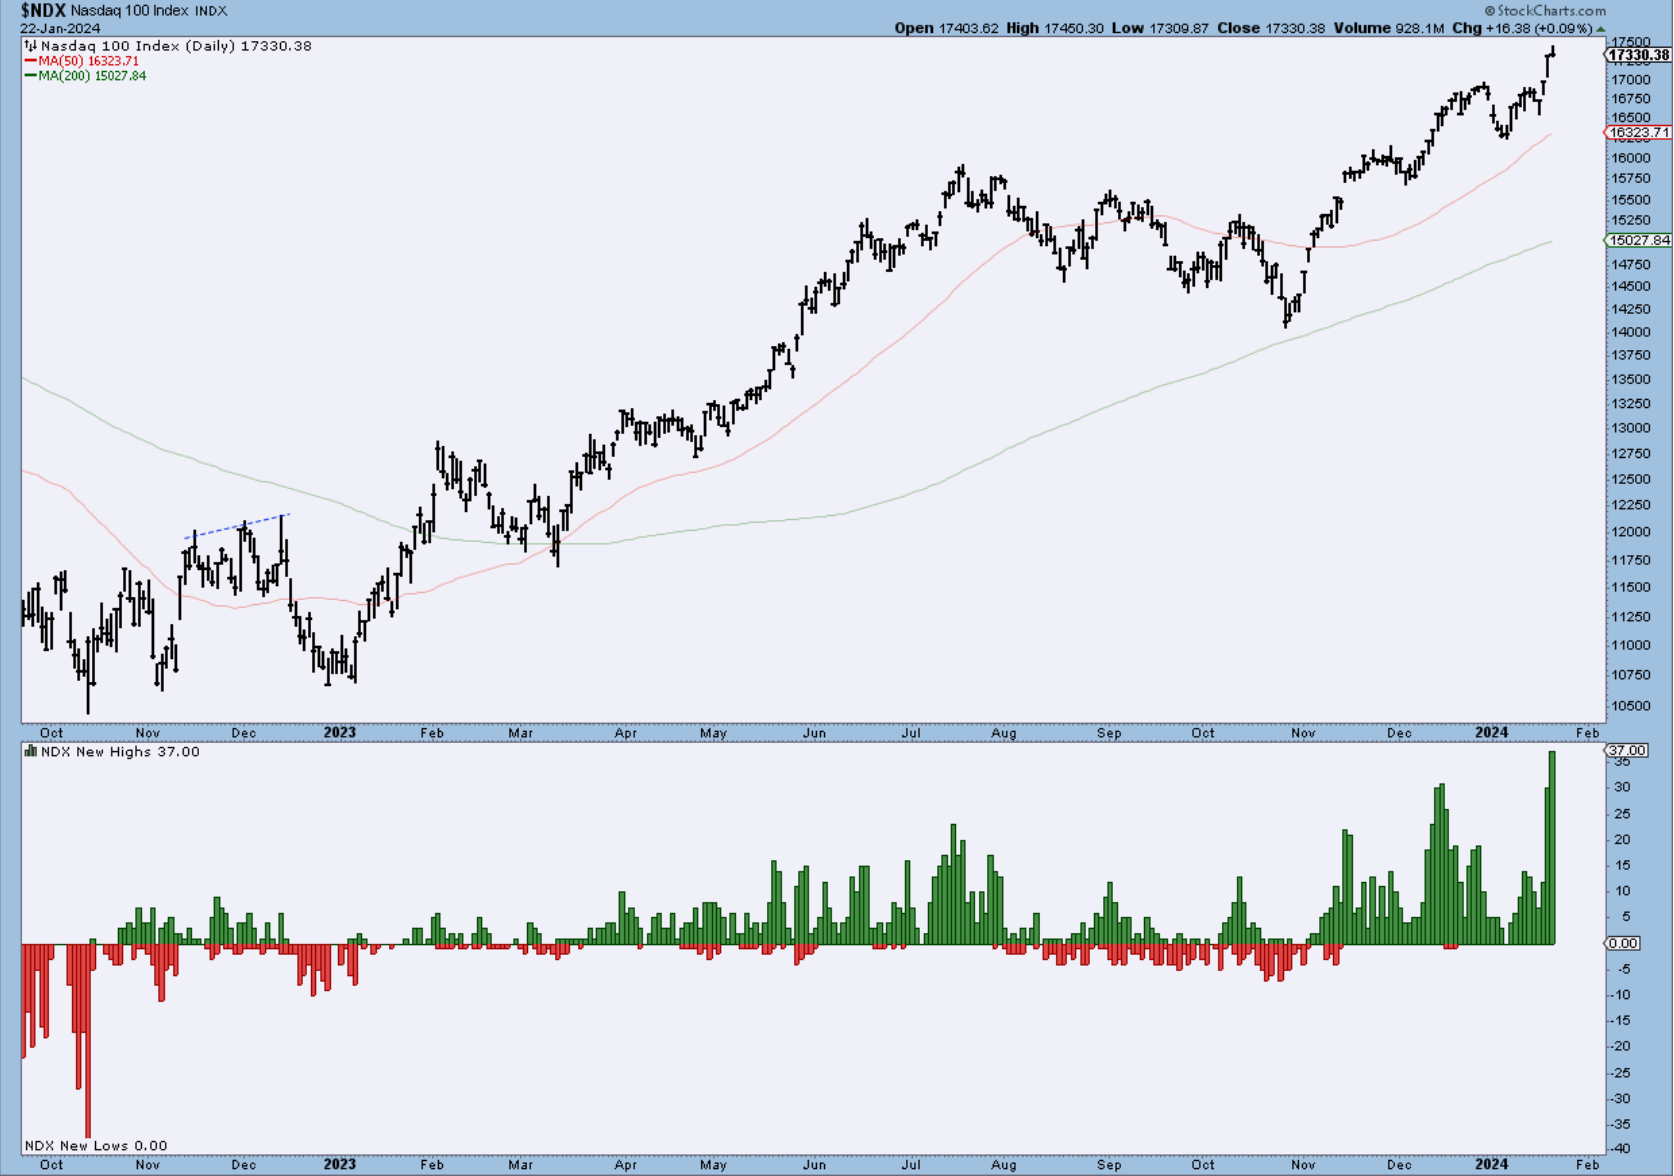
Here is an amazing number. You would have to go back more than 10 years to find something like this. 37 stocks out of 100 in the NDX have made new 52-week highs in a day. While it’s a great development, it’s very hot from a historical perspective. Smells like a blow-off before the cool-down period.
RUSSELL 2000
We expected a decent support zone in the small caps last week and the likelihood of a rally. She managed to advance 2% only today. It was a day in the sun for the small caps while the rest of the indices struggled. Remember that these stocks have been heading lower the last couple of weeks while the other indices have been trending up. We restored a bit of that imbalance. It gets a bit tougher from here in terms of future prospects. If the larger cap markets start pulling back, how will small caps behave? A breakback below that swing label (iv) would not be constructive for this area of the market. The larger resistance line sits just above.

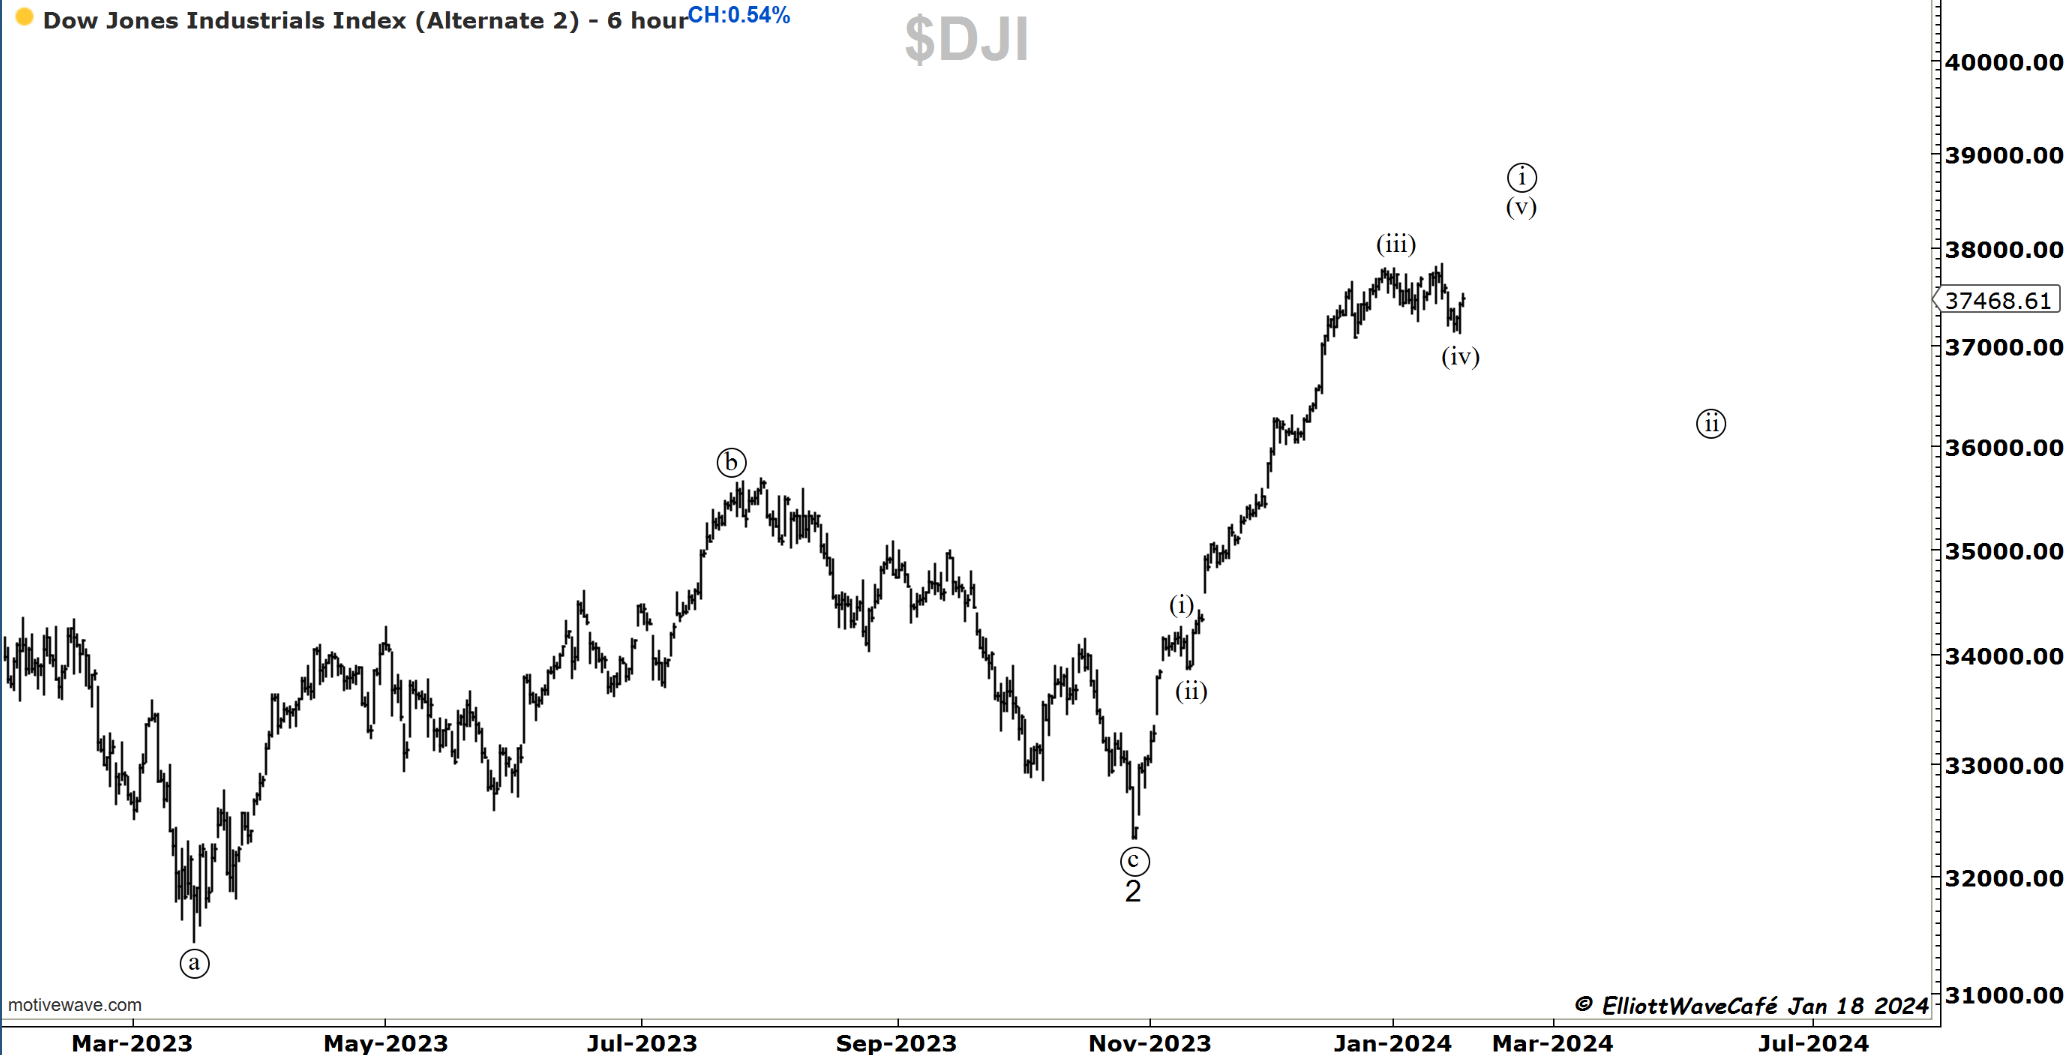
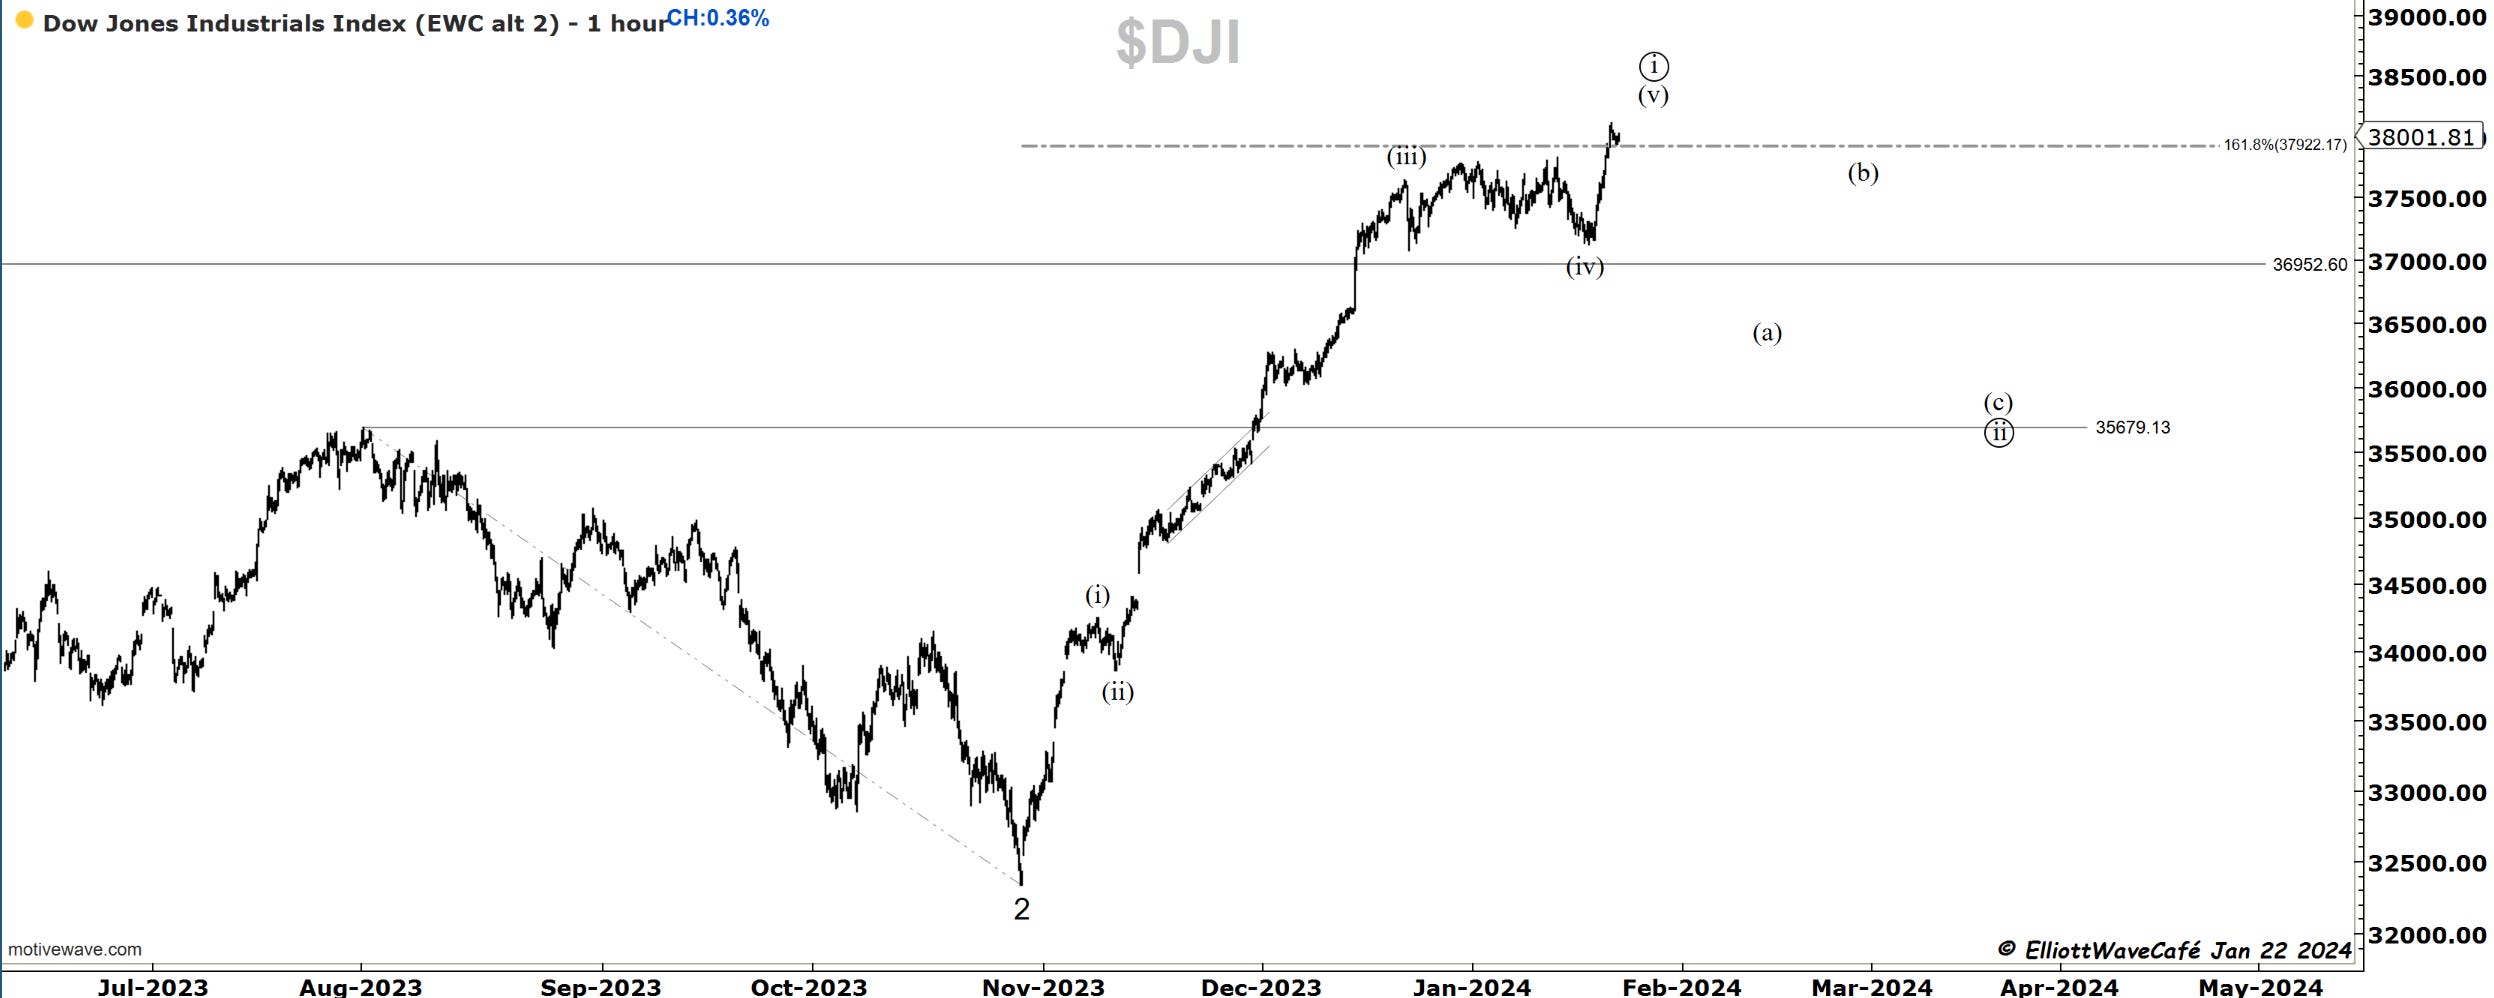
Dow30
The backup count has kicked into gear, and we made a new high in the Dow Industrials. To me, this smells like a terminal move. The wave (iv) was tricky, and it took a couple of small legs to be finished. I actually like the look of this much better.
I will personally be starting to initiate shorts in this index. One could wait for a break below wave (iv) low if looking for confirmation. Another way of doing this is to wait for wave (a) to form and then short a (b) wave rally.
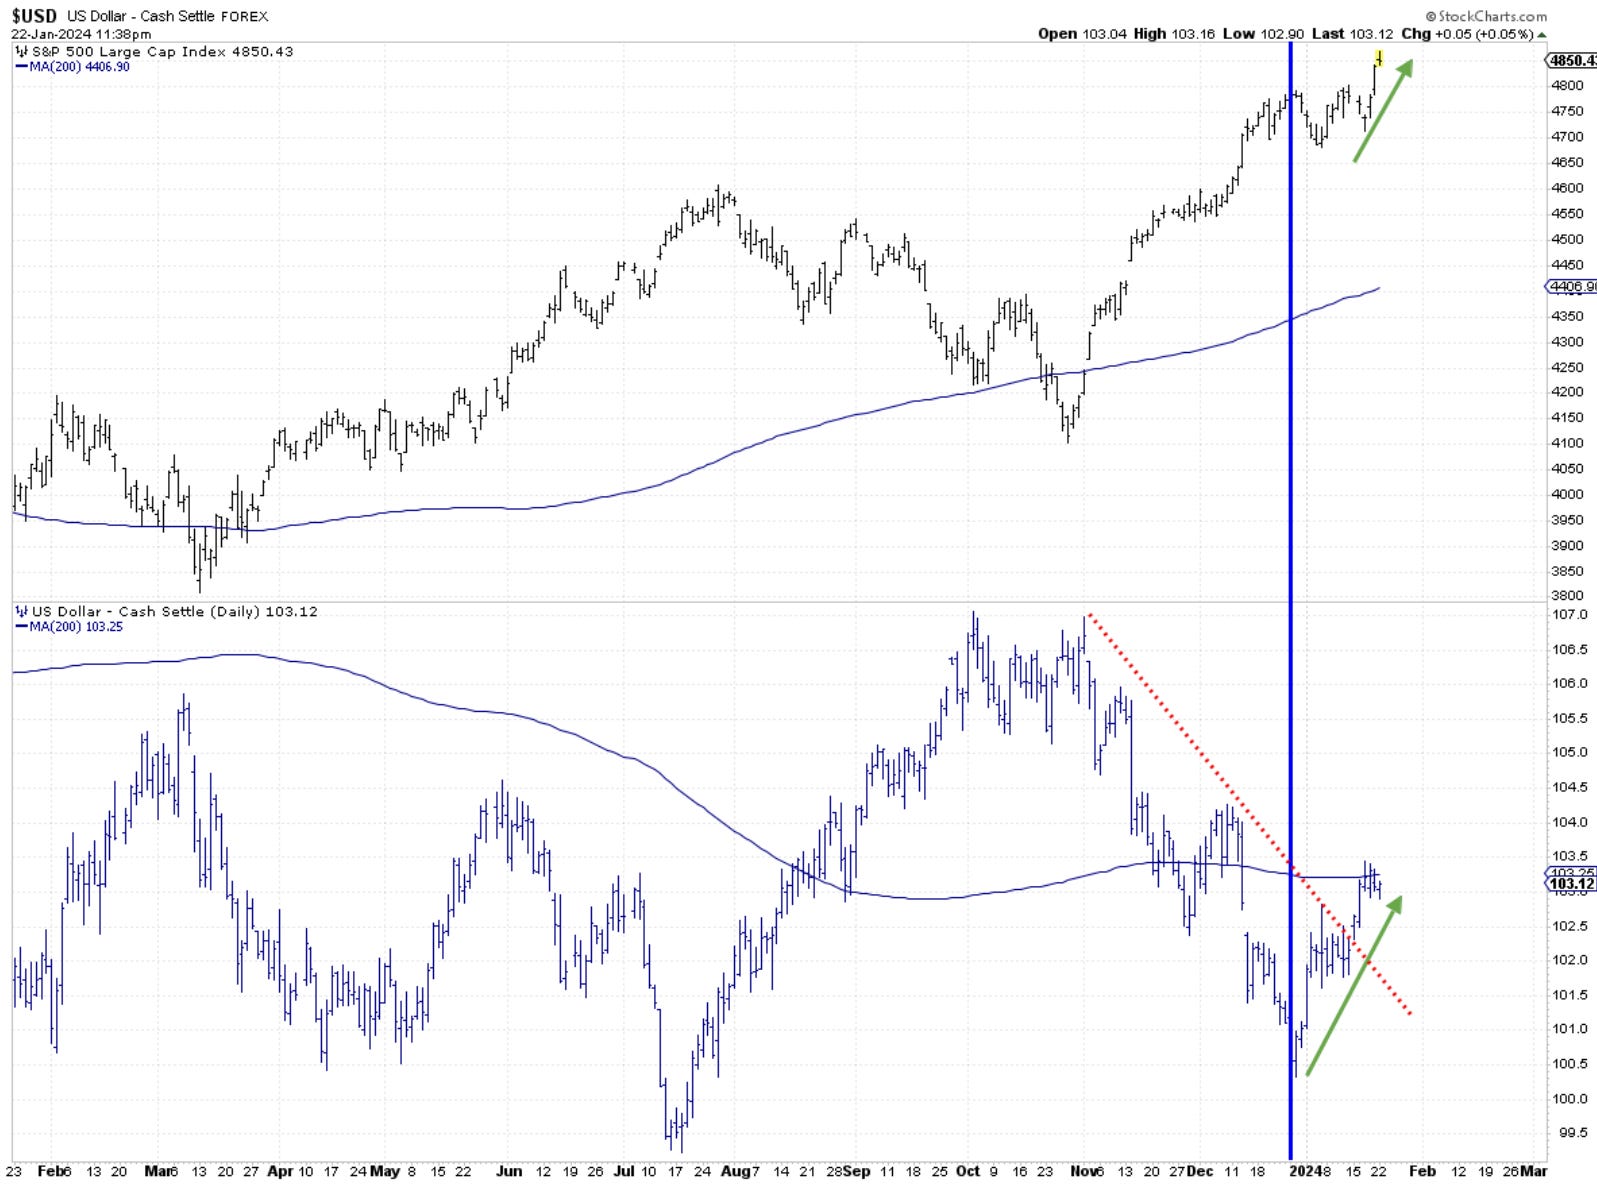
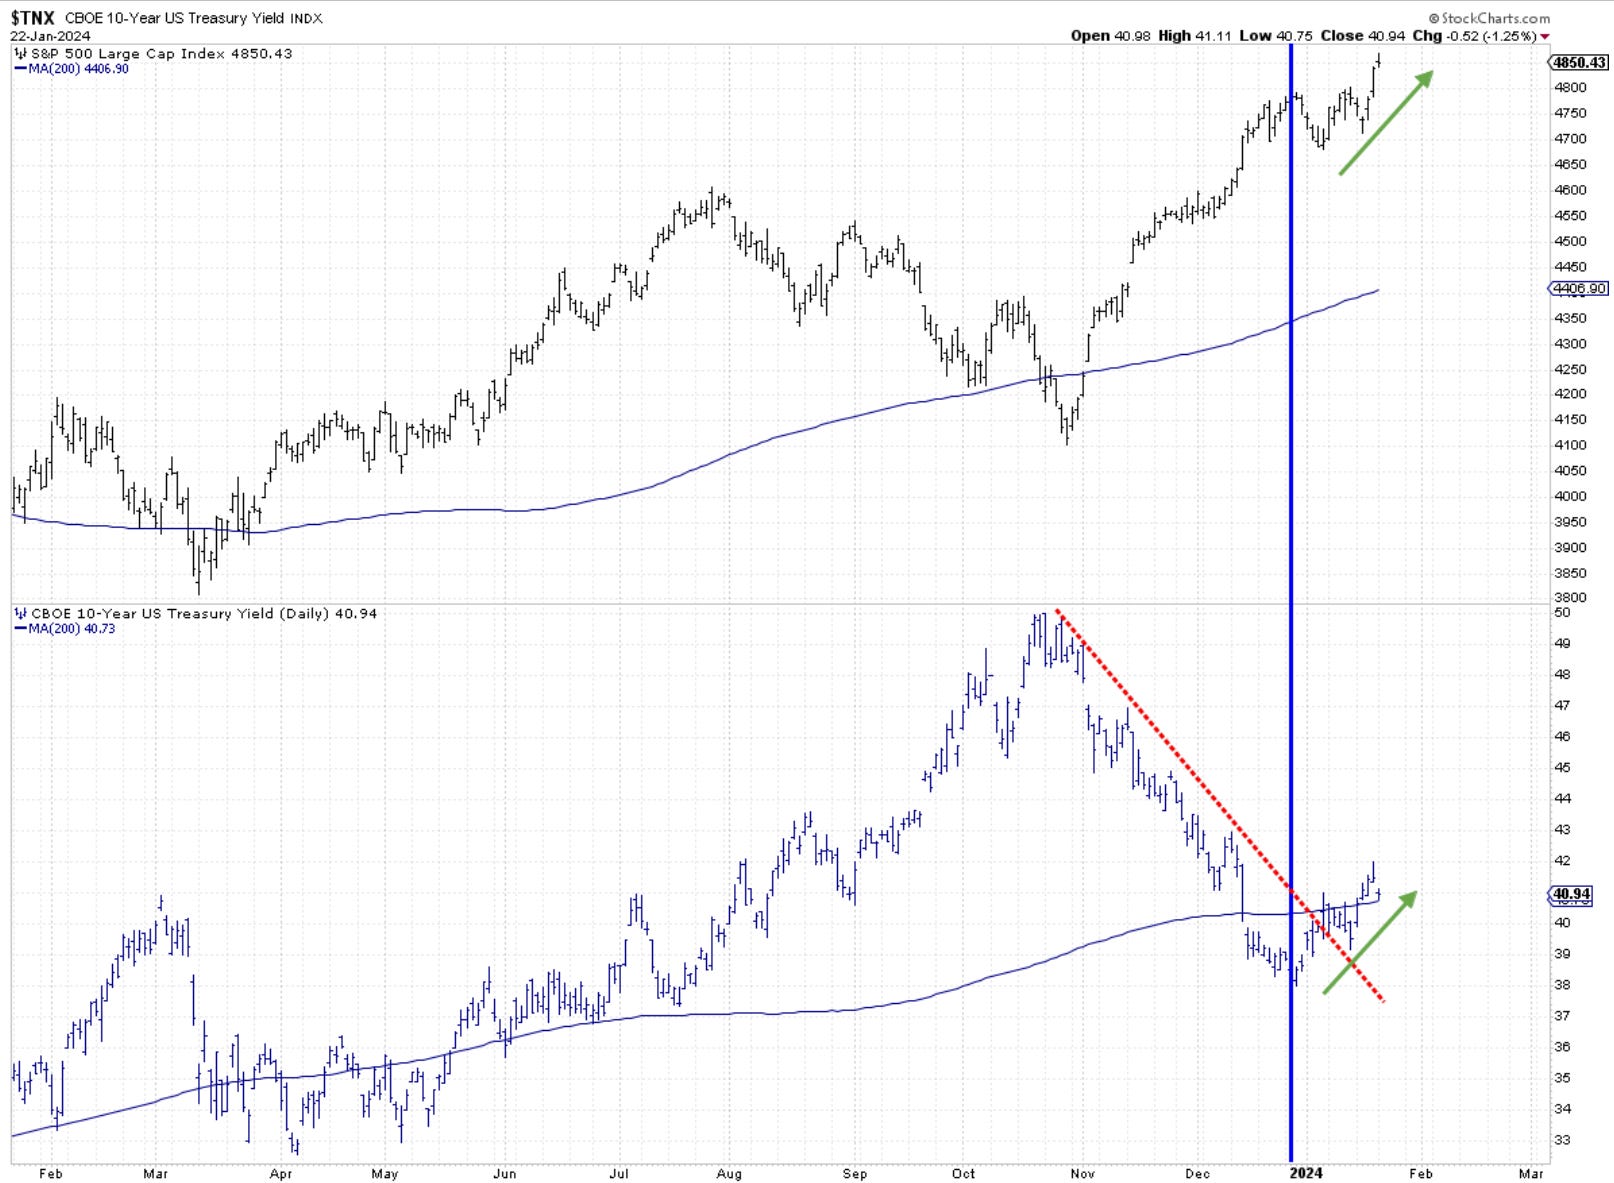
US Dollar and Yields
Both Dollar and Yields have bottomed at the end of last year. It is shown with the vertical blue line in the charts below. Stocks have managed to stage a breakout rally in spite of these two markets historically providing headwinds to such moves. They have also break out of their downtrends and violated the trendlines. While nothing is 100% guaranteed in markets, this behavior suggests that one must be cautious owning too much risk at these levels.
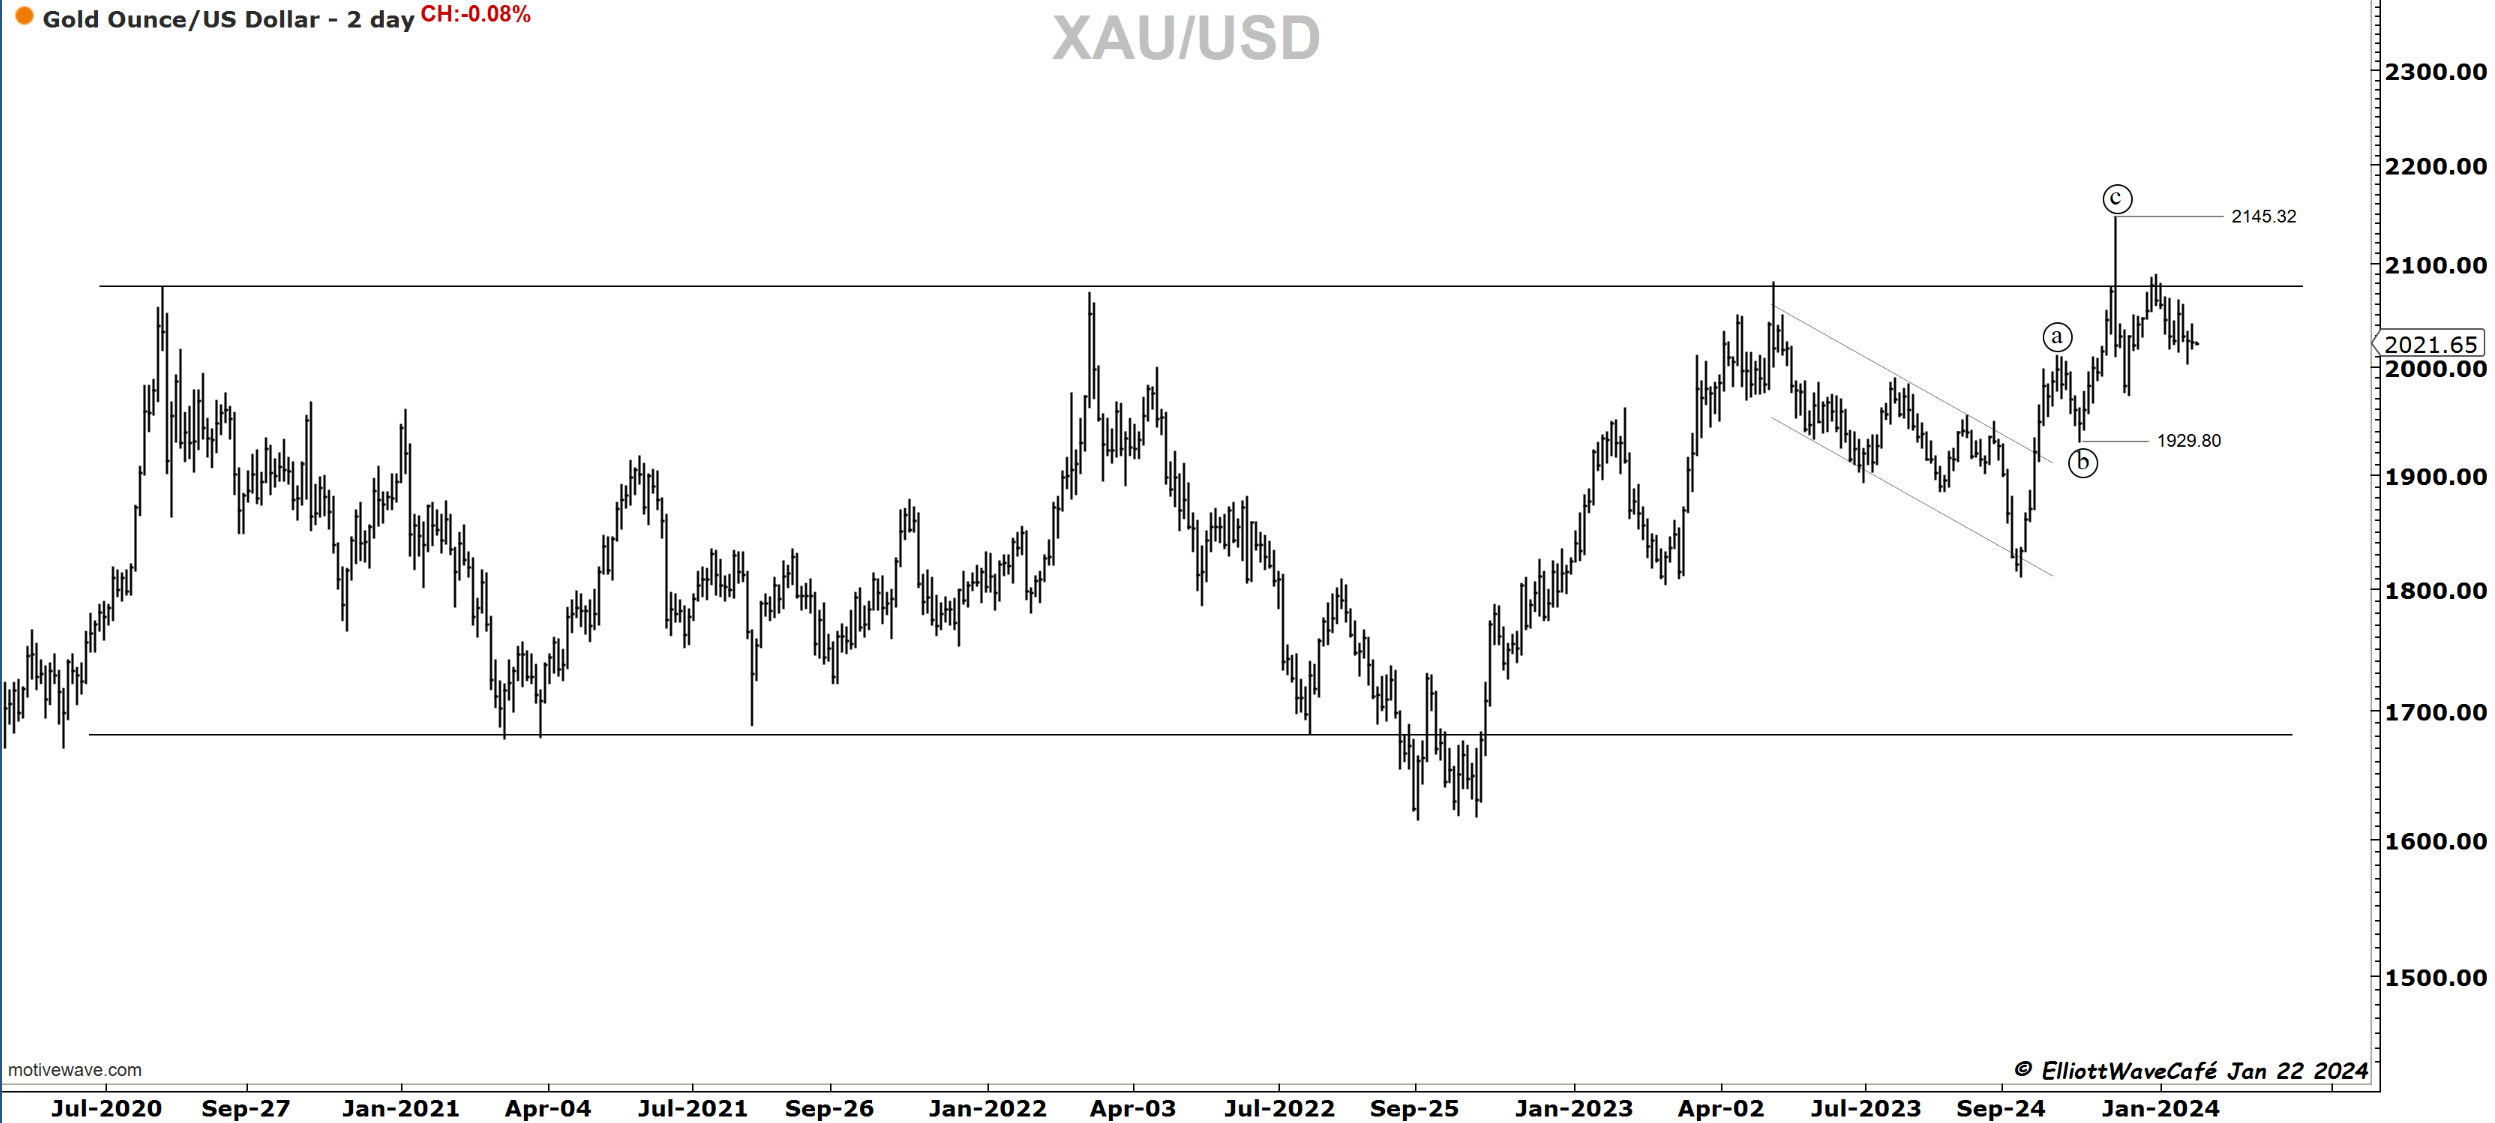
Gold
I continue to look at Gold in a multitude of ways, and I arrive at the same conclusion. I hate this market :). I might stop covering it until it gives me something to work with. That failed breakout has probably frustrated thousands of traders. It’s a three-wave move; not too many questions there. It’s probably right to own it above 2100. Until that happens, it’s a big load of nothing. Below 1960, it opens a larger can of warms.
Bitcoin
The move lower in Bitcoin started after we hit the top of the channel and the ETF market was approved. However “wrong” it felt at the time, thinking “short” was the right thing to do. Sometimes, if we bury all the news and look at charts, they have lots of answers for us. It is the “bombardment” of comments and the news cycle that derails a trader from seeing the evidence in price.
We are now hitting the central line of the ascending channel, a place that can offer some temporary bearish relief. I continue to believe that if we get any bounces, they will be short-lived, and this market will continue to move towards 36k area.
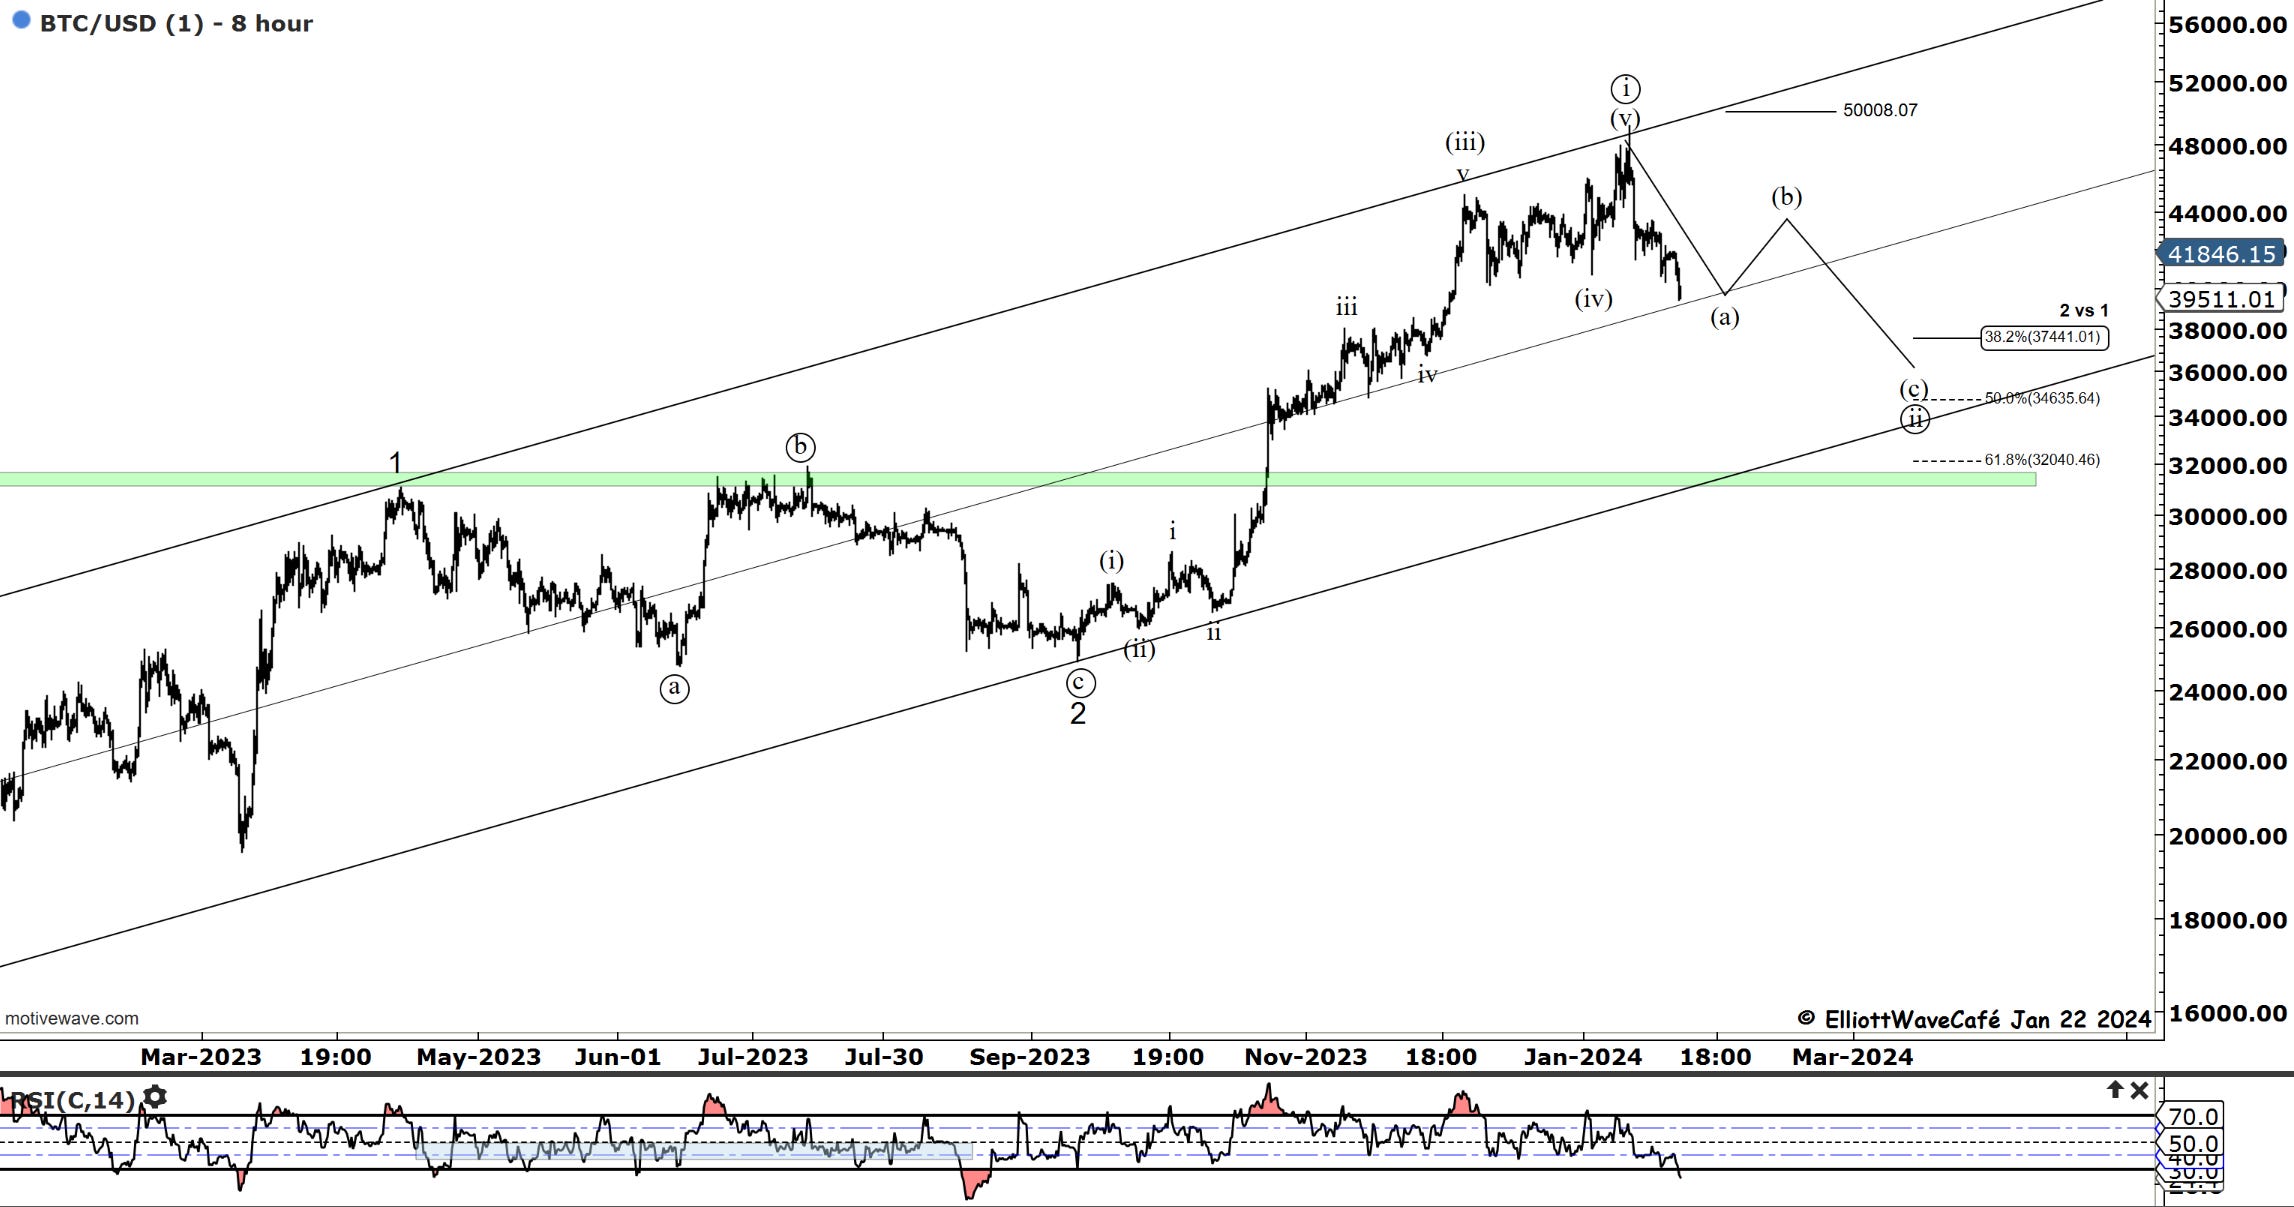
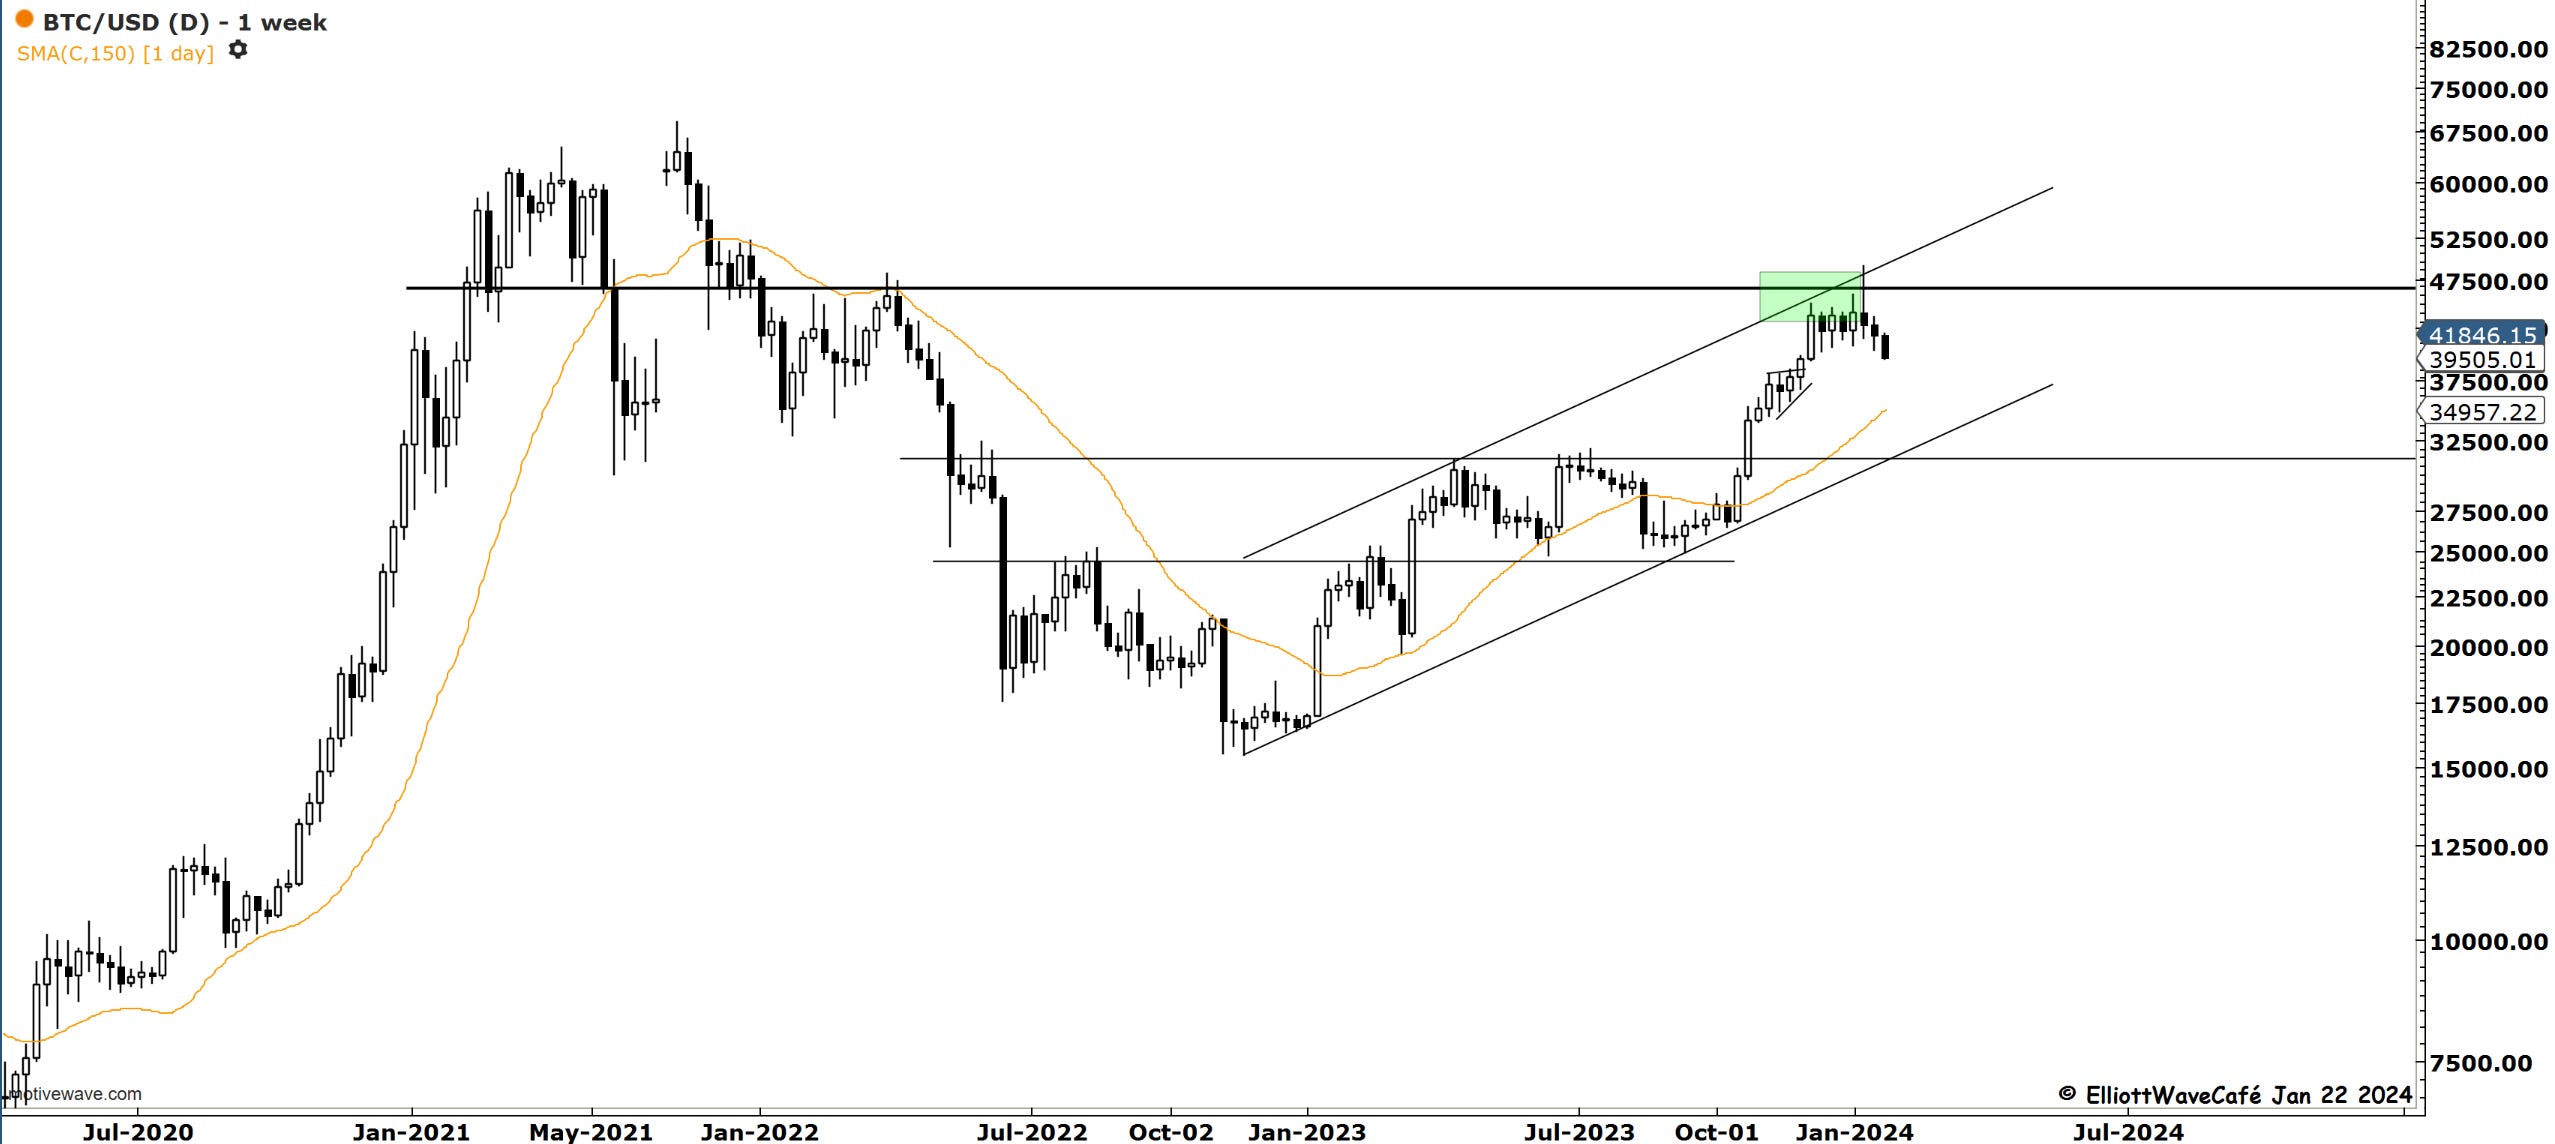
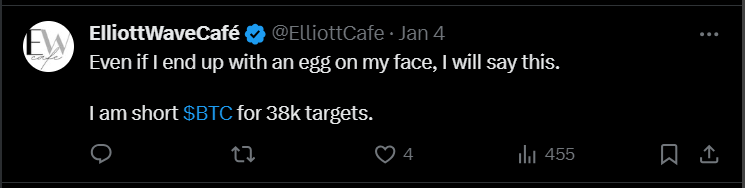
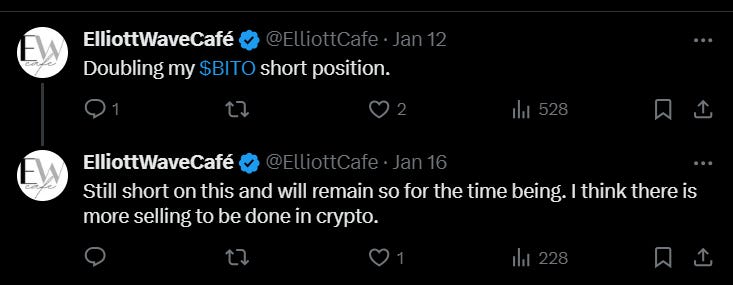
From a trading perspective, you can see my takes below. I started a bit early on Jan 4th, then doubled on Jan 12th. I usually try to eat what I preach.
“Double shot” Daily member video coming up next,
If you’re new to Elliott Wave or need to refresh, there is a 7-hour video course with downloadable slides under The Coarse tab on the website.
Have a great day wherever you are! - trade well, and don’t forget to subscribe and drop a like if this letter helps you in any way.
Cris
email: ewcafe@pm.me