
The Daily Drip
Core markets charts updates and commentary
Note: The counts on the right edge are real-time, and they are prone to adjustments as price action develops. Elliott Wave has a fluid approach, is evidence-based, and requires constant monitoring of certain thresholds.
In the counts below, this (( )) = circle on chart
SP500
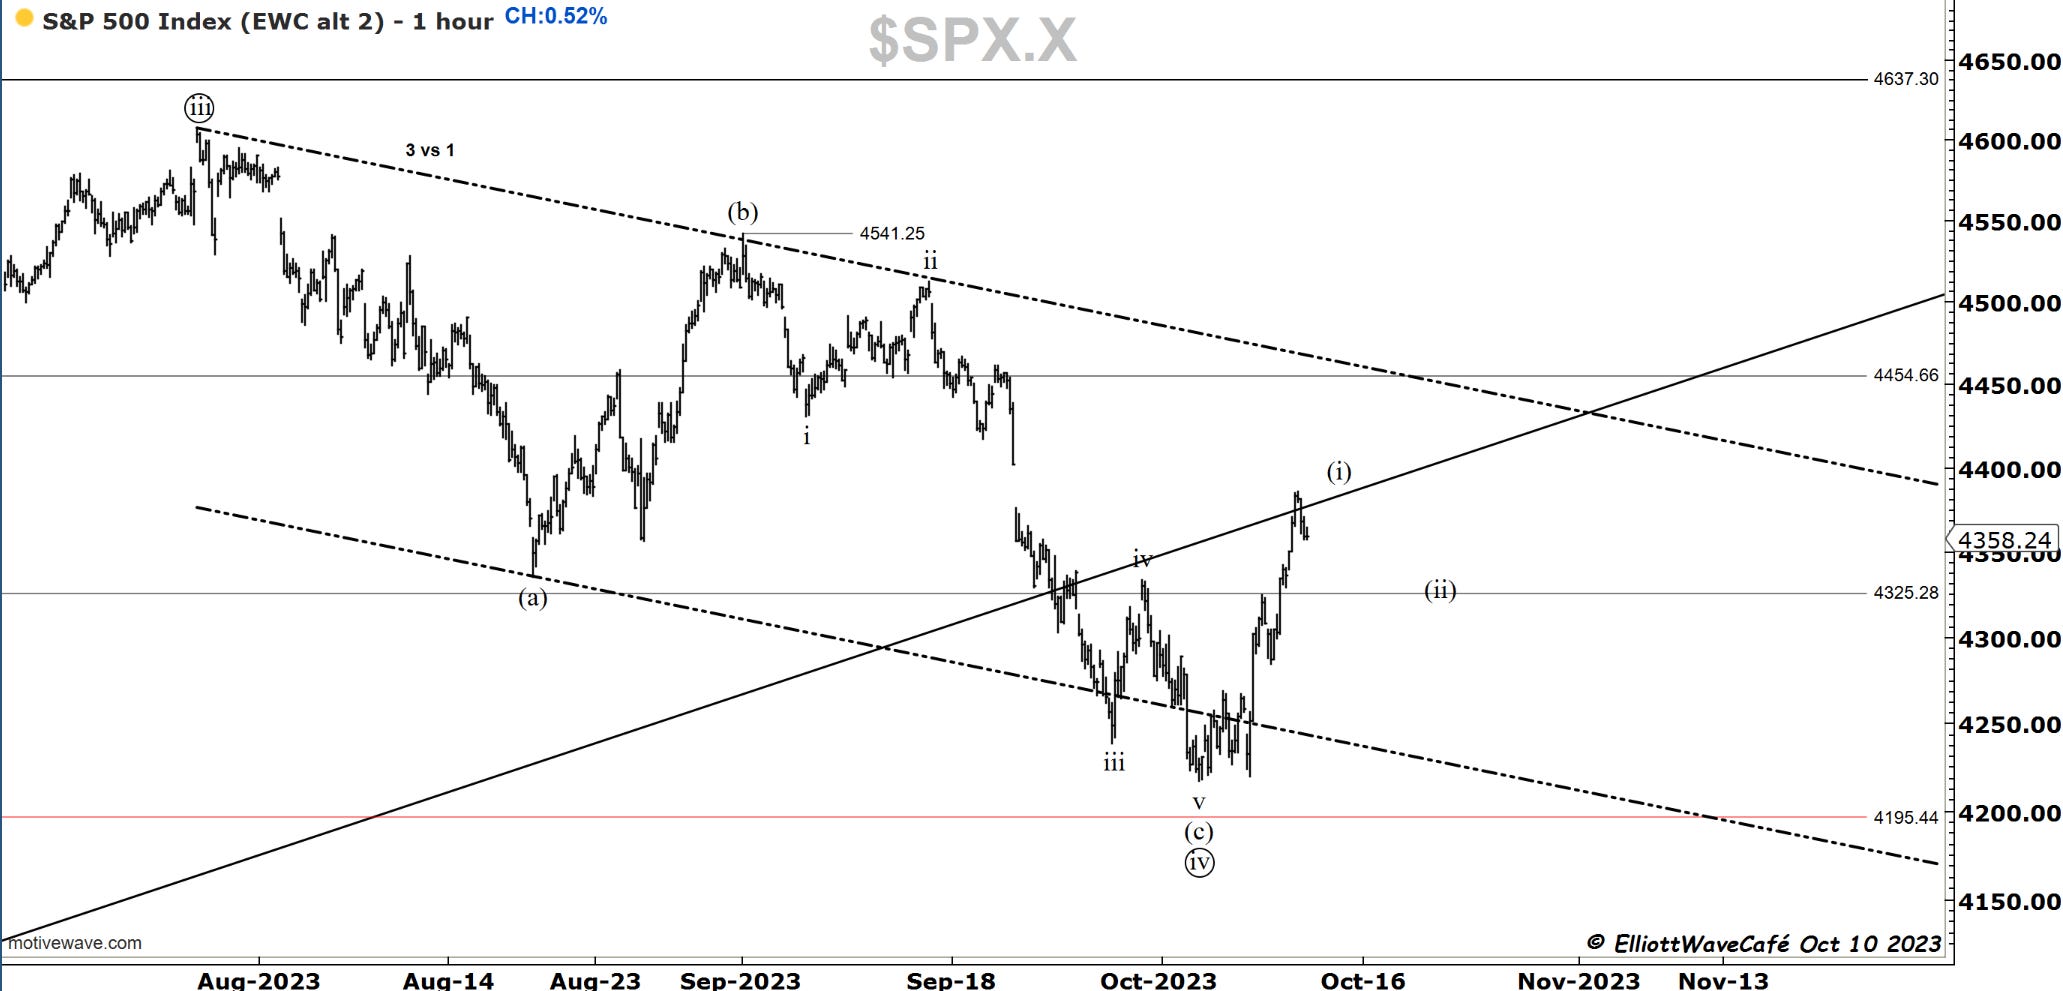
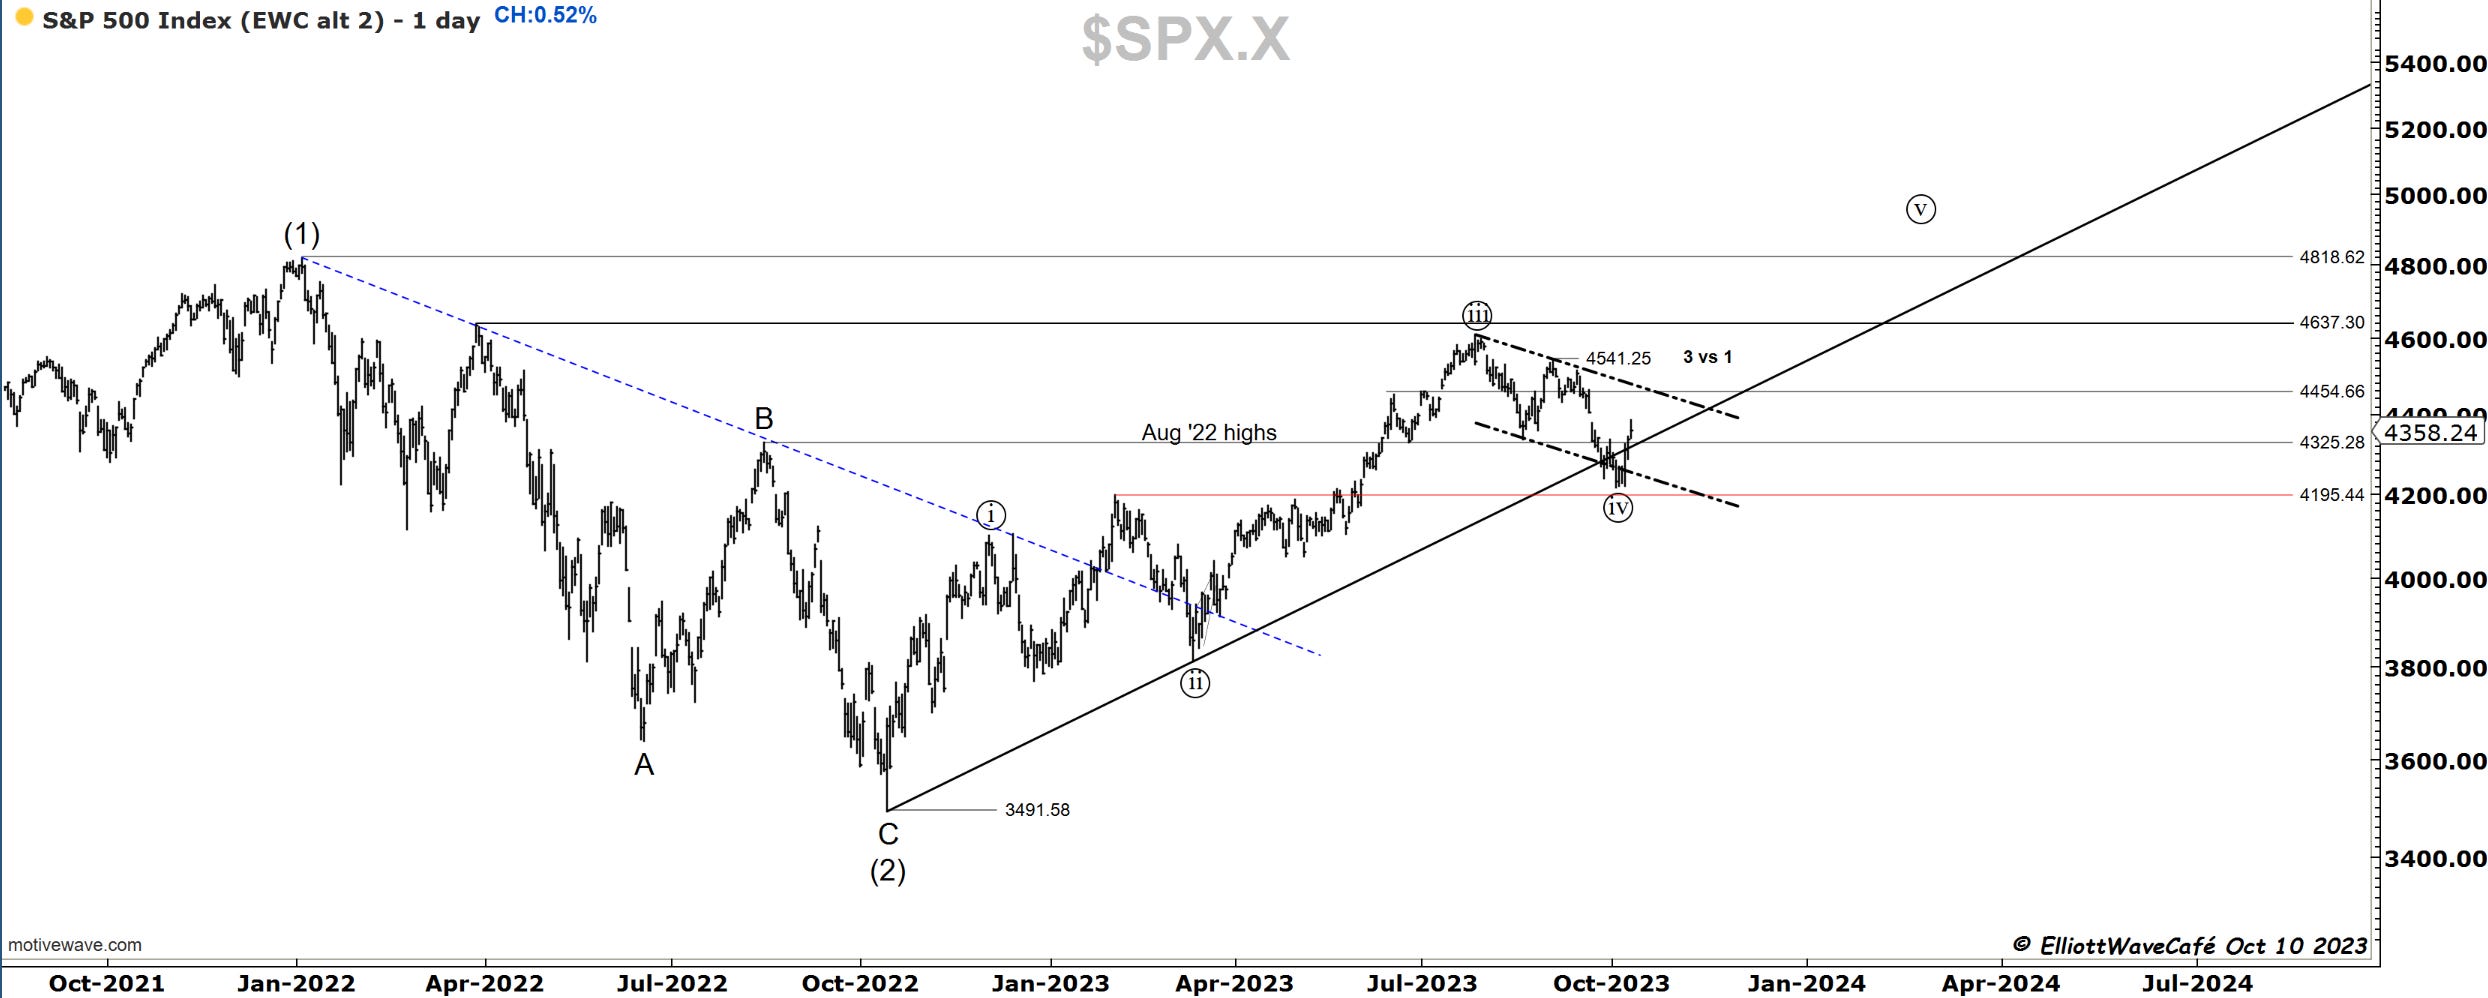
A 50bps rally today sent this index higher continuing to form a wave (i). Wave (ii) should offer the next opportunity to join the long side for a larger wave (iii). 4325 is now the level to watch on throwbacks. Wave (iii) will take us to challenge wave (b) top near 4540.
We were discussing last week the BPI and the increased chances of bounces from 30 levels. There was also a washout in 52-week lows, I am assuming most of them were in the staples sector. We’re about to hit the 50-day MA, so expect things to get a little tougher nearterm, but overall we should be bouncing back towards the top of that range.
We took partial profits in the TNA longs ( this is the 3x leveraged Russell). We bought this on IWM support. Take a look below at how different the price action is longer term between the 2 charts and why these are very hard to hold long term. Good vehicles to take advantage of trading levels tho.
Nasdaq100
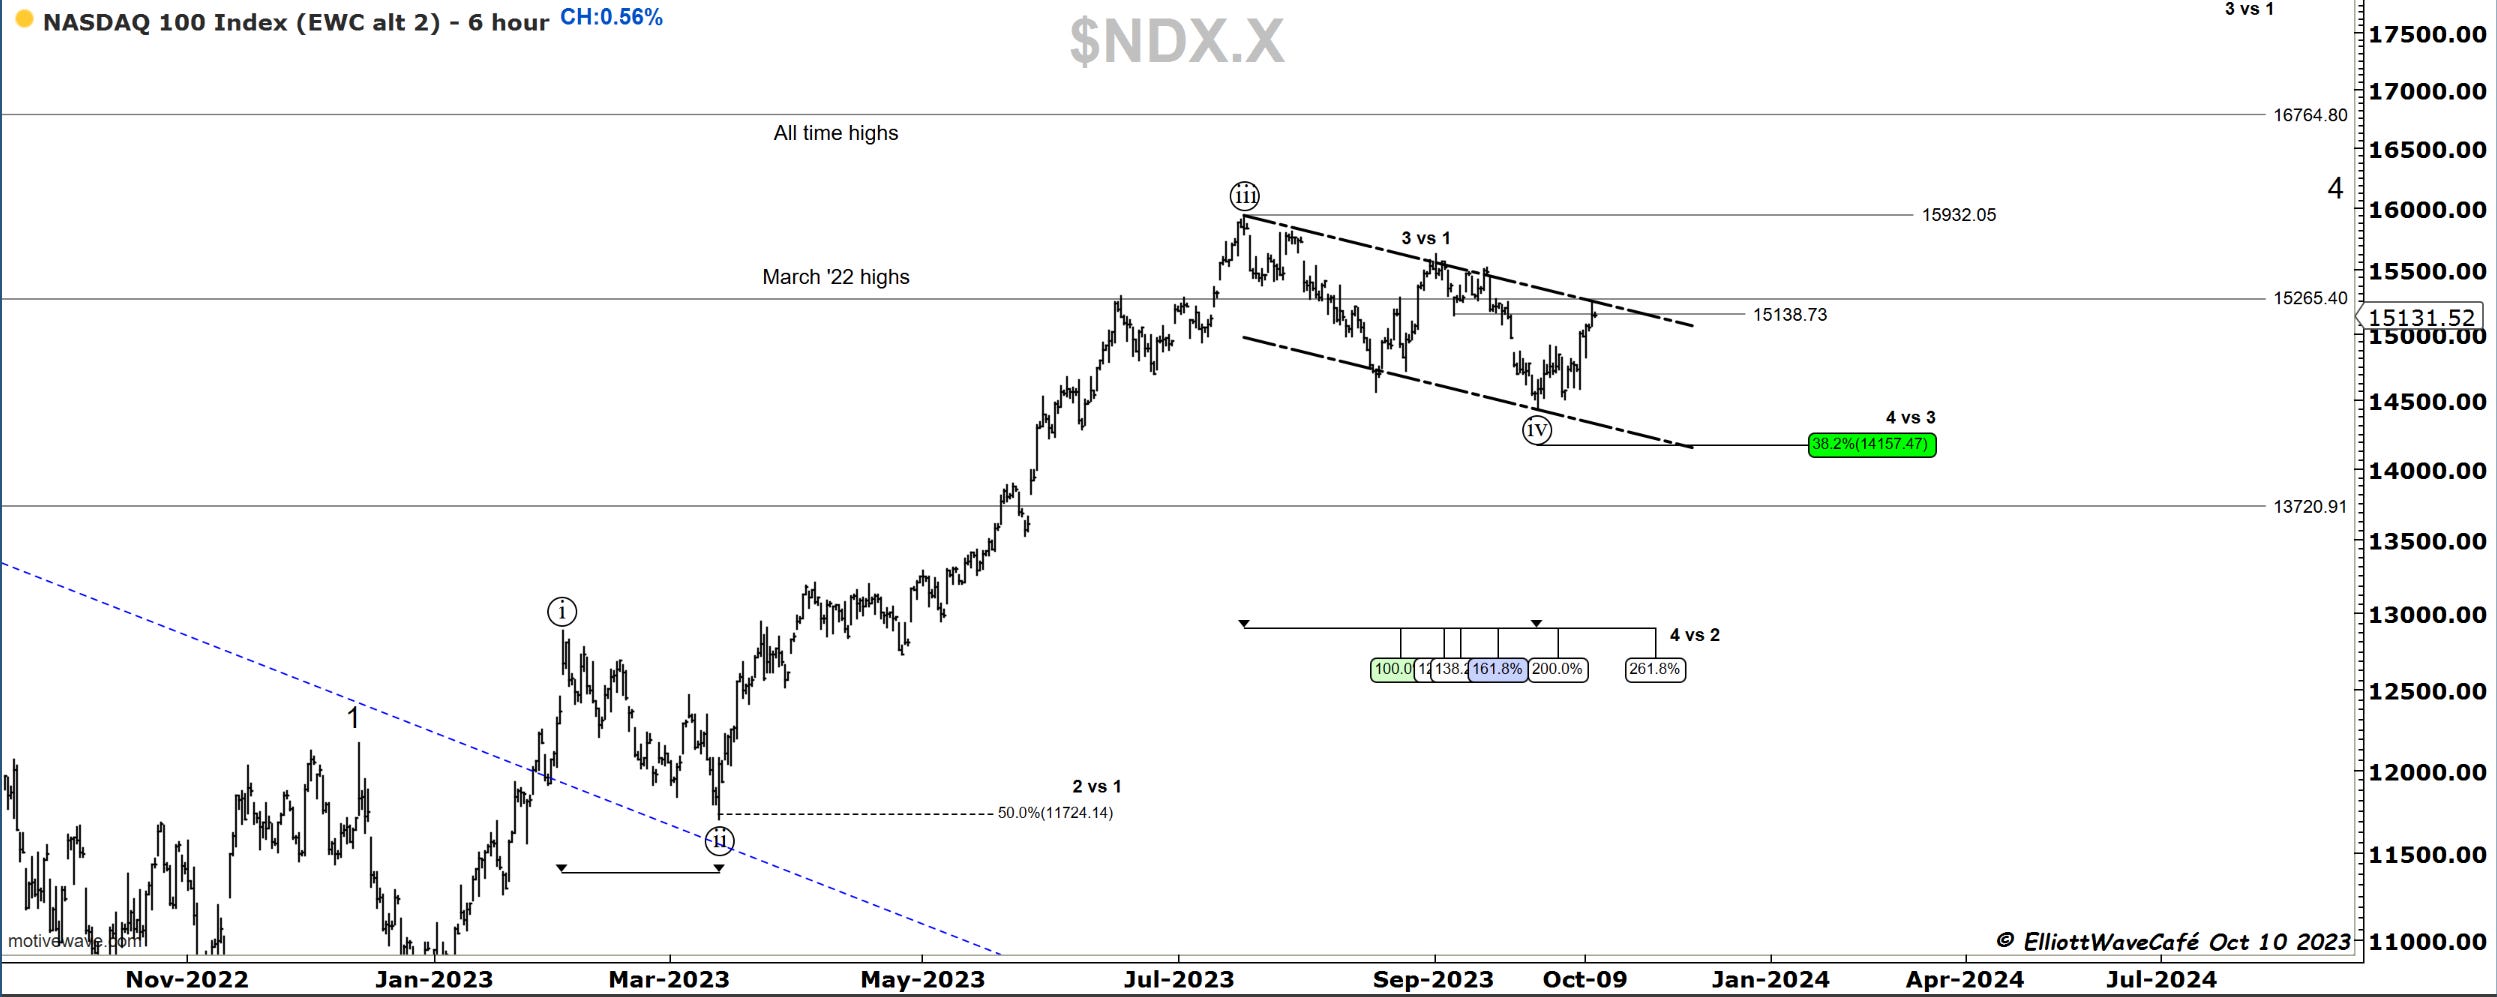
NDX climbed above 15,138 today eliminating the possibility of this rally being a 4th wave from the prior Sept 1st decline. This further strengthens the case for a completion of ((iv)). However, we are now once again at the March ‘22 highs, a strong battle zone between supply and demand. The channel top resides here as well along with a declining 50 day MA. If she can surpass this hurdle and break 15,500, the floodgates should open wider for the upside. On the contrary, the creation of an X wave here would derail the advance until the larger correction is completed. Below 14,600 that becomes a real possibility.
Dow30
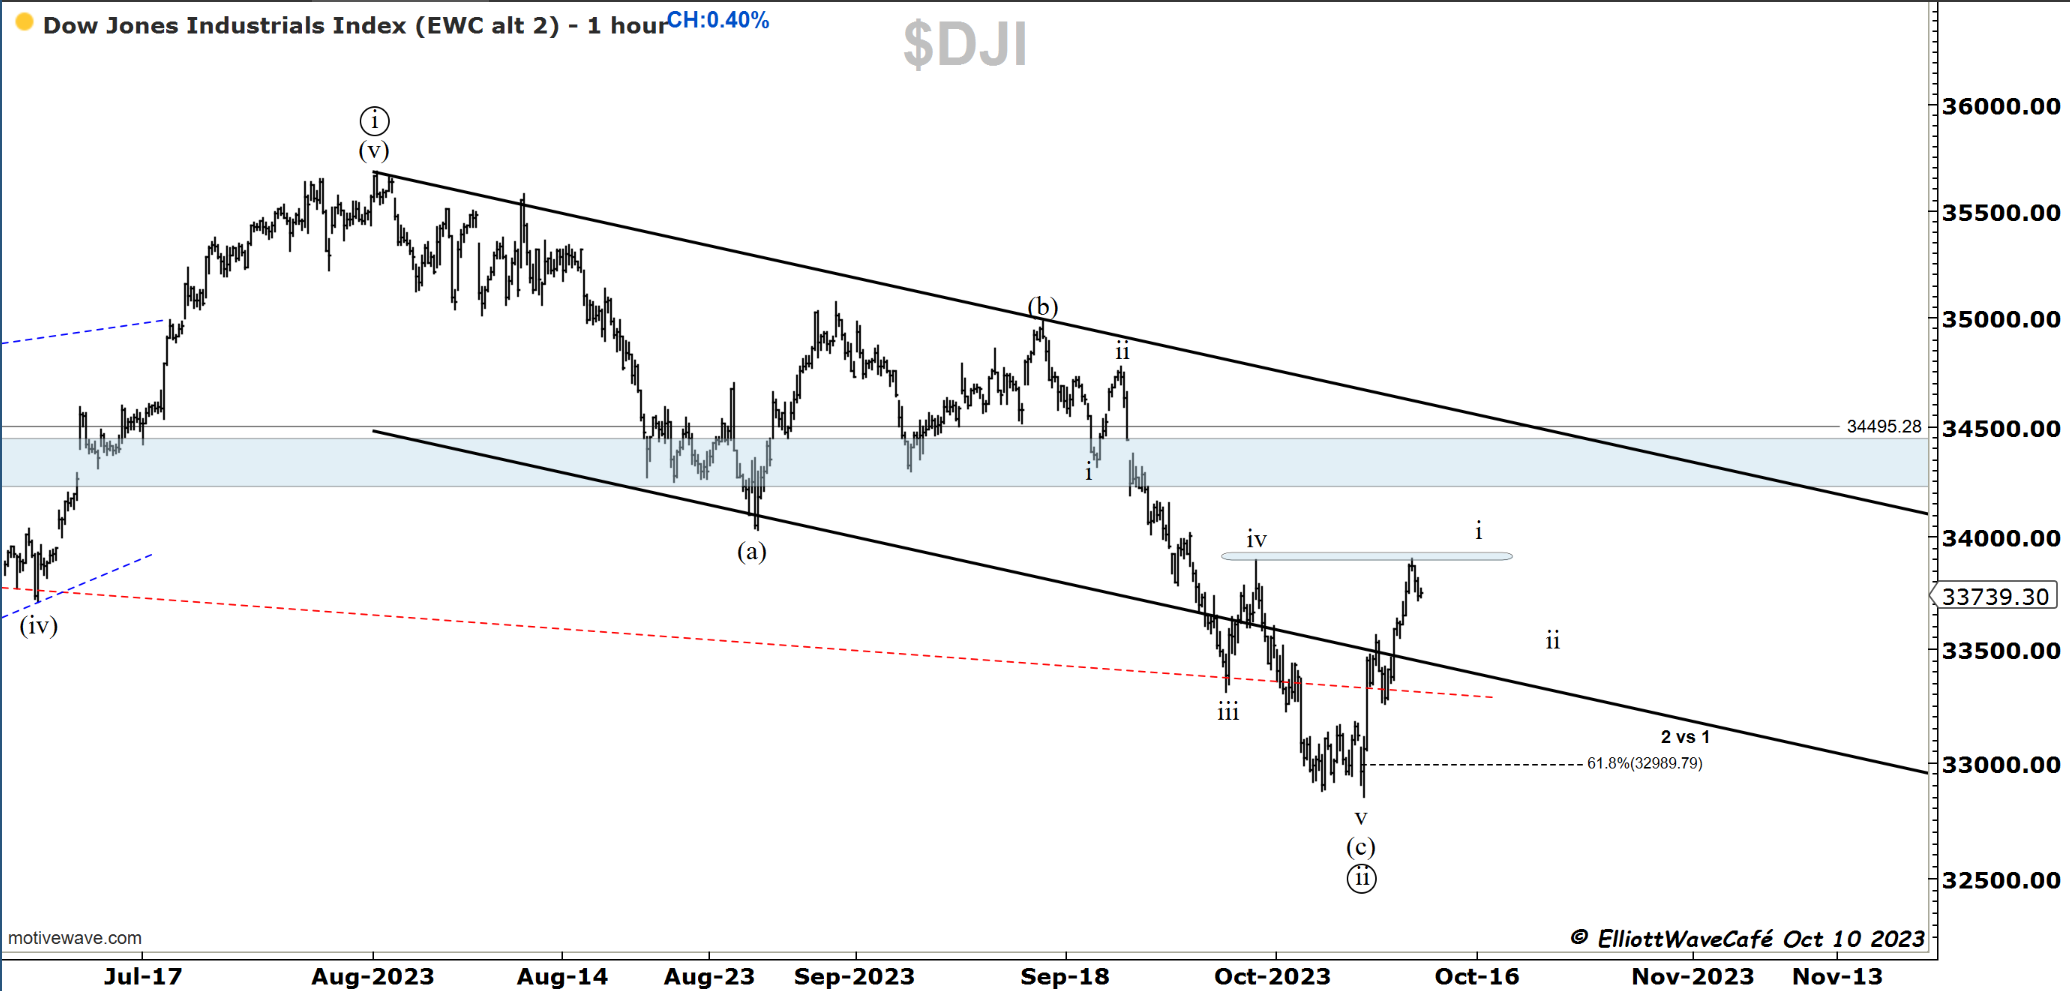
Papa Dow stopped right at the prior swing iv high, before throwing back a bit to end the day. Wave i does not appear complete. Just above we have a good band of resistance into 34,500. Using 33k as barrier, my work suggests we should continue to advance and challenge that zone.
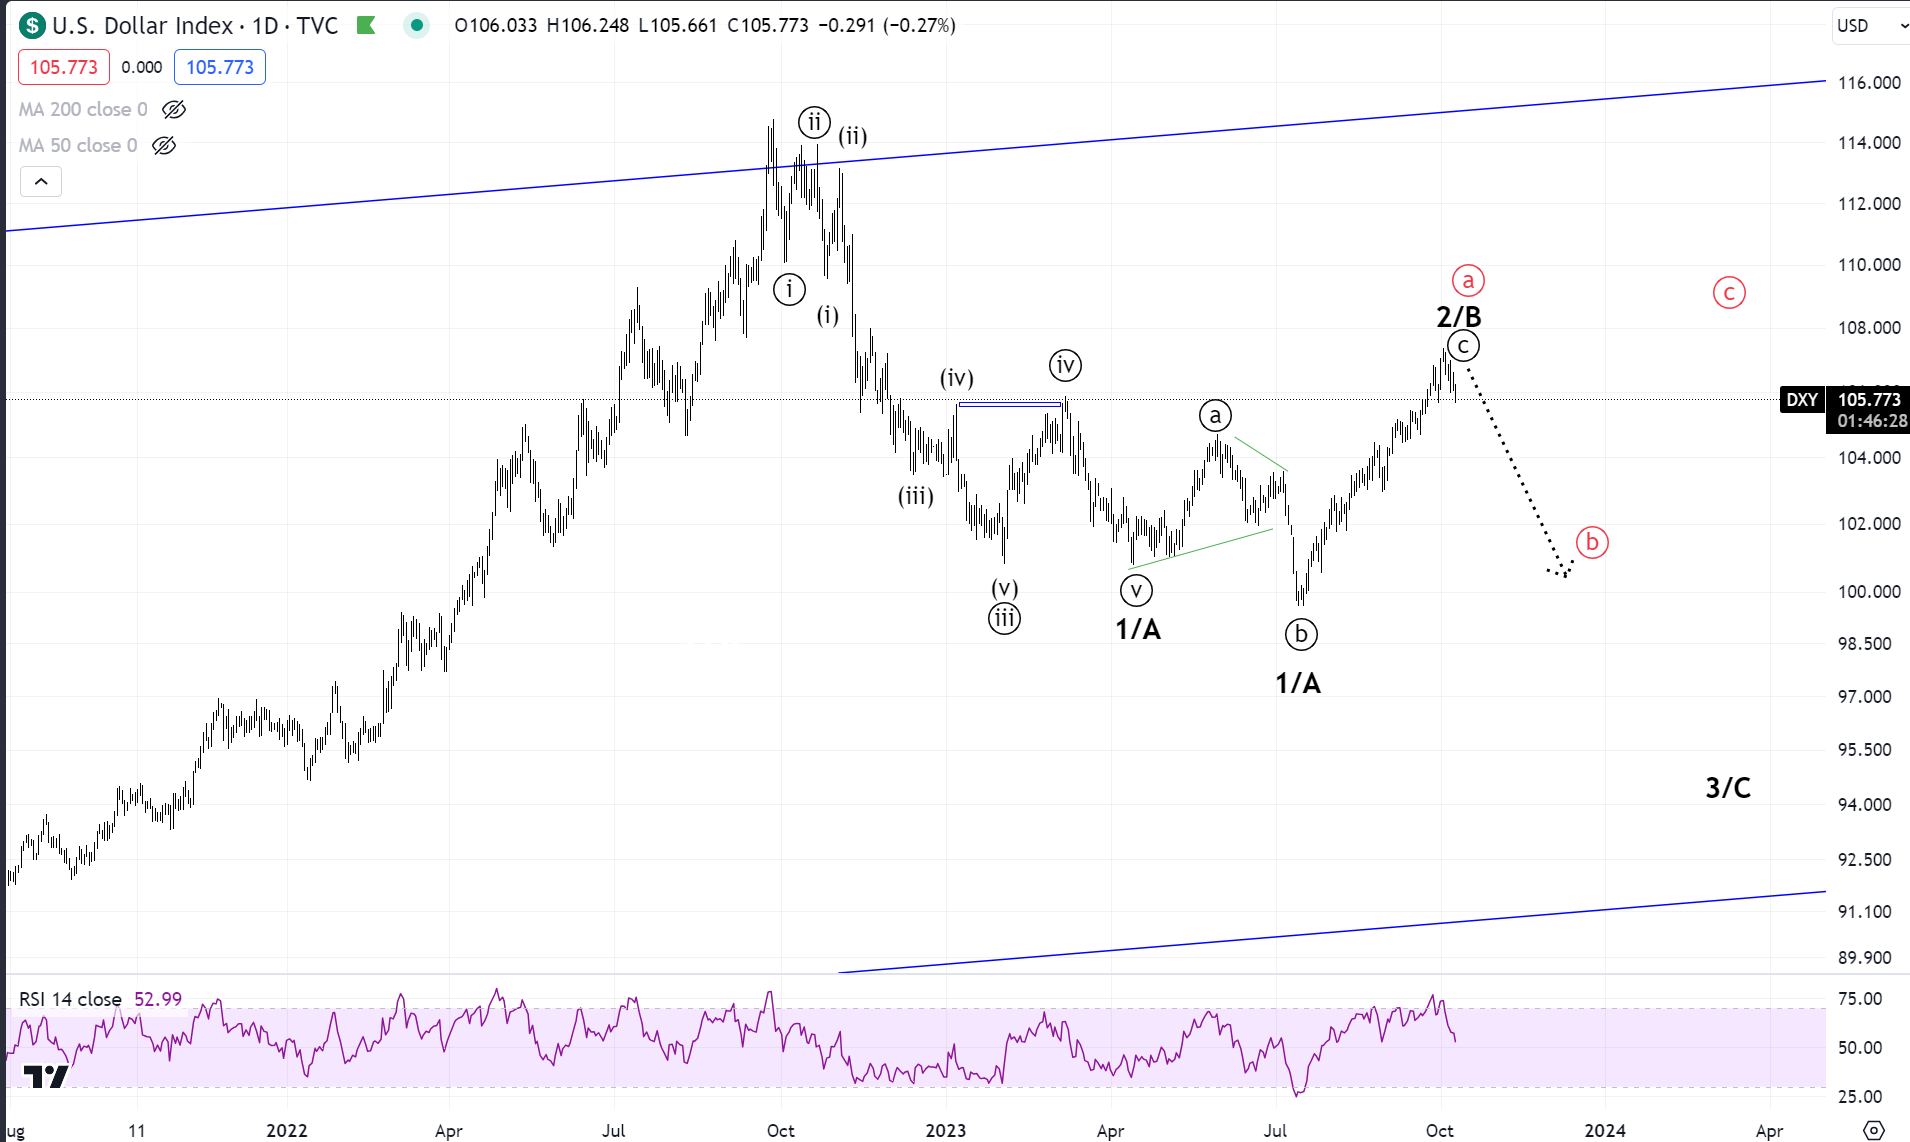
US Dollar
US dollar has topped, now the question is do we have a ((b)) wave throwback from an ABC, or the beginning of the decline in wave 3 or C. I can’t read the future and no one else can either but I will use this roadmap for now and take the clues as they come, along with the other intermarket analysis.
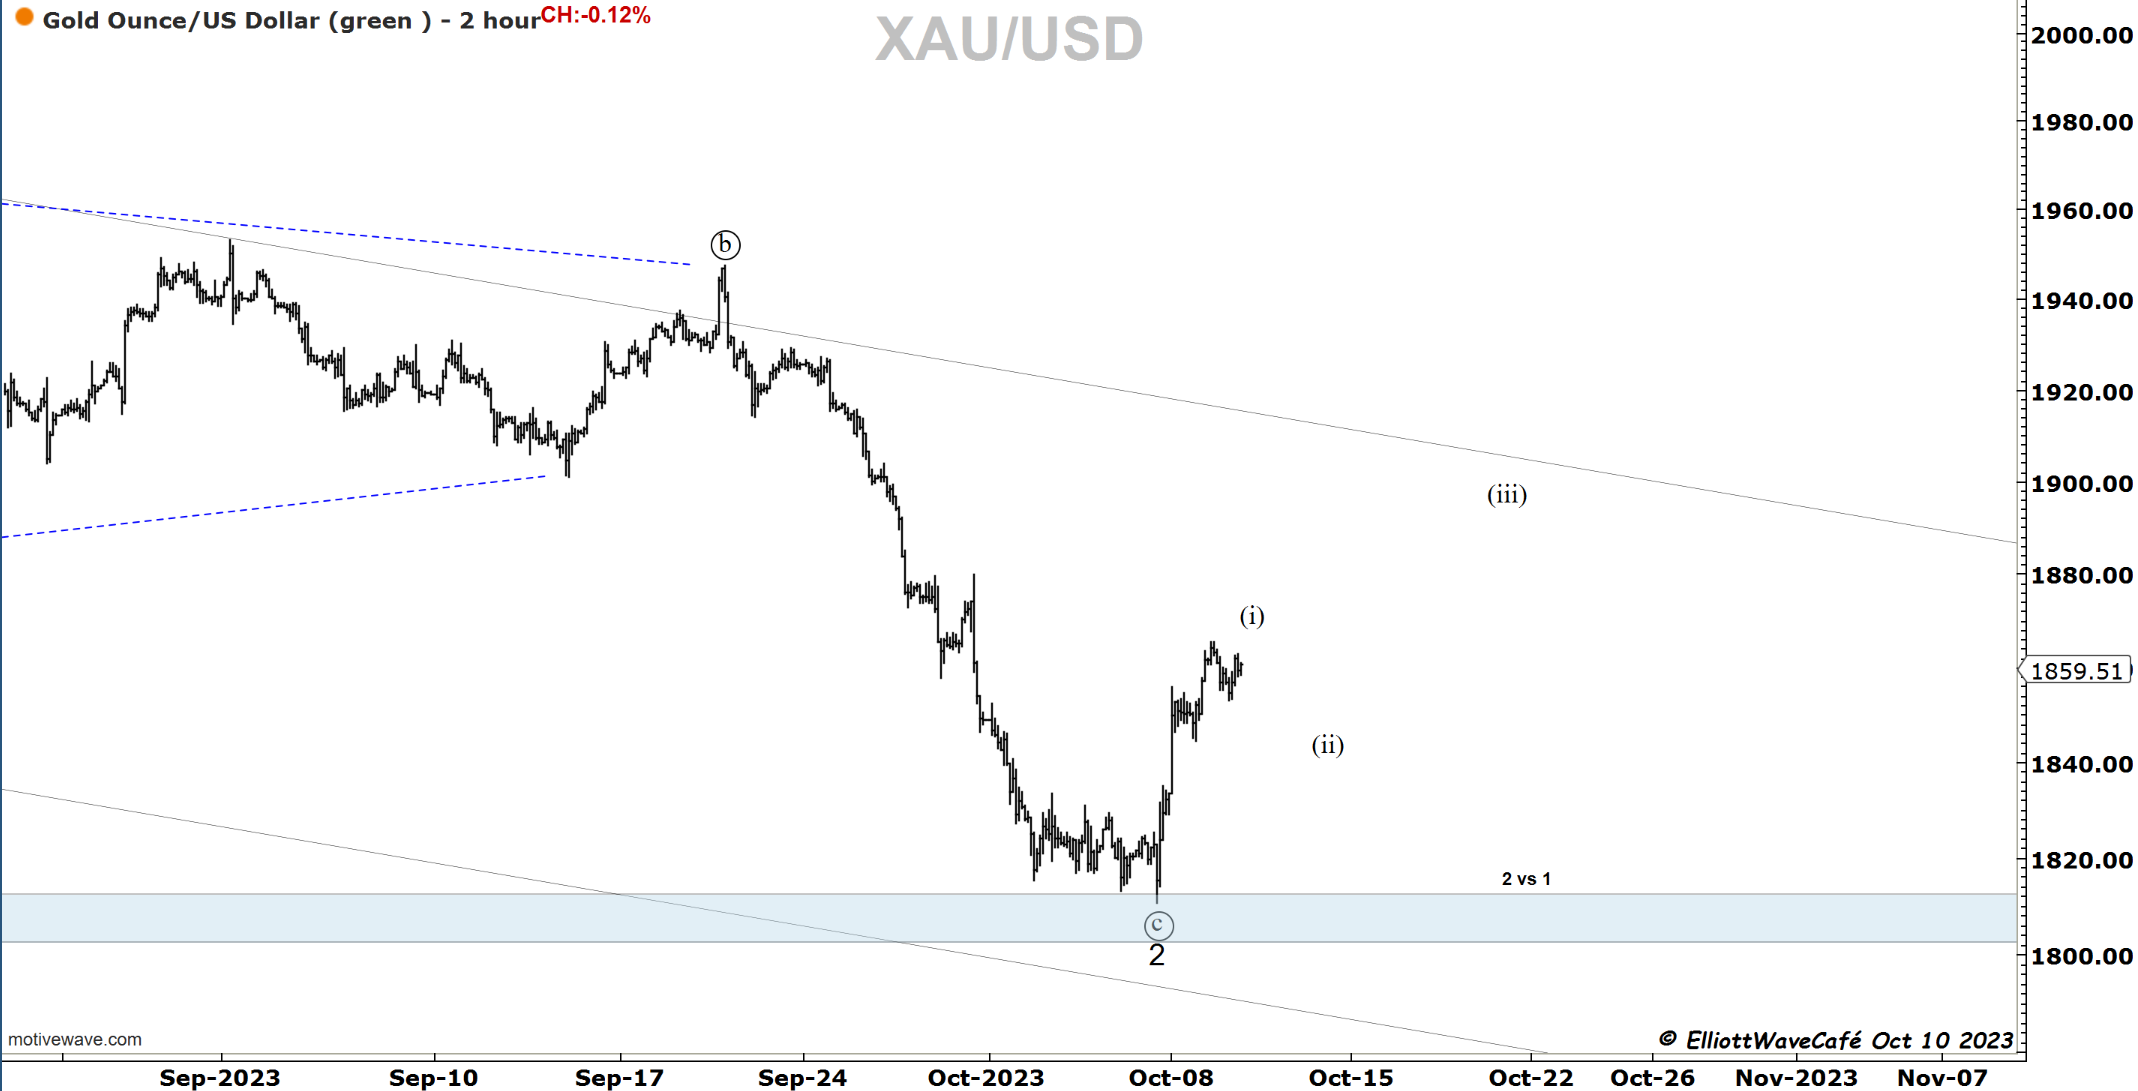
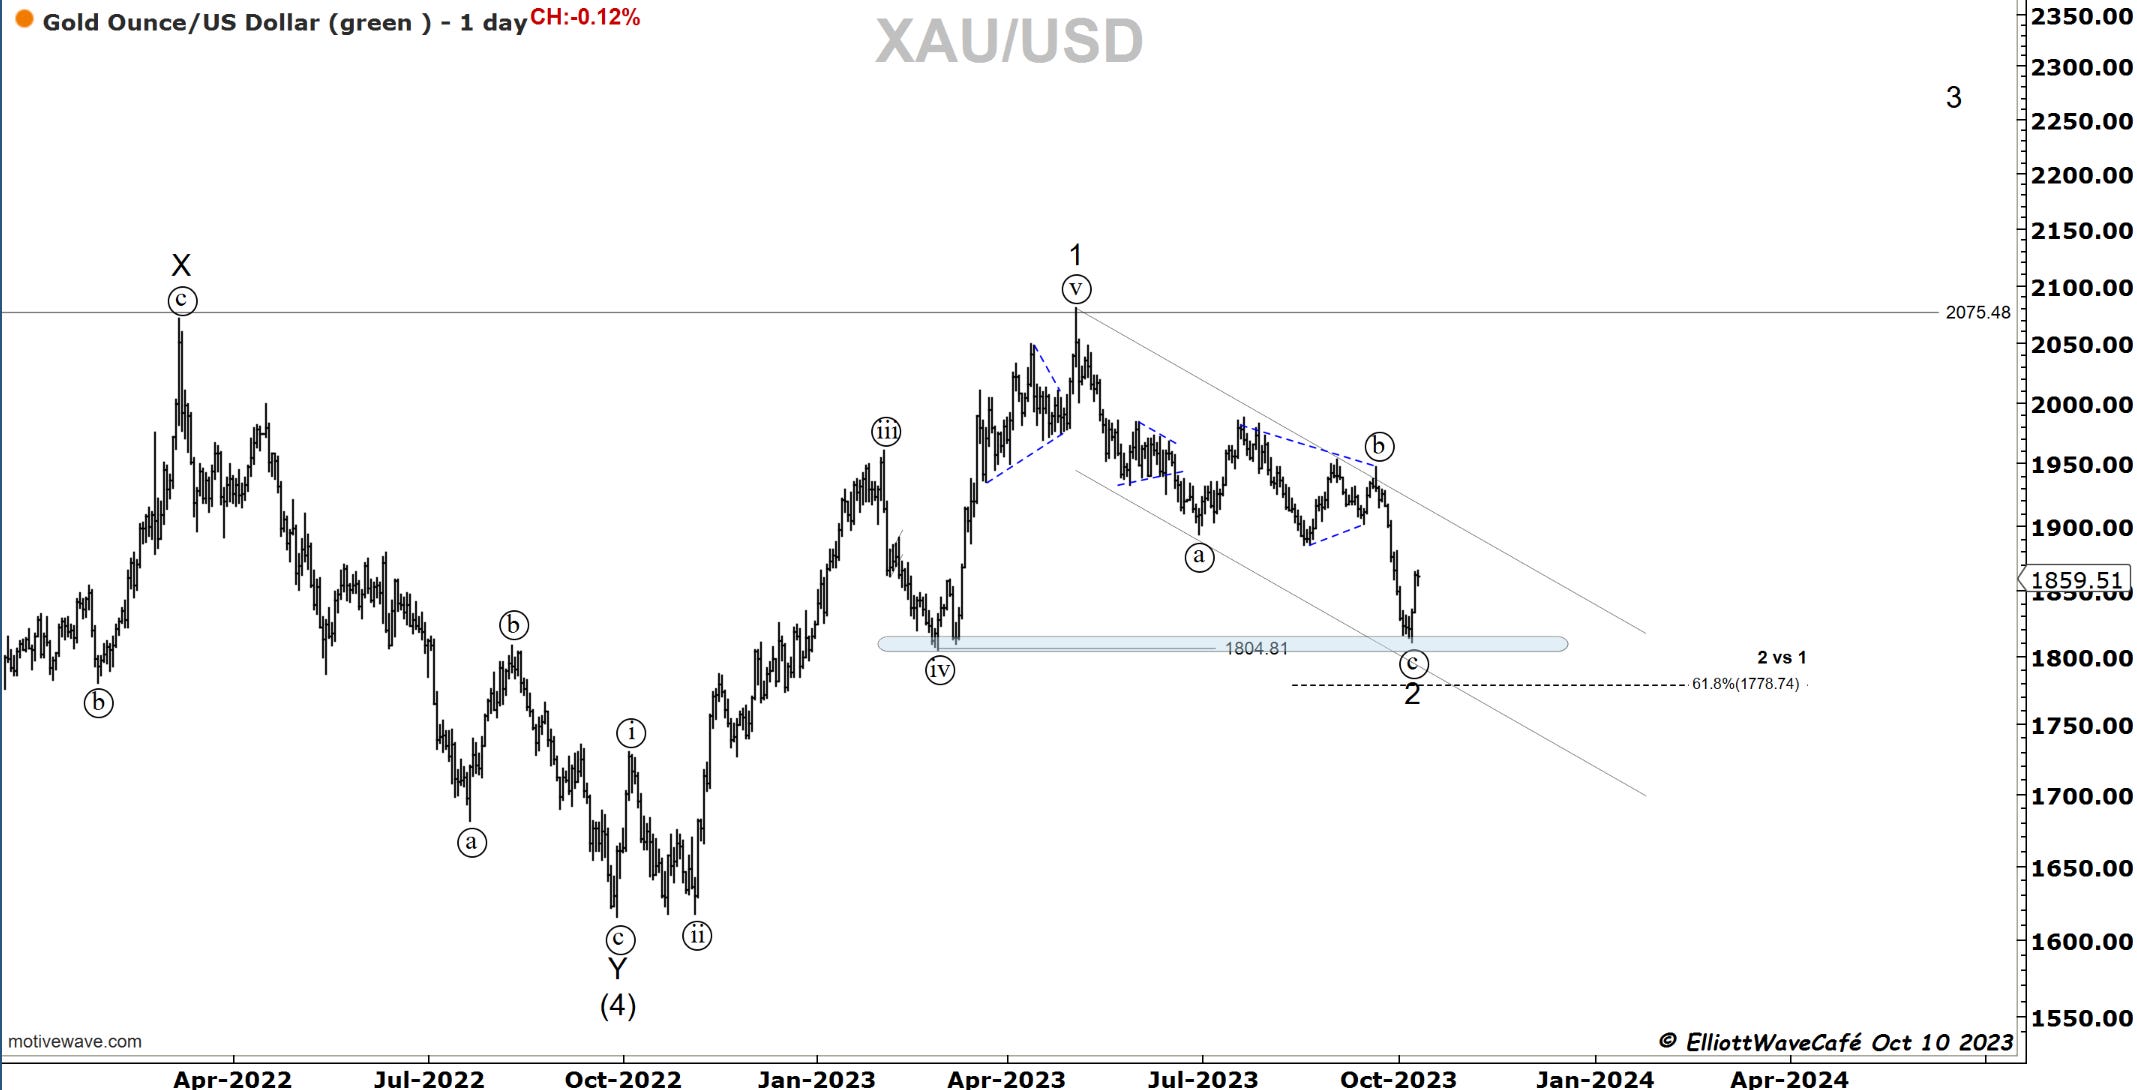
Gold
Can’t argue with the nice start of an impulse from 1820 in Gold. Dips should offer further long opportunities towards 1900. Have your risk levels in place as always, either fibs, prior wave lows, or horizontal key levels. Whatever you prefer, when things don’t work out, bailout. Did not really mean to sound poetical.
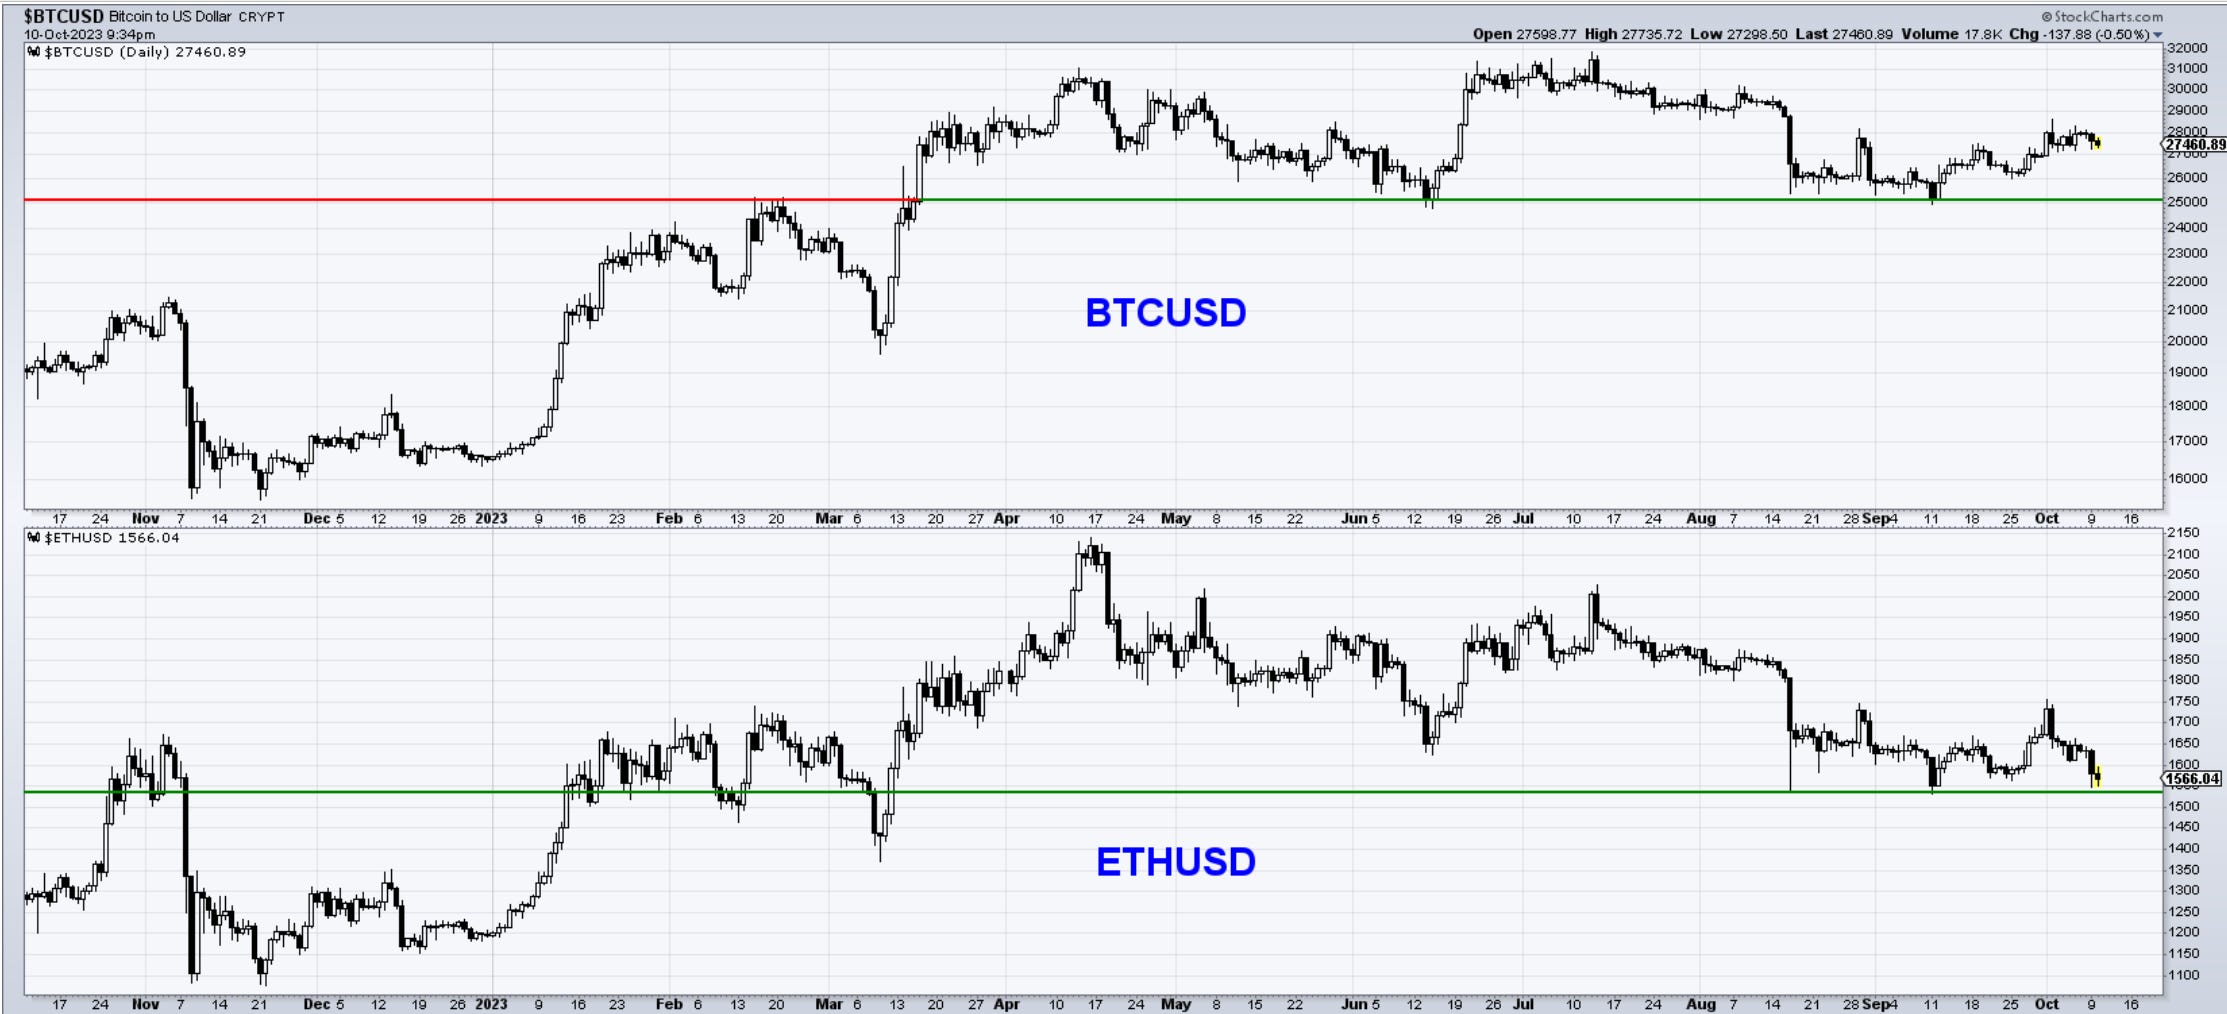
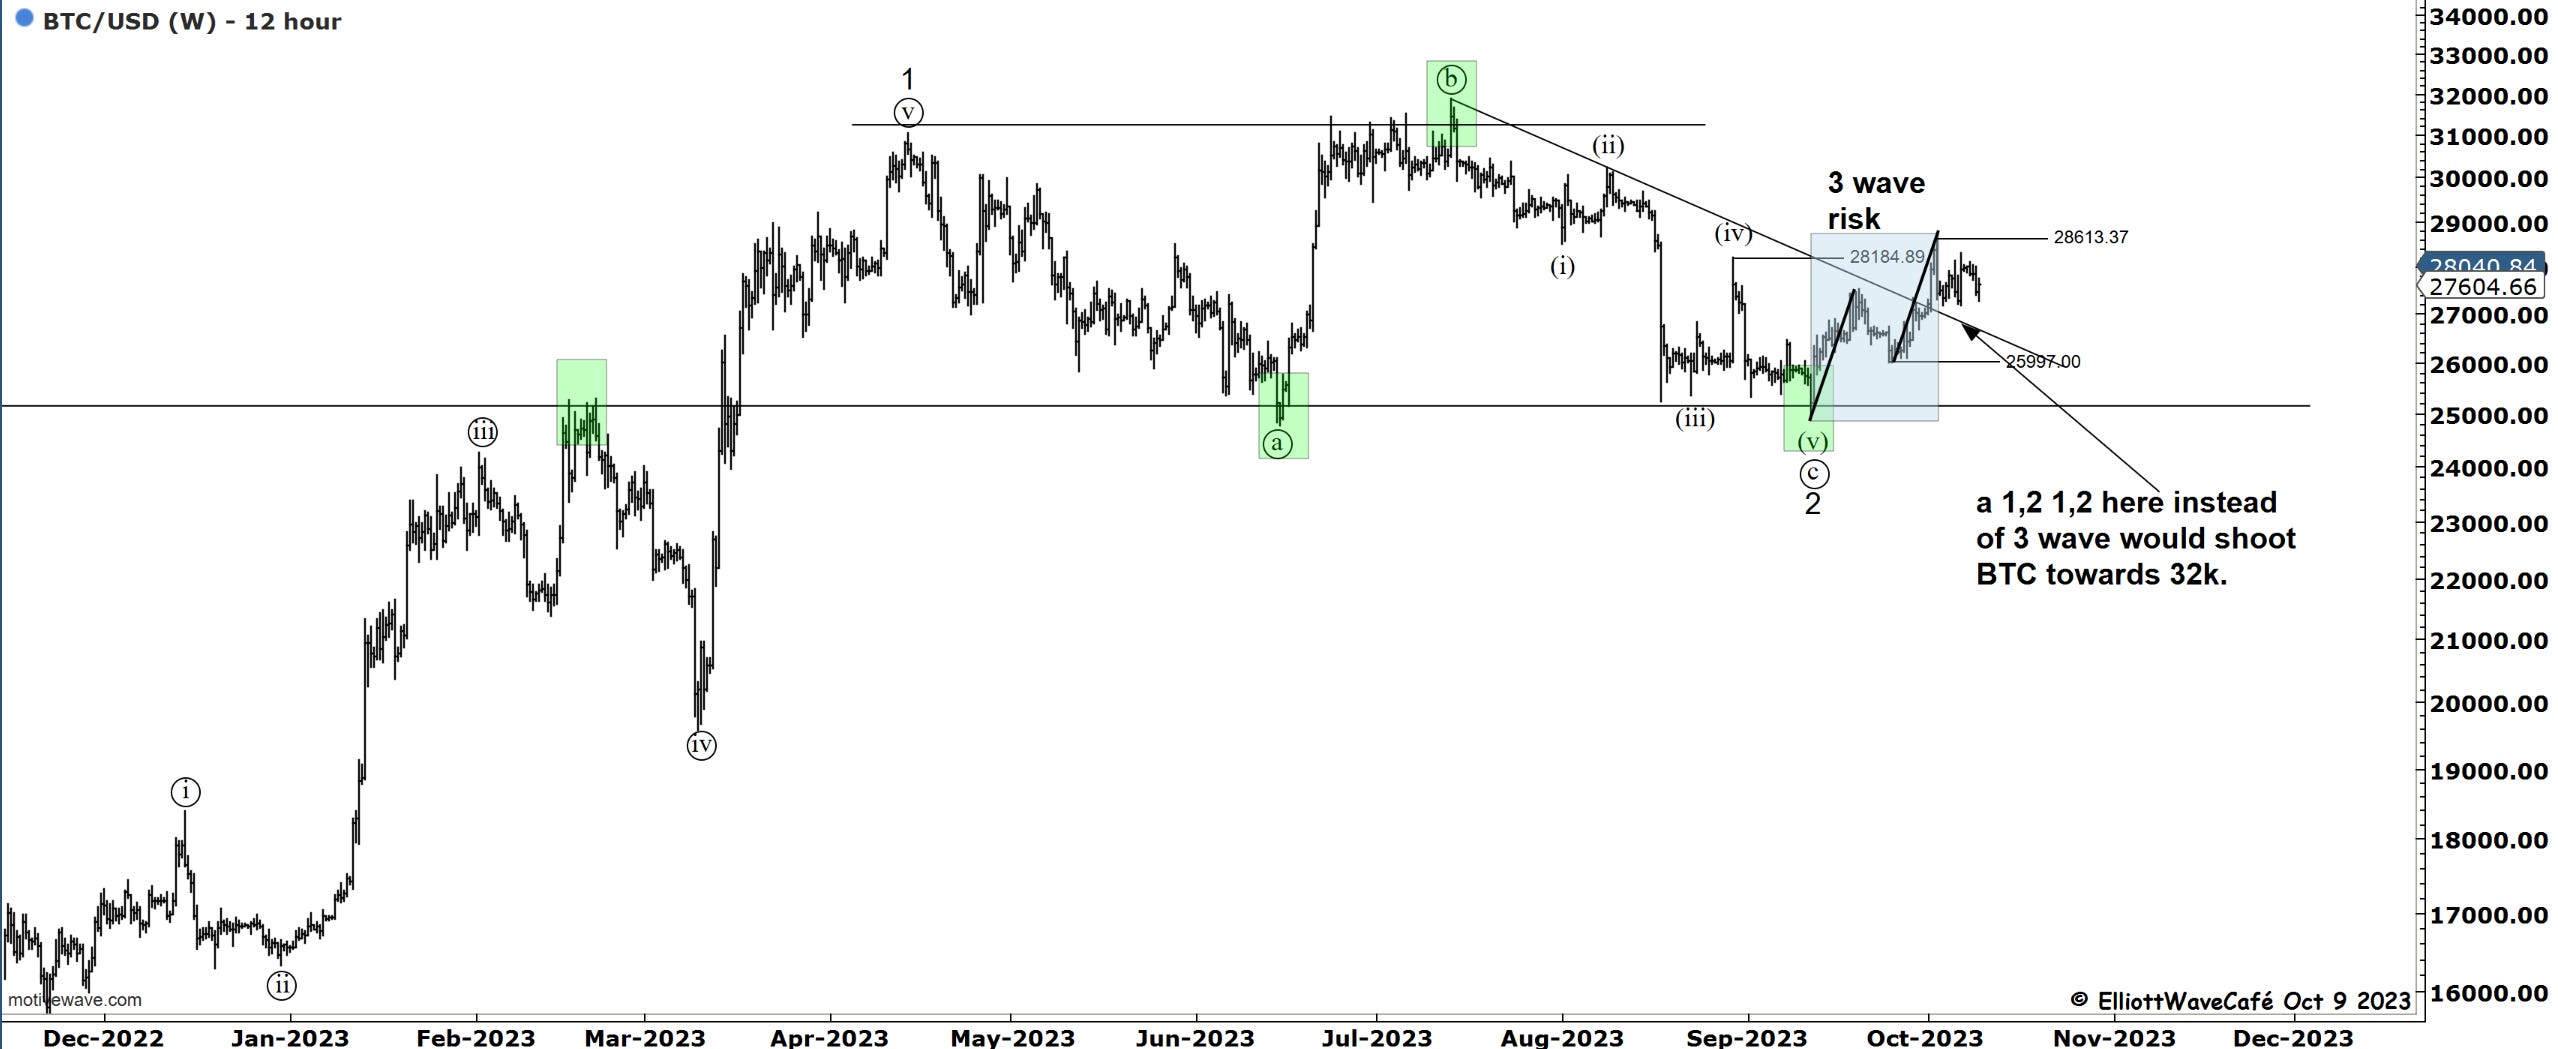
Bitcoin
The lack of an upside response in BTC is concerning on a day when risk rallied. As I was saying in last night’s video, the ETH failure could be a clue for upcoming action in Bitcoin. My eyes are set on 26k, under which, the break of 25k becomes quite real. Above 28,6 and I will get an itchy wallet. Until then nothing to do but observe.
Daily video coming up next,
See you tomorrow- trade well,
Cris
email: ewcafe@pm.me