
The Daily Drip
Core markets charts updates and commentary
Note: The counts on the right edge are real-time, and they are prone to adjustments as price action develops. Elliott Wave has a fluid approach, is evidence-based, and requires constant monitoring of certain thresholds.
In the counts below, this (( )) = circle on chart
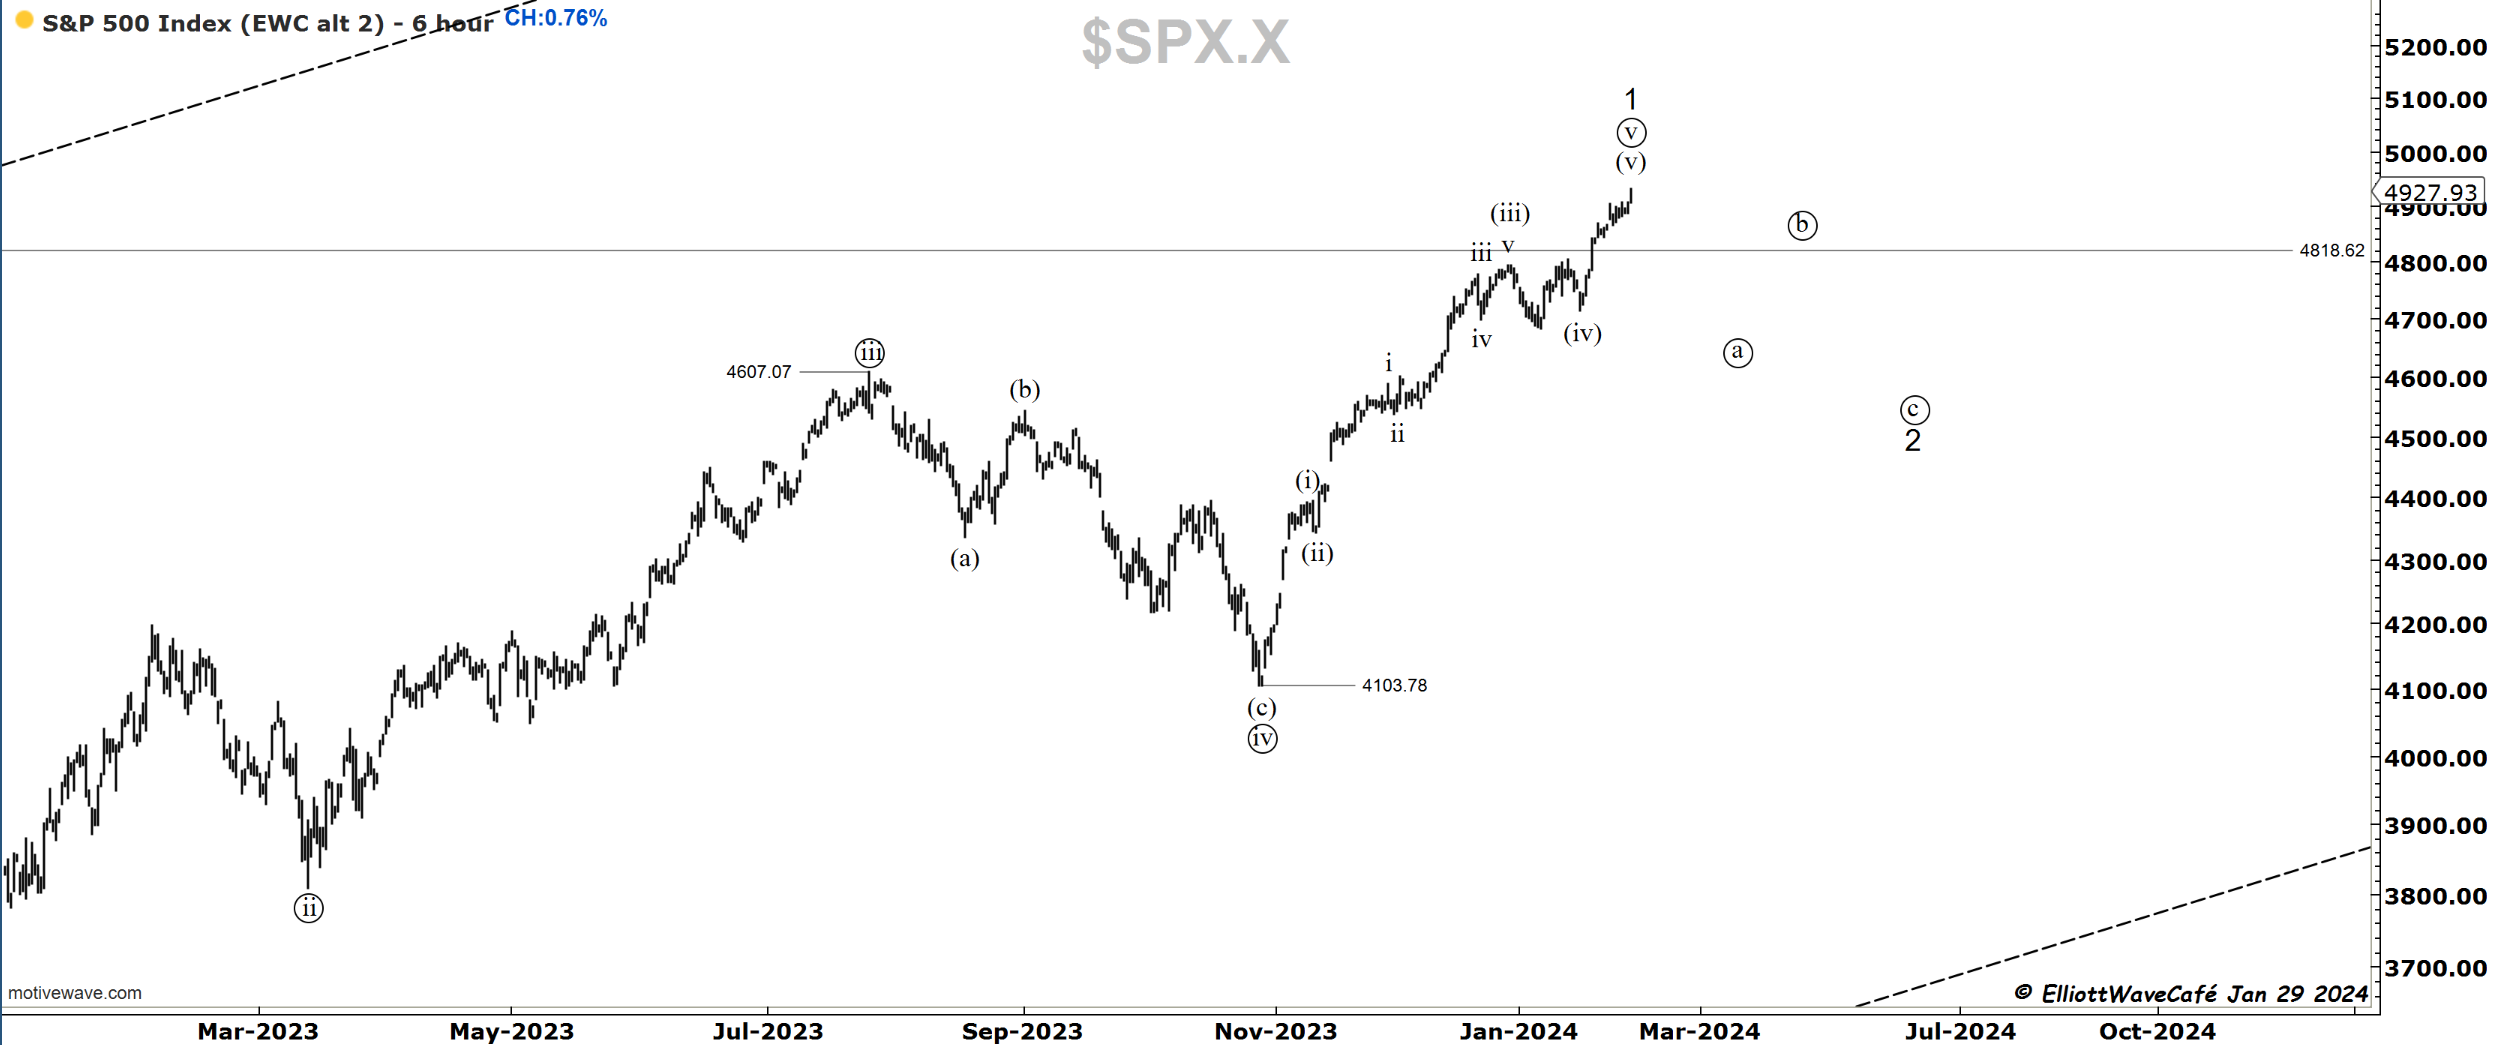
SP500
Here we are, approaching the end of January with two trading days left. The SP500 has gained +3.3% as of today’s close. The trend since Oct ‘22 lows has continued mainly uninterrupted, with the largest correction being a -2.2% in the first week of the year. Several breadth and volume indicators have been flashing warning signals, some even extreme, and yet the market continues to climb higher without much interruption. There was even some participation today from small caps and equal-weighted indices. We are entering a slow seasonal period until mid-March, although the first couple of weeks of February do not look that bad historically. There are some heavy earnings hitting the tape tomorrow and Thursday, along with the Fed meeting on Wednesday. Action-packed with the market at all-time highs.
The question is, where are we in terms of the Elliot Wave structure? Since my view was that Oct lows were a wave ((iv)) label, the current advance must be a 5th wave. The lack of a deeper response from the market has been surprising and makes me wonder if that low was a wave ((ii)) instead, as seen in the second chart, and we are in the middle of a larger wave ((iii)) already. As we know, inside that wave, we need smaller ones and twos with some proportion. A quick glance at the chart does not offer much help in terms of properly counting those waves. The bottom line is if a wave two correction at whatever degree is to follow, it needs to happen soon, in a seasonally weak period and with turning cycles. It is also quite common to pull back after new all-time highs are established. In terms of price levels, a drop below 4800 is needed to start assuming this correction is underway.
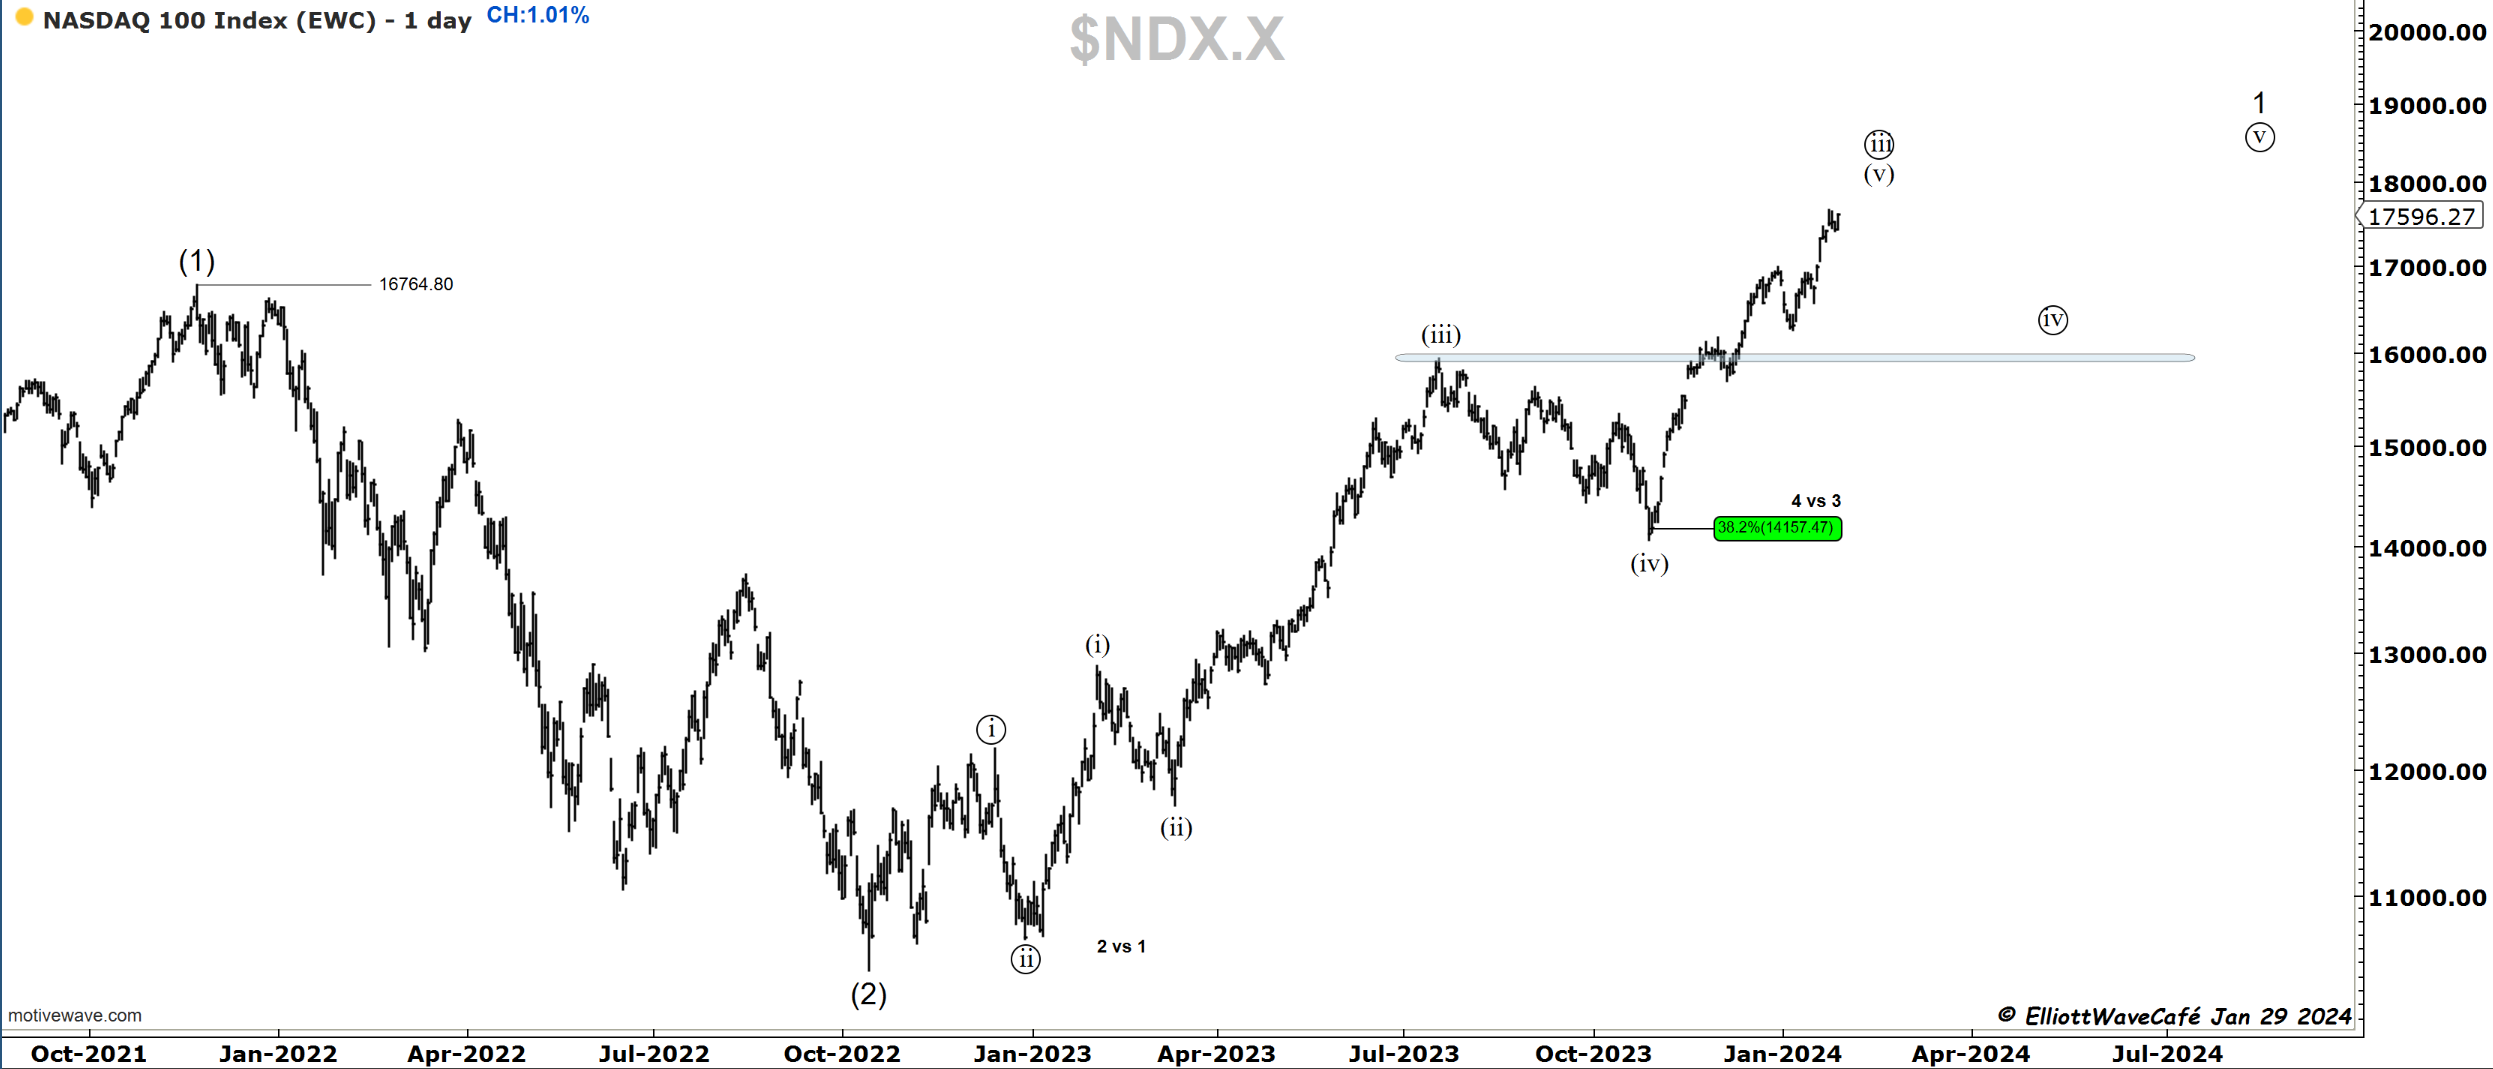
Nasdaq100
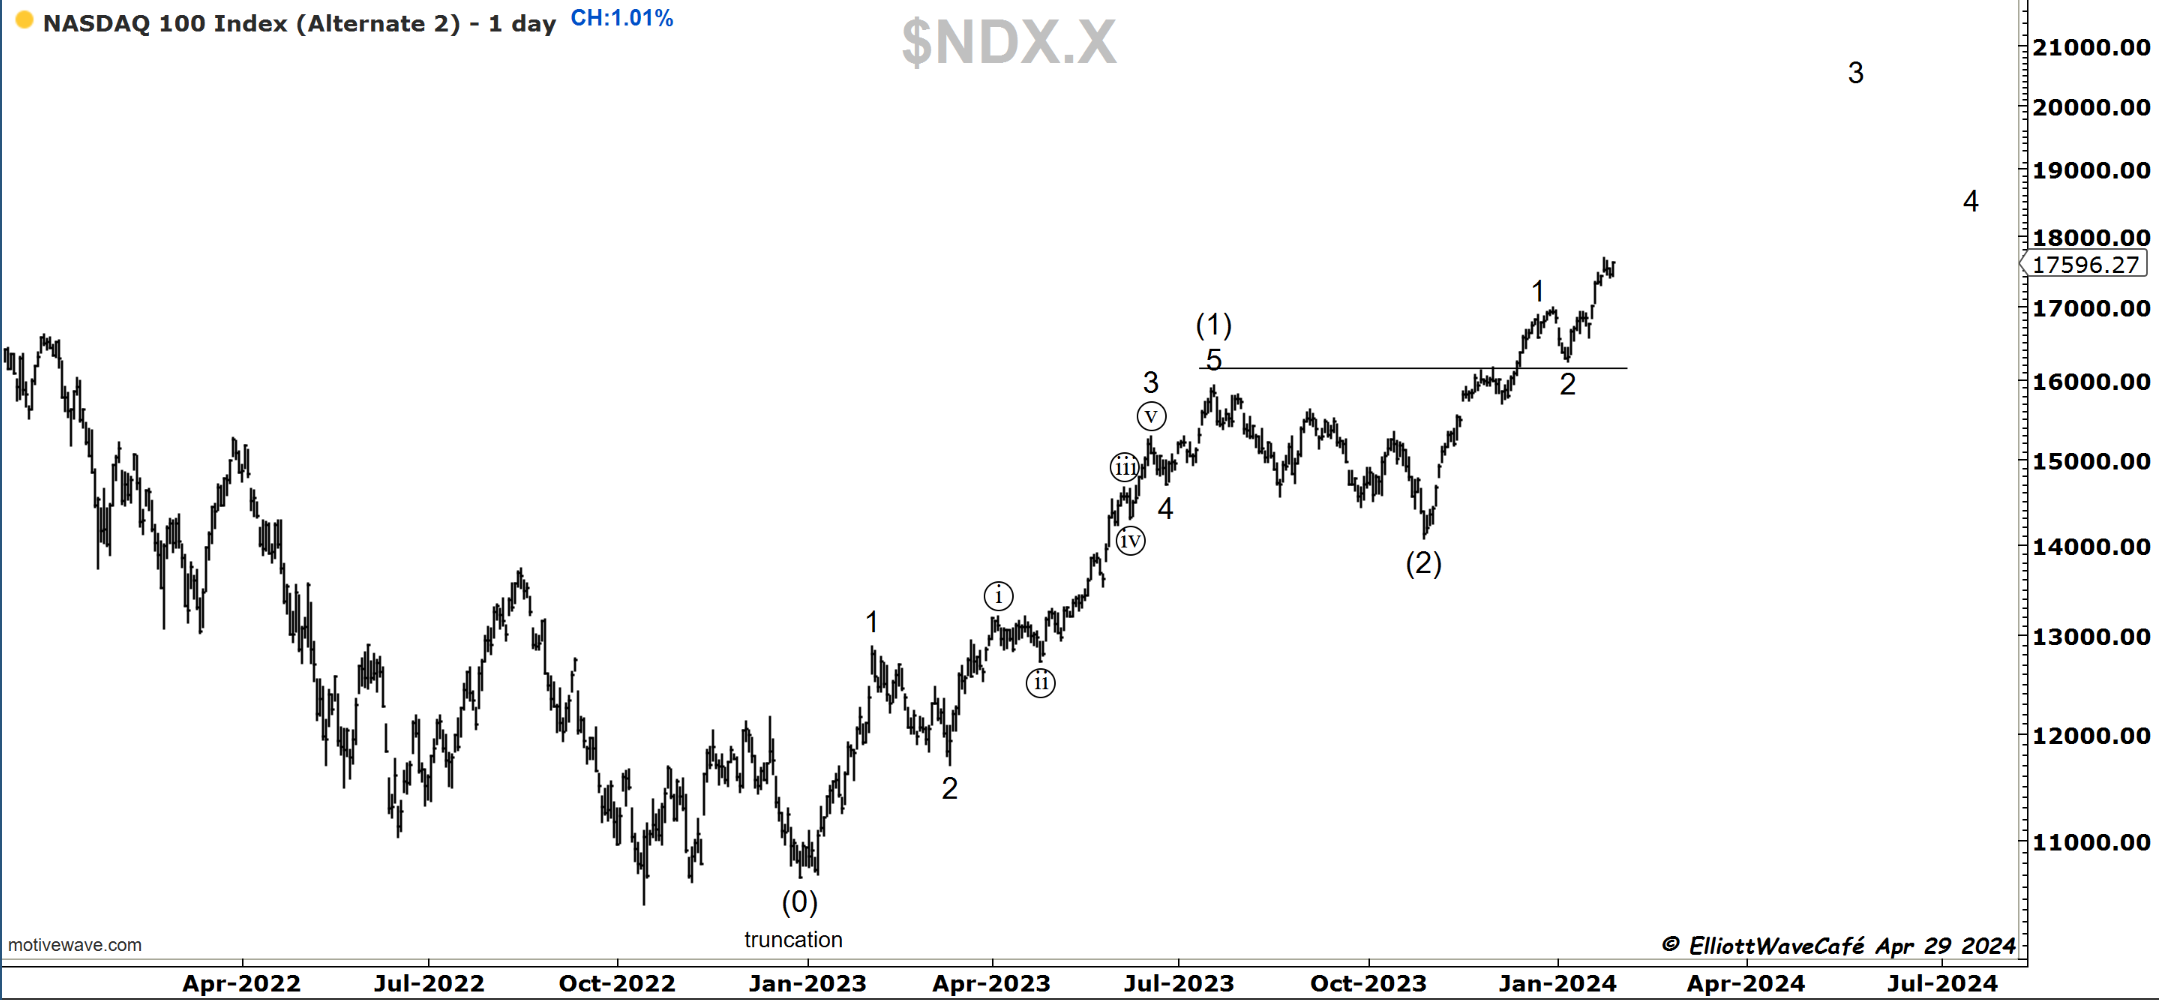
Since the middle of last week, the QQQs have been underperforming the SP500. The same principle above applies here as well. If we’re in a 5th wave, it is taking its time to complete, and the evidence of a top is not apparent. The bullish chart below is very aggressive and counts a wave (2) low in Oct ‘23 and another wave 2 on Jan 5th correction. Unless this market is totally unprepared for such an upward explosion, I am quite skeptical it’s the correct count. Stocks like AMZN, NVDA, MSFT, GOOGL, and META disagree with my view, however, as they continue to set record highs. AAPL is diverging. Their earnings and guidance will offer decent clues for the market going forward. The semiconductors have also slowed down their advance slightly. Watch if they pullback as it is considered to be the new Dow Theory.
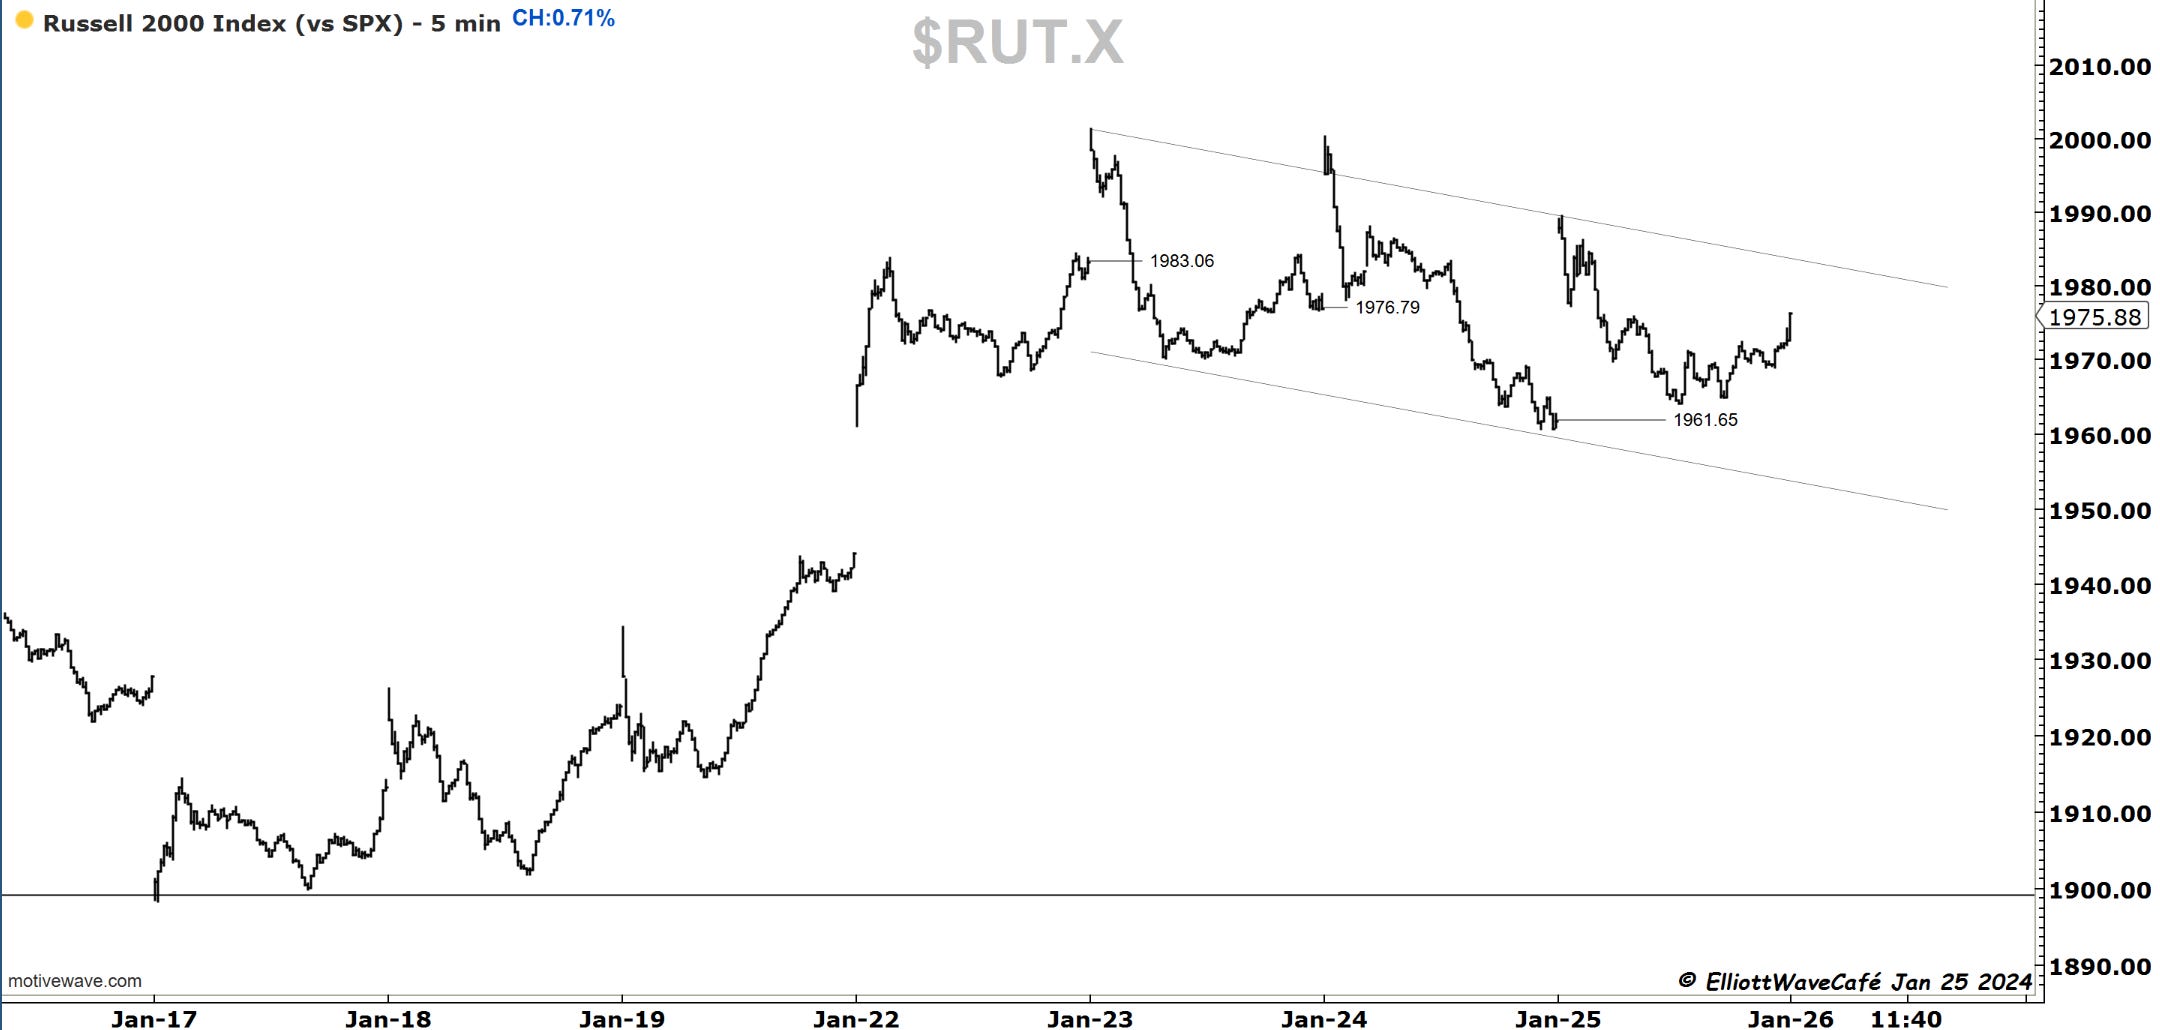
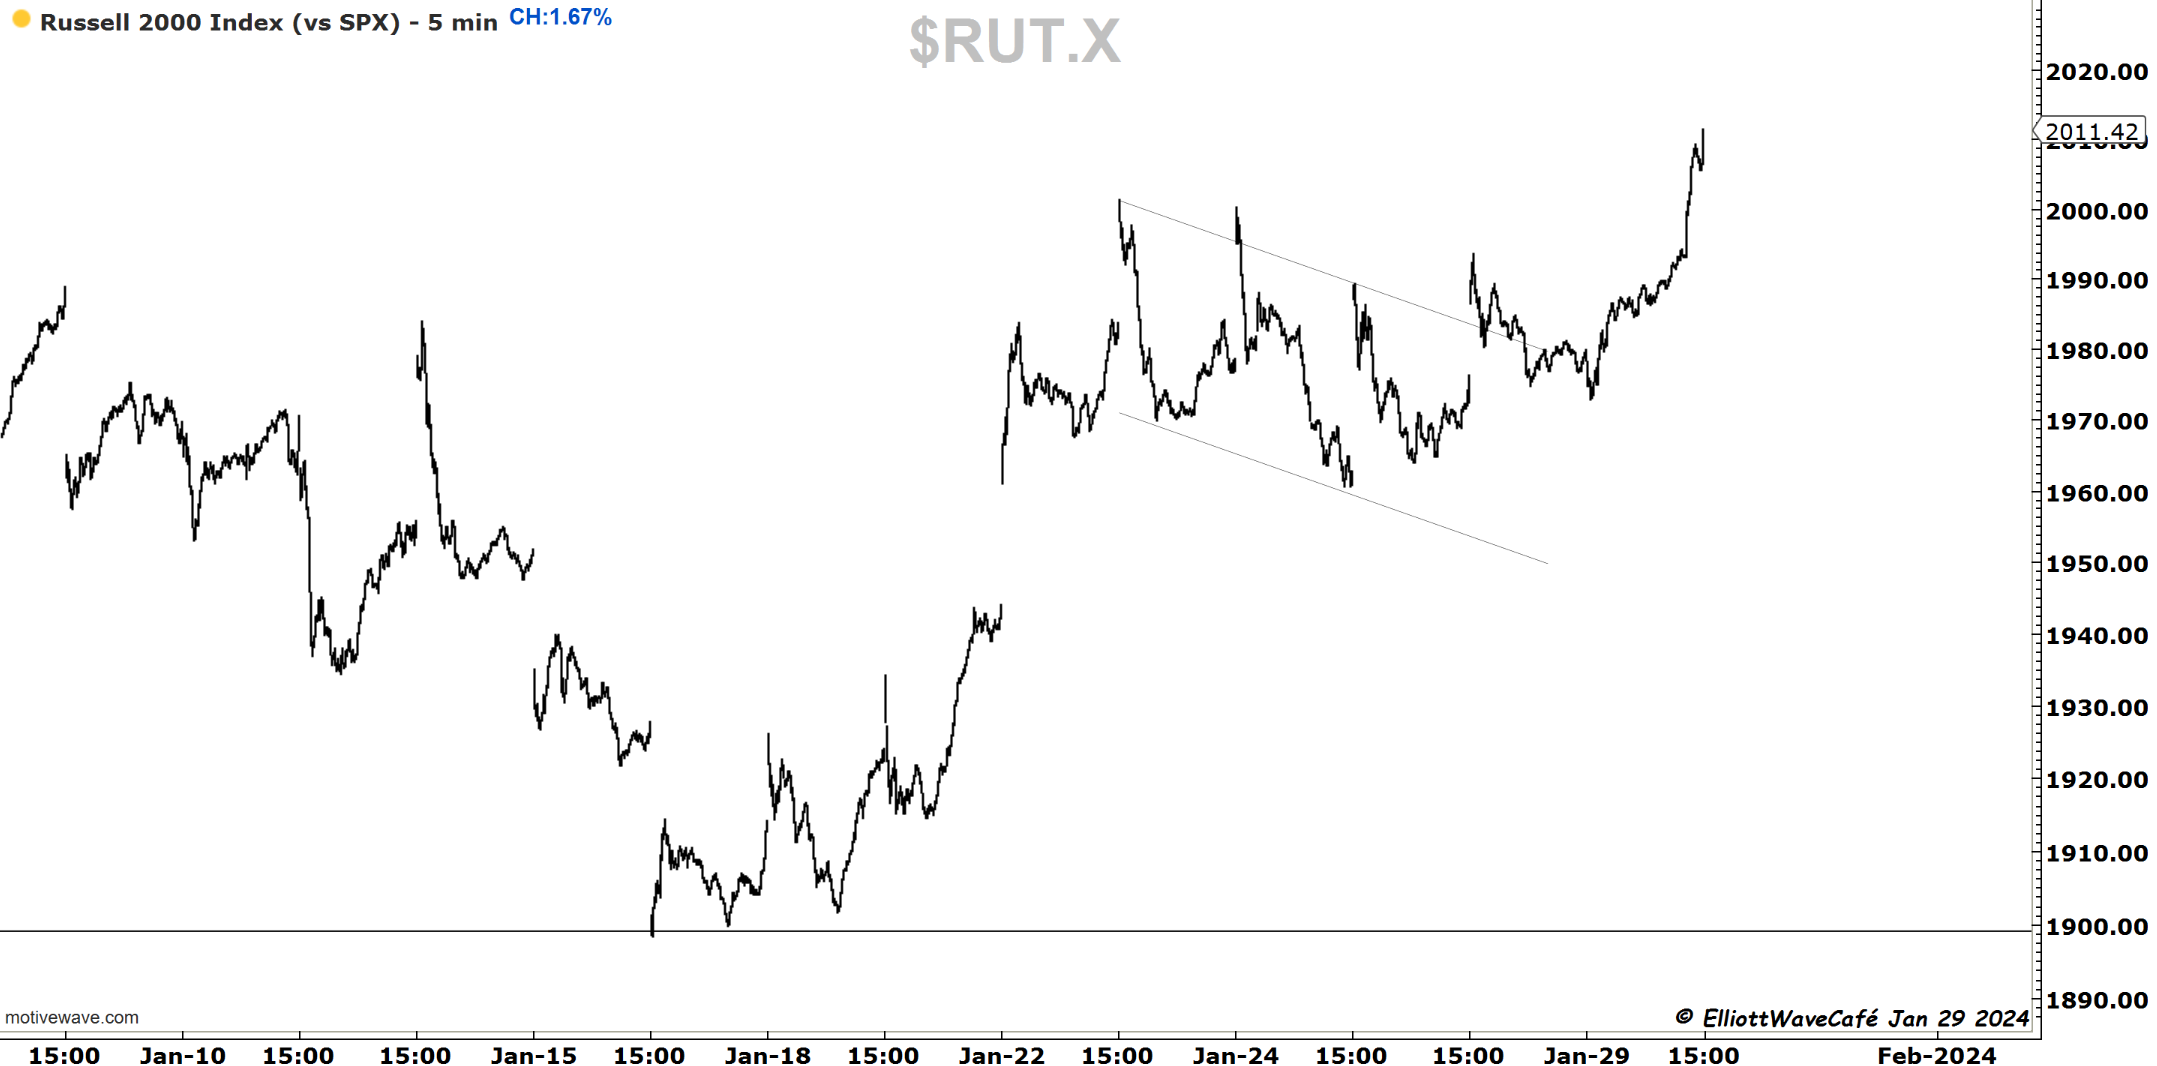
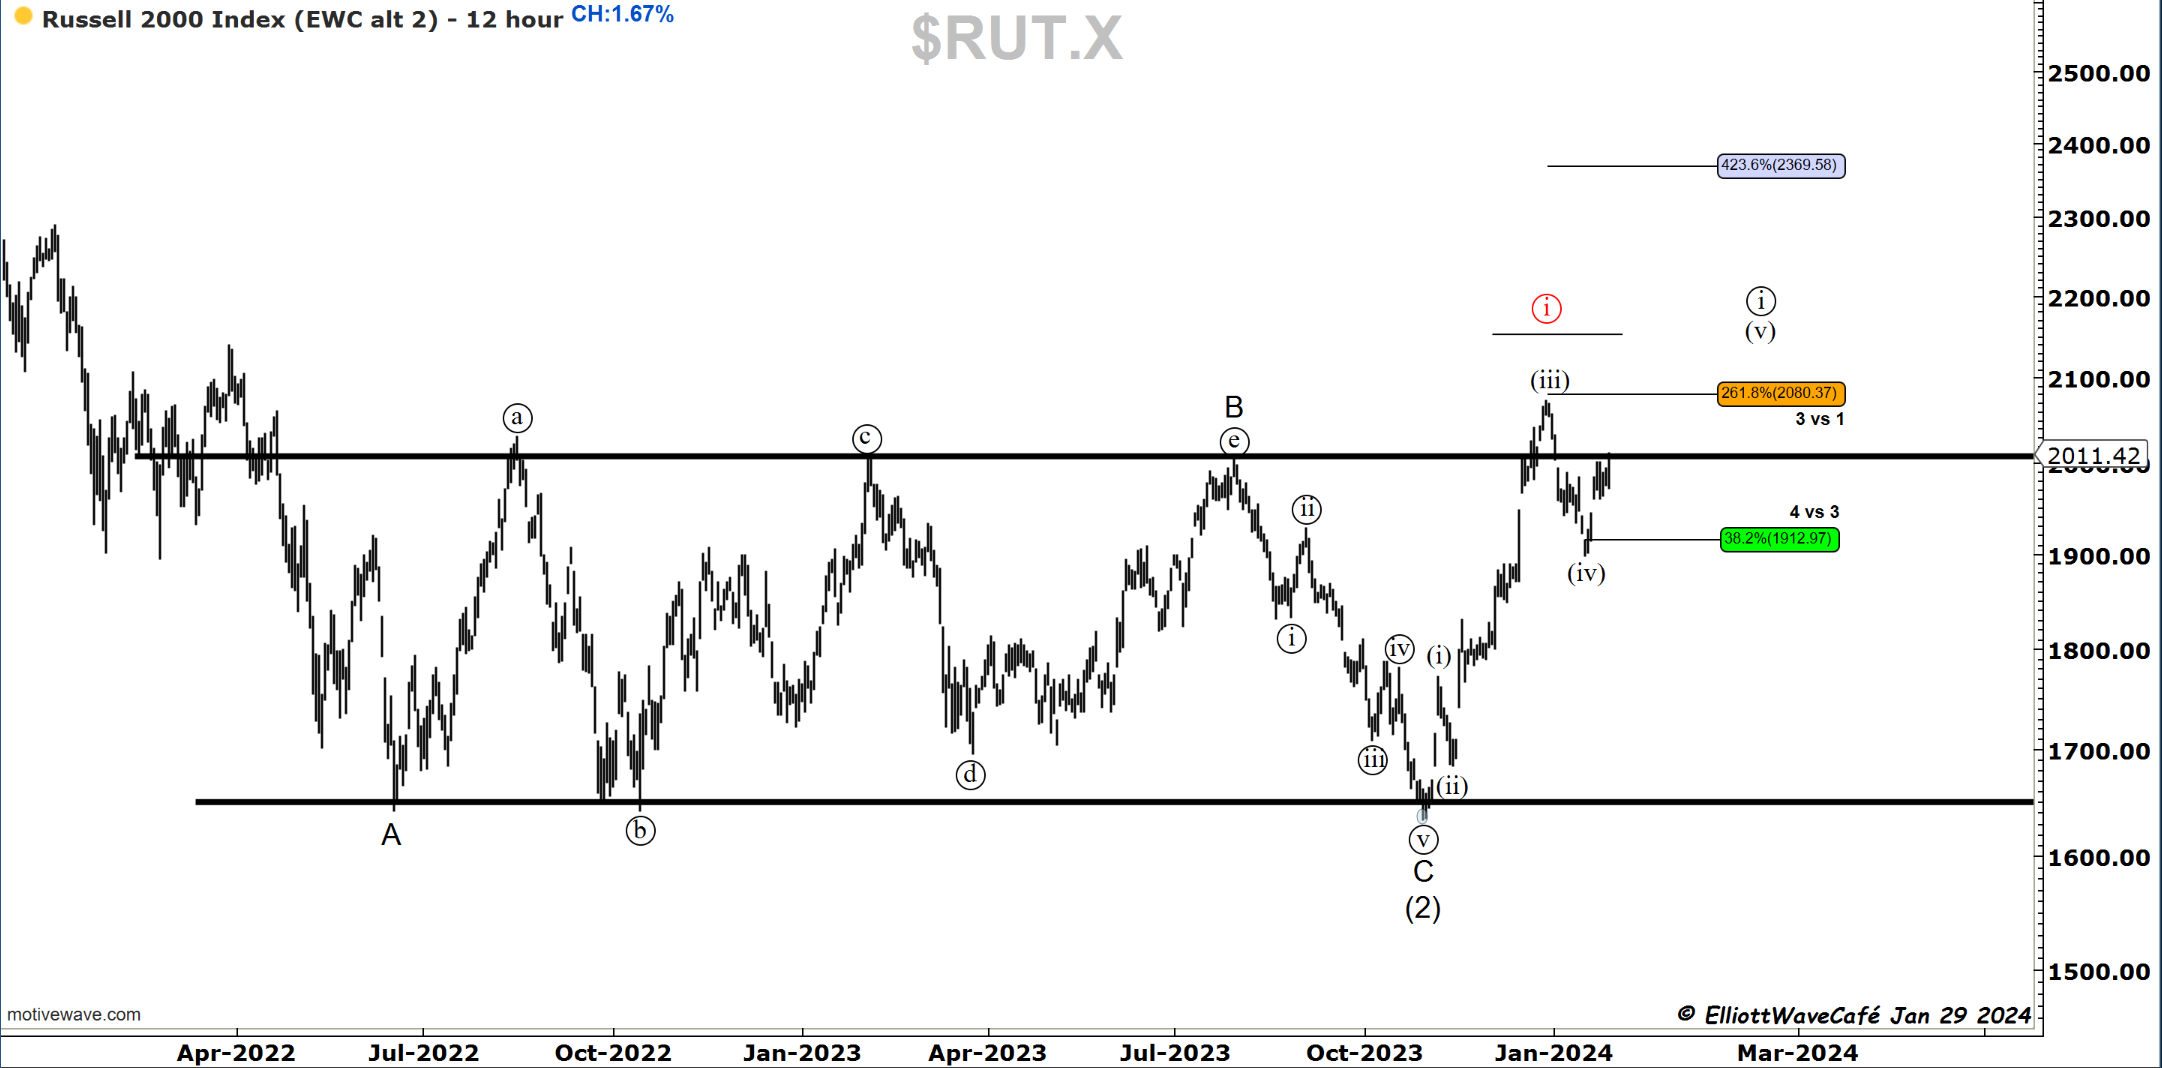
RUSSELL 2000
That corrective channel in the Russell has resumed higher as expected. We are now once again at the old breakout levels near 2000. Although the prospects of a B or X wave have not been nullified, continued strength here would call for a high above Dec 24th high in a wave (v). Let’s see if she’s able to crack this current ceiling.

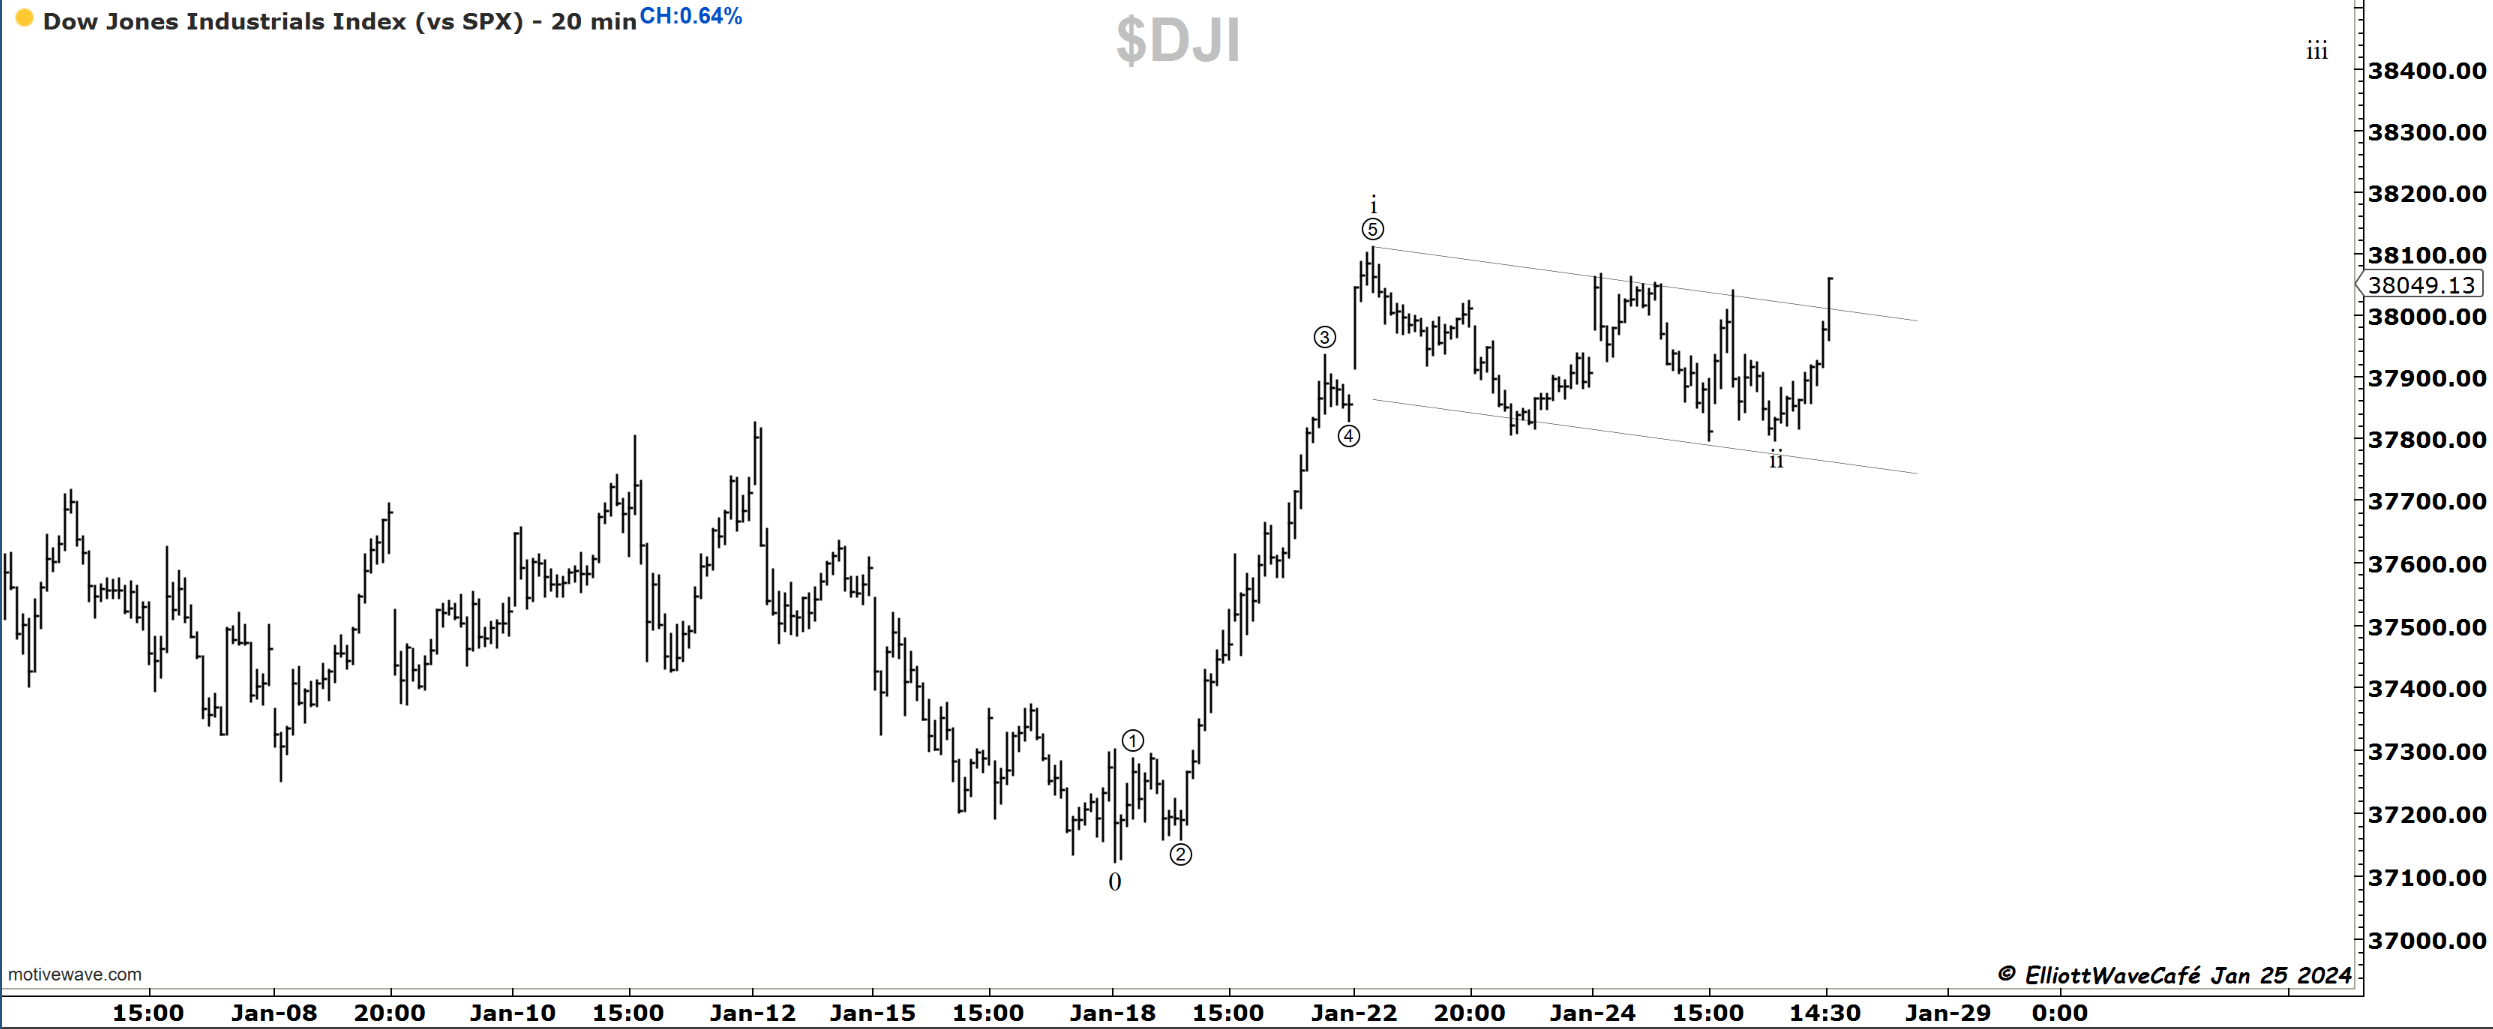
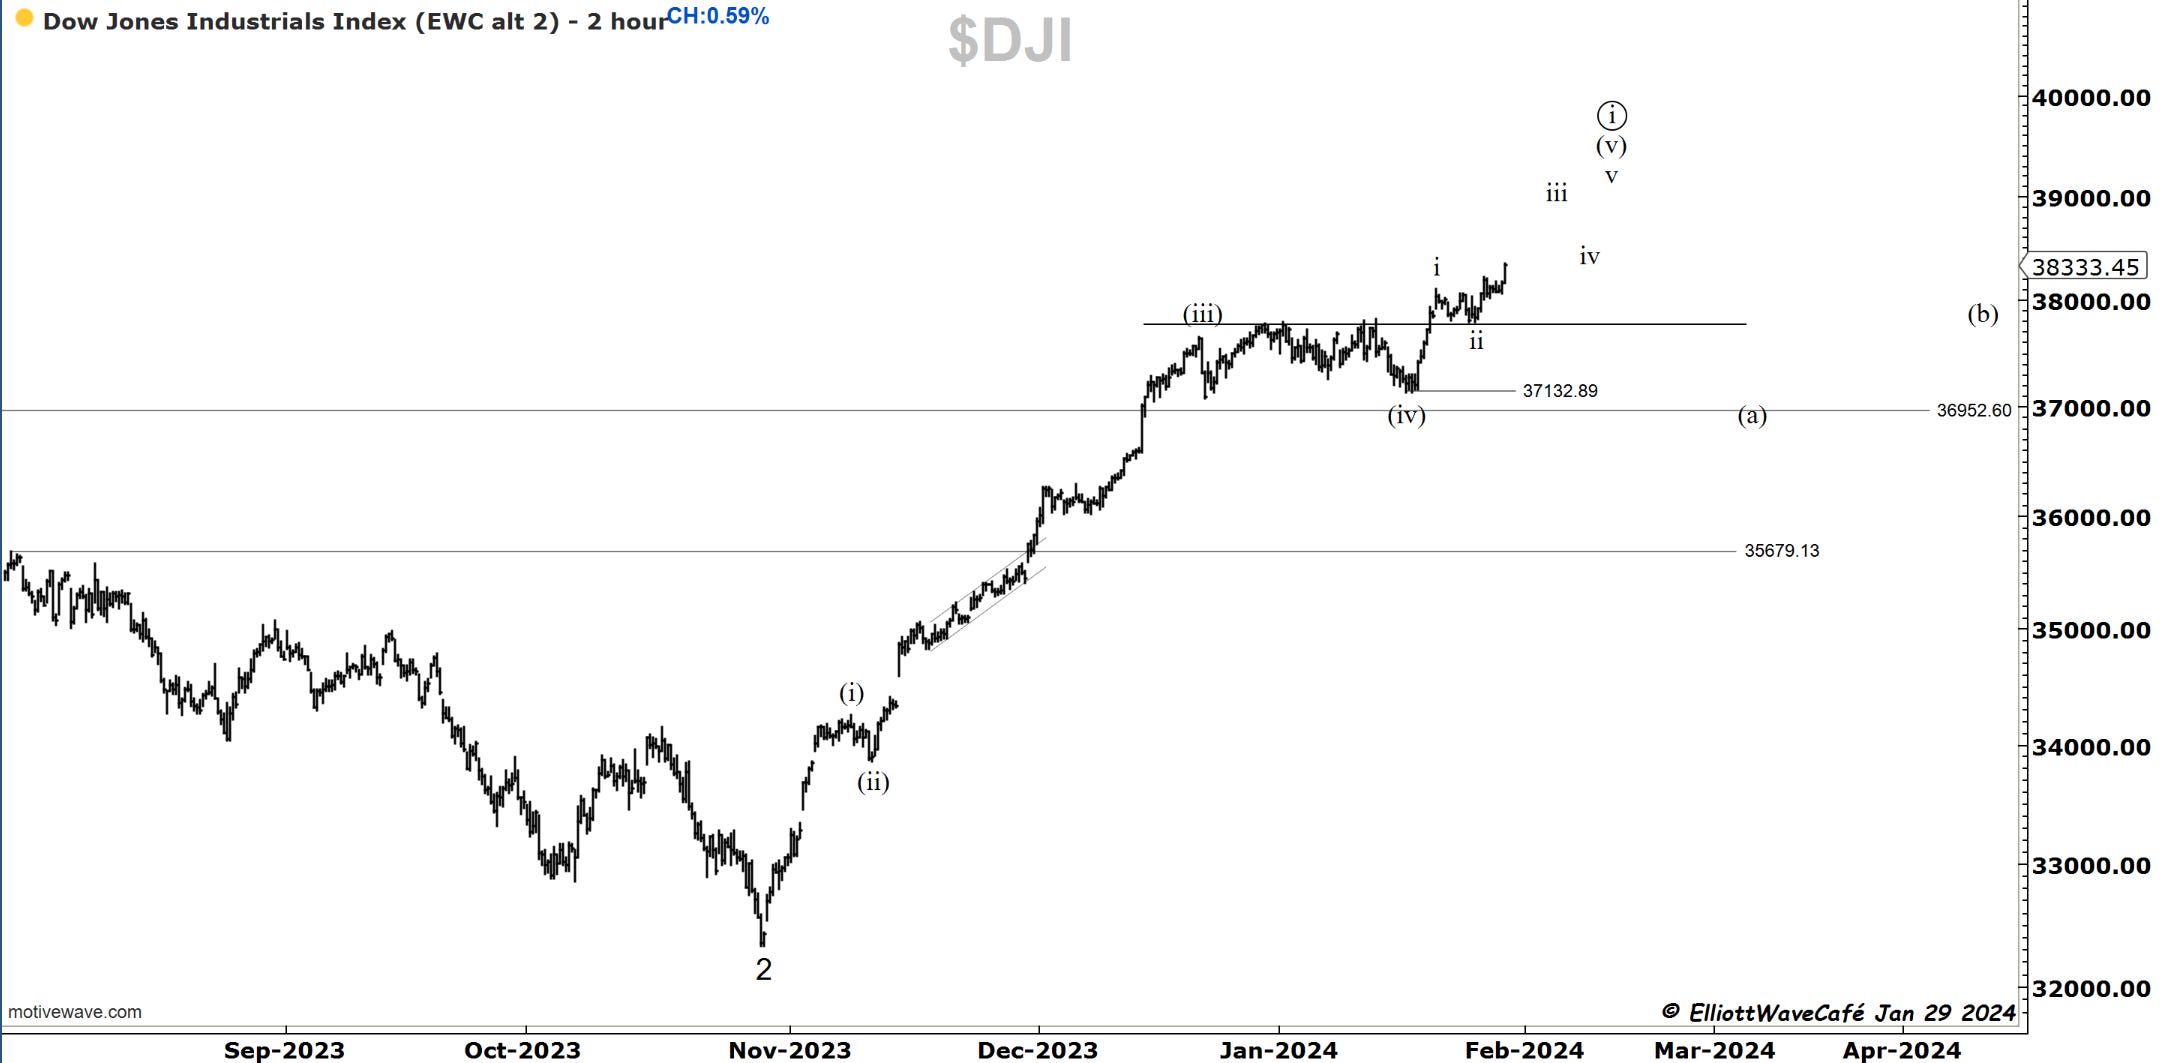
Dow30
That channel low on Thursday last week seems to have been a wave ii of (v). It quickly retested the breakout zone at 37,800, followed by a punch higher. Under those conditions, we would expect further upside towards 39k. A drop back below the S/R line would hint that a top is likely in place for the time being, and the seasonal correction has started.
US Dollar and Yields
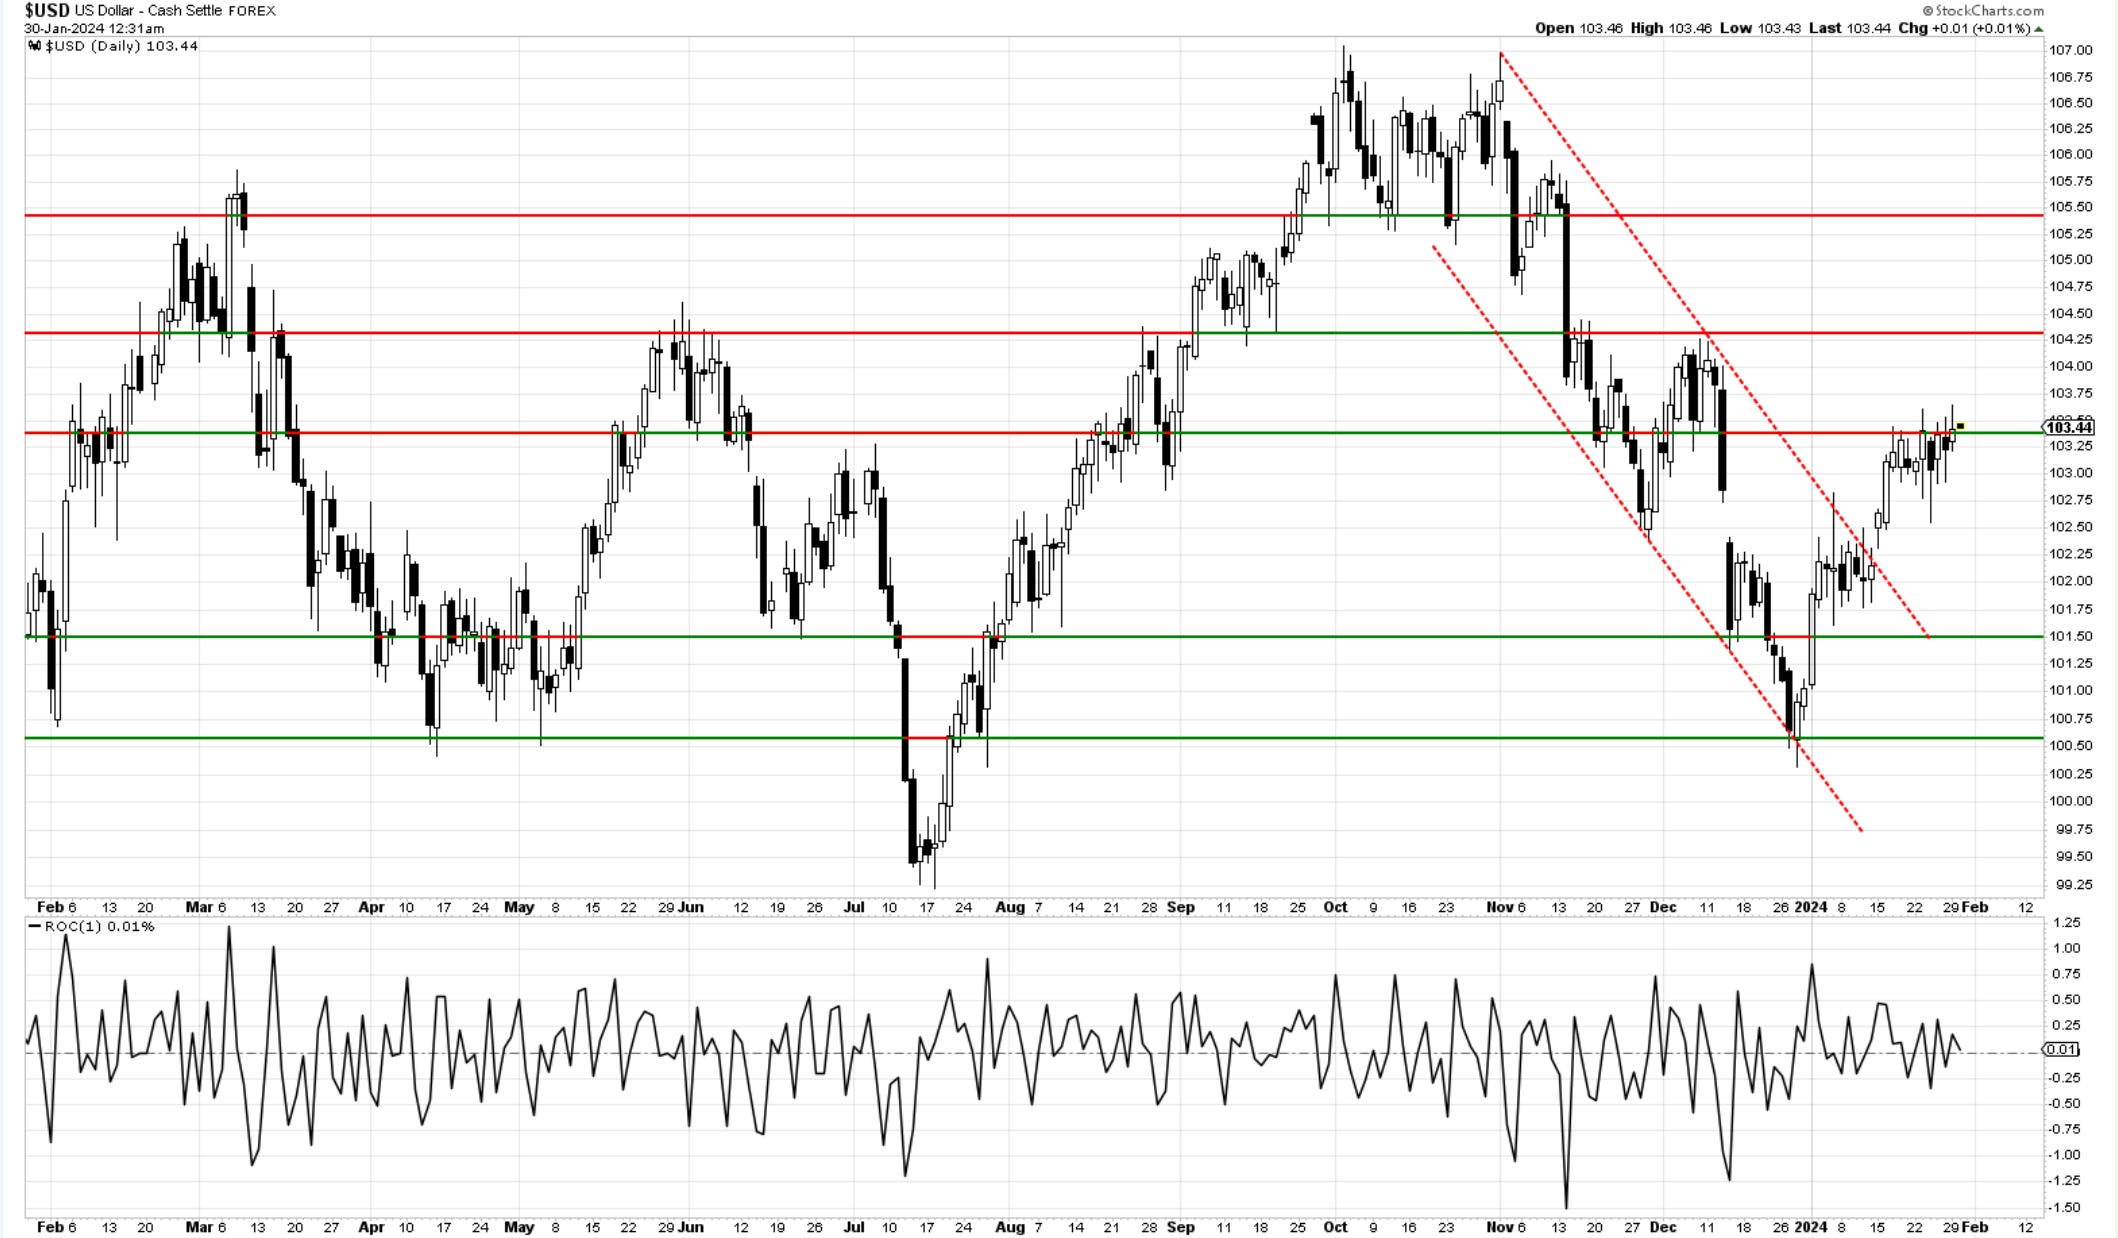
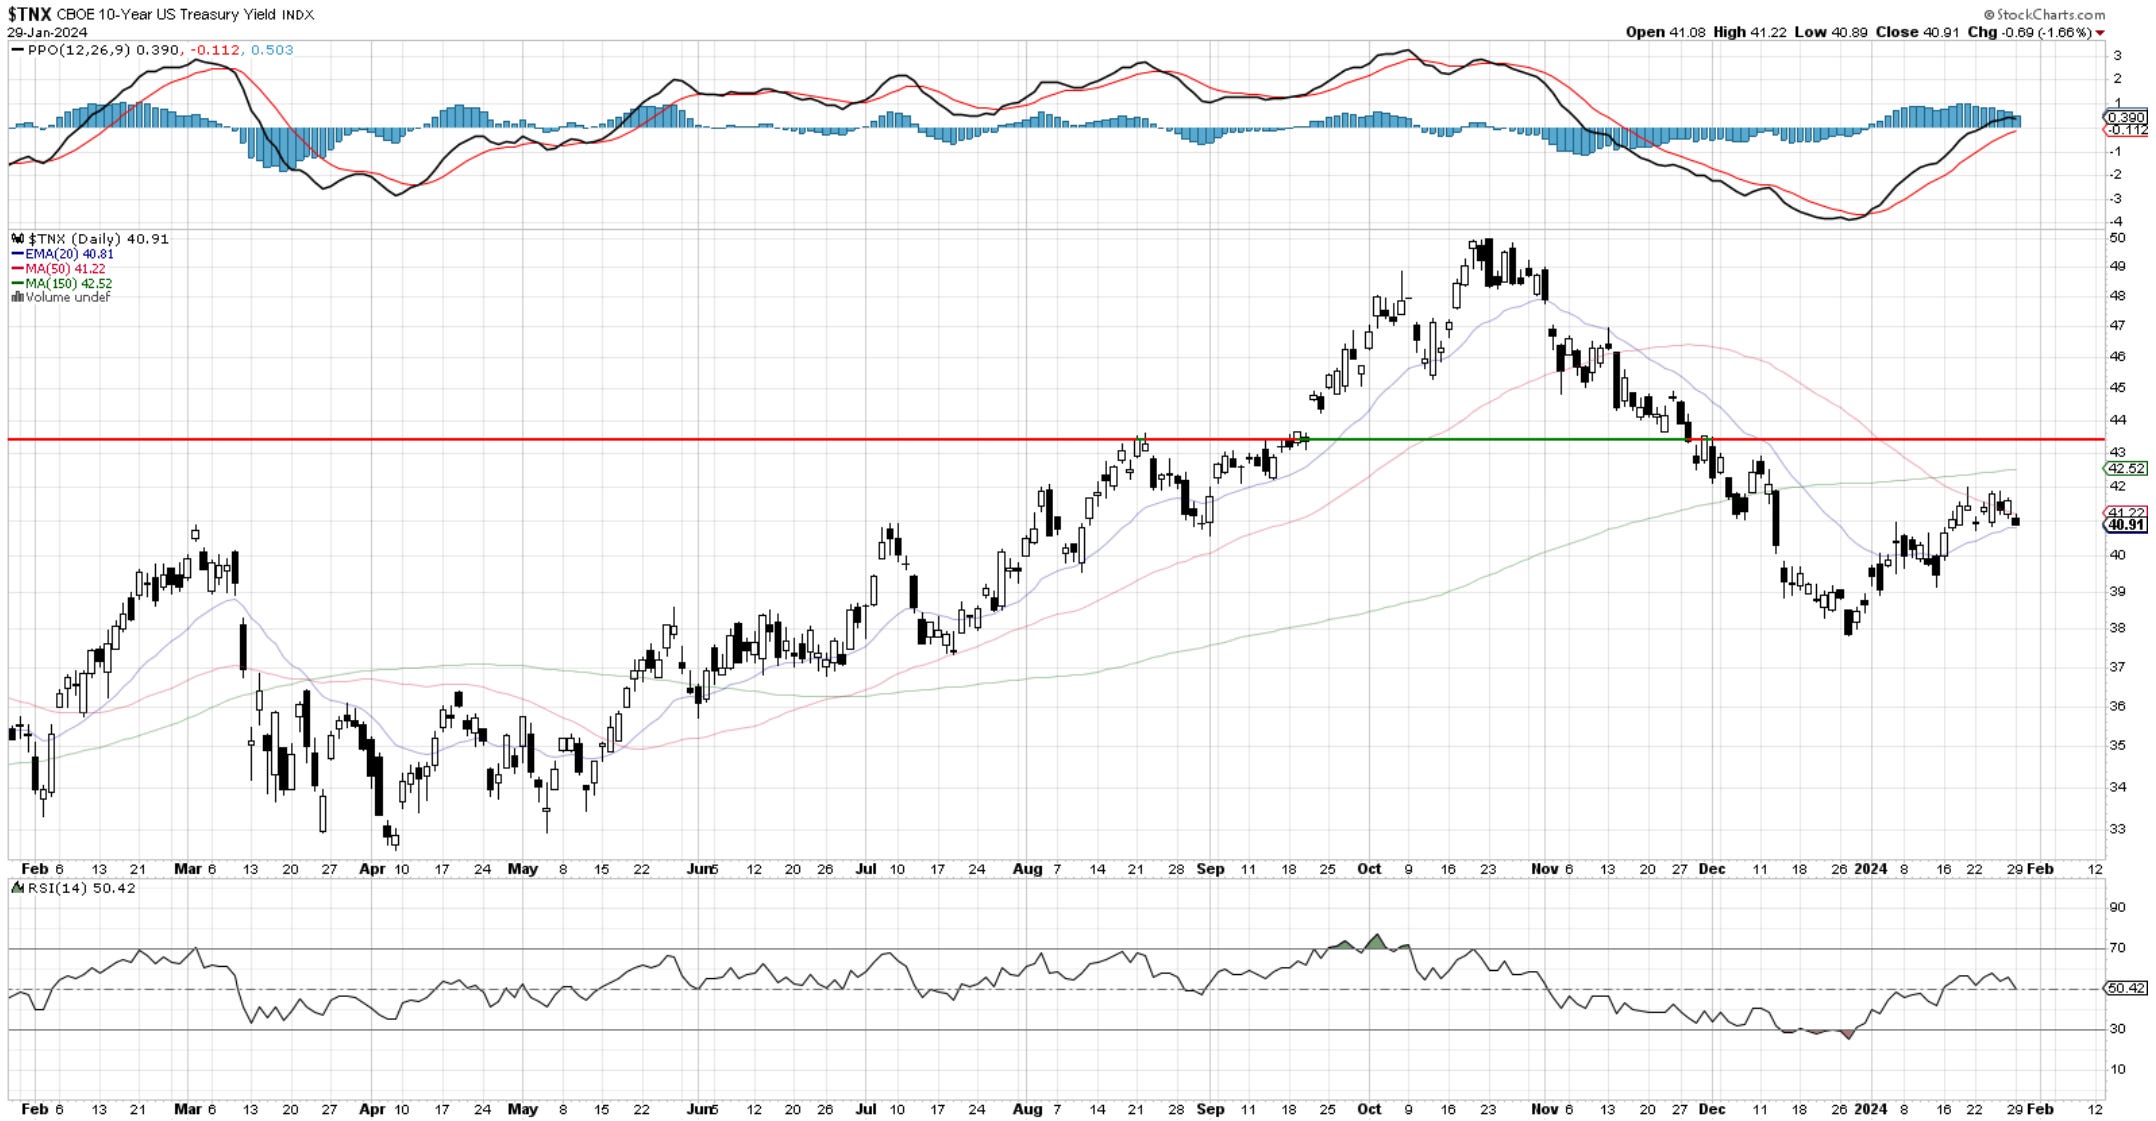
The dollar has yet to respond to the strength in equities, even with a slight decline in treasury yields. With the FED on Wednesday, these two markets are key. A break of 3.9% in the 10yr would suggest the 3-wave rally is over and new lows are coming. The dollar would follow I reckon along with risk continuing higher. Notice how the Greenback is fighting the old memory level near 103.30.
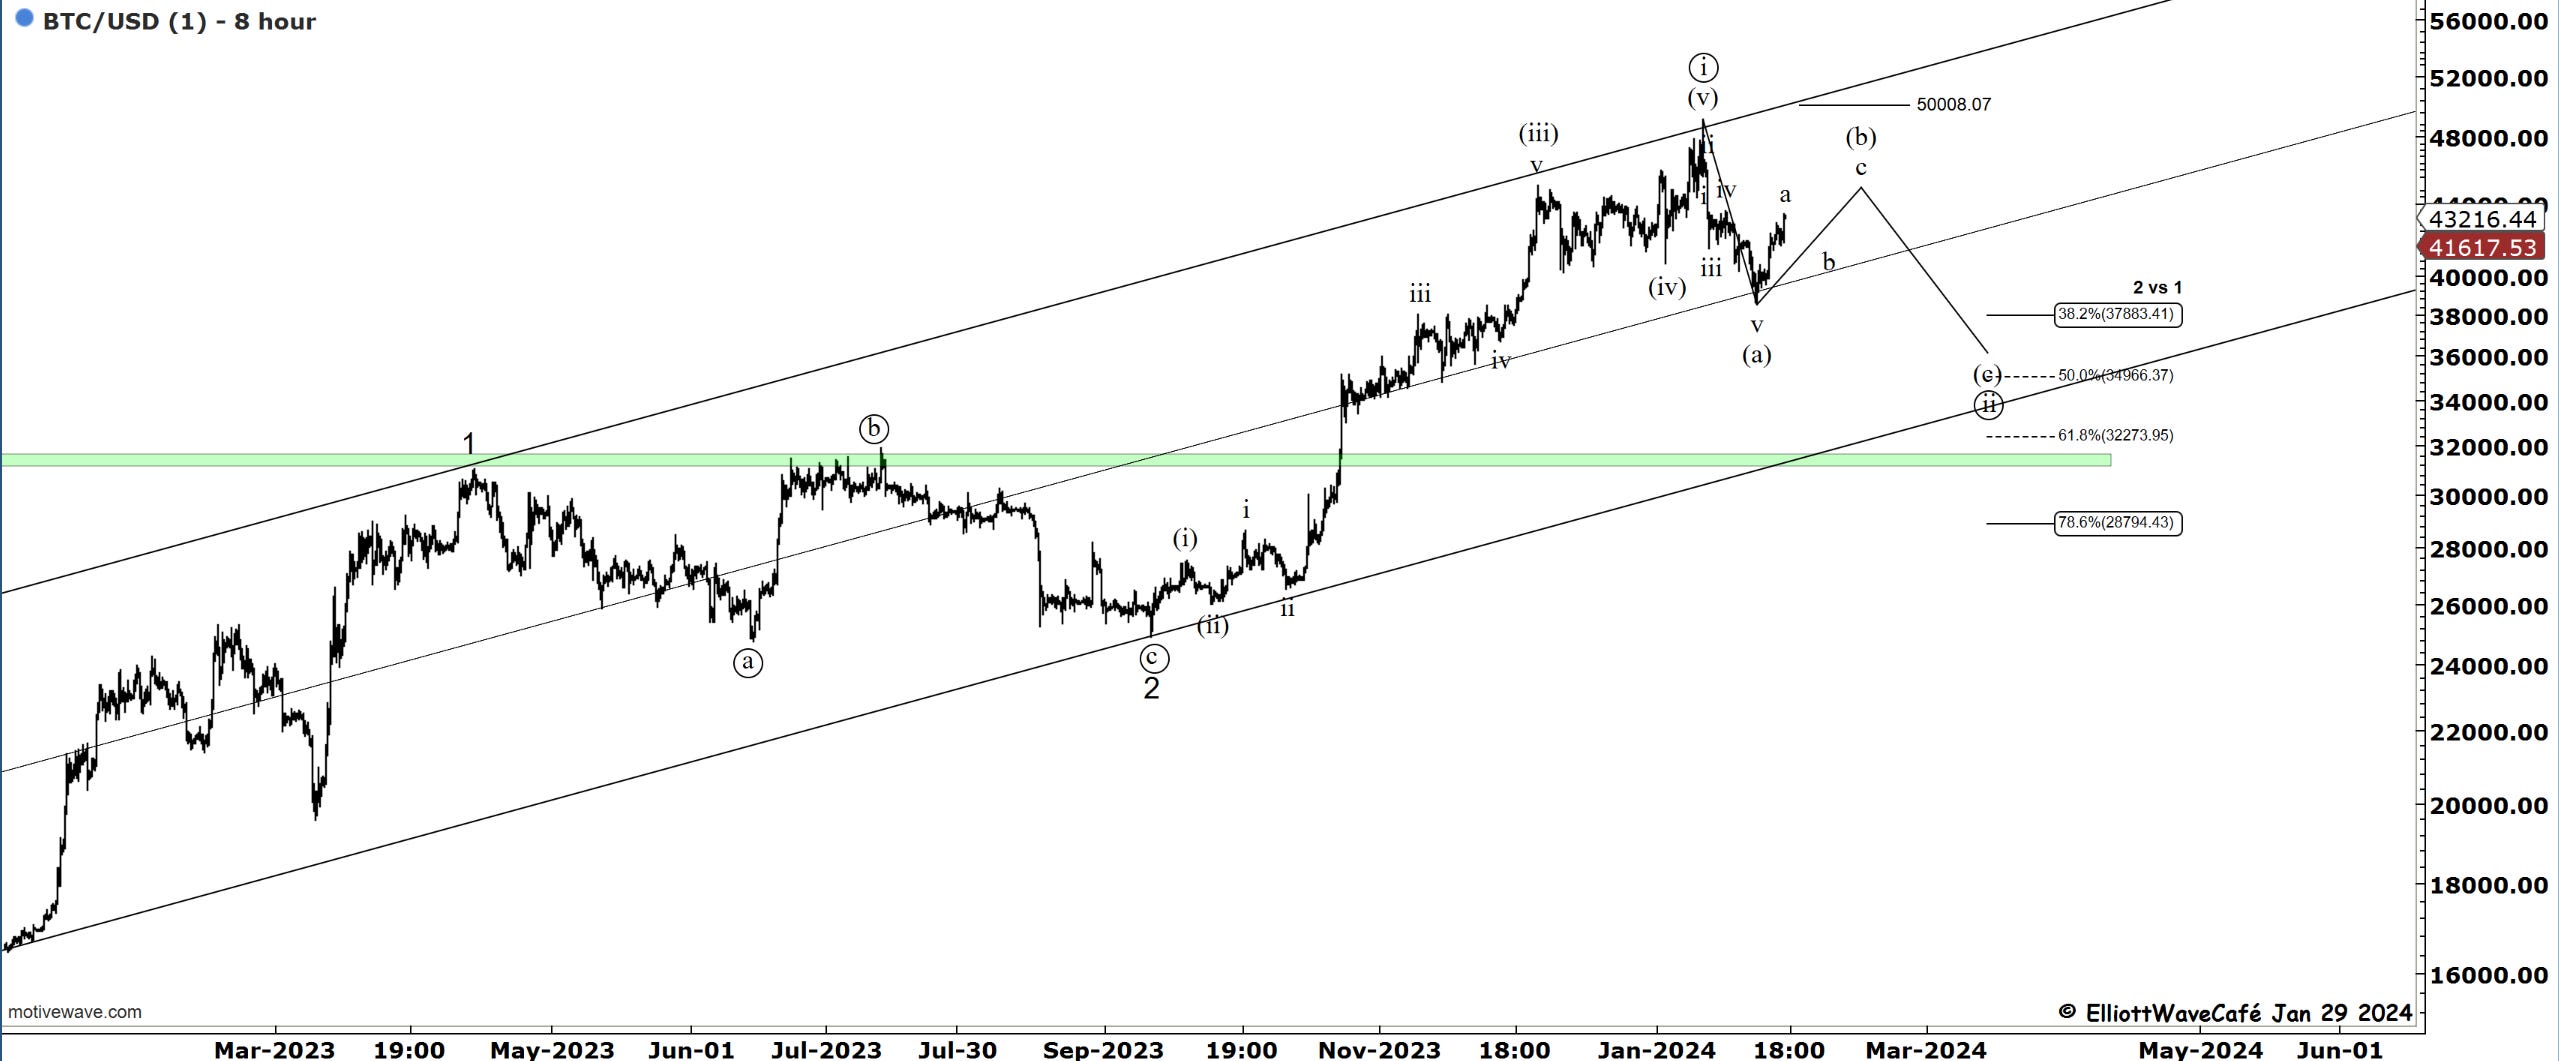
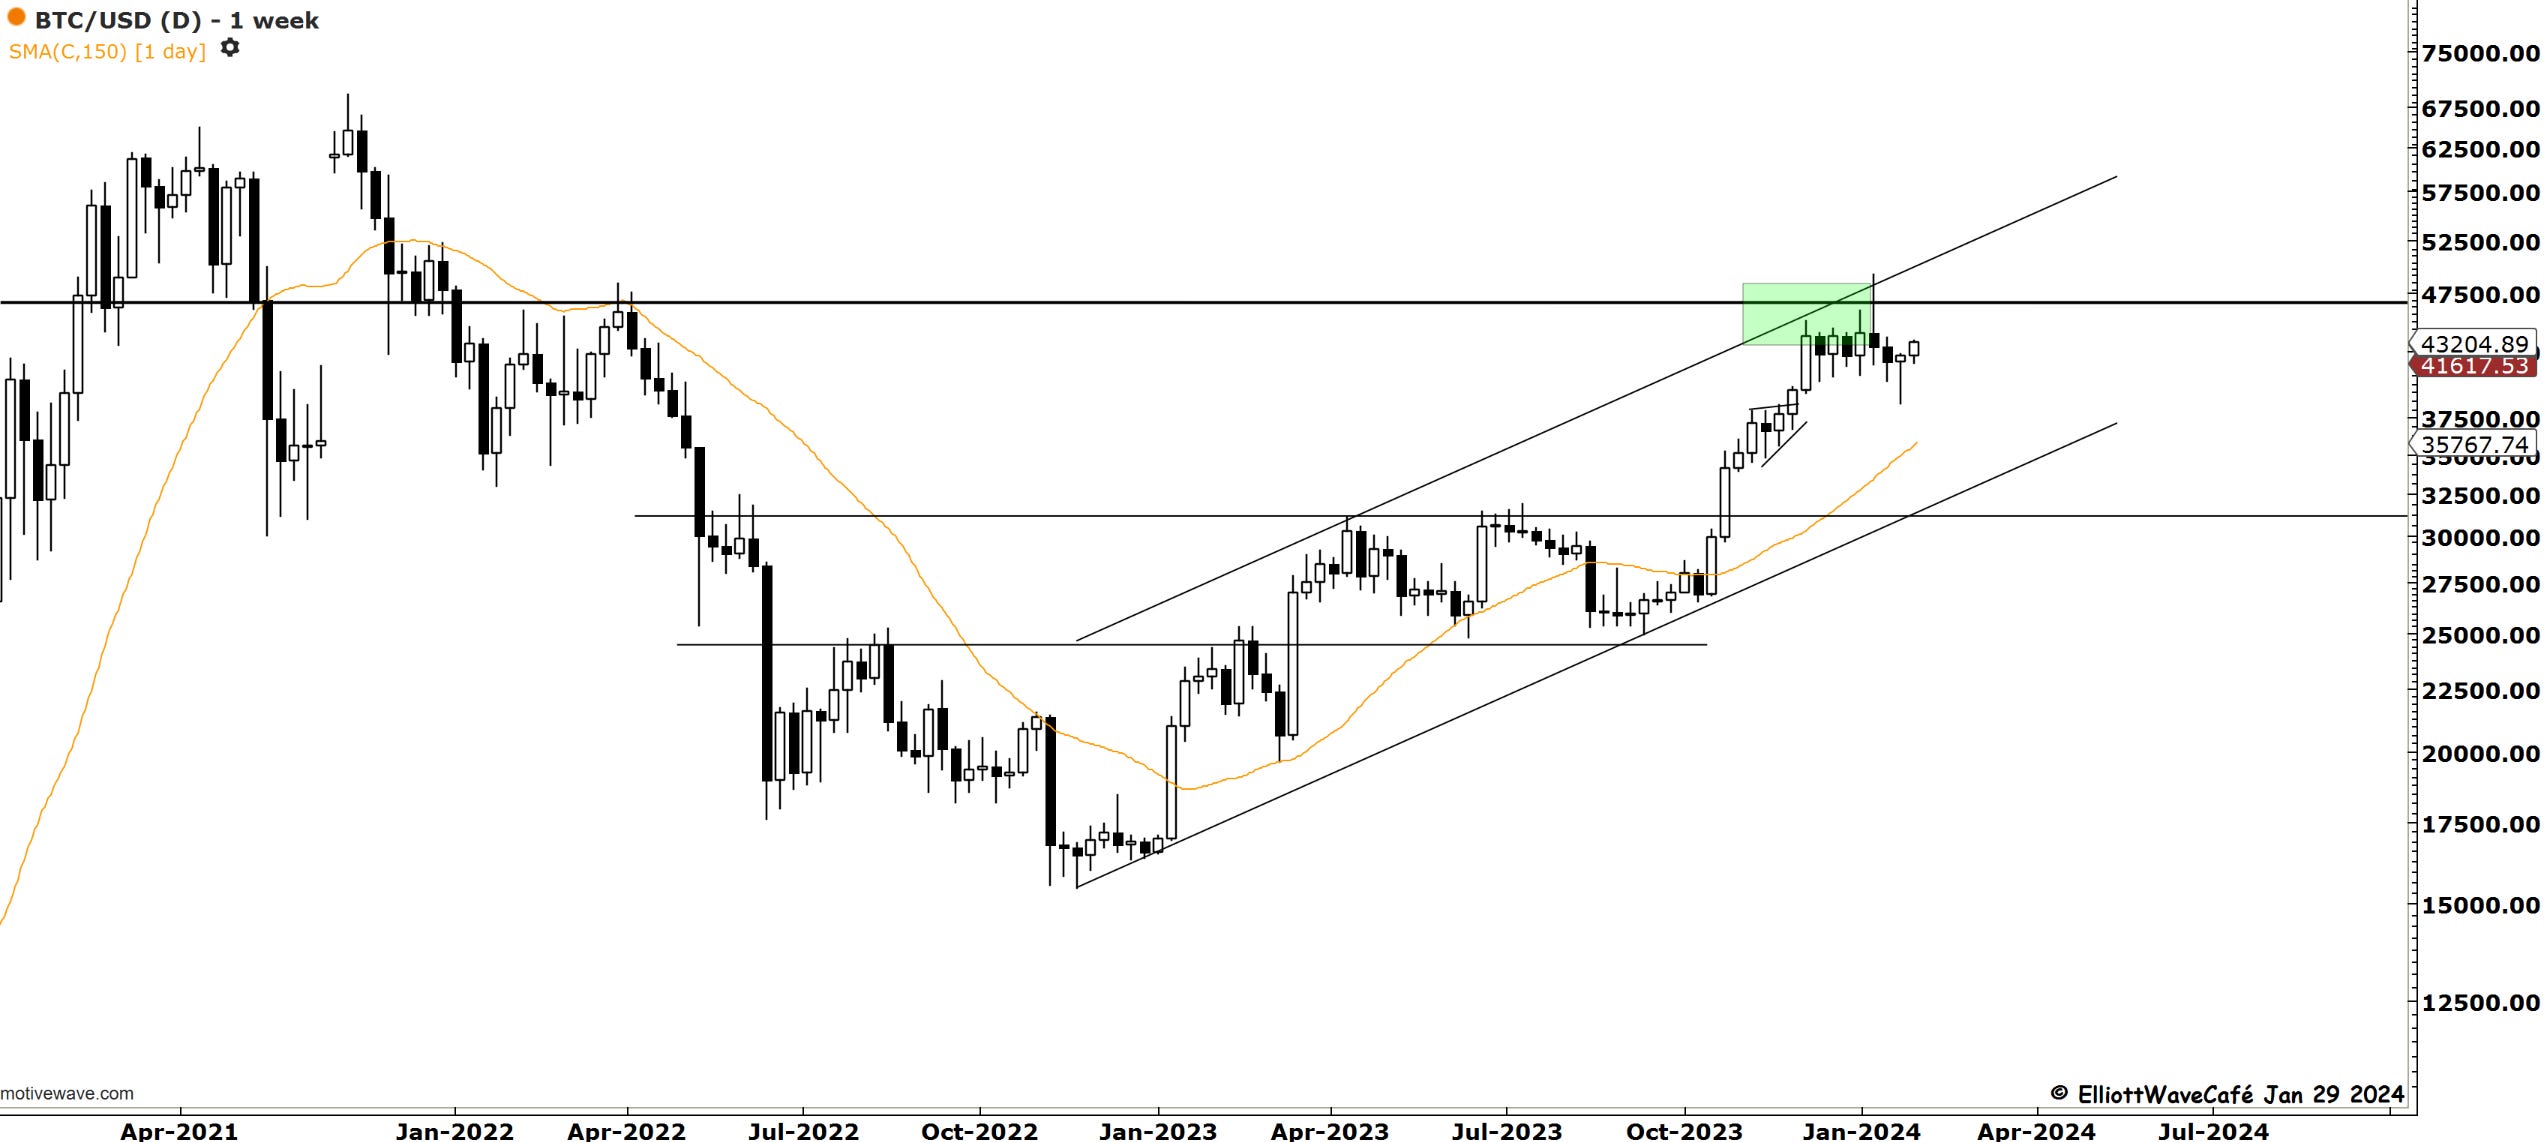
Bitcoin
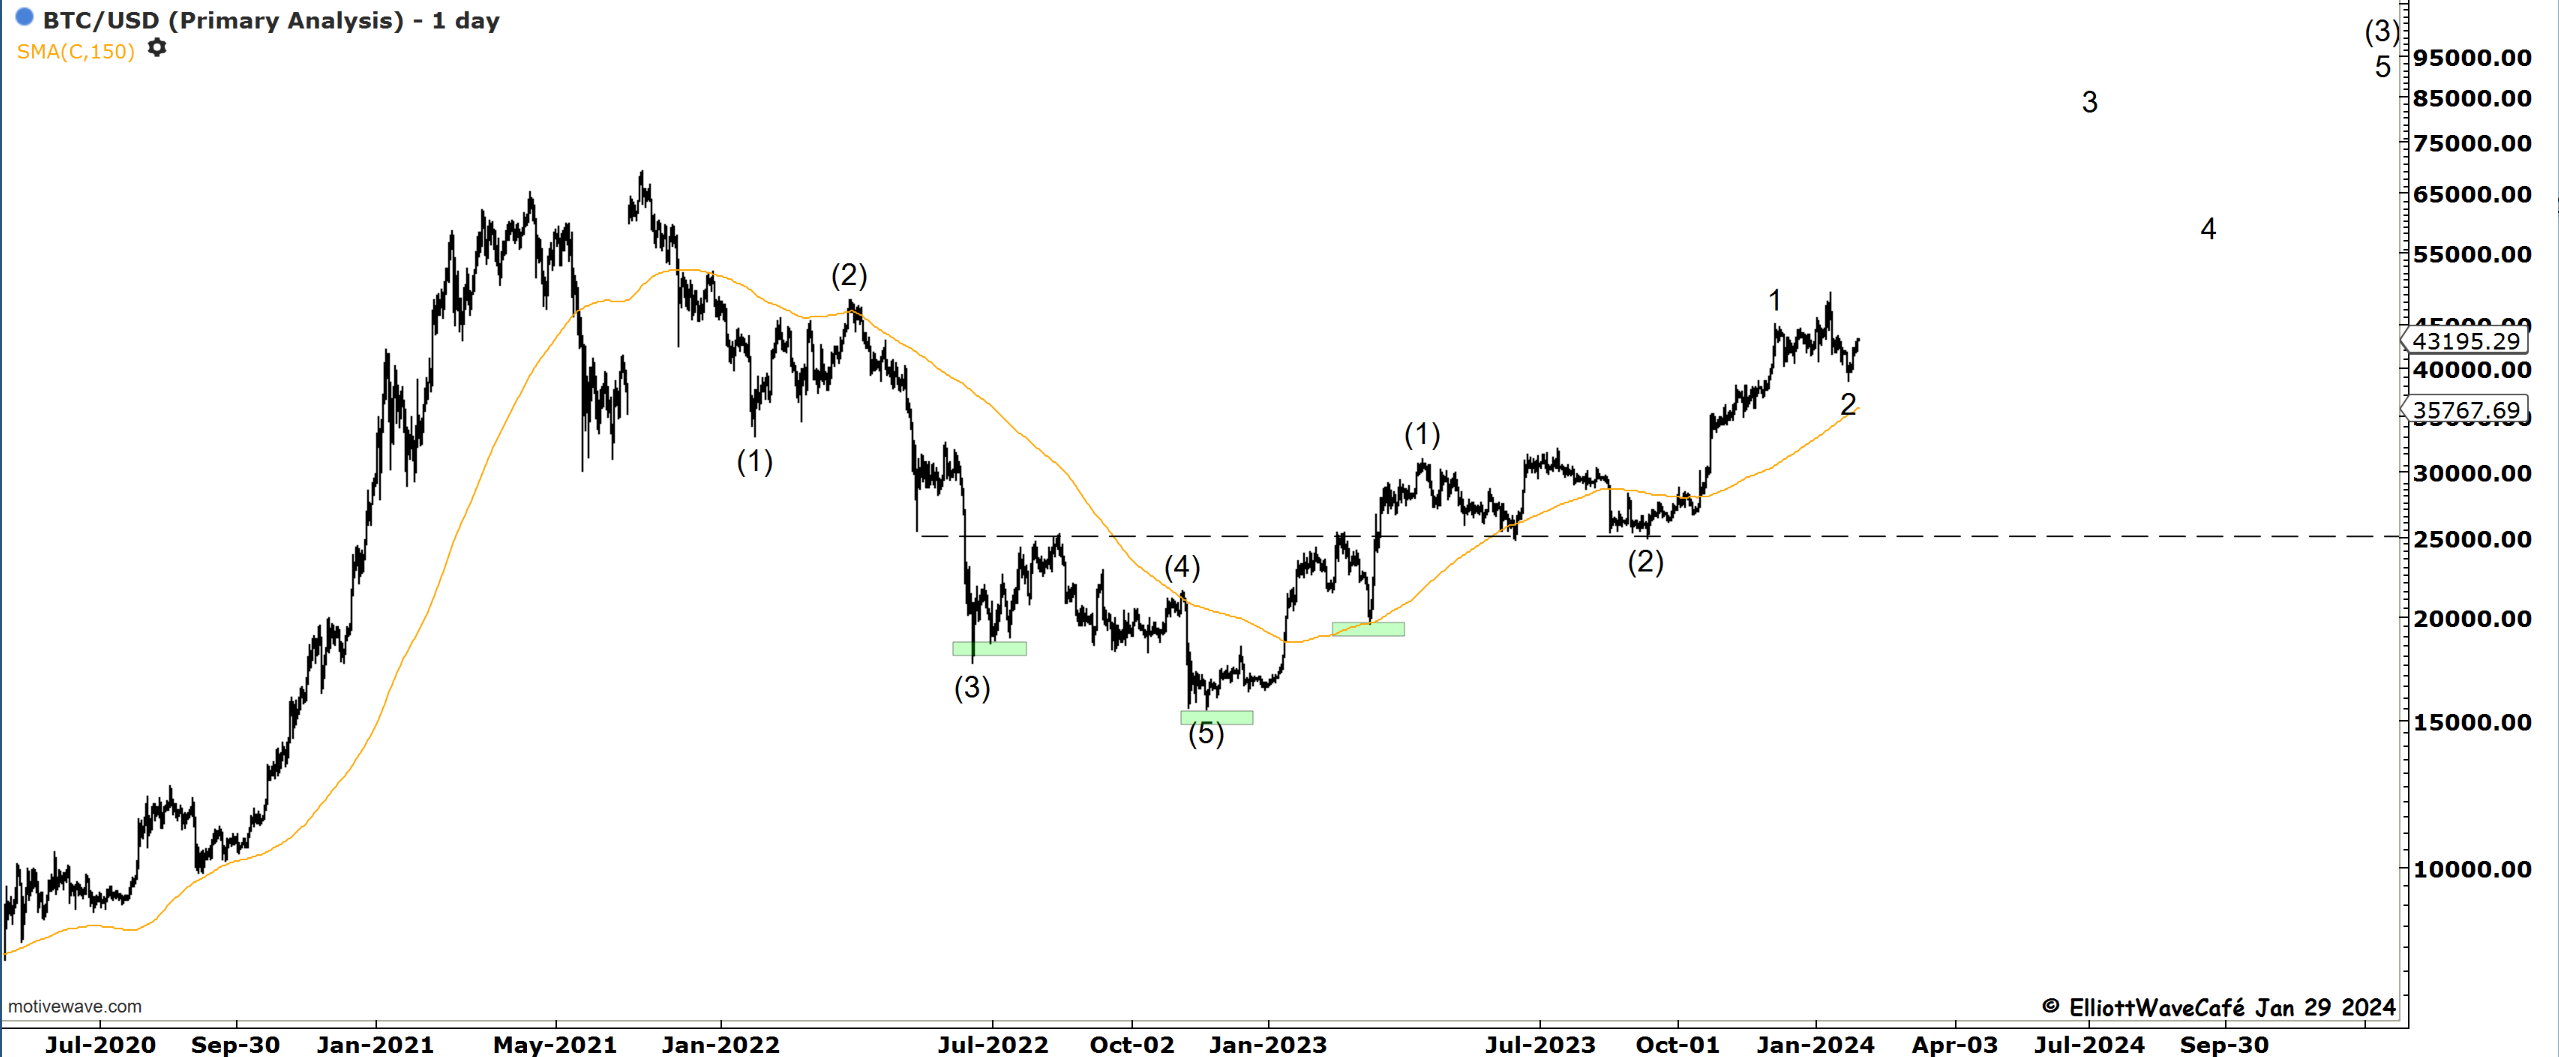
Nice recovery in Bitcoin from the middle of the upward trending channel. The weekly closing candle also looks like a bullish hammer. If there is a wave (c ) coming after (b) completes, we should not travel higher for much longer. If the market breaks 45k, it will be tough to stay with the current count view, and adjustments will need to be made. I would probably look like something in the 3rd chart.
Given the seasonal risk in equities and the possibility of a correction, one has to be mindful of how BTC would behave under those conditions. It could line up as the next declining leg. I am closely monitoring these levels and price behavior this week.
“Double shot” Daily member video coming up next,
If you’re new to Elliott Wave or need to refresh, there is a 7-hour video course with downloadable slides under The Coarse tab on the website.
Have a great day wherever you are! - trade well, and don’t forget to subscribe and drop a like if this letter helps you in any way.
Cris
email: ewcafe@pm.me