
The Daily Drip
Core markets charts updates and commentary
Note: The counts on the right edge are real-time, and they are prone to adjustments as price action develops. Elliott Wave has a fluid approach, is evidence-based, and requires constant monitoring of certain thresholds.
In the counts below, this (( )) = circle on chart
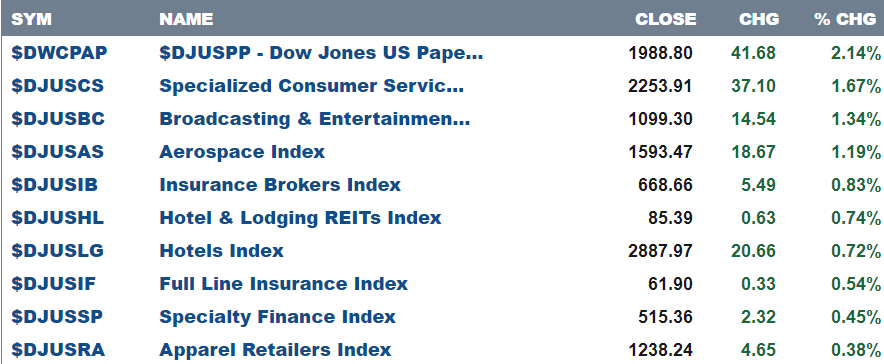
Here are today’s top 10 best performers out of 104 industries.
20 positive closes and 84 negative.
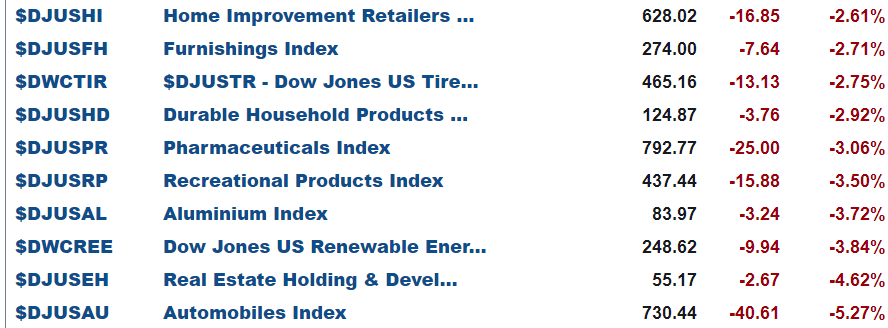
and bottom 10 …
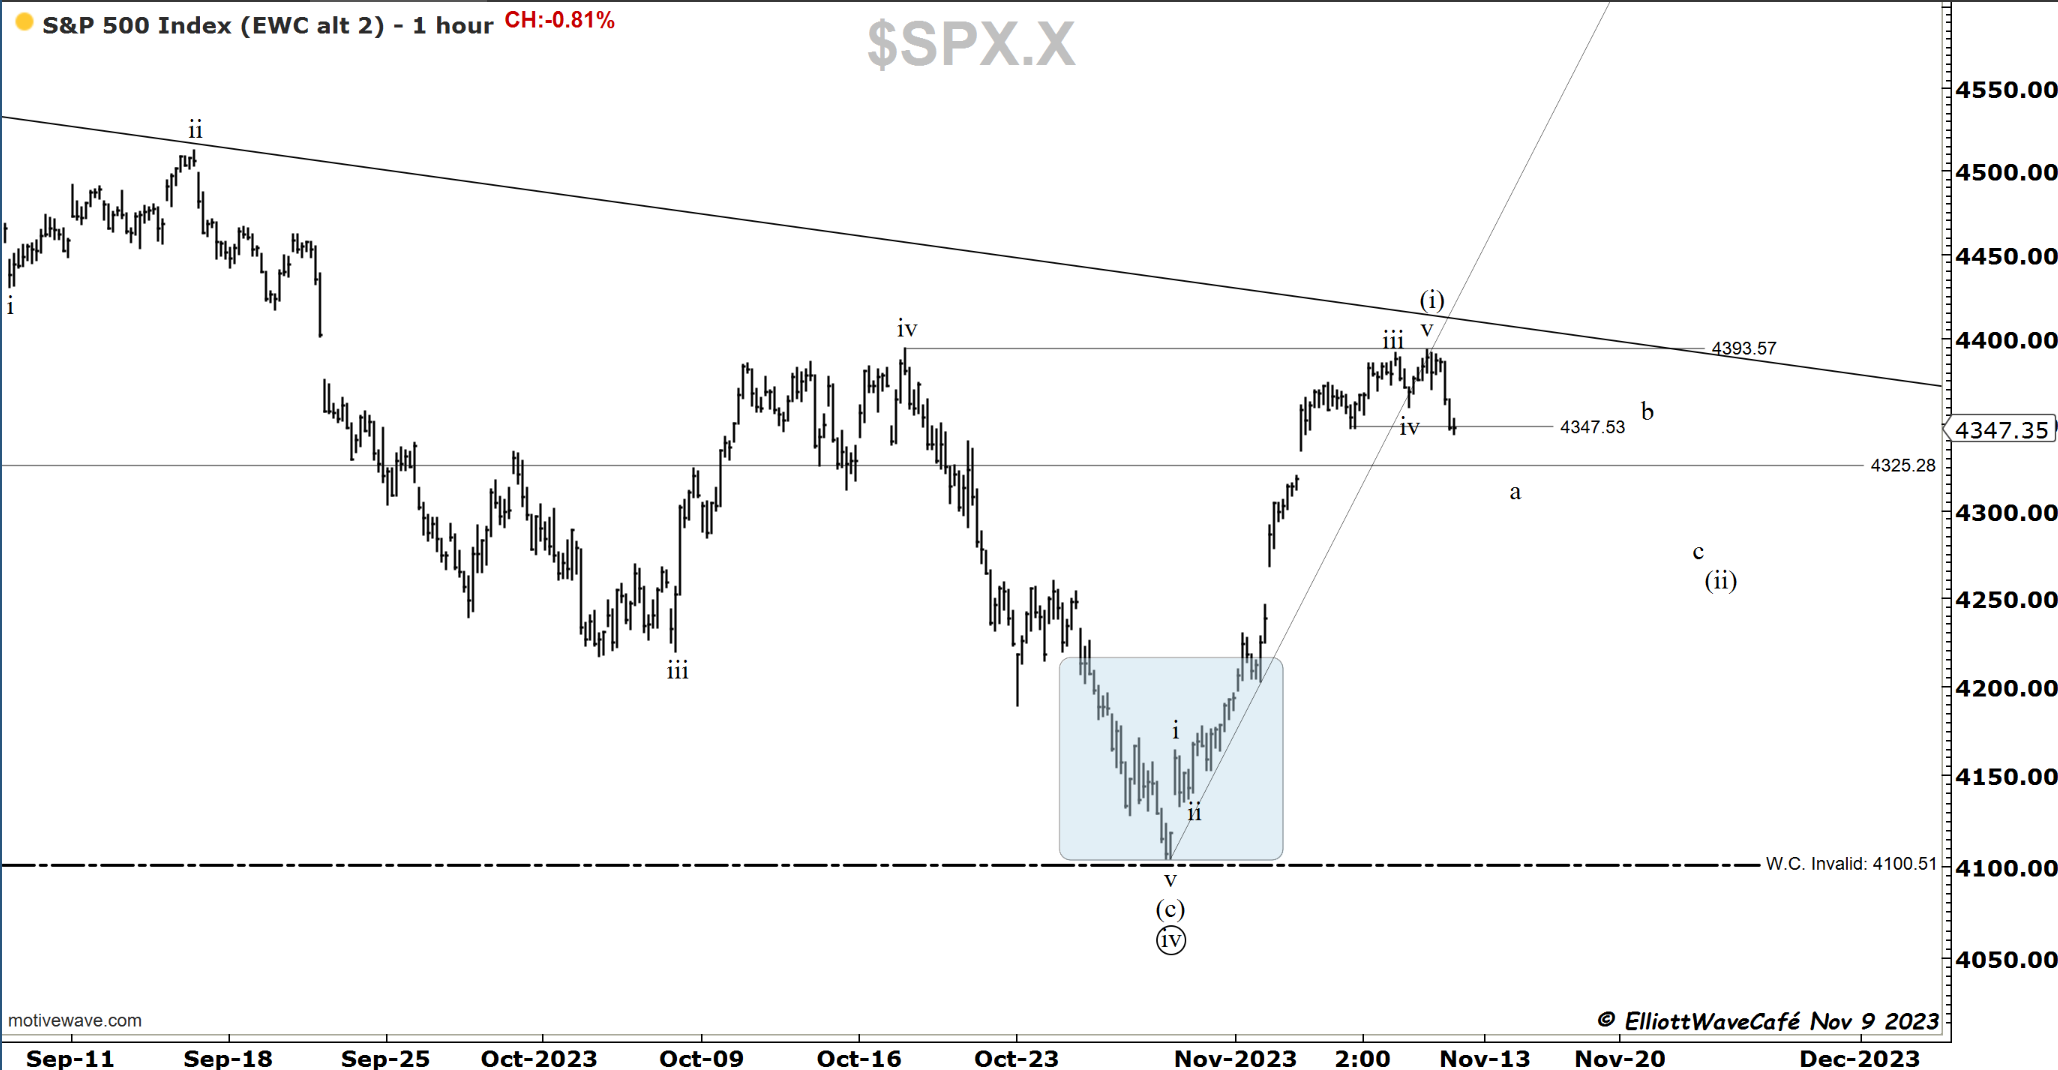
SP500
The index took a tumble today after a couple of failed attempts at taking out the highs. The internal deterioration that I drew attention to over the past several days led to a -0.81% decline and a drop below the prior swing low at 4347. The uptrend has been violated, and I expect further weakness in the days ahead. Selling rallies is right until signs will start to come in that a wave (ii) has run its course. If accurate in projections, we should be in the initial stage of it, a possible wave a. This wave might terminate near 4325, a zone that offered reasons for caution in prior tests. It should be followed by a wave b afterward and a final decline in c. What I am describing is a basic zig-zag ( 5-3-5) correction. Markets might have different thoughts on how they unfold, but EW teaches us to start with the basics and adjust from there if needed.
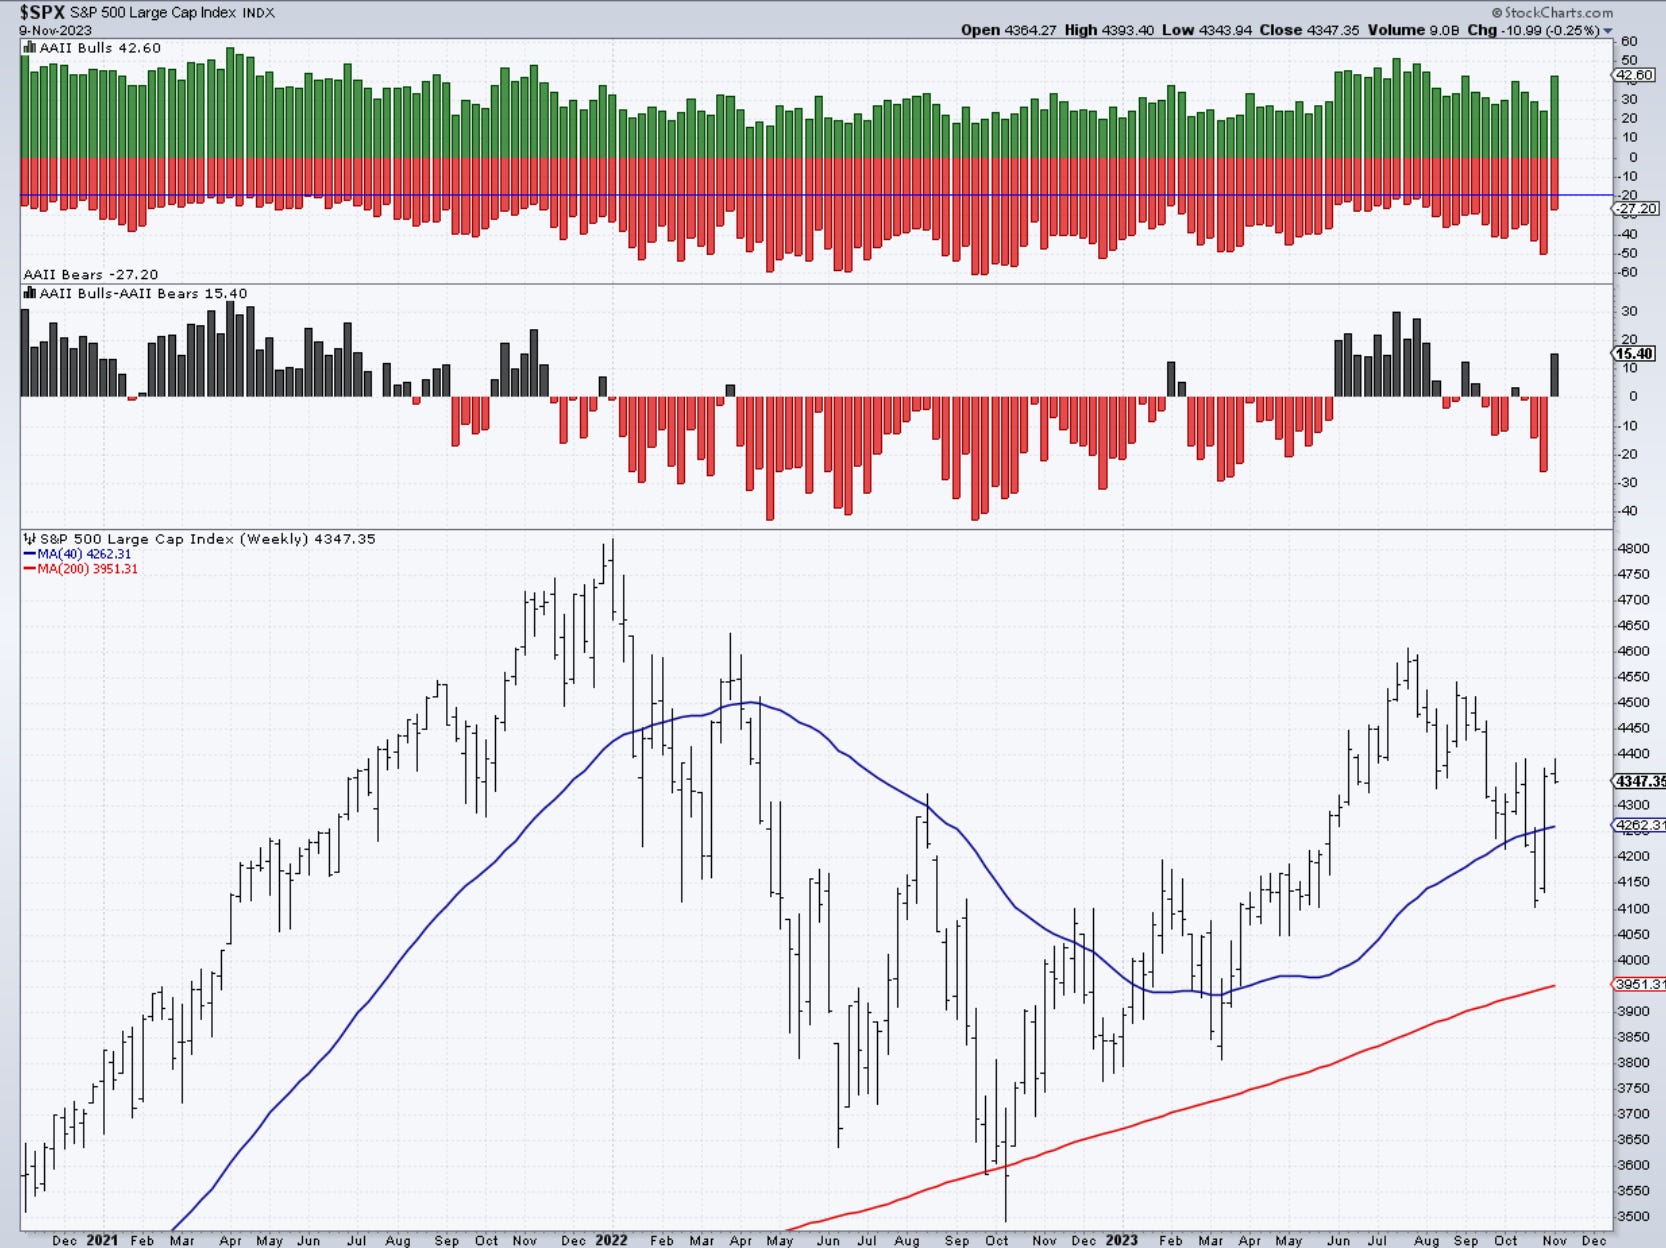
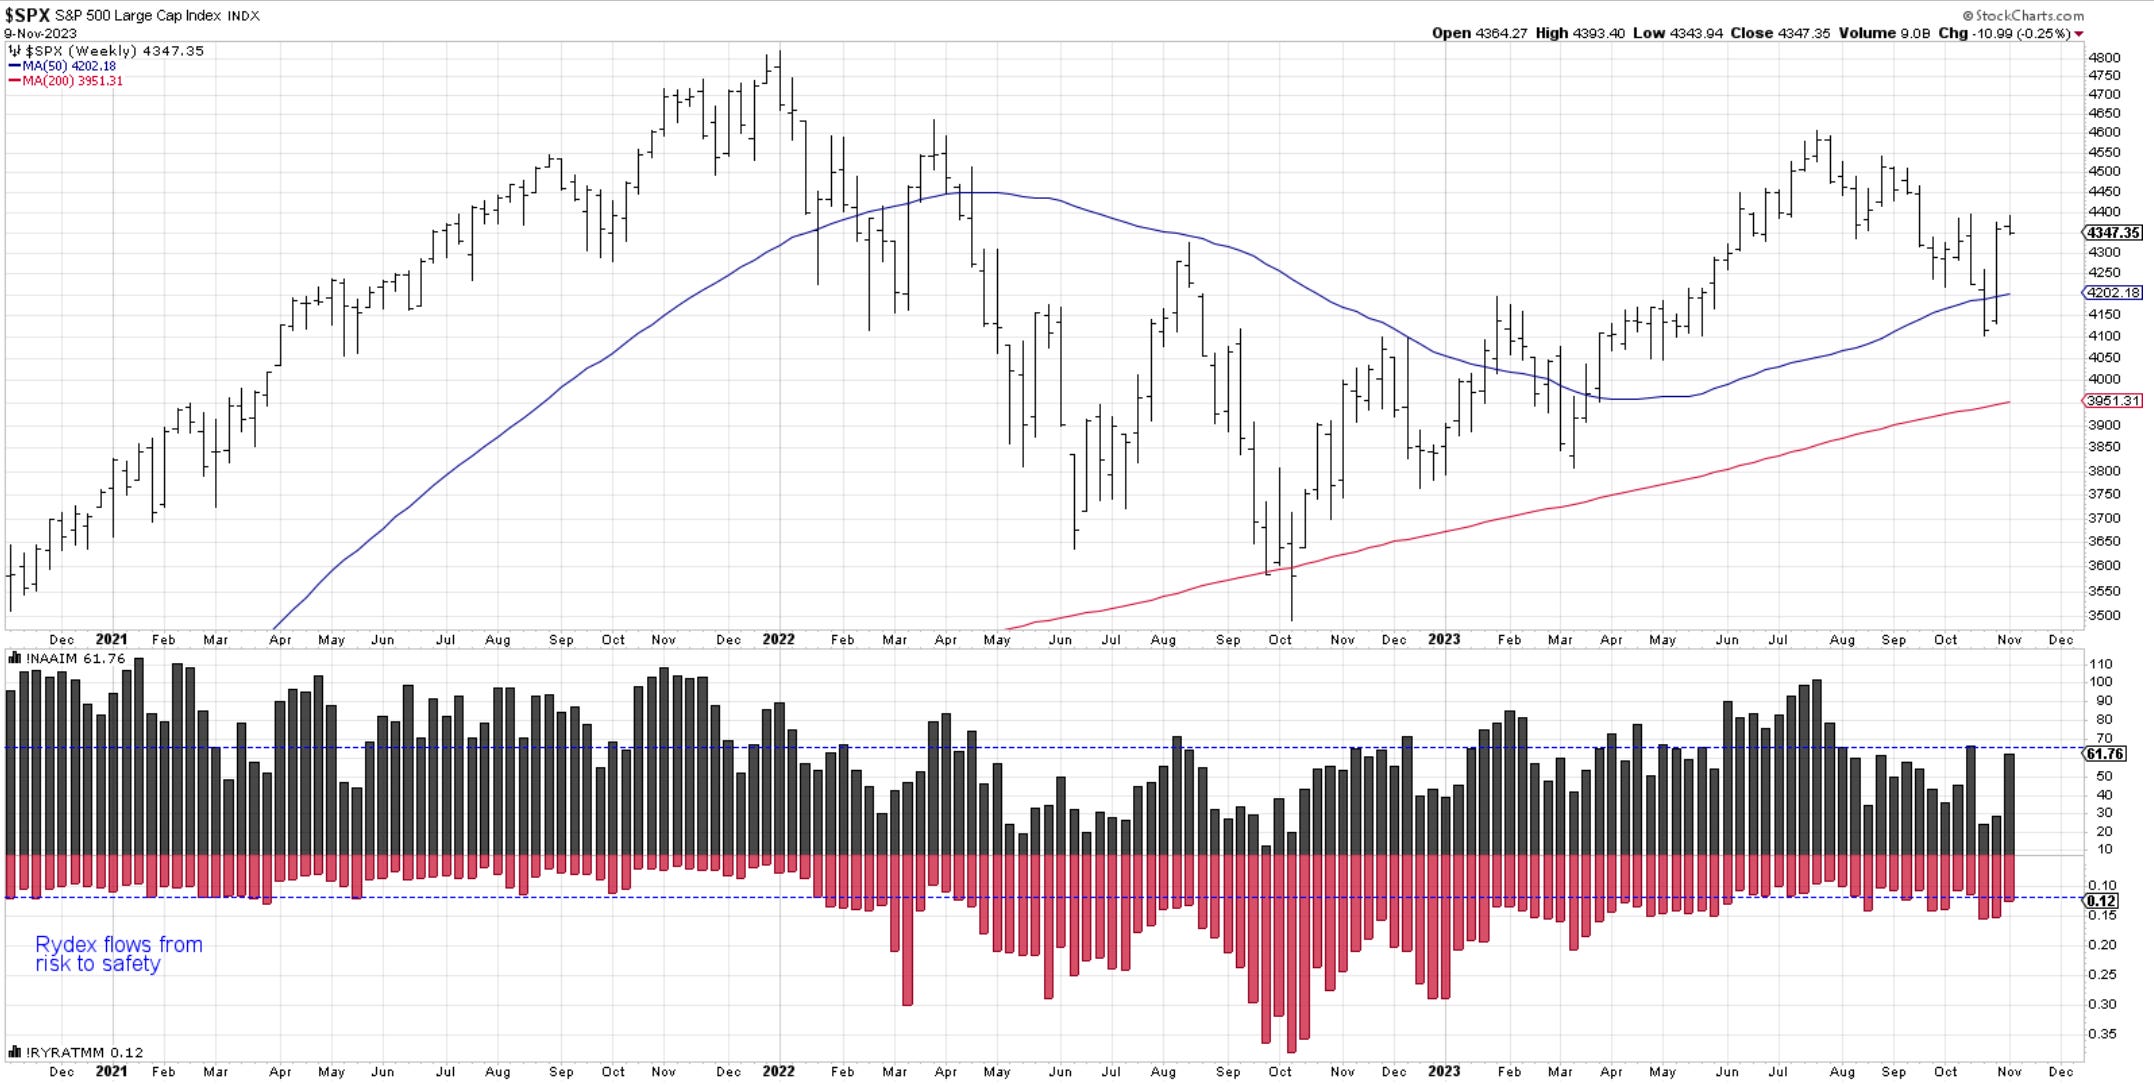
Yesterday I presented a few market internals, let’s take a look today at some sentiment charts. The two very common ones are the AAII ( American Association of Individual Investors) and NAAIM ( National Association of Active Investment Managers).
Both are displaying solid spikes over the past week as the markets rallied. Actually, AAII flipped very fast from being almost -30 negative to +15 positive, a 45% turn in the bullish direction. Investment managers have also quickly flipped from having about a 30% exposure to equity markets to 61%. The strong rally has changed quite a few minds and maybe towards a fear of not missing out on the “end-of-year rally”. But rarely are things that easy. Positioning is everything in markets. They tend to inflict the most amount of damage to most people and also tend to rally with very few people on board. Hence the shakeouts that we see over and over again. The excitement of these two cohorts of investors is telling me that we could see a period of churn and selling until positioning corrects itself a bit. That might take a couple of weeks. It seems to be in line with the proposed correction.
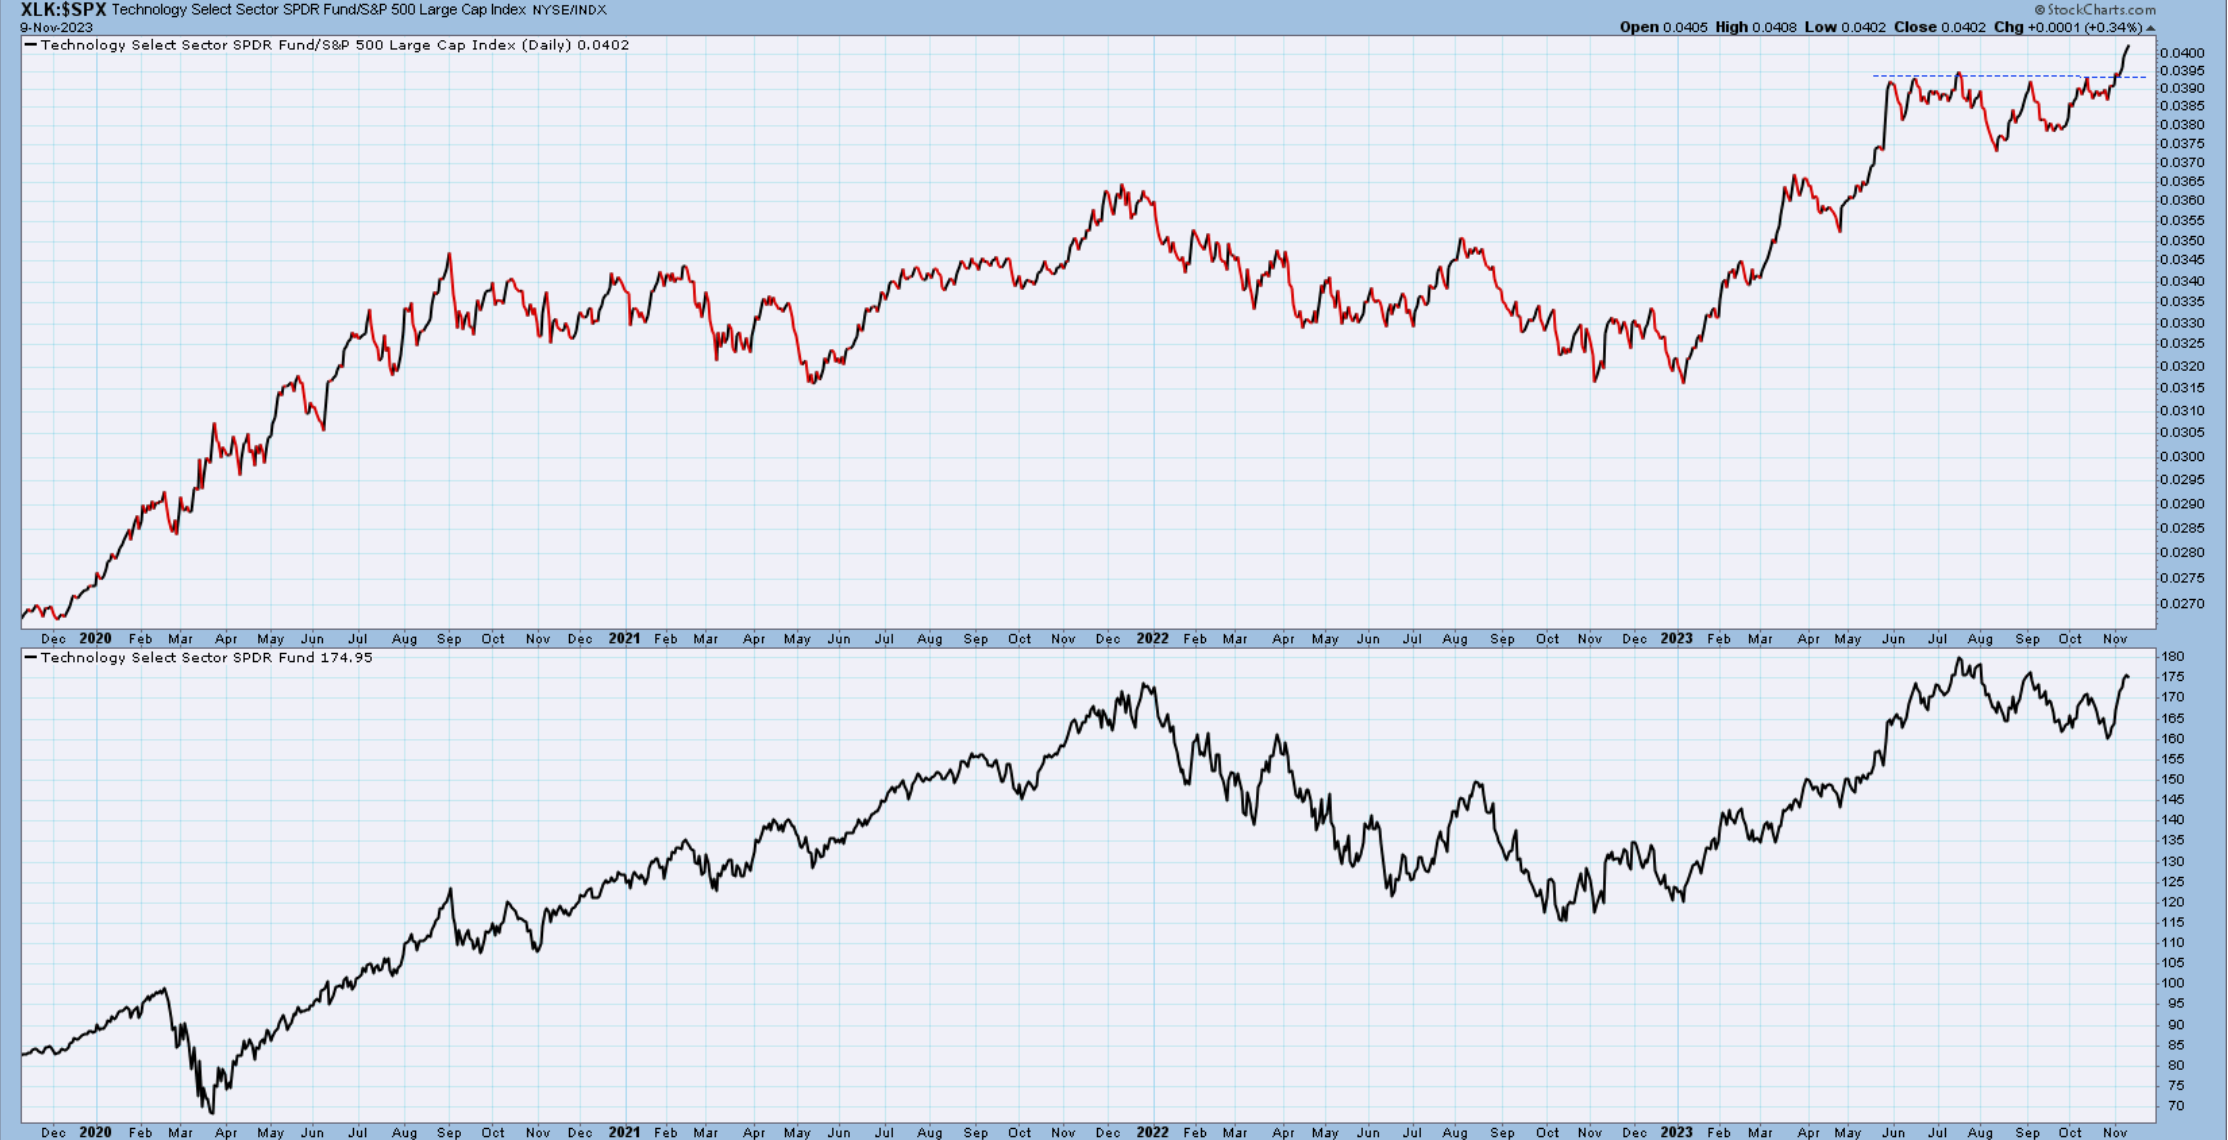
The next two charts show how the tech sector is the new staples sector. I must have heard this somewhere. Not sure if correct or not, but it is clear that on a relative basis vs the SPY , being in tech paid out and maintained performance. If you’re a money manager tied to the SP500 this is all you care about.
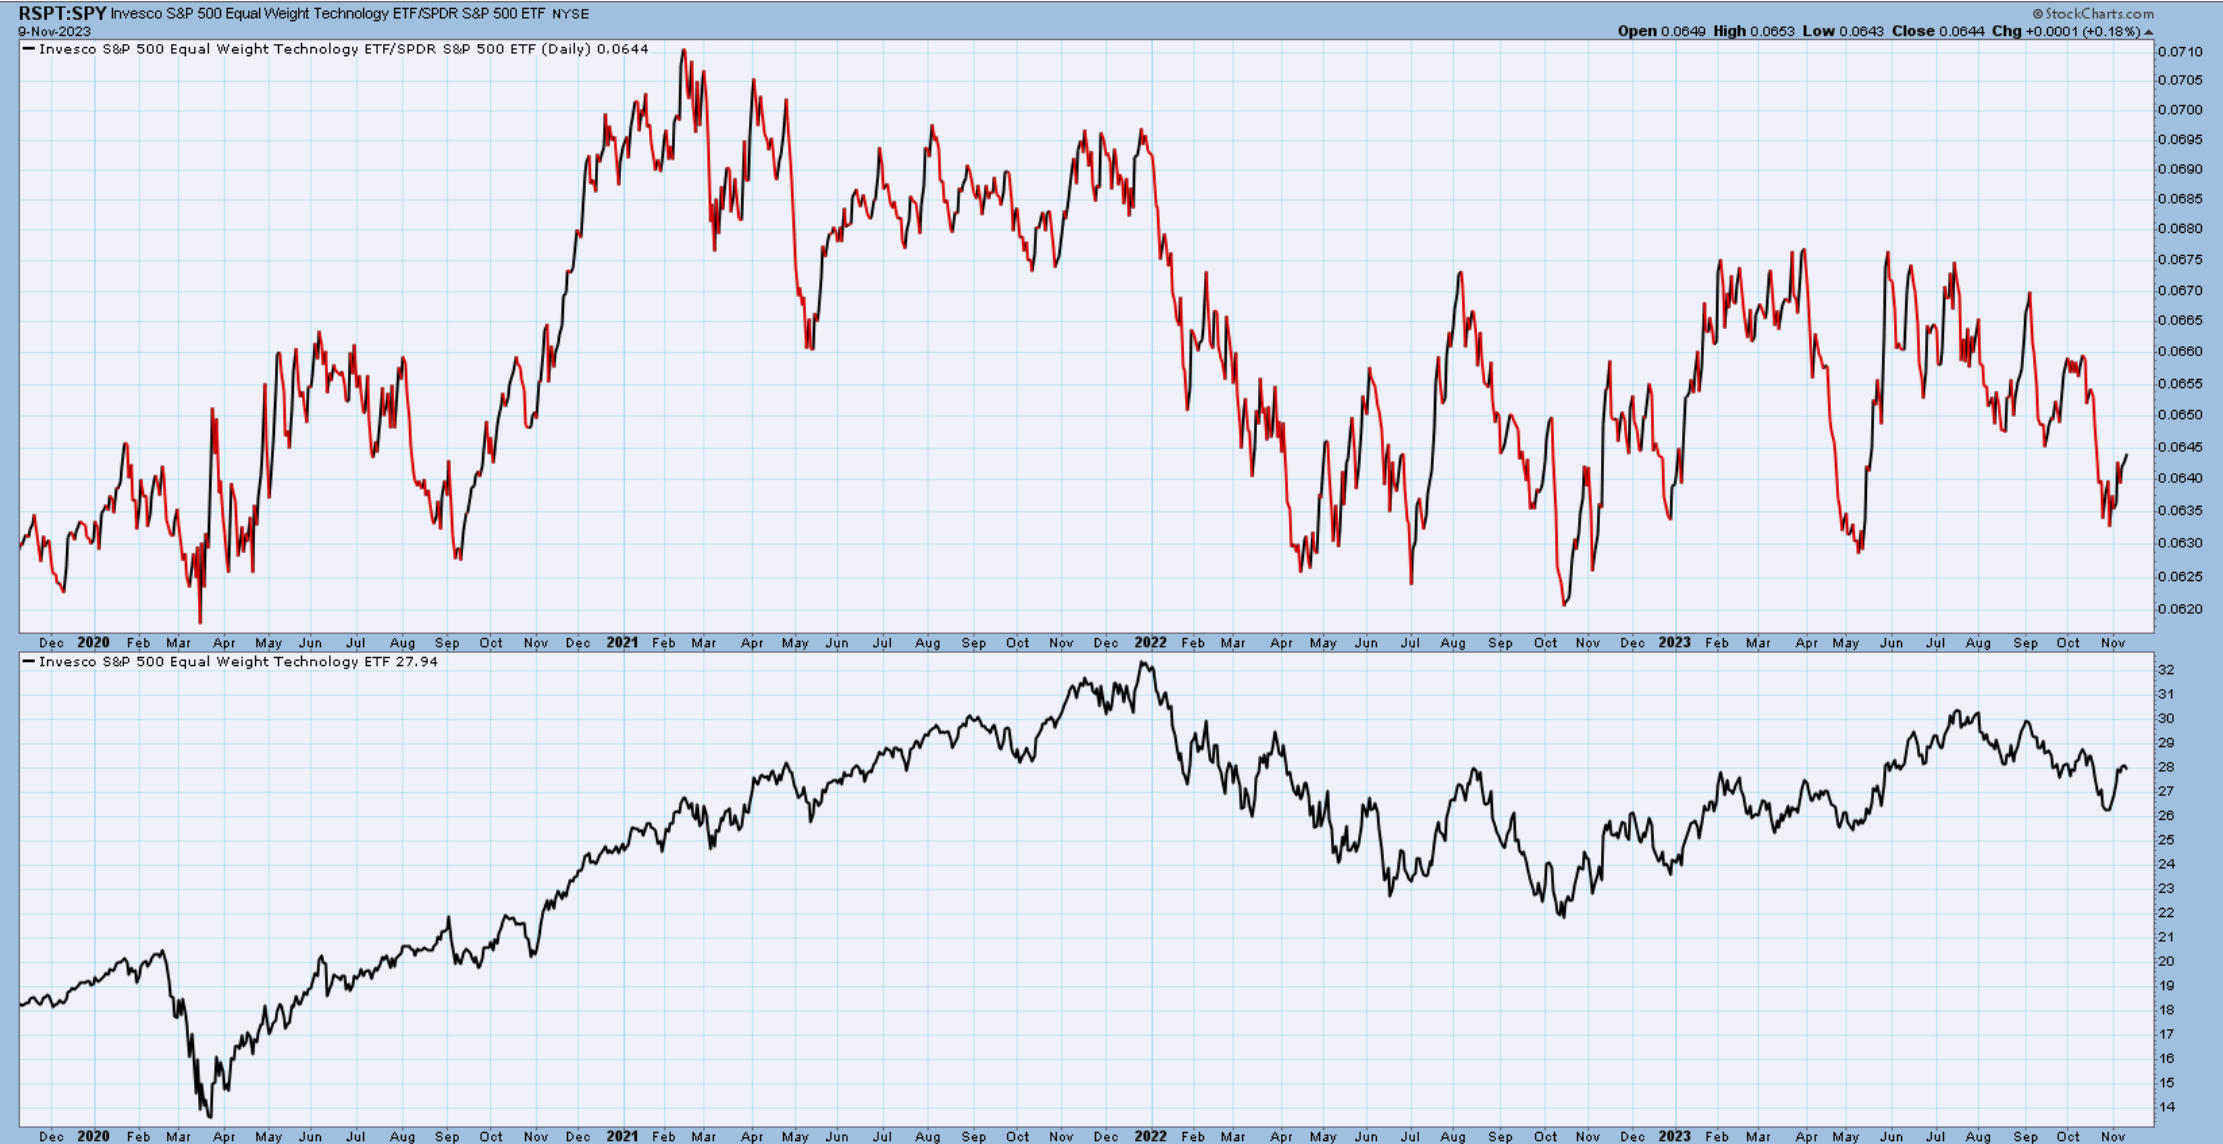
In the second chart, I show the equal weight tech sector vs the SPY. This is proof of how a very few large tech stocks make the difference in performance and where people are hiding and who are they trusting to get them thru tough times.
Nasdaq100
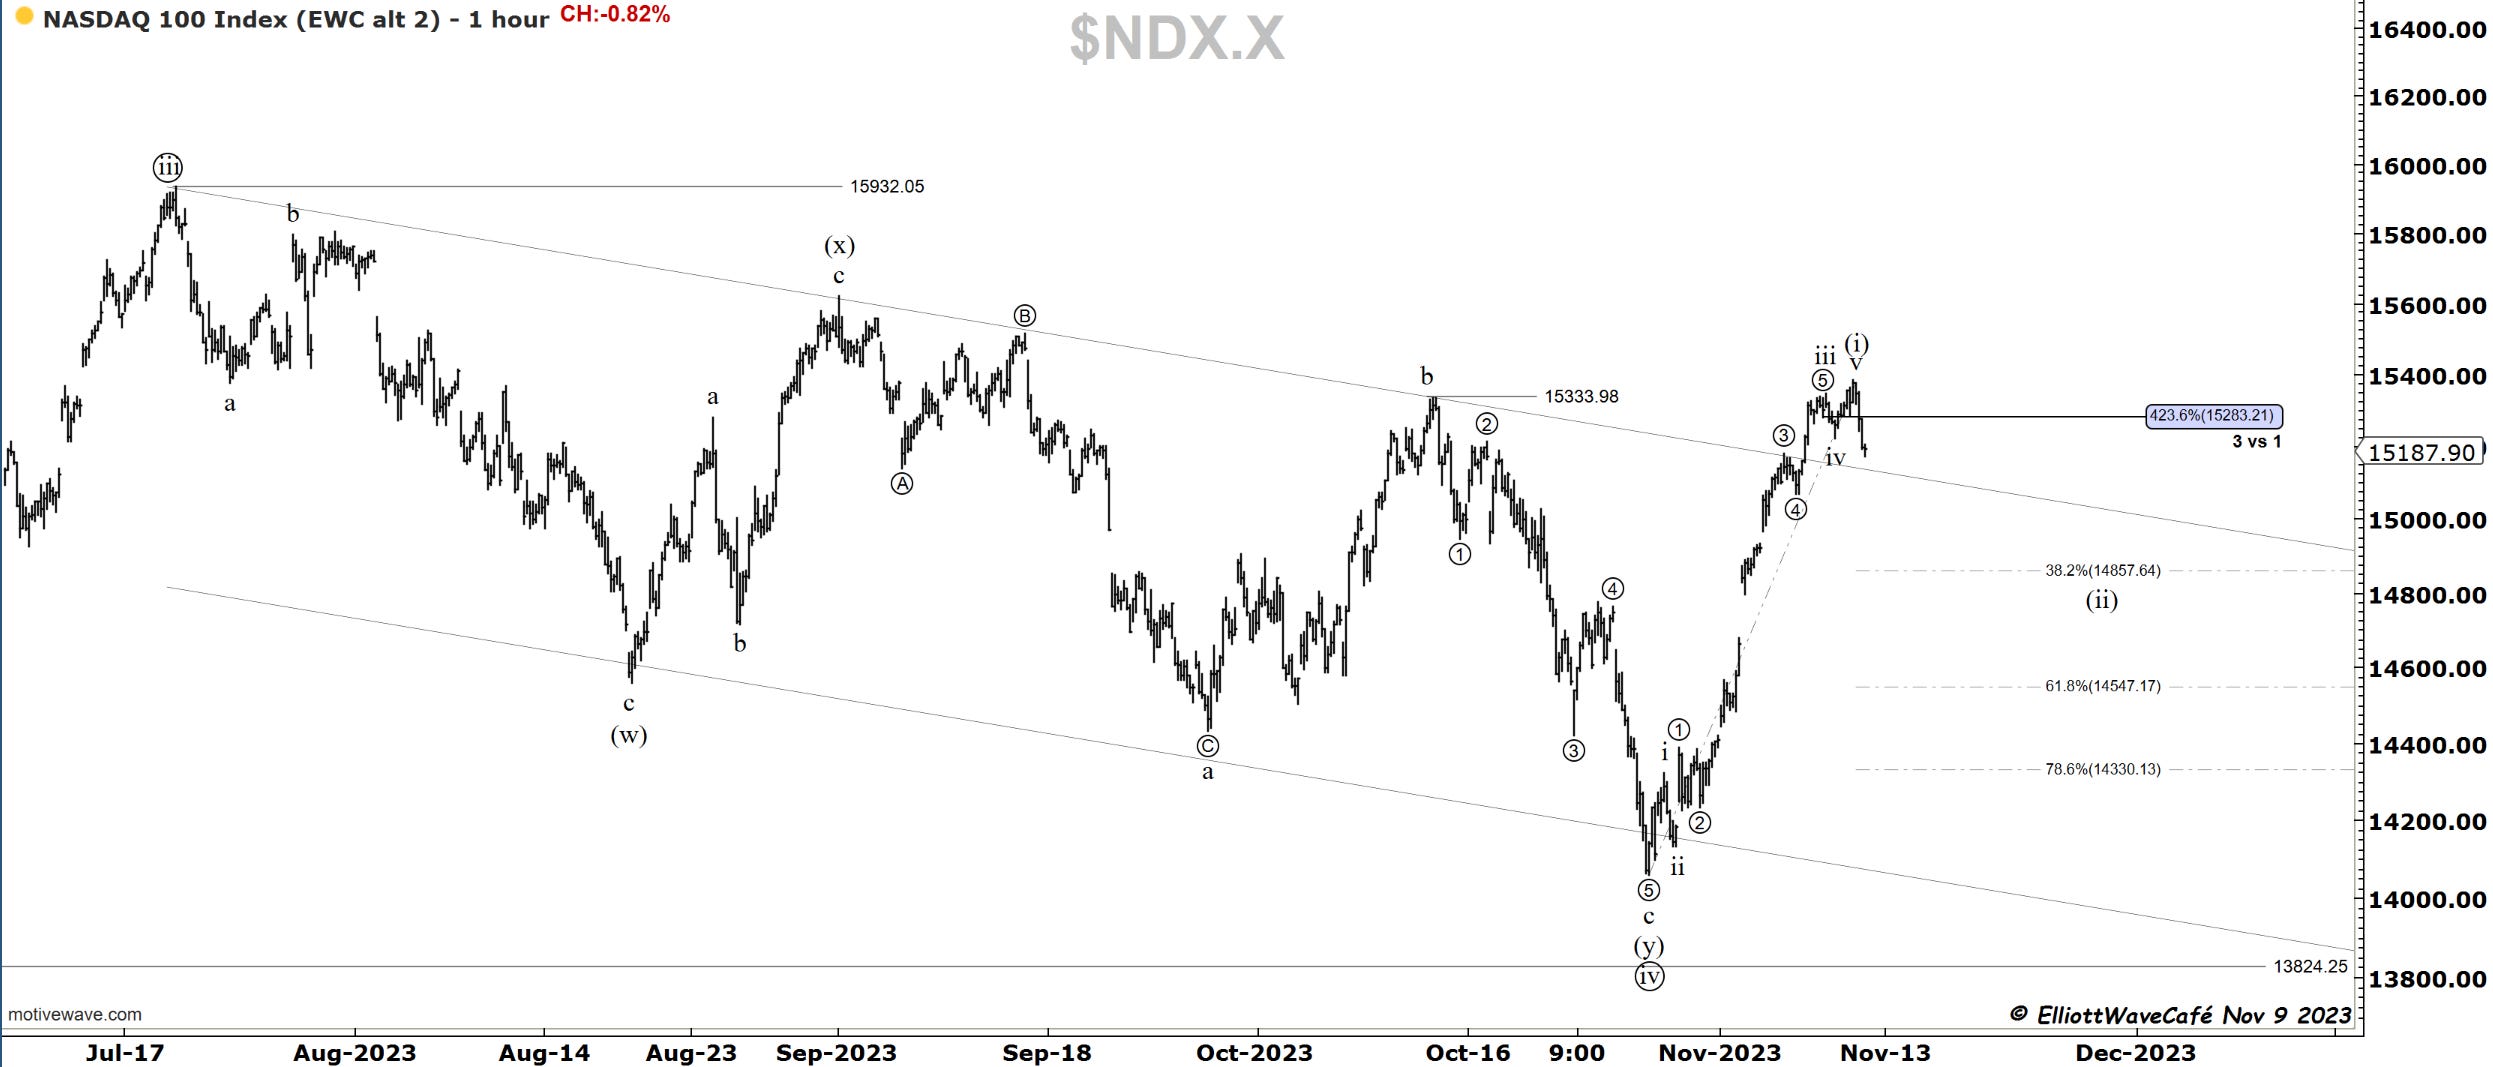
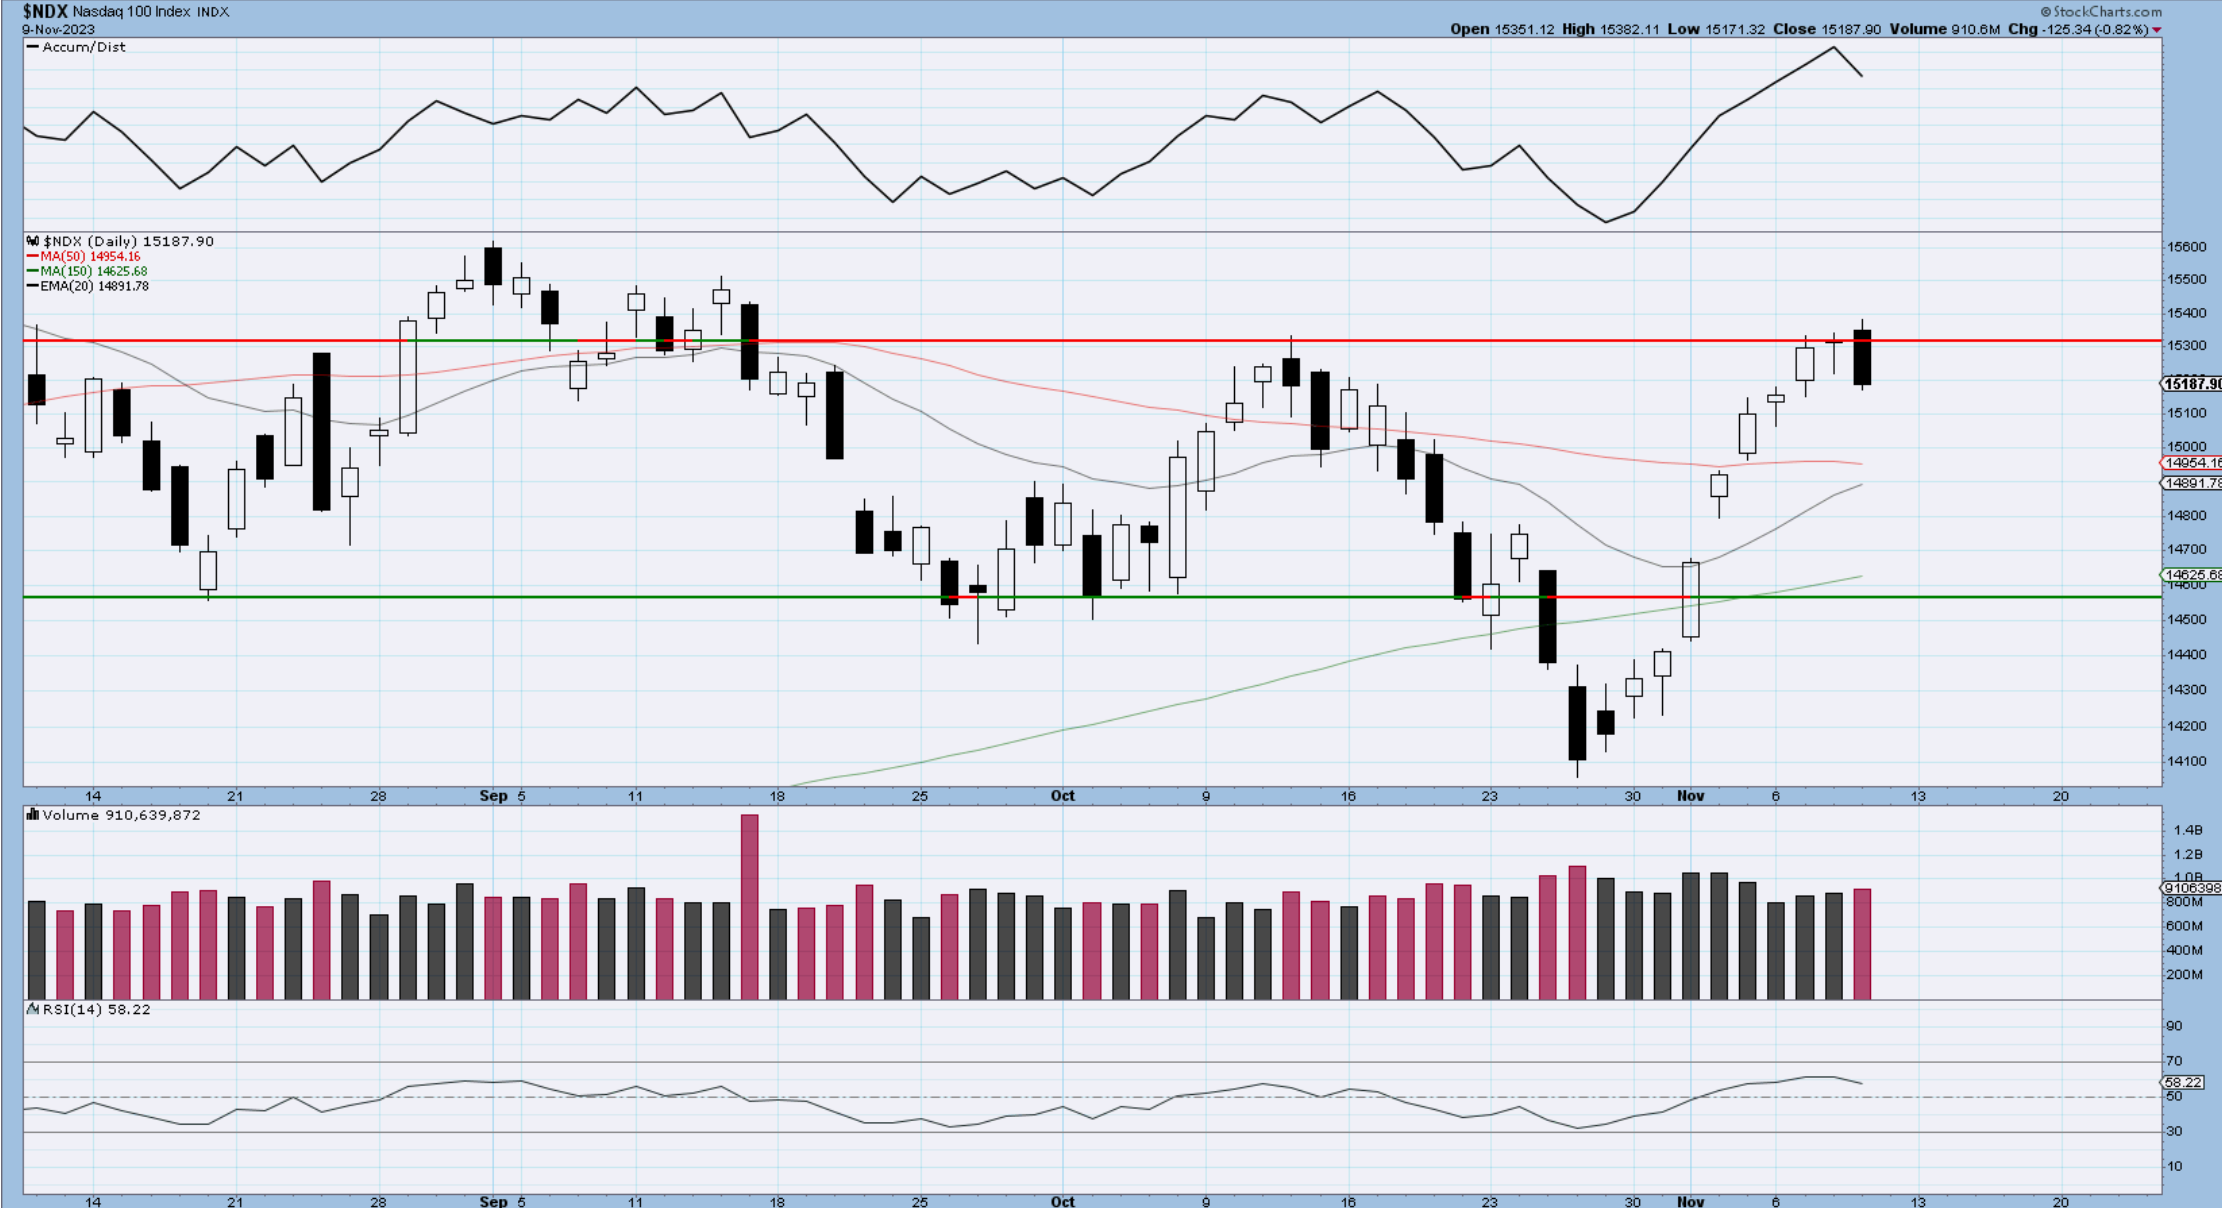
After another marginal new high, the index dropped -0.82%. By my measurement, that wave iii traveled 423.6% multiple of wave i. Talk about an extension. There is a wild chance of a flat in iv still happening, I doubt it tho. If a correction has started, it needs not only price movement based on percentages or fibs, but also time movement. A basic 38.2 would take us towards 14,857 initially.
In the second chart, we discussed the doji candle yesterday. A brief thrust higher created a trap, followed by the selloff. The 3 candle formation at the top looks like an “evening star” a reversal pattern in the Japanese candlestick world. Coming from resistance adds significance. Let’s see if we have follow thru. There is a cluster of moving averages below that stand ready to offer demand on attack.
RUSSELL 2000
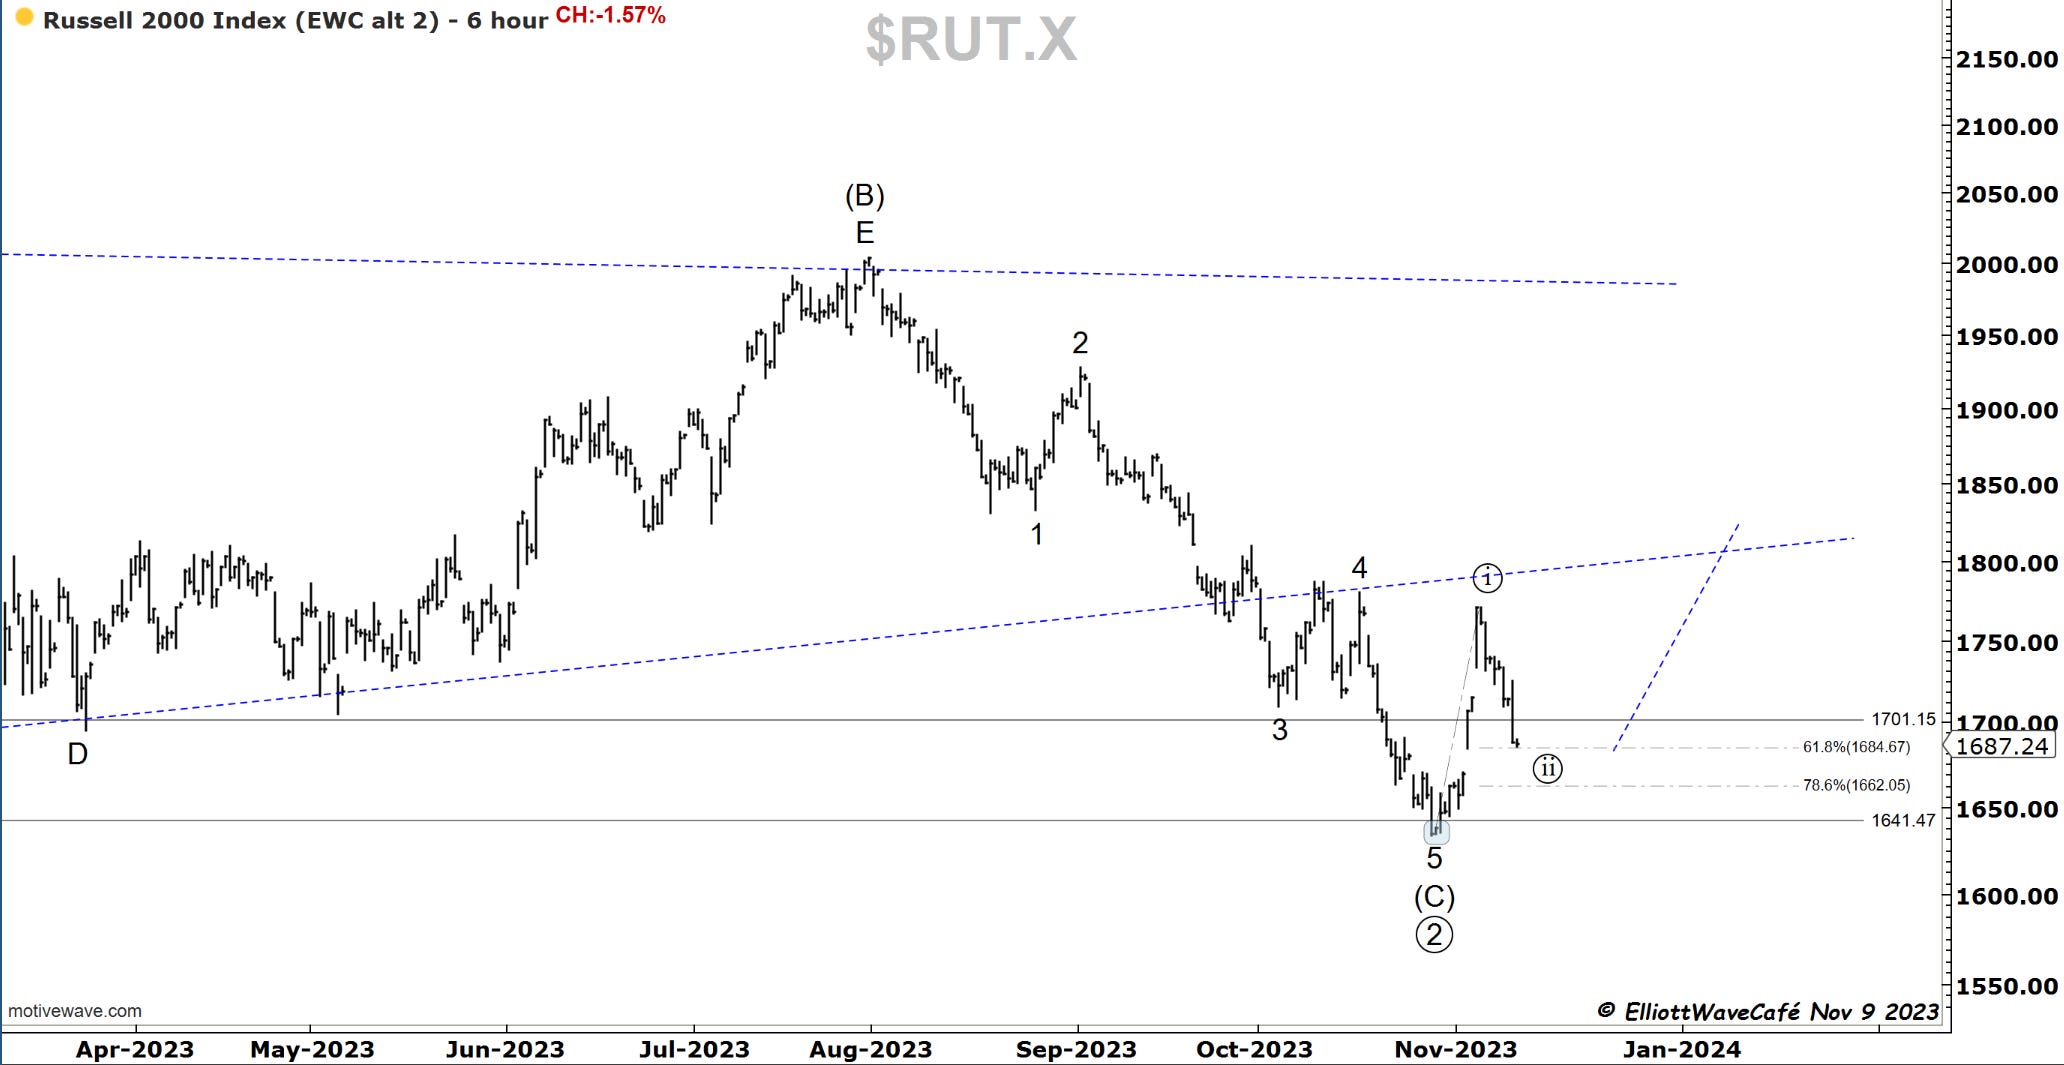
If the drop was a wave ((ii)) we would likely hold here at these levels. Even a B wave would get the same reaction which is upwards. The problem comes with how we reconcile this with the signals from the other indices which suggest further selloffs. The look of the pattern does not inspire confidence so I will be a watcher of this index at this time. If we break .786, chances are we continue lower in this index. I do expect a bit of stabilization in the near term. Maybe after that gap is closed. Then we will revisit.

Dow30
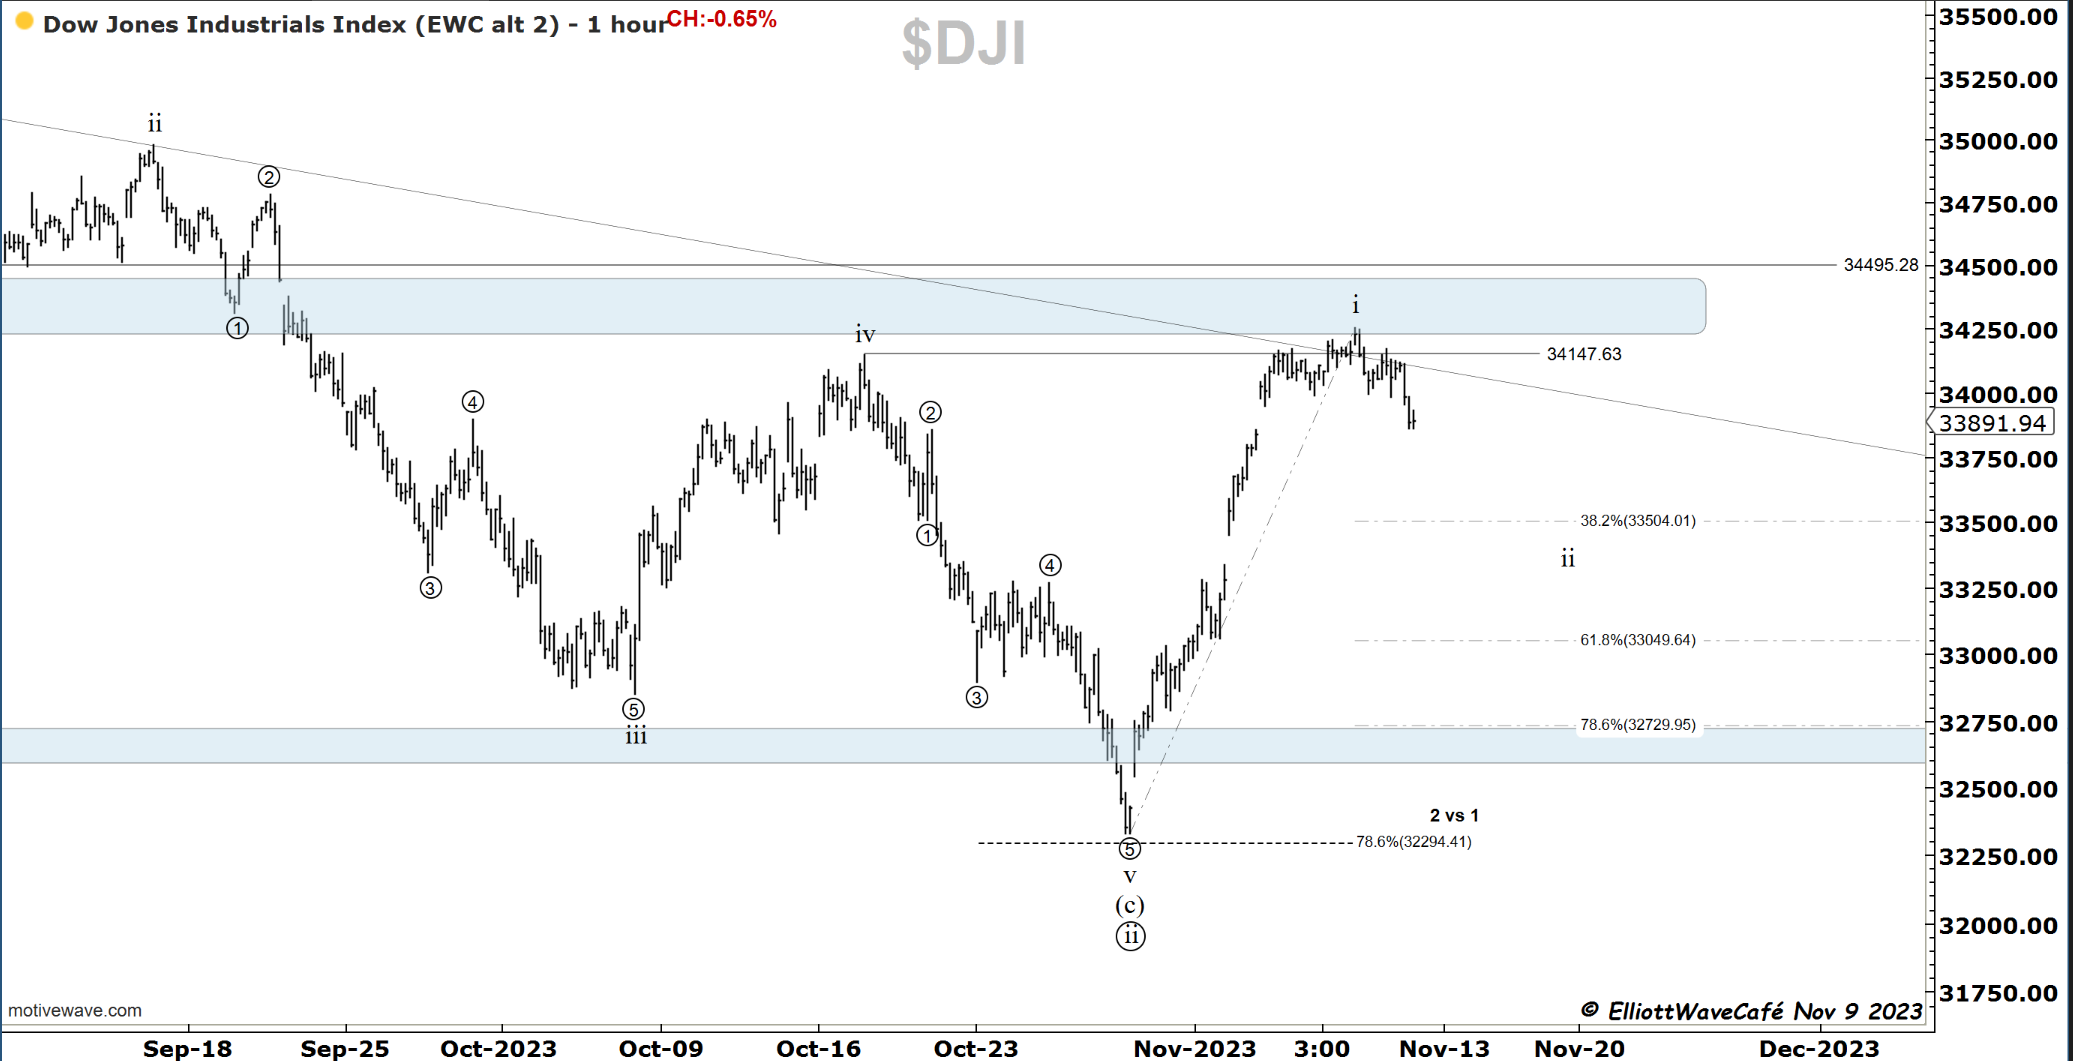
In line with the indices, DJI has lost some ground as well. A wave ii correction is unfolding and will target the fib levels below. I am not concerned with how we get there. That’s for the market to figure out. We will follow the map based on EW patterns.
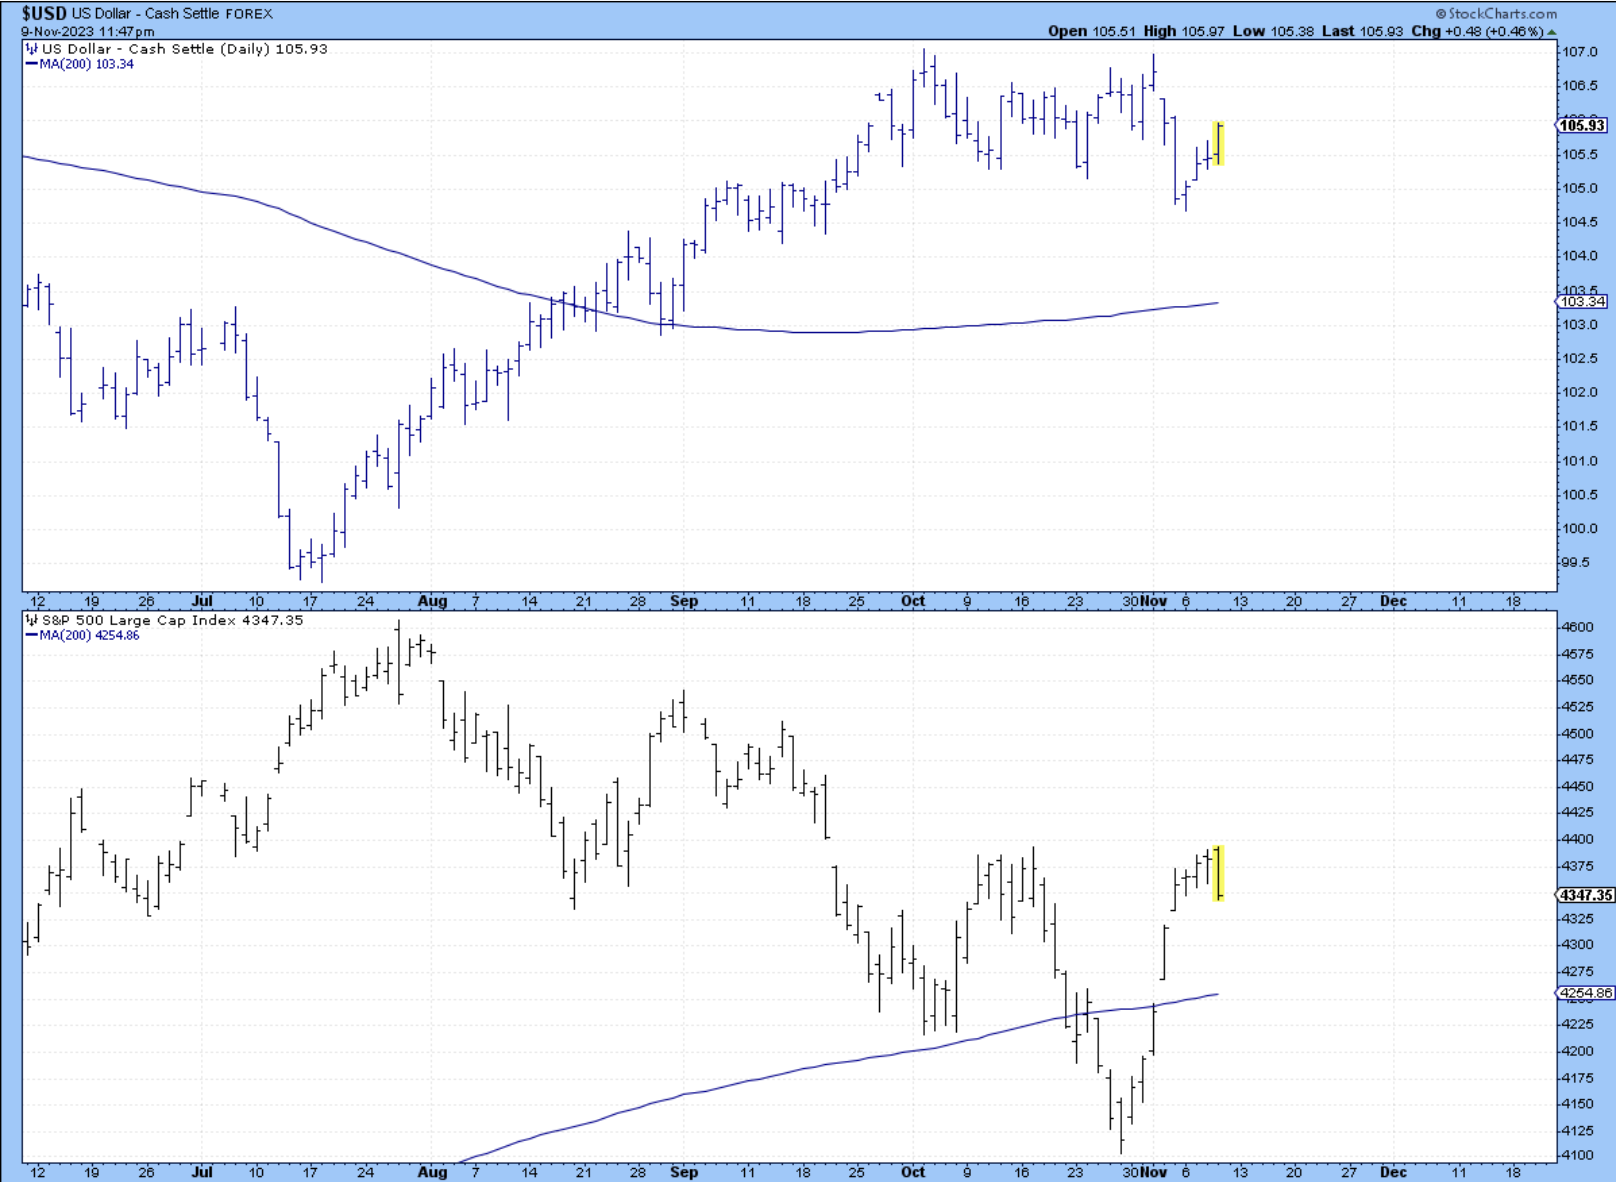
US Dollar and Yields
The more I stare at the dollar pattern from the highs, the more I get the sense of a corrective pattern. Besides that drop below 105, it has done nothing to convince me that an impulse is underway. If it’s a 1,2 1,2 from the highs that we must drop immediately. If we don’t, then the odds of a break above 107 are seriously increasing.
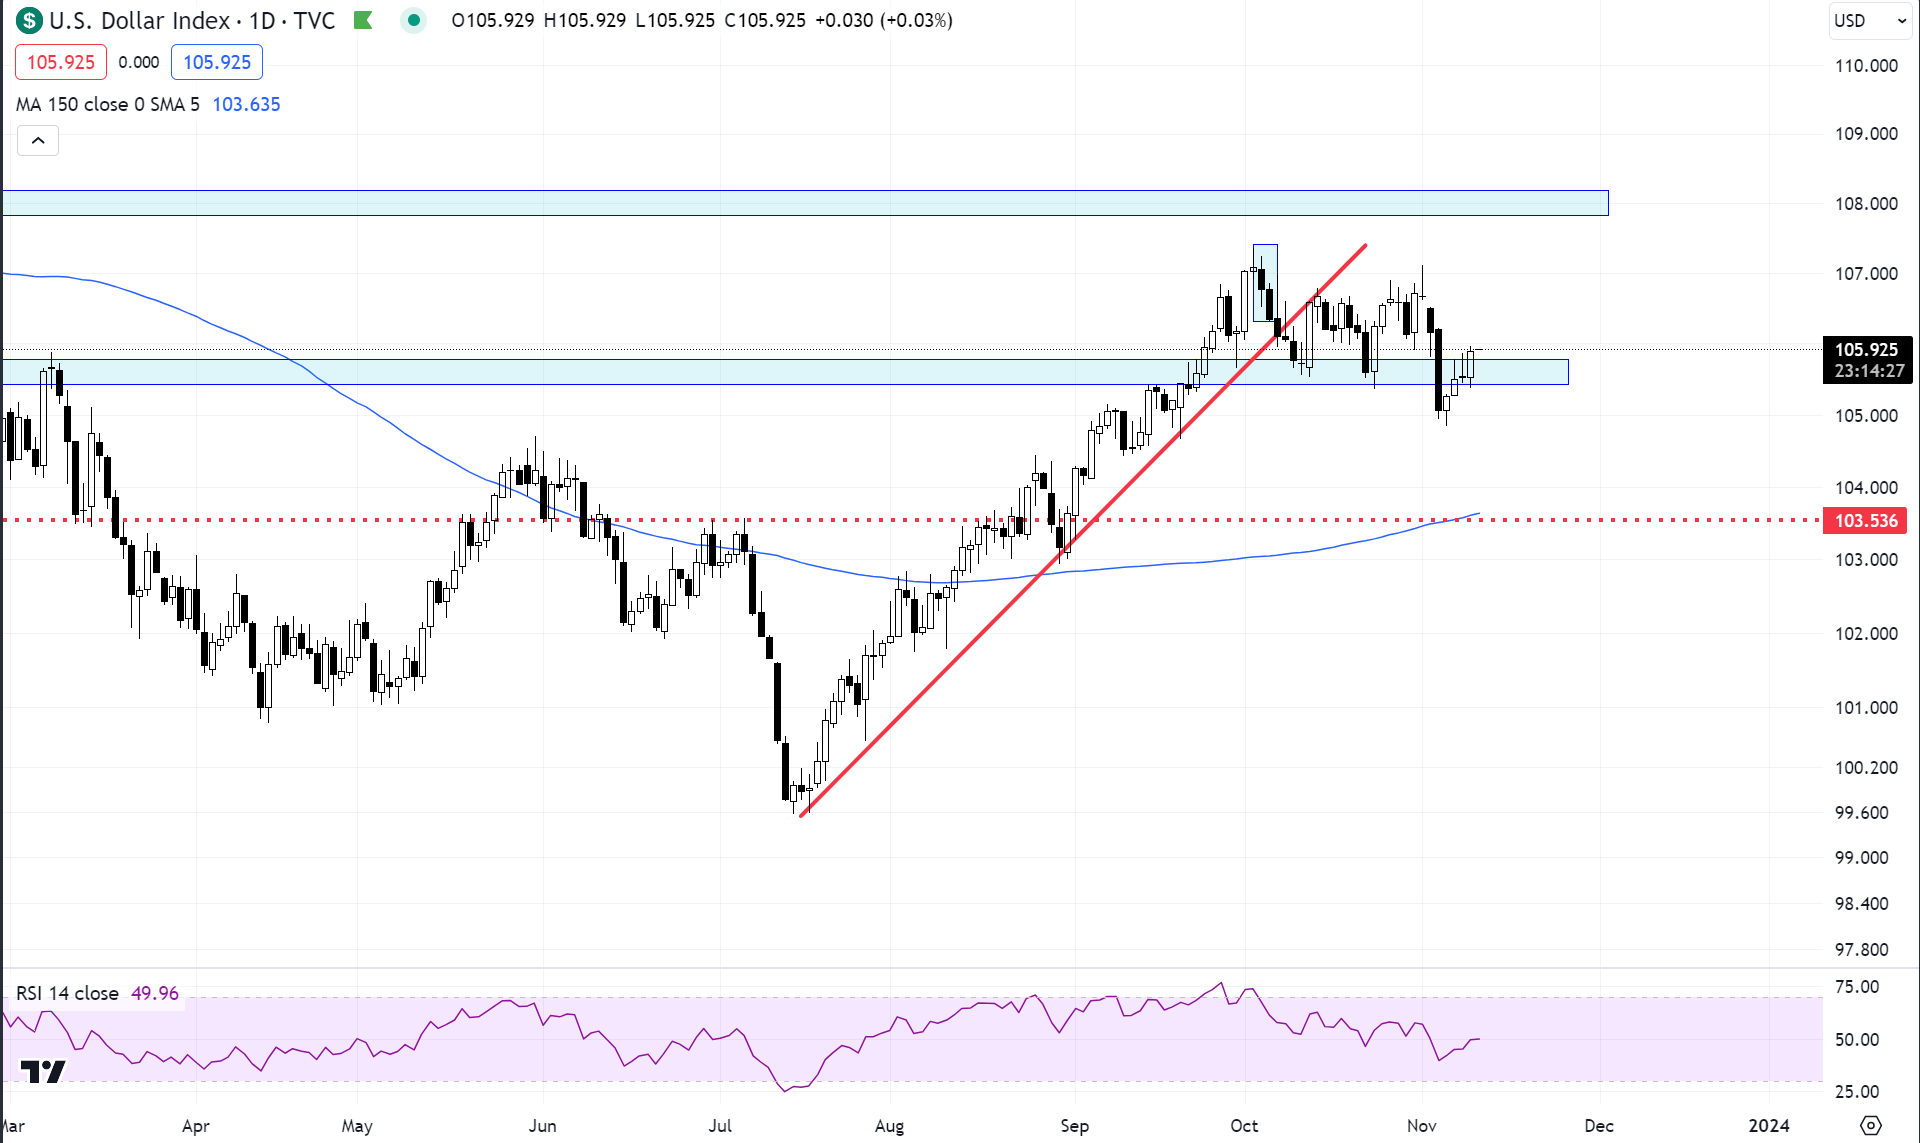
That dollar strength, while SPX was inching higher, was a decent clue that stocks are on thin air.
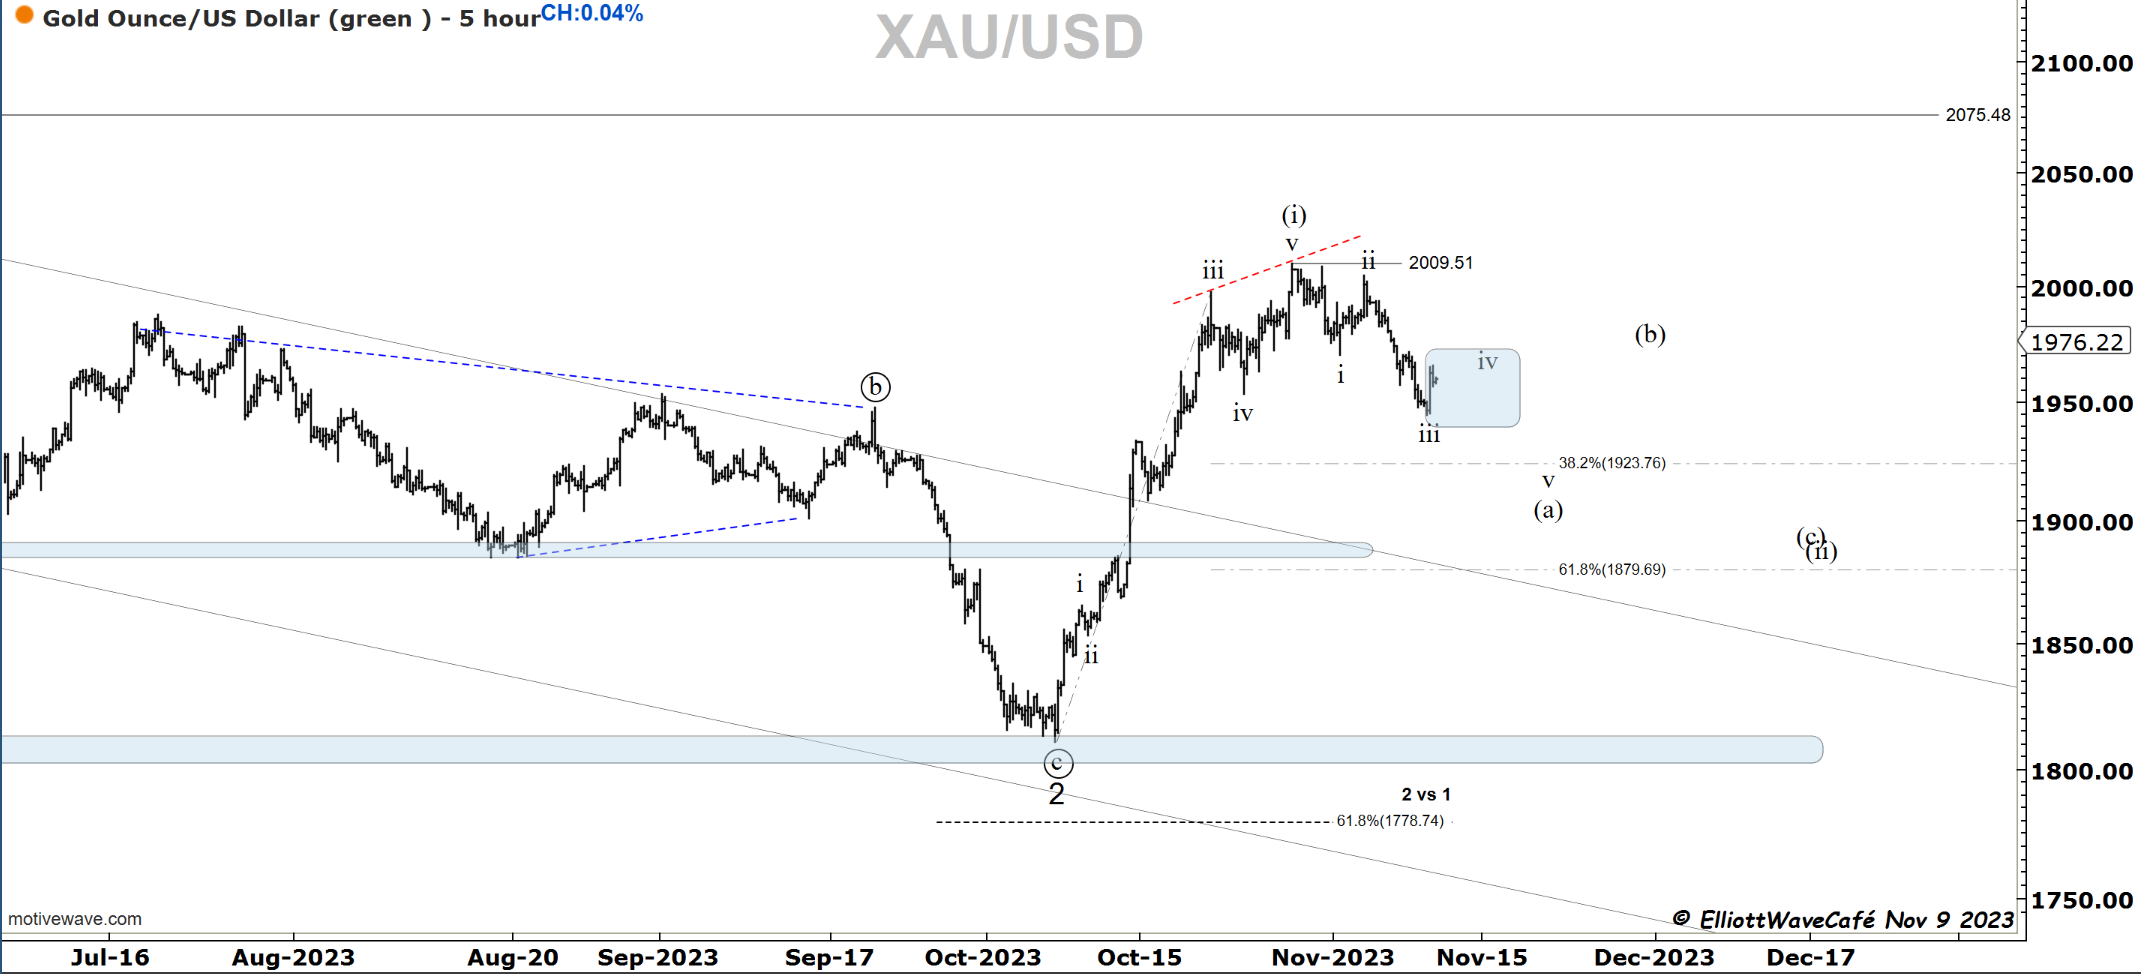
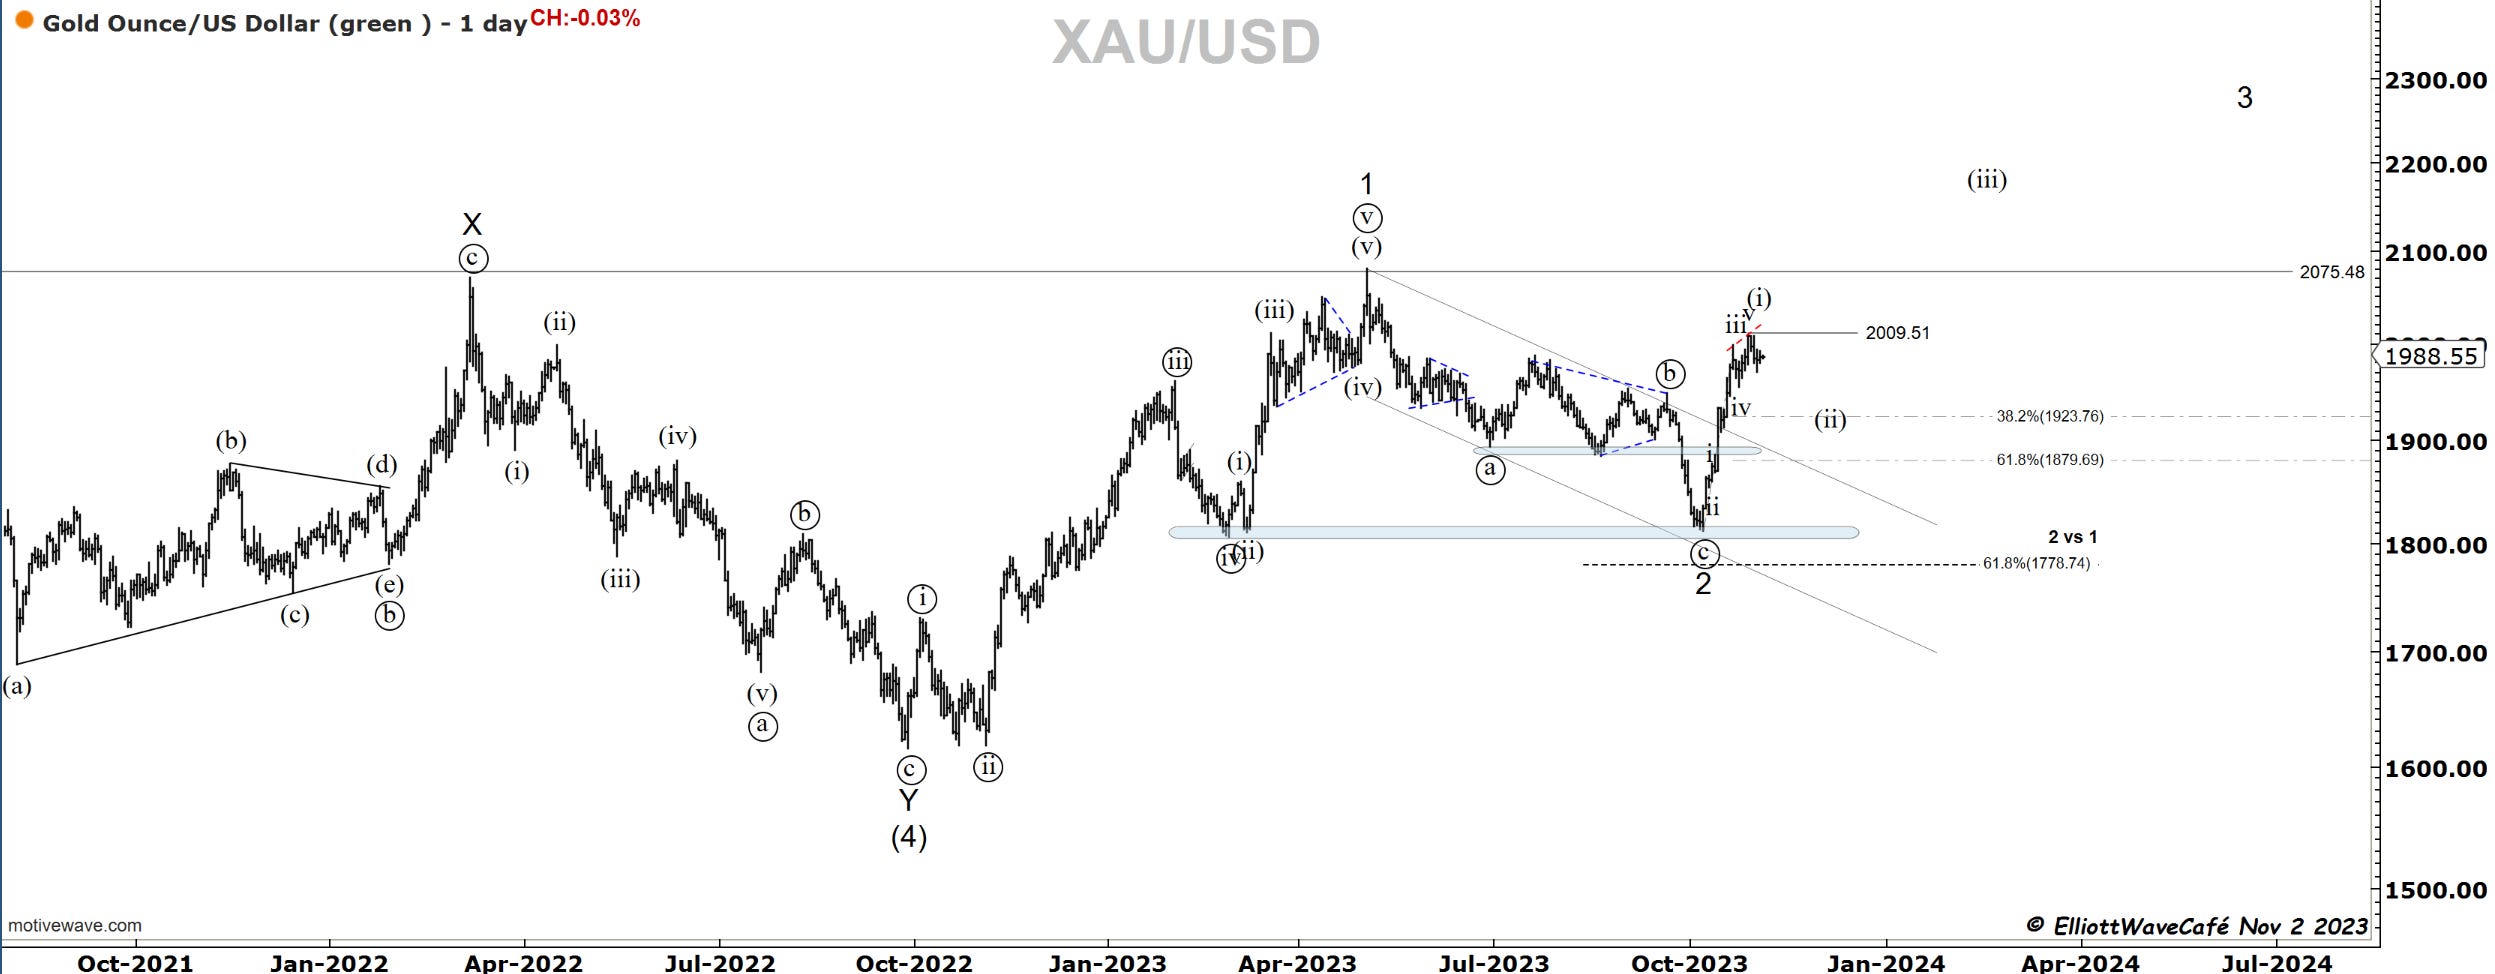
Gold
I would not blame anyone if they were looking for a wave iv here in gold. It seems appropriate. I think the larger correction still has some room to play out.
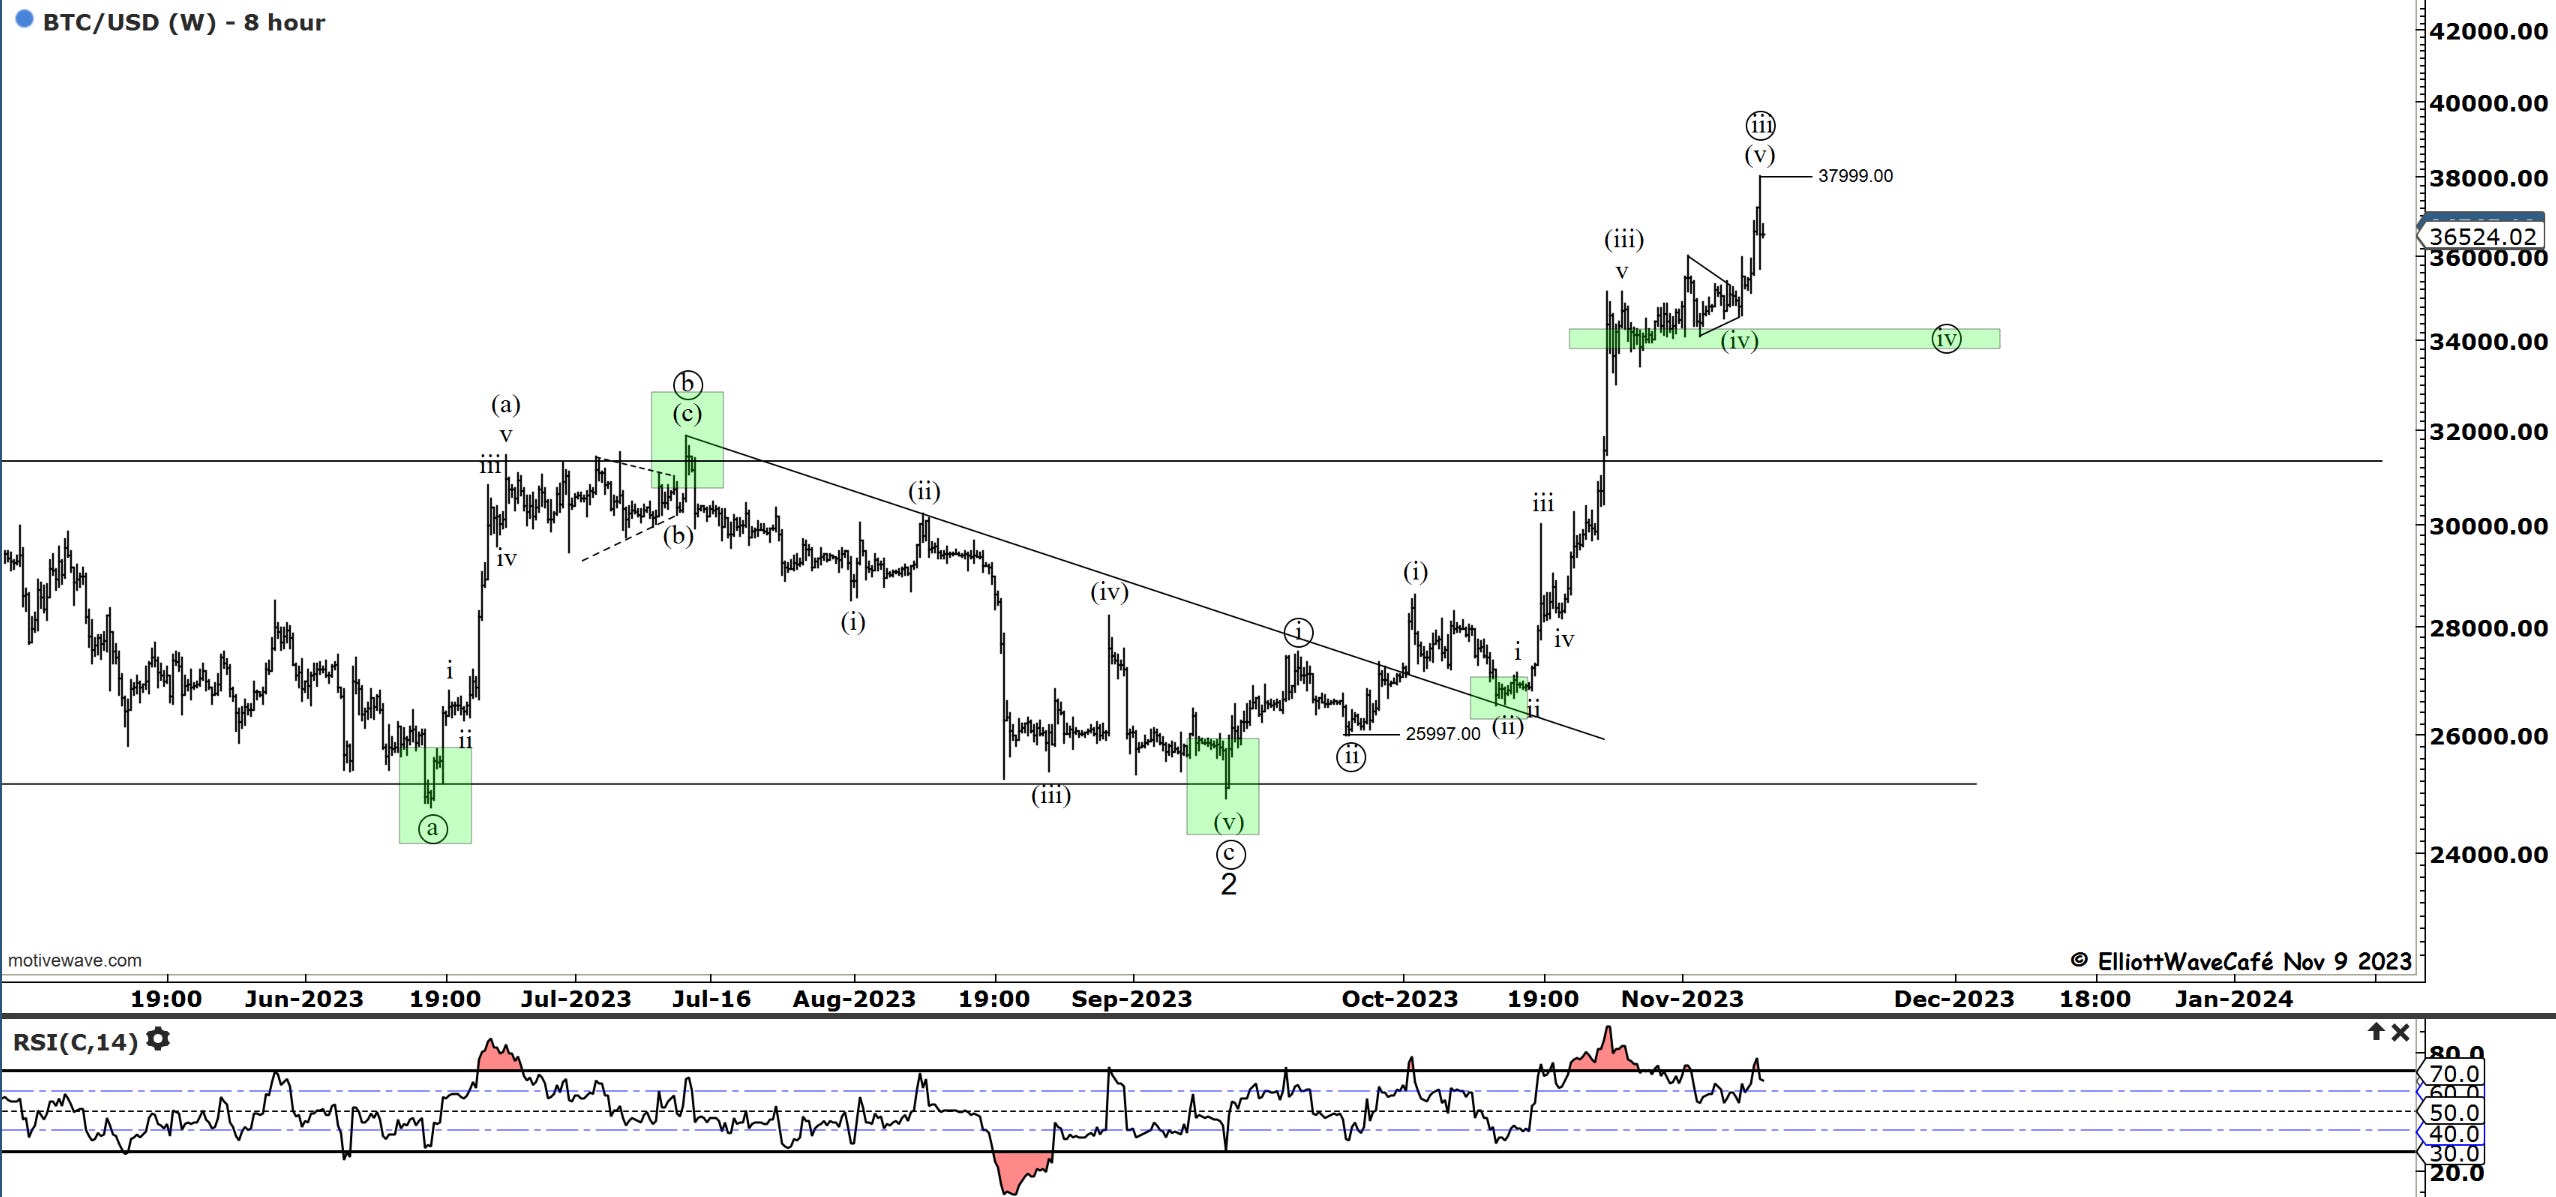
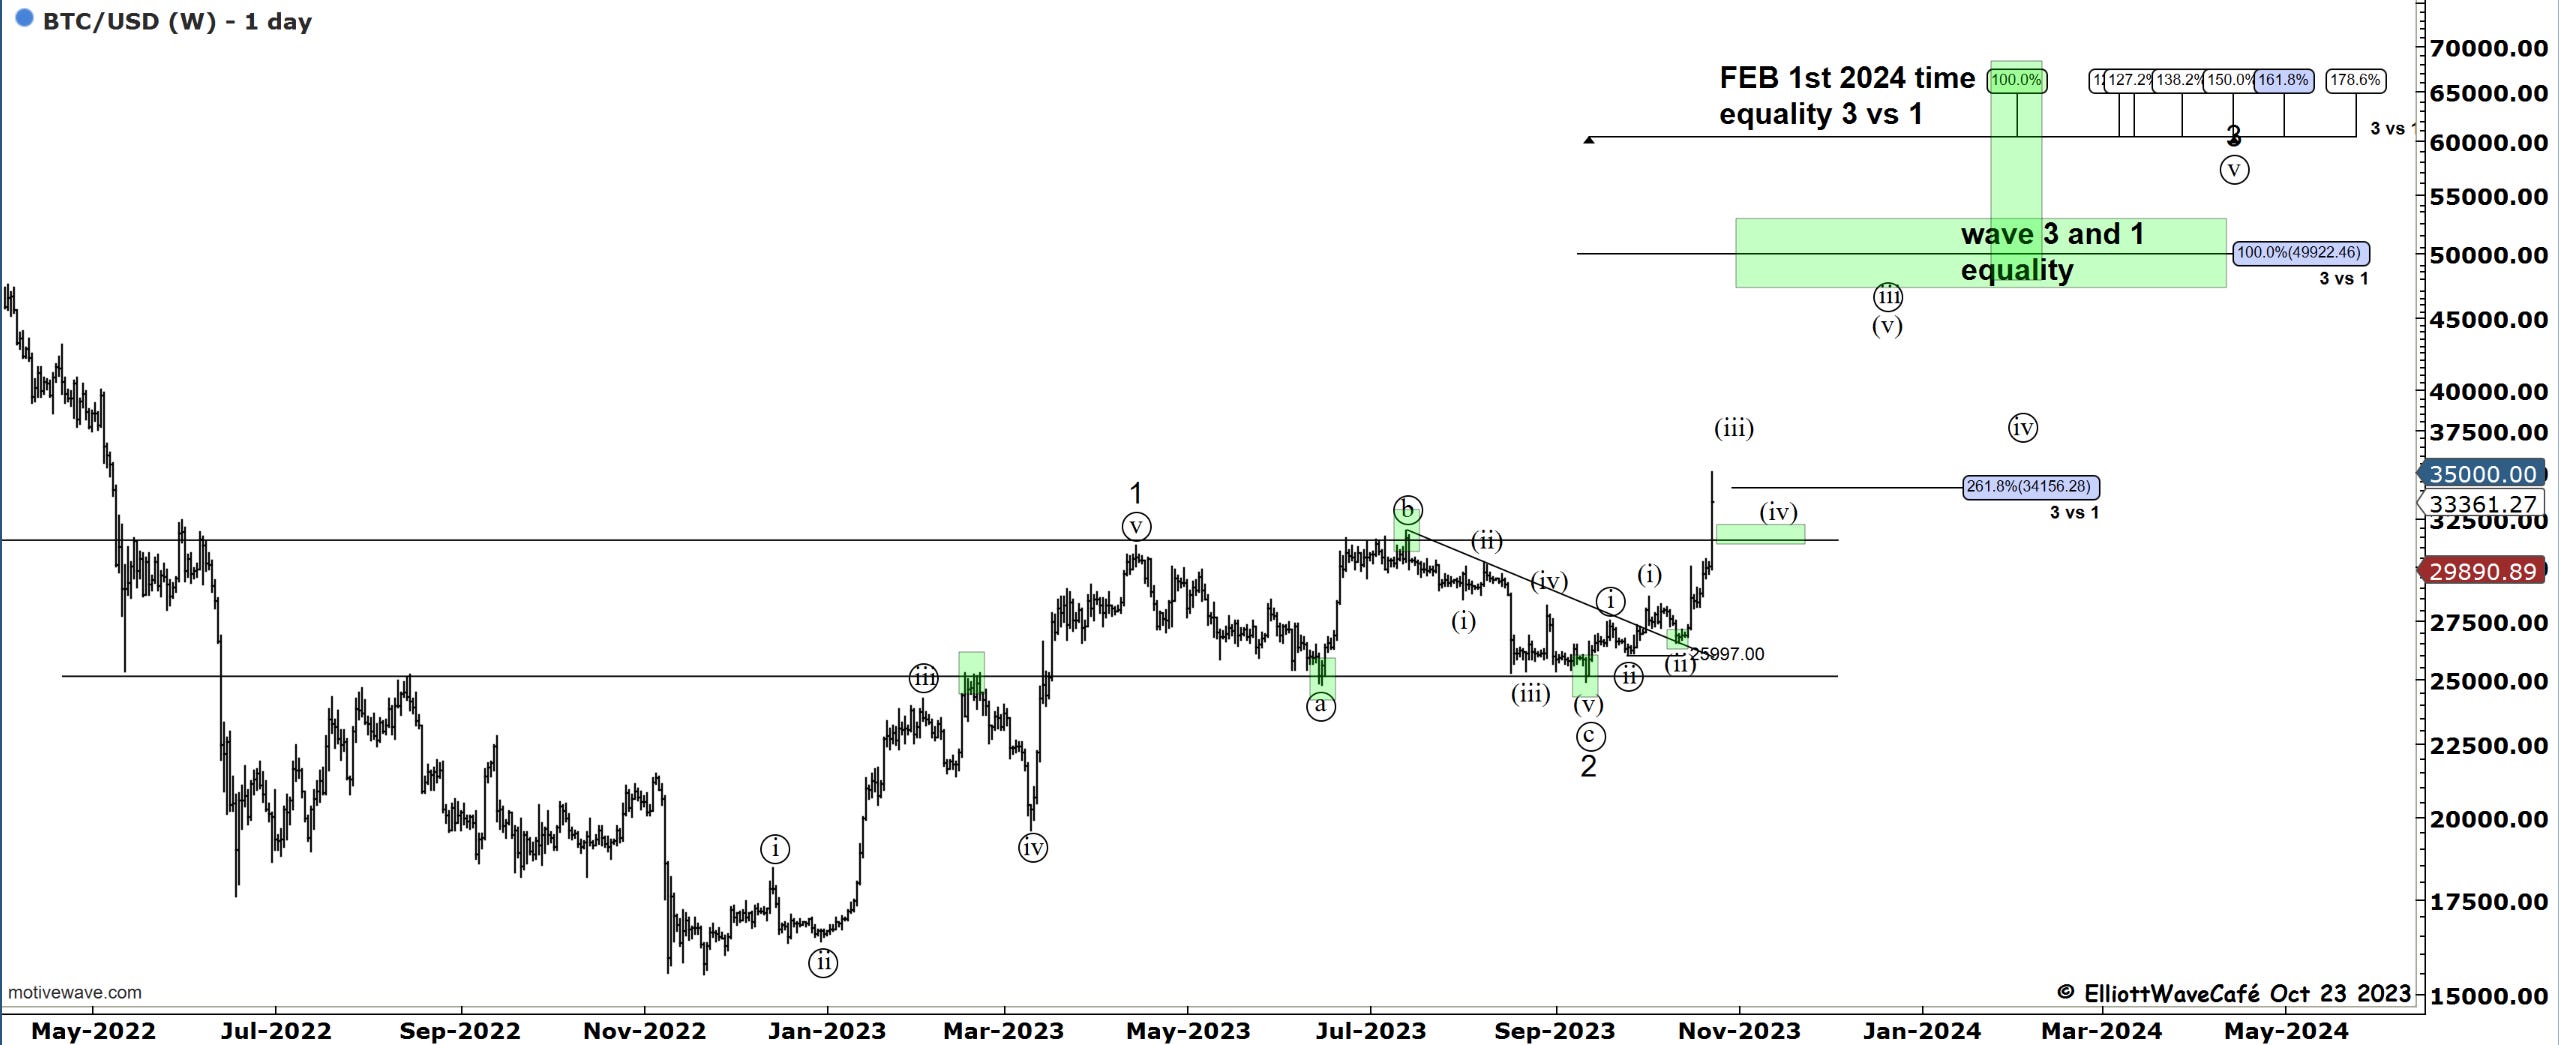
Bitcoin
Out of that sideways pattern that BTC has been building for the past 3 weeks, we got a thrust higher earlier today with prices reaching 38k. My calls for a lower 4th wave buildup were wrong. Inspecting the chart after this higher thrust and looking at the wave proportions I think I can assign the wave (iv) that I was expecting to further develop, at the end of a running triangle and call it complete. The RSI is still diverging suggesting that the thrust was a wave (v). Some of the excitement in social media and posts about the crypto market confirm this thesis. This morning it felt like everyone wanted to get in on the action. I don’t think the larger bullish story is over but it should fall once again into the webs of a wave ((iv)) at the higher degree. Support comes at previous wave (iv) lows. Let’s see what happens over the weekend. Maybe I show up for the Monday piece and BTC is trading at 50k making me look totally foolish. It wouldn’t be the first time. It’s not like we’re trying to read the future.
Daily video coming up next,
Have a great weekend all! - trade well and don’t forget to subscribe and drop a like if this letter helps you in any way.
email: ewcafe@pm.me
GREAT work Sir, every day 💯❤🙏 thank you very very much ❤💪
I enjoy reading the daily drip. thank you for your work.