
The Daily Drip
Core markets charts updates and commentary
Note: The counts on the right edge are real-time, and they are prone to adjustments as price action develops. Elliott Wave has a fluid approach, is evidence-based, and requires constant monitoring of certain thresholds.
In the counts below, this (( )) = circle on chart
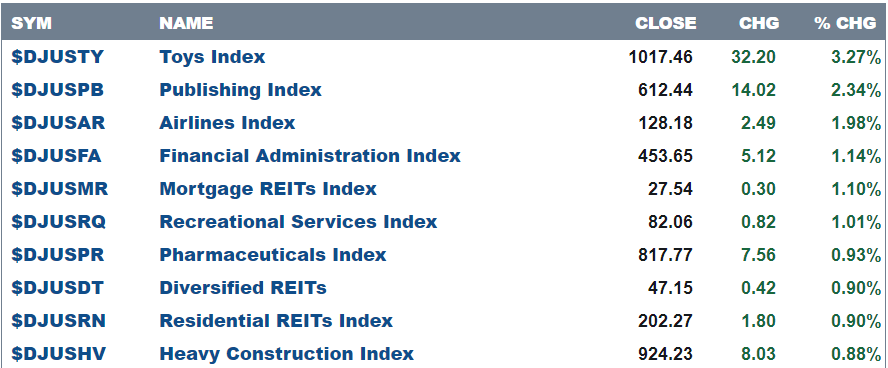
Here are today’s top 10 best performers out of 104 industries. 42 positive closes and 62 negative.
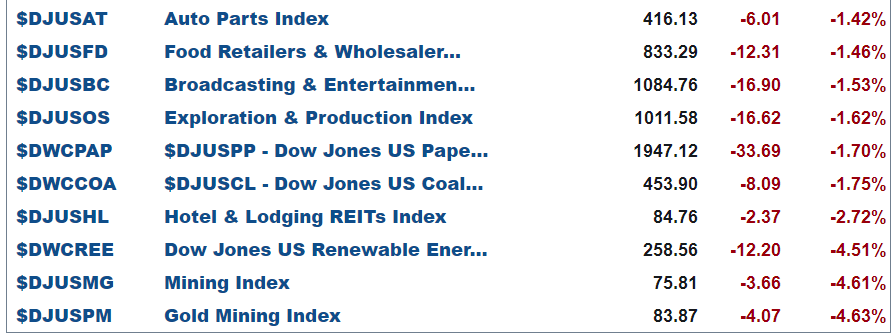
and bottom 10 …
SP500
To study the markets one must not only look at Elliott Wave structures but at an array of indicators that actually make the market breathe, day in and day out. Some of these are wave structure, breadth in multiple markets, sentiment gauges, and volatility. I will walk you through several charts, some of which you might have seen before but it helps to nail home the point I am trying to make.
As the markets were deteriorating for the second half of October, I have taken the readers of this letter through the reasons why I thought that lows were near and markets would be bottoming.
Now that we have made decent gains, there are signs appearing telling us of an imminent corrective pullback.
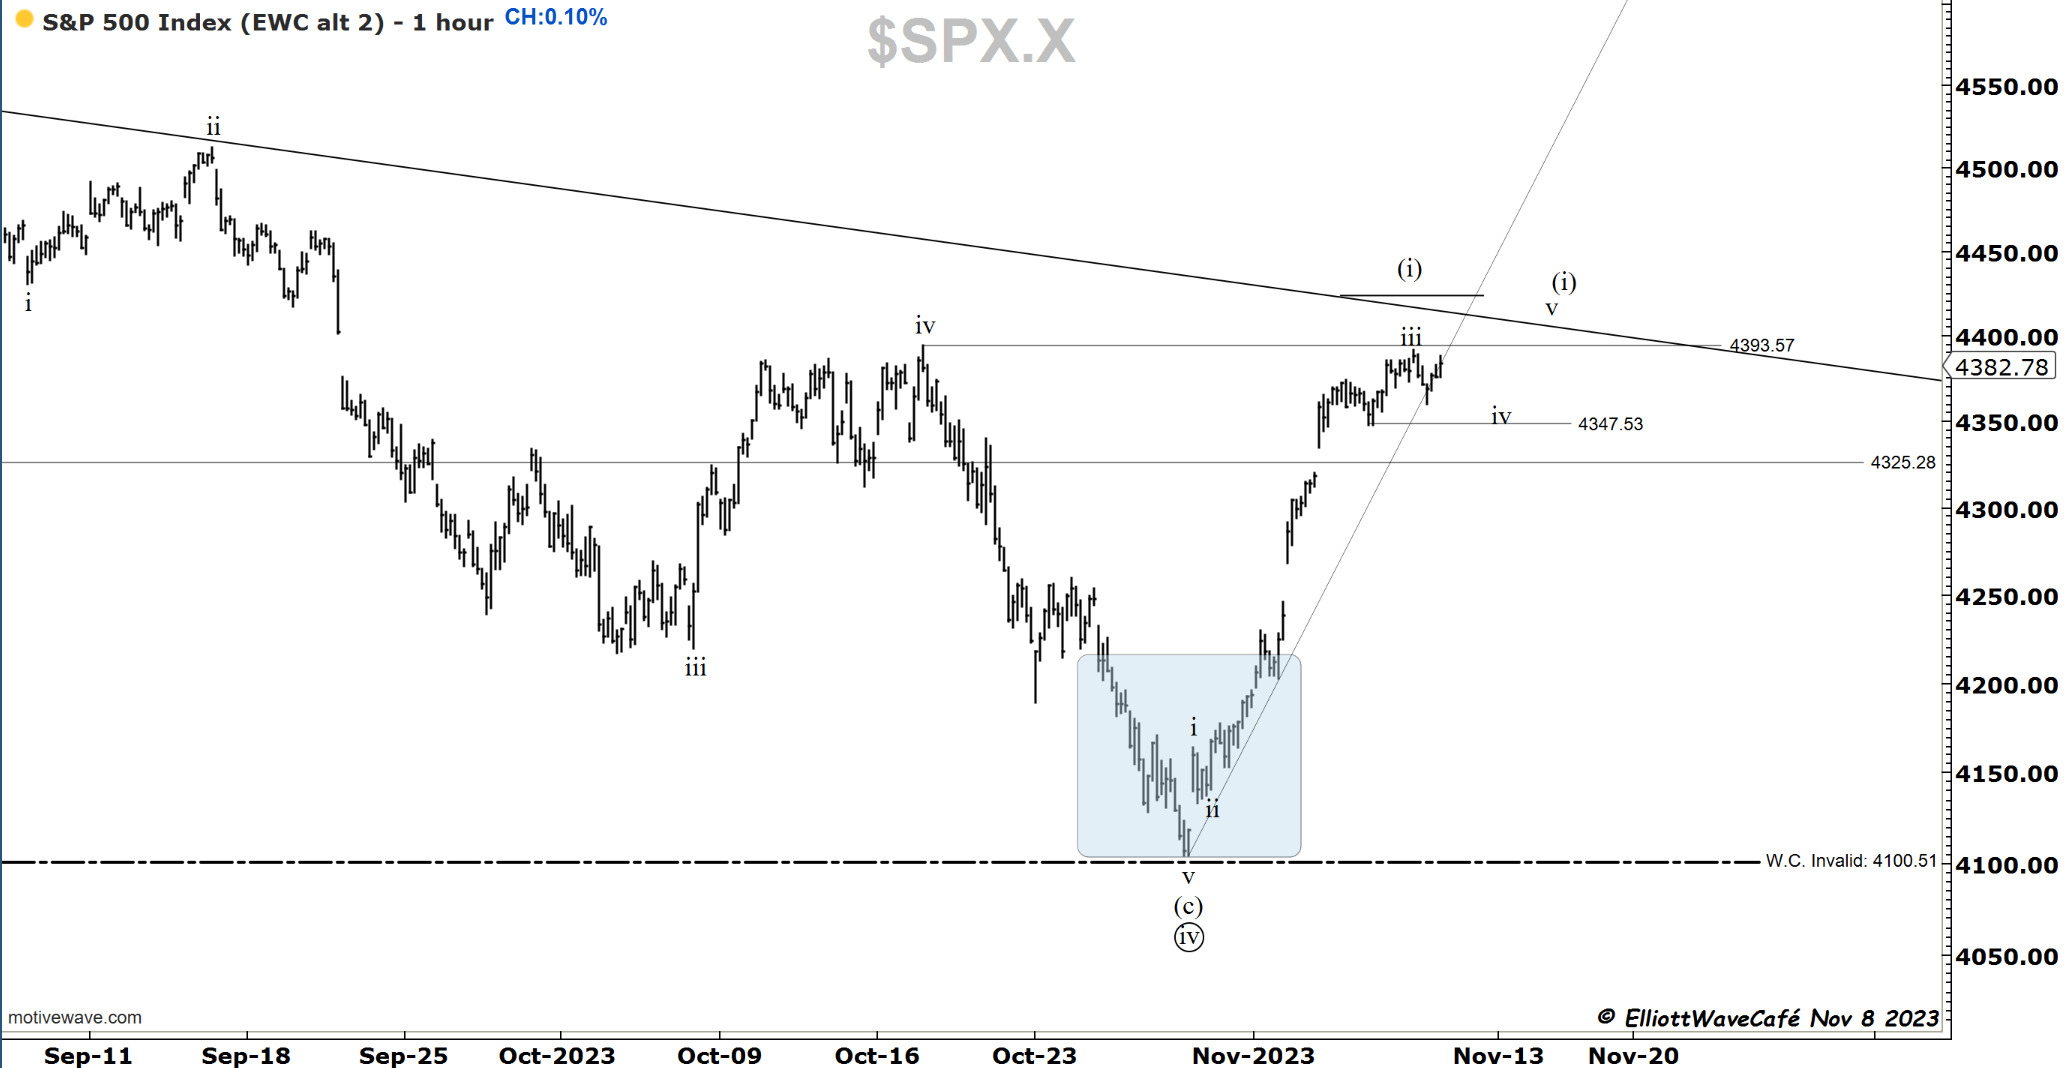
The wave count is the first thing I look at it continues to point towards the final stages of this rally, waves four and five. I would recommend against getting too cute in trying to identify the final few inches of a chart.
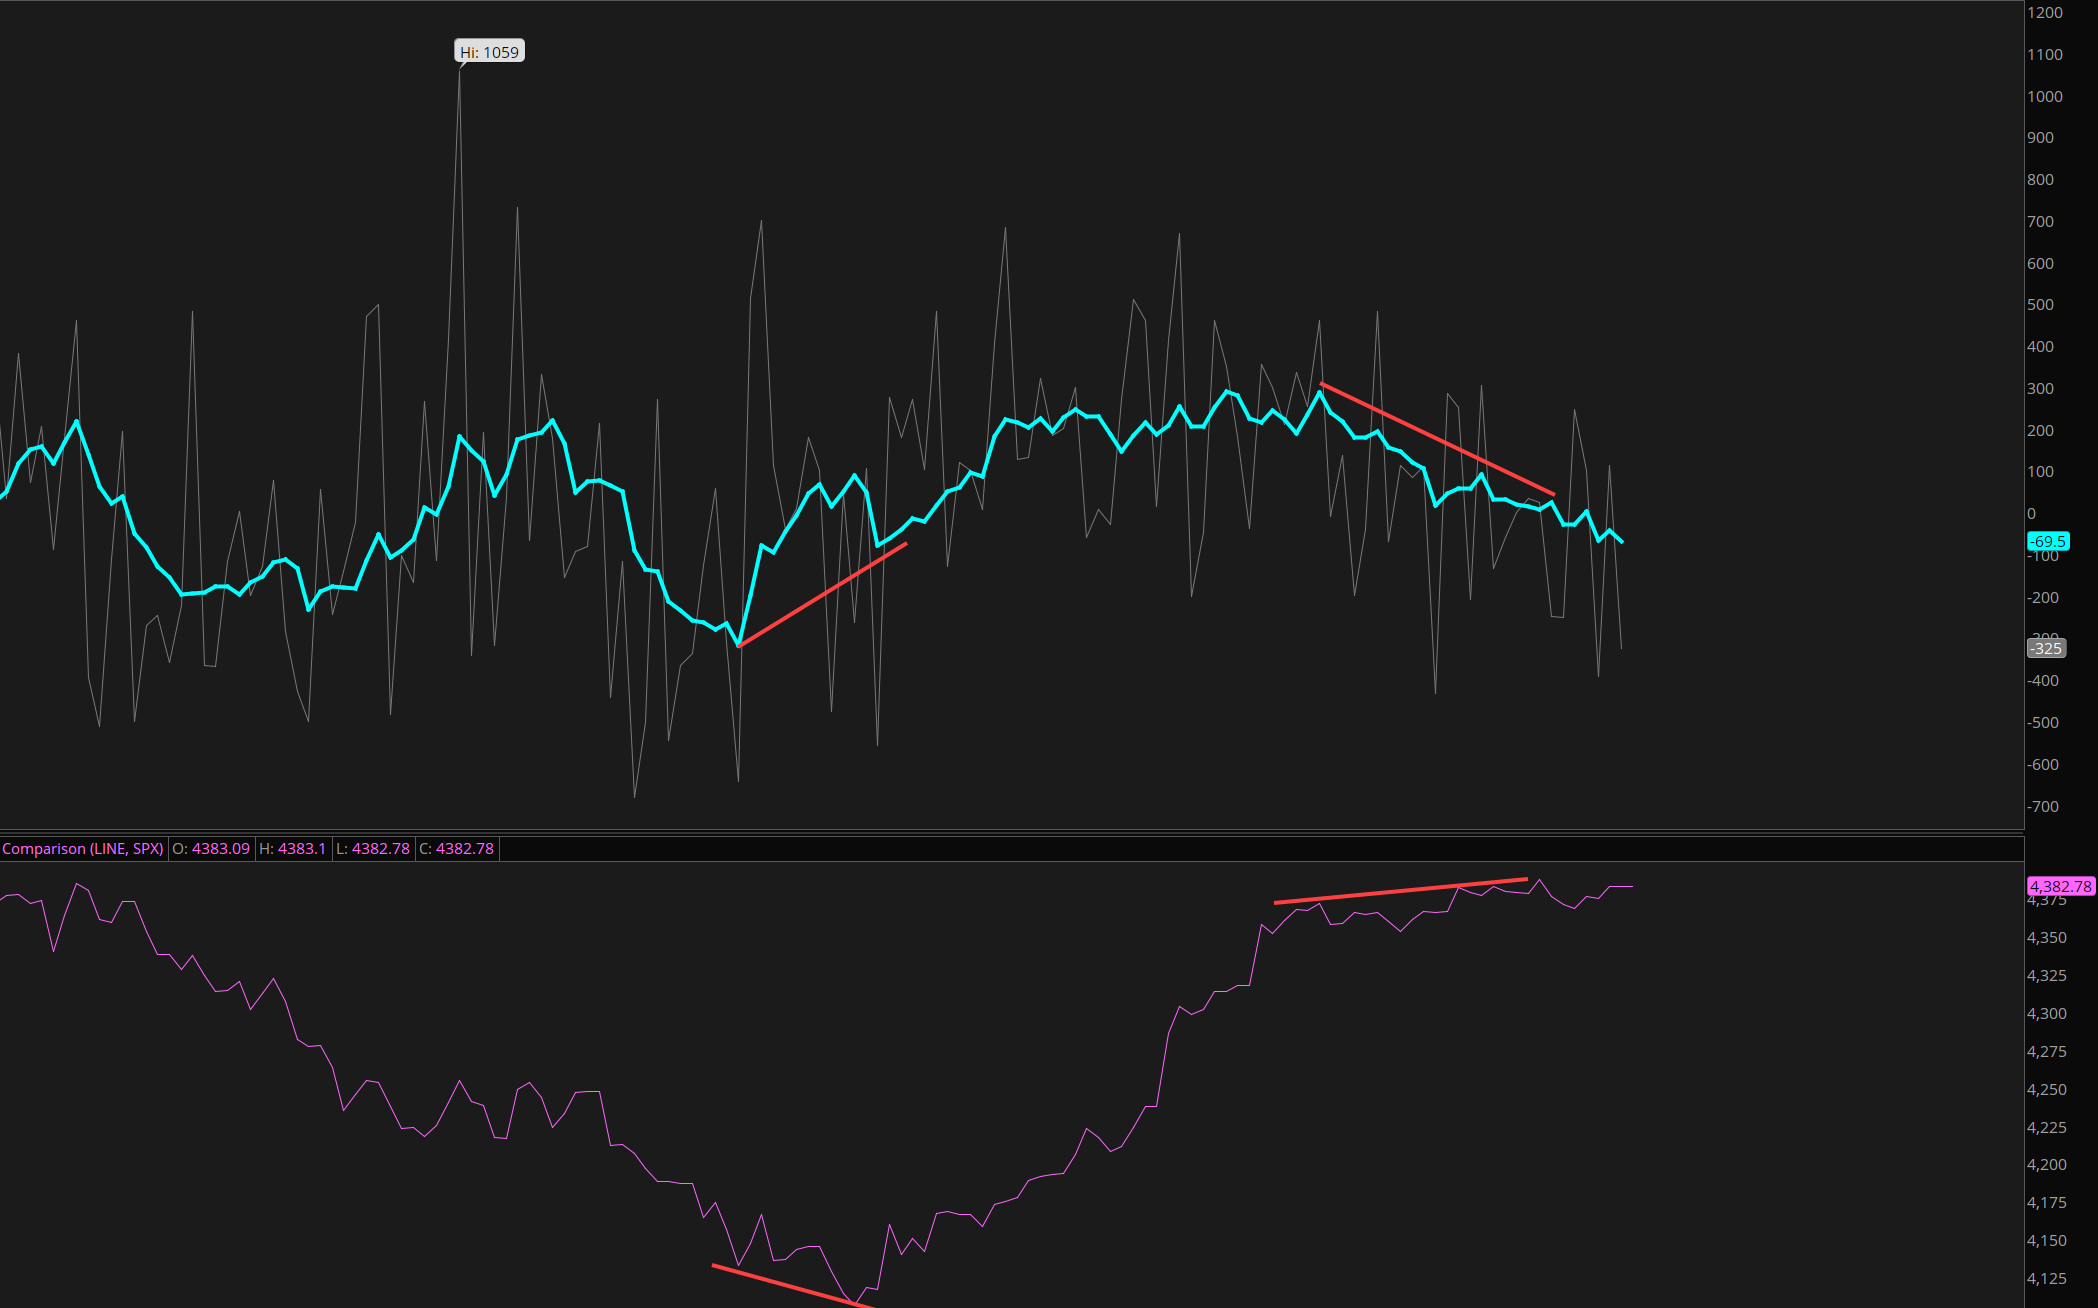
This proprietary chart that I build and add to on a daily basis, along with several others, it shows the price of the top 100 largest stocks in the bottom panel along with their relationship vs the 150day moving average in the middle. The top panel shows how fast these changes happen. As the index inches to new highs from October lows, since Nov 3rd fewer stocks were able to advance above their average price over the past 150days. Of course the momentum can pick back up, but this slow down tells me to pay attention.
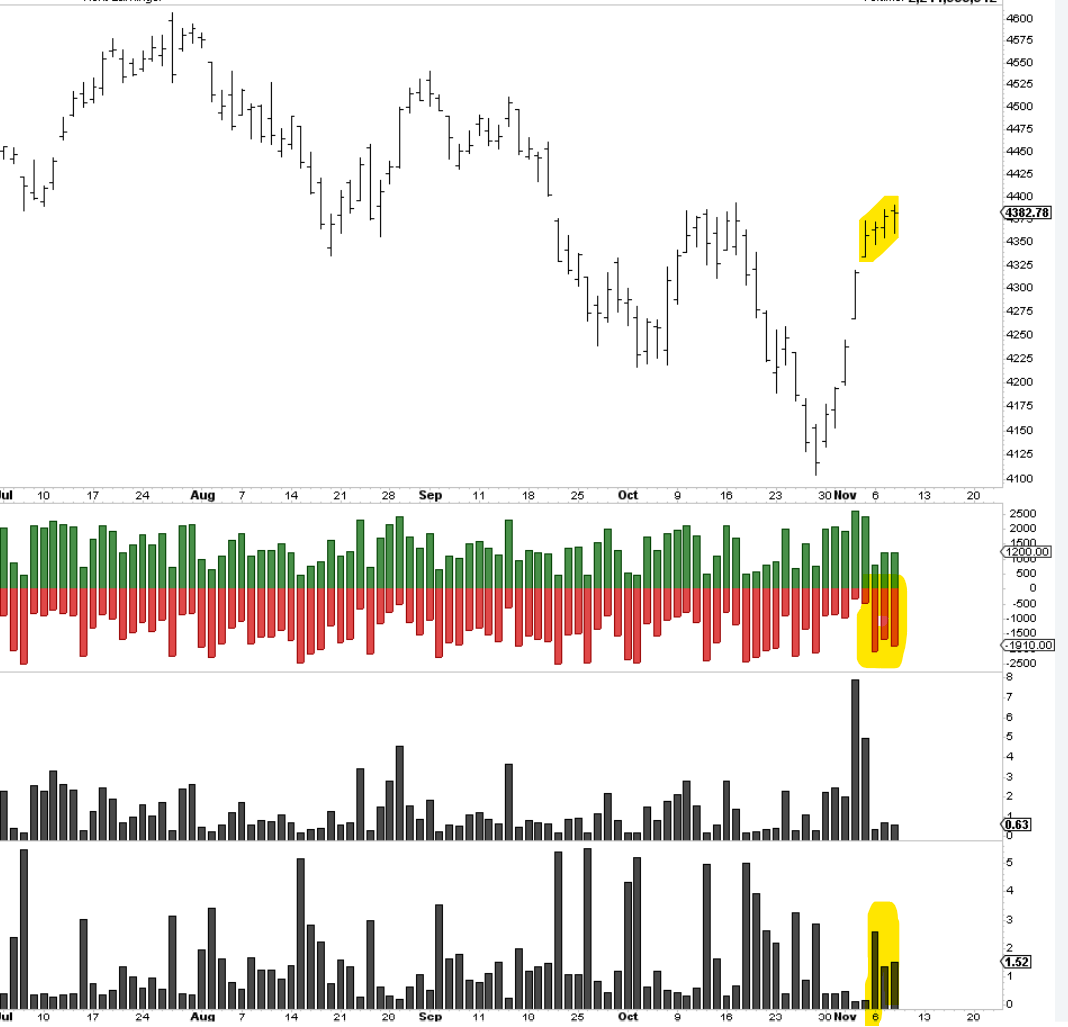
You saw this one yesterday, and today we have continued to deteriorate in stocks ticking down vs up while the price is flat to up. A sign of underlying weakness in my view.
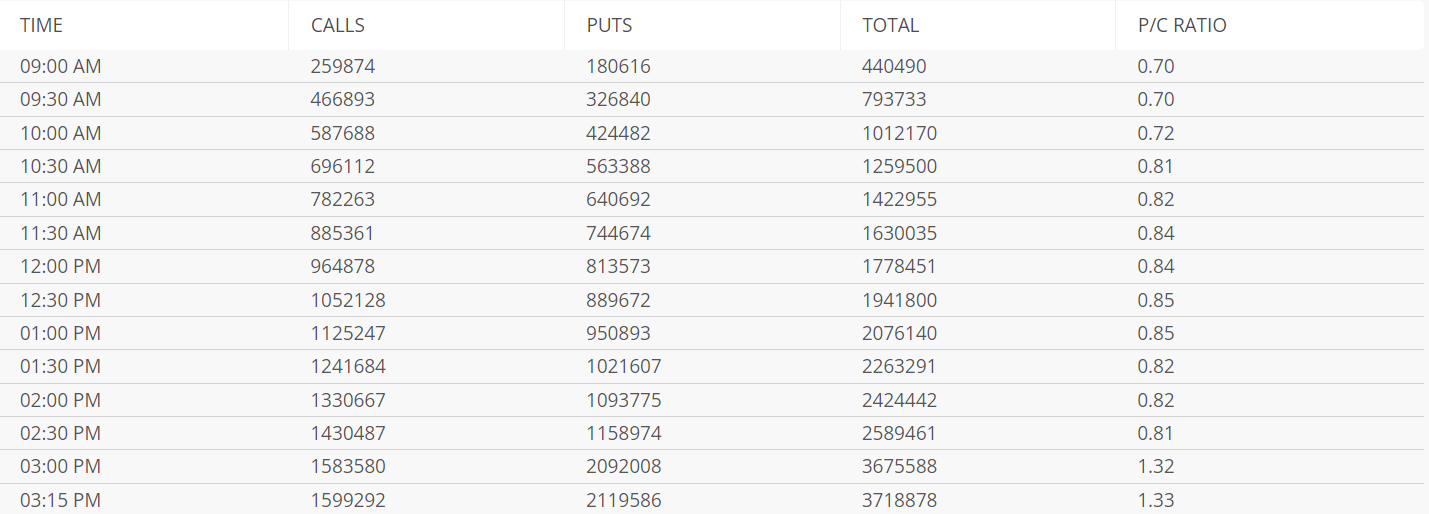
On the bullish side, the contrarian put/call ratio shows the appetite for put buying continues even after such a strong rally. It got to 1.33 as the market came to a close and rose throughout the day. It seems that traders are betting on the downside. This piece of the puzzle can work against a bearish tilt near term, as it can fuel more buying from market makers looking to capitalize on rendering these puts worthless.
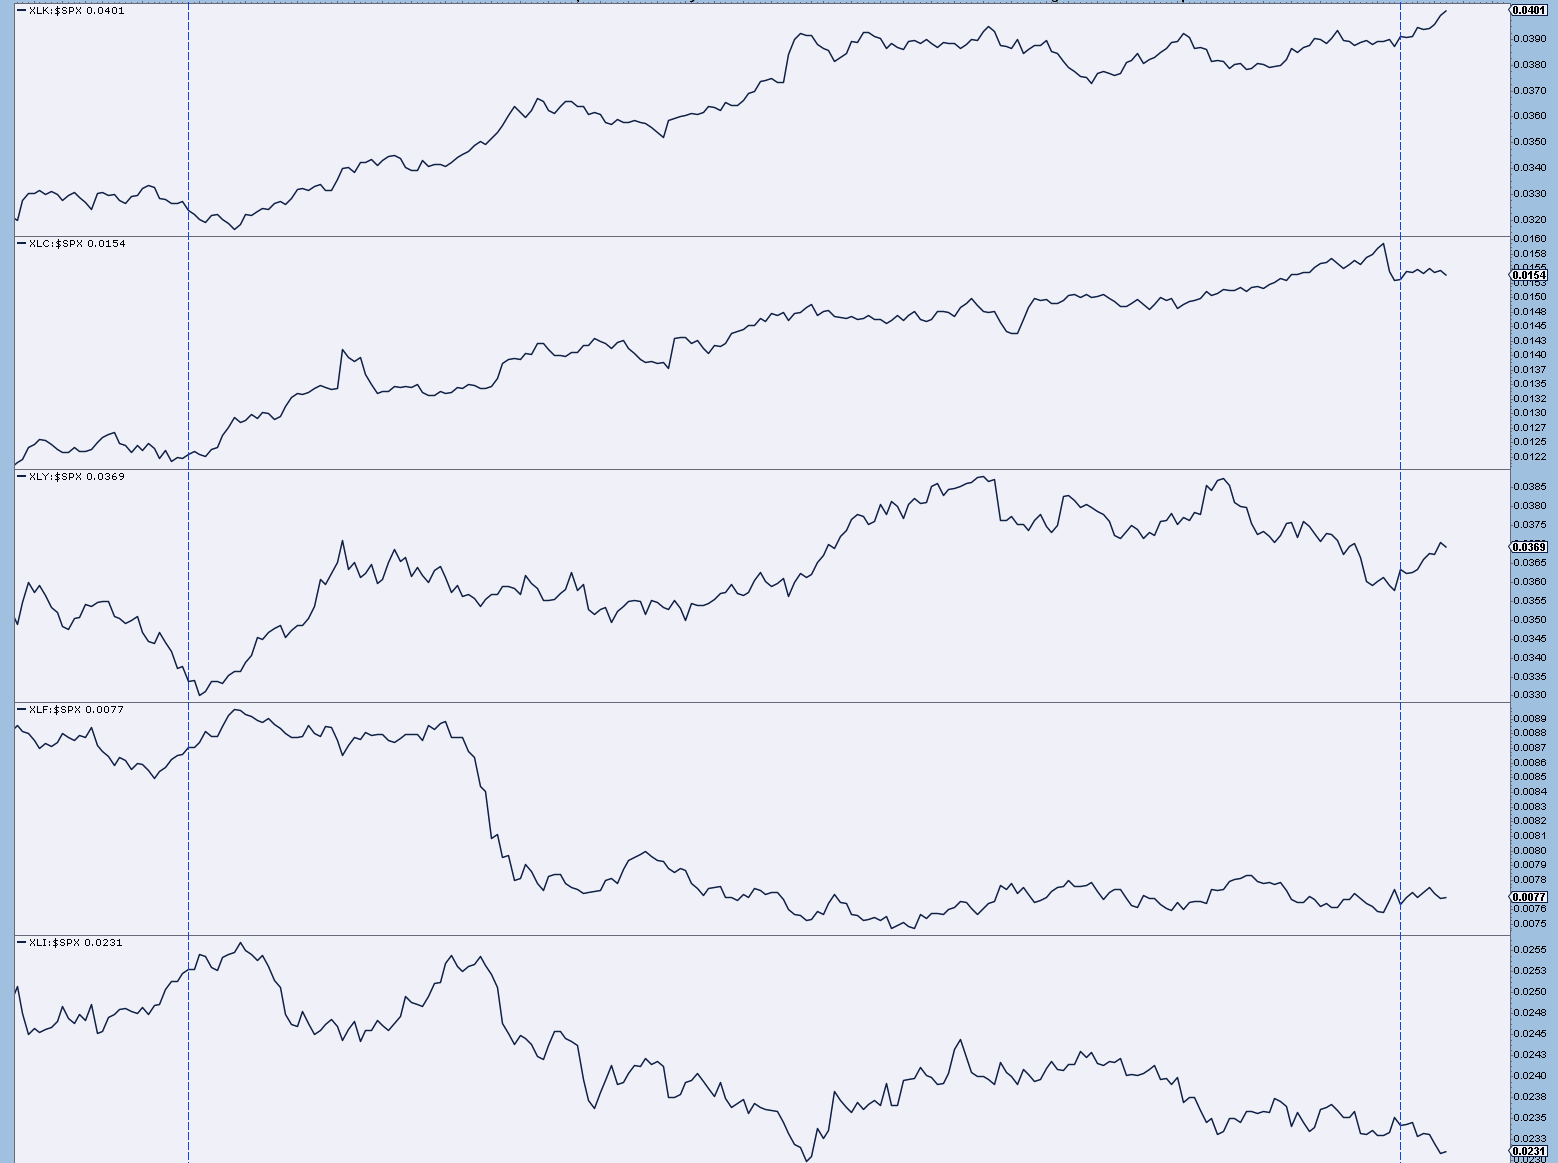
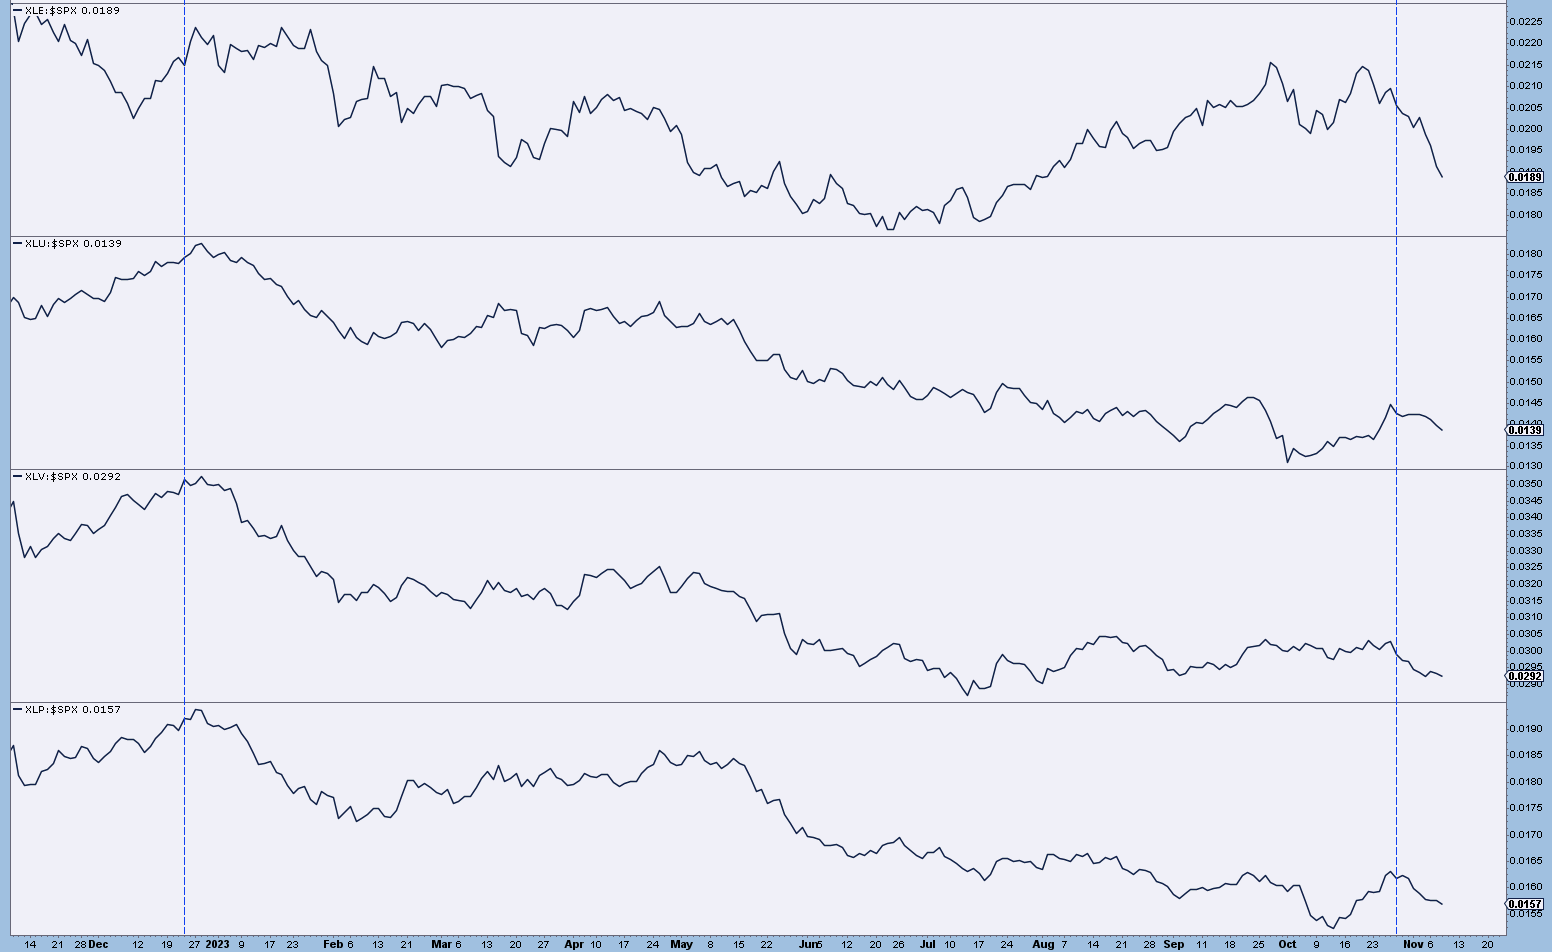
These next two charts show the relative strength of the SP500 sectors vs the index. Notice that we have only XLK and XLY pushing higher while the rest of the market is heading down or sideways. This is what they mean when they say a few strong stocks in those sectors make the market tick higher or hold it up. When we talk about breadth deterioration, this is what that means. It would be great if more of these sectors could pick up and start to perform. If we correct lower in wave 2 , then we will watch to see how these perform. There is more data in the Equal weight sectors but I won’t bore you with it at this stage.
A third day here and a marginal new high in the index, but about 1.5 more declining issues than advancing. I dare to say it shows late-stage action that should be followed by a drop in the actual index.
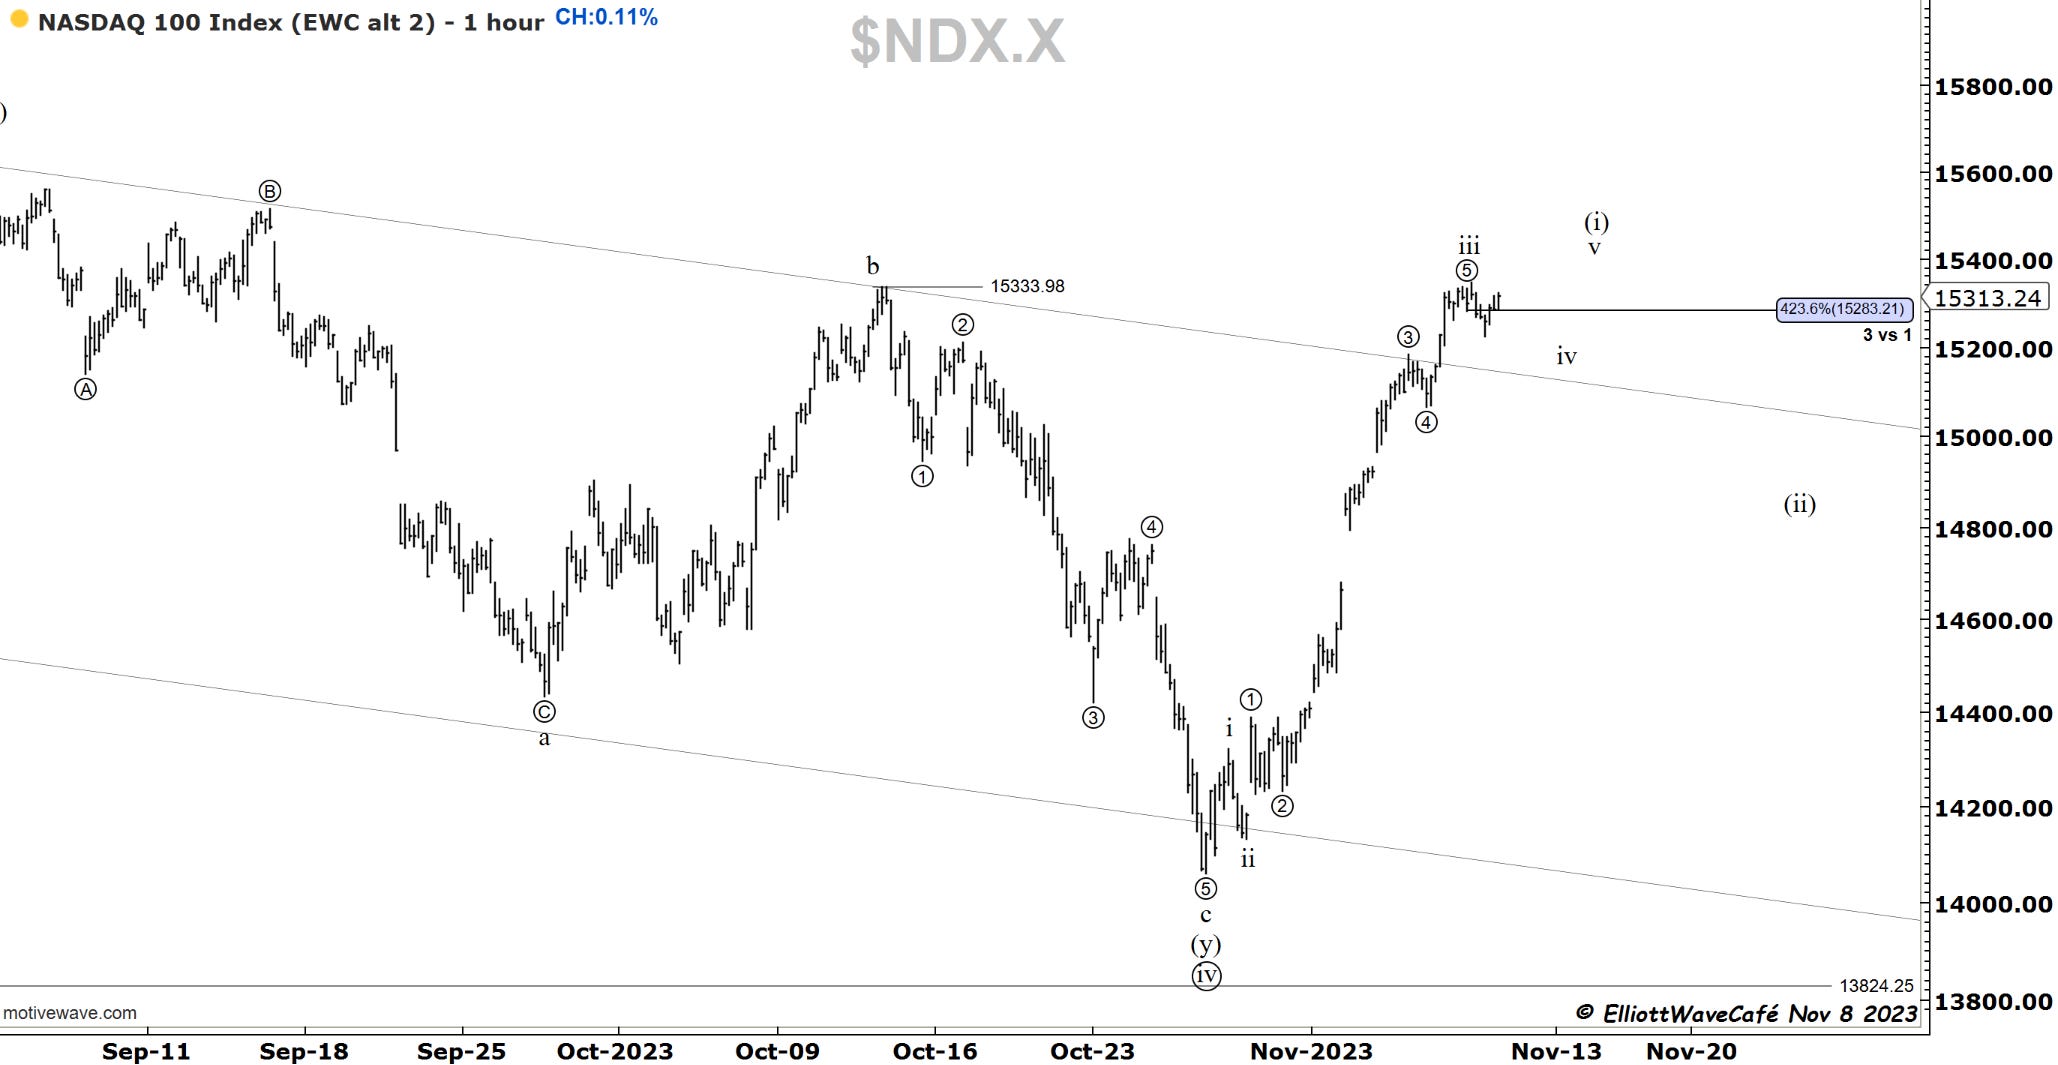
Nasdaq100
In the blue box, we have today’s price action. After a quick run higher to trap some excited fresh longs, the index drops about 75bps. It recovered most of that late in the day. My read here is that we have a three wave decline which could either lead to another high or we’re falling into a complex 4th wave correction. Either way, the index is stalling and a deeper retracement is just a matter of a few days if not less. I stand by the count at this juncture. The long SQQQ paid us a few points today, but I think there should be more.
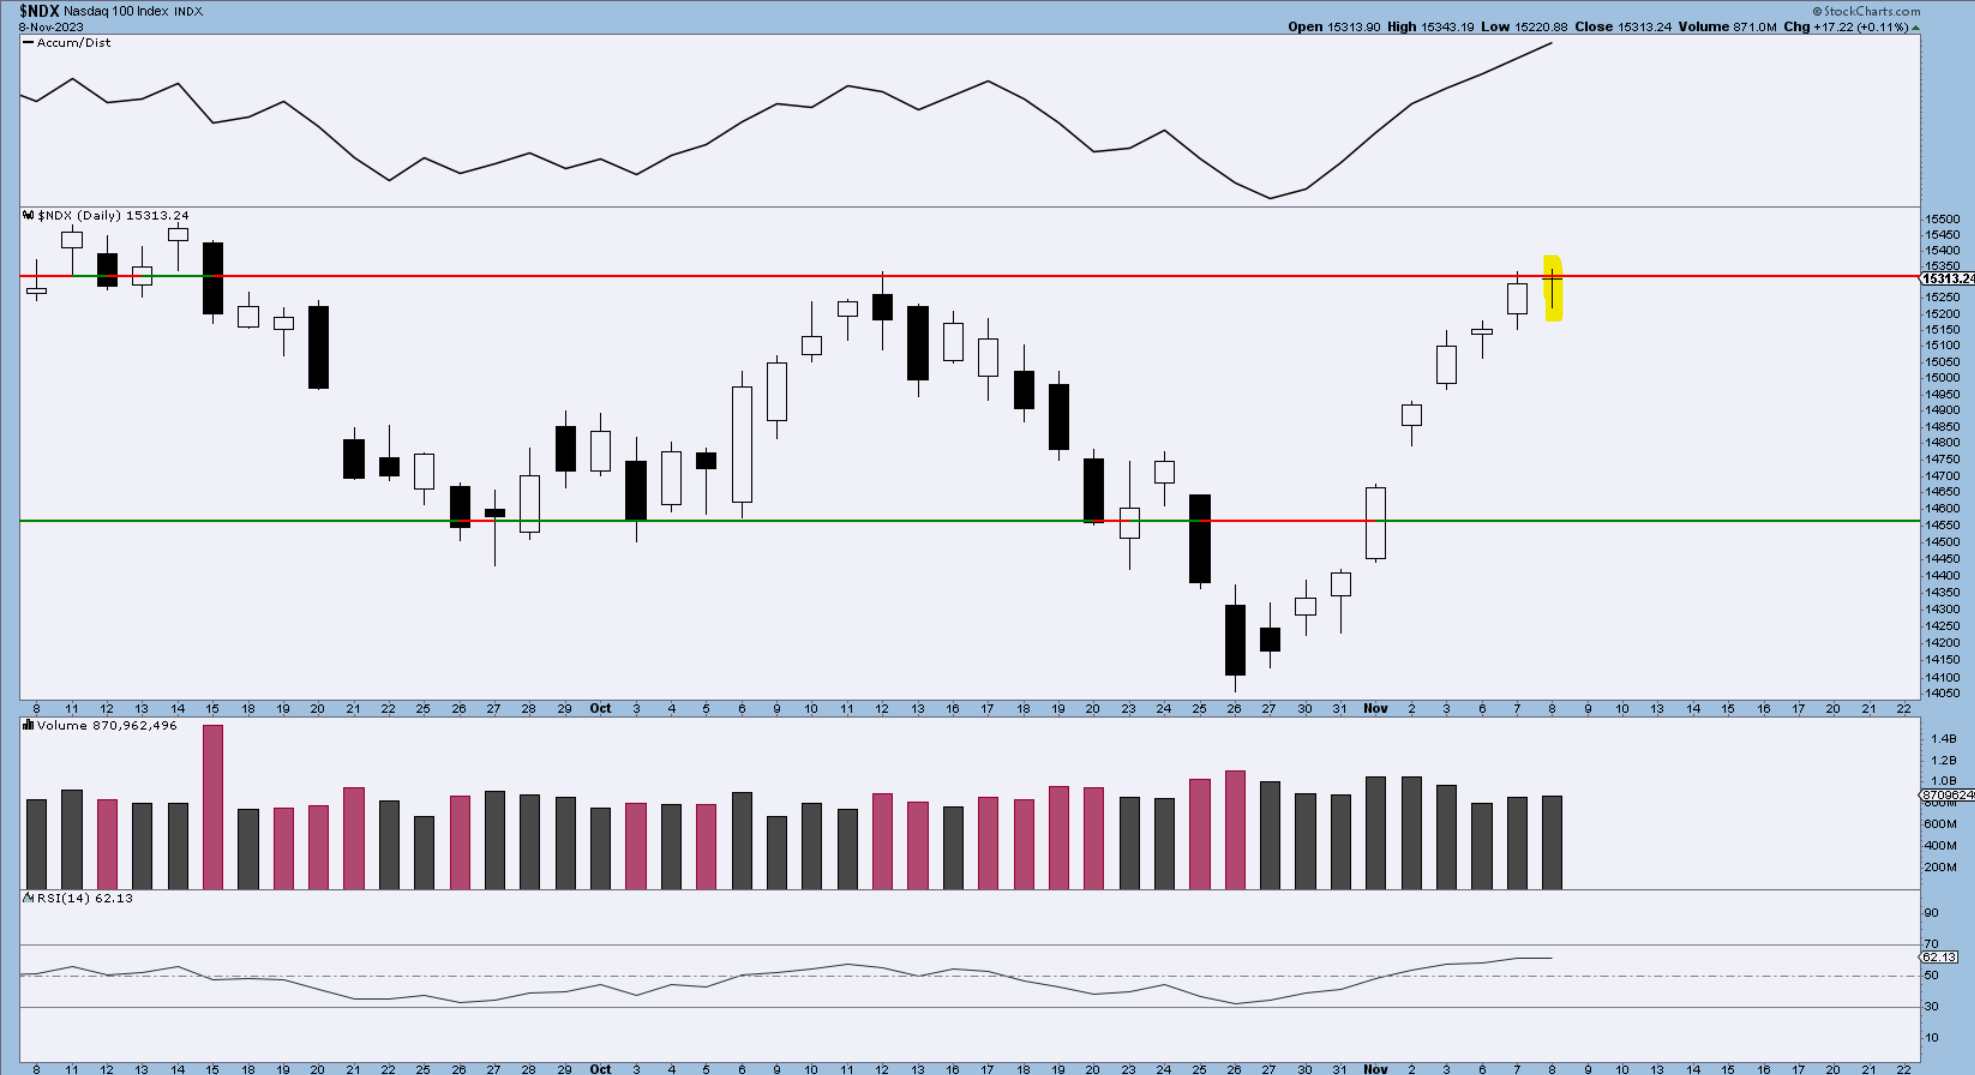
The third chart shows a nice doji candle after multiple advances and right into resistance. Could it be as simple as the market holds these levels? There is a decent risk/reward to find out.
RUSSELL 2000
Midcaps and small caps were under pressure once again, it seems like a neverending story with short pockets of performance. The depth of the pullback hints that the move is not a 4th wave of ((i)). So either wave ((i)) is done and we’re in a ((ii)), or something else is cooking. I will watch the 61.8. If anyone is looking to trade this as a wave two, that 1641 is your cutoff risk level.

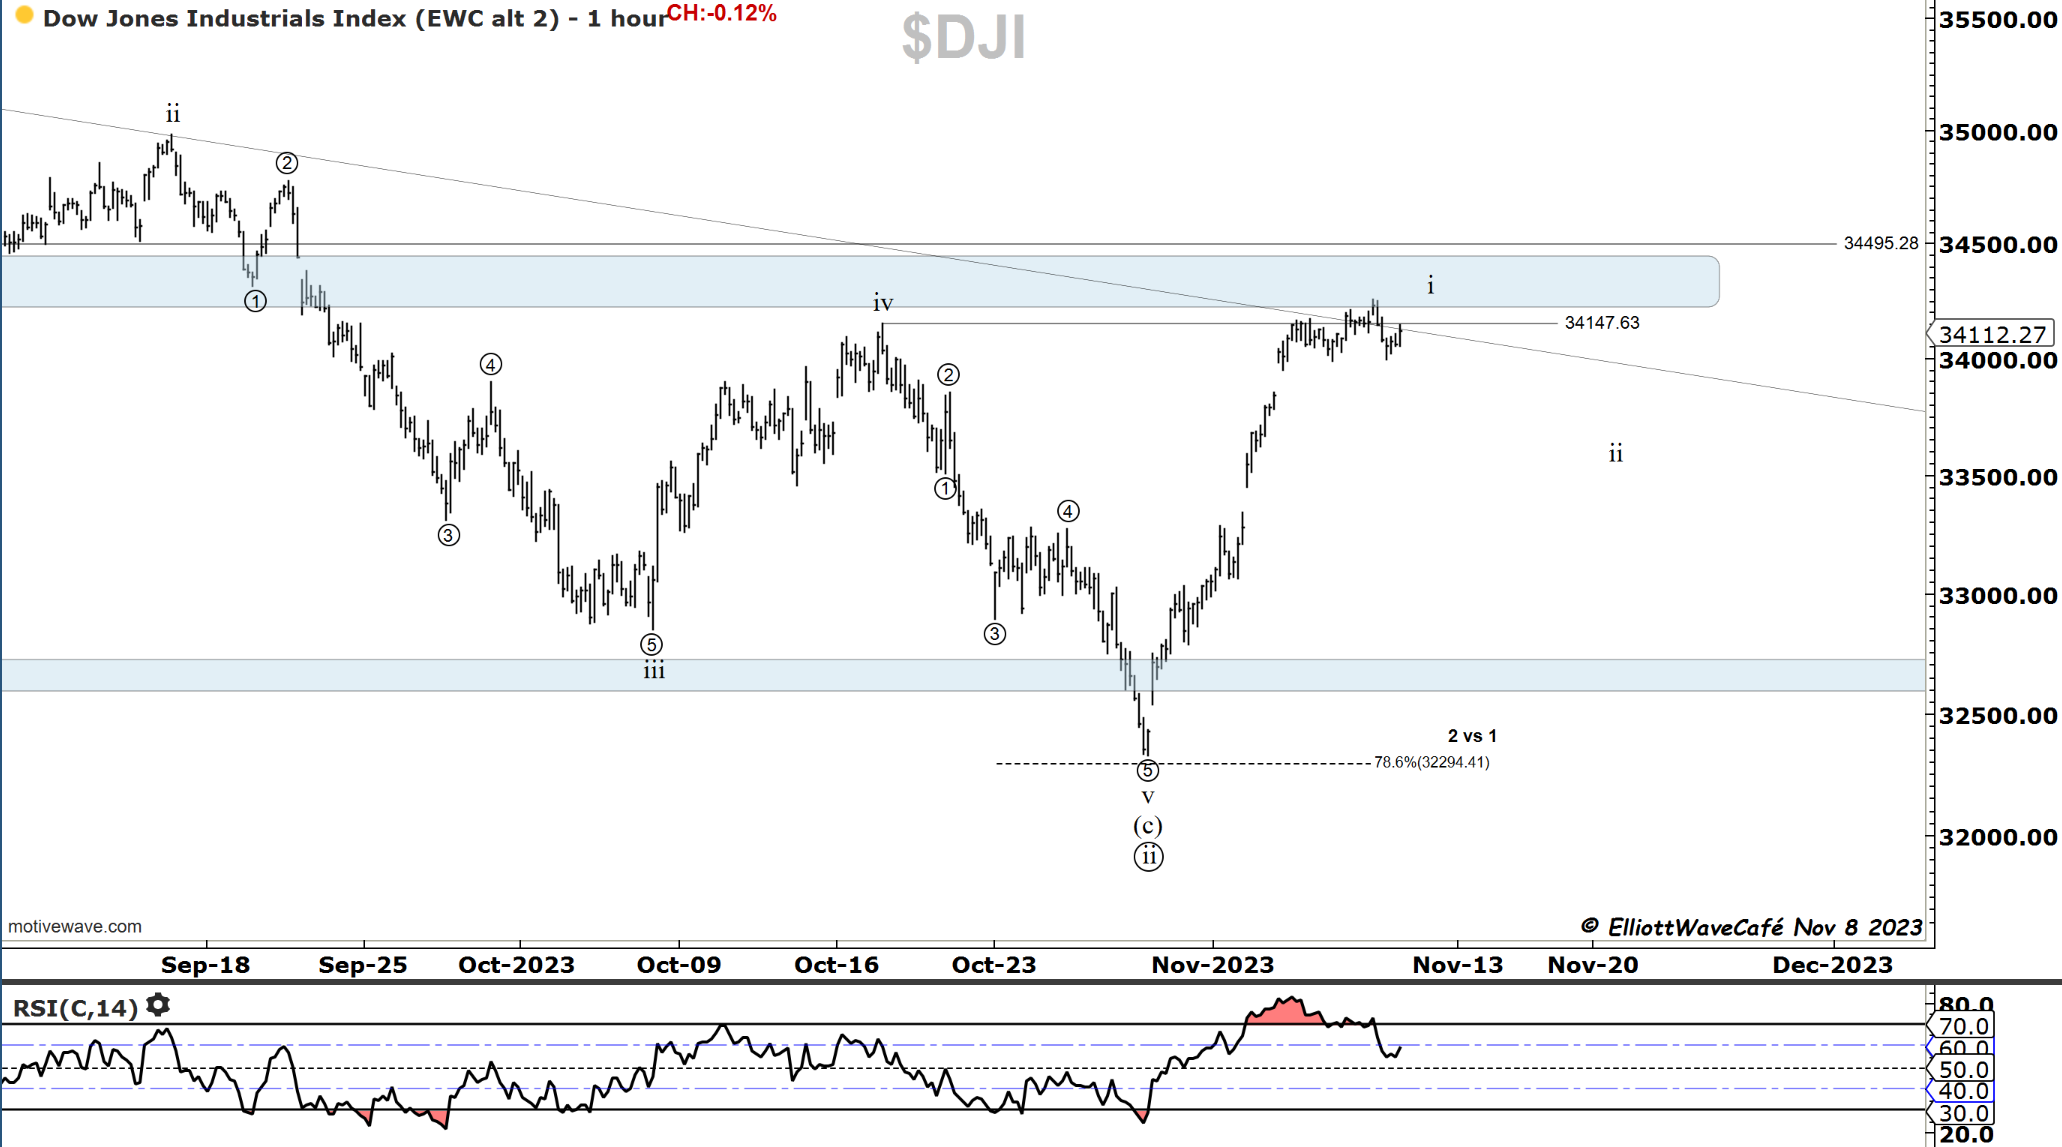
Dow30
I am not sure if Dow has worked out its RSI divergence, but I don’t think so. The attempt at a new high failed to be sustained and we sold back lower. It’s a small hint that supply is widely present at those levels. I have sold all our leveraged UDOW long positions and will look to re-enter at a later date.
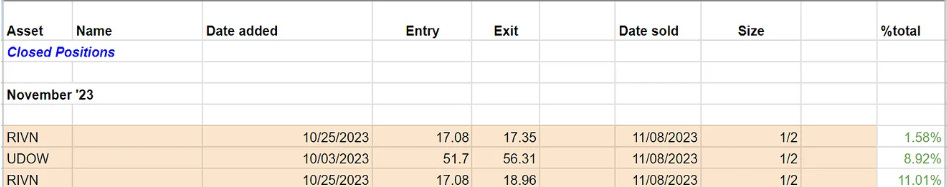
We were able to sell premarket the RIVN earnings and exit UDOW.
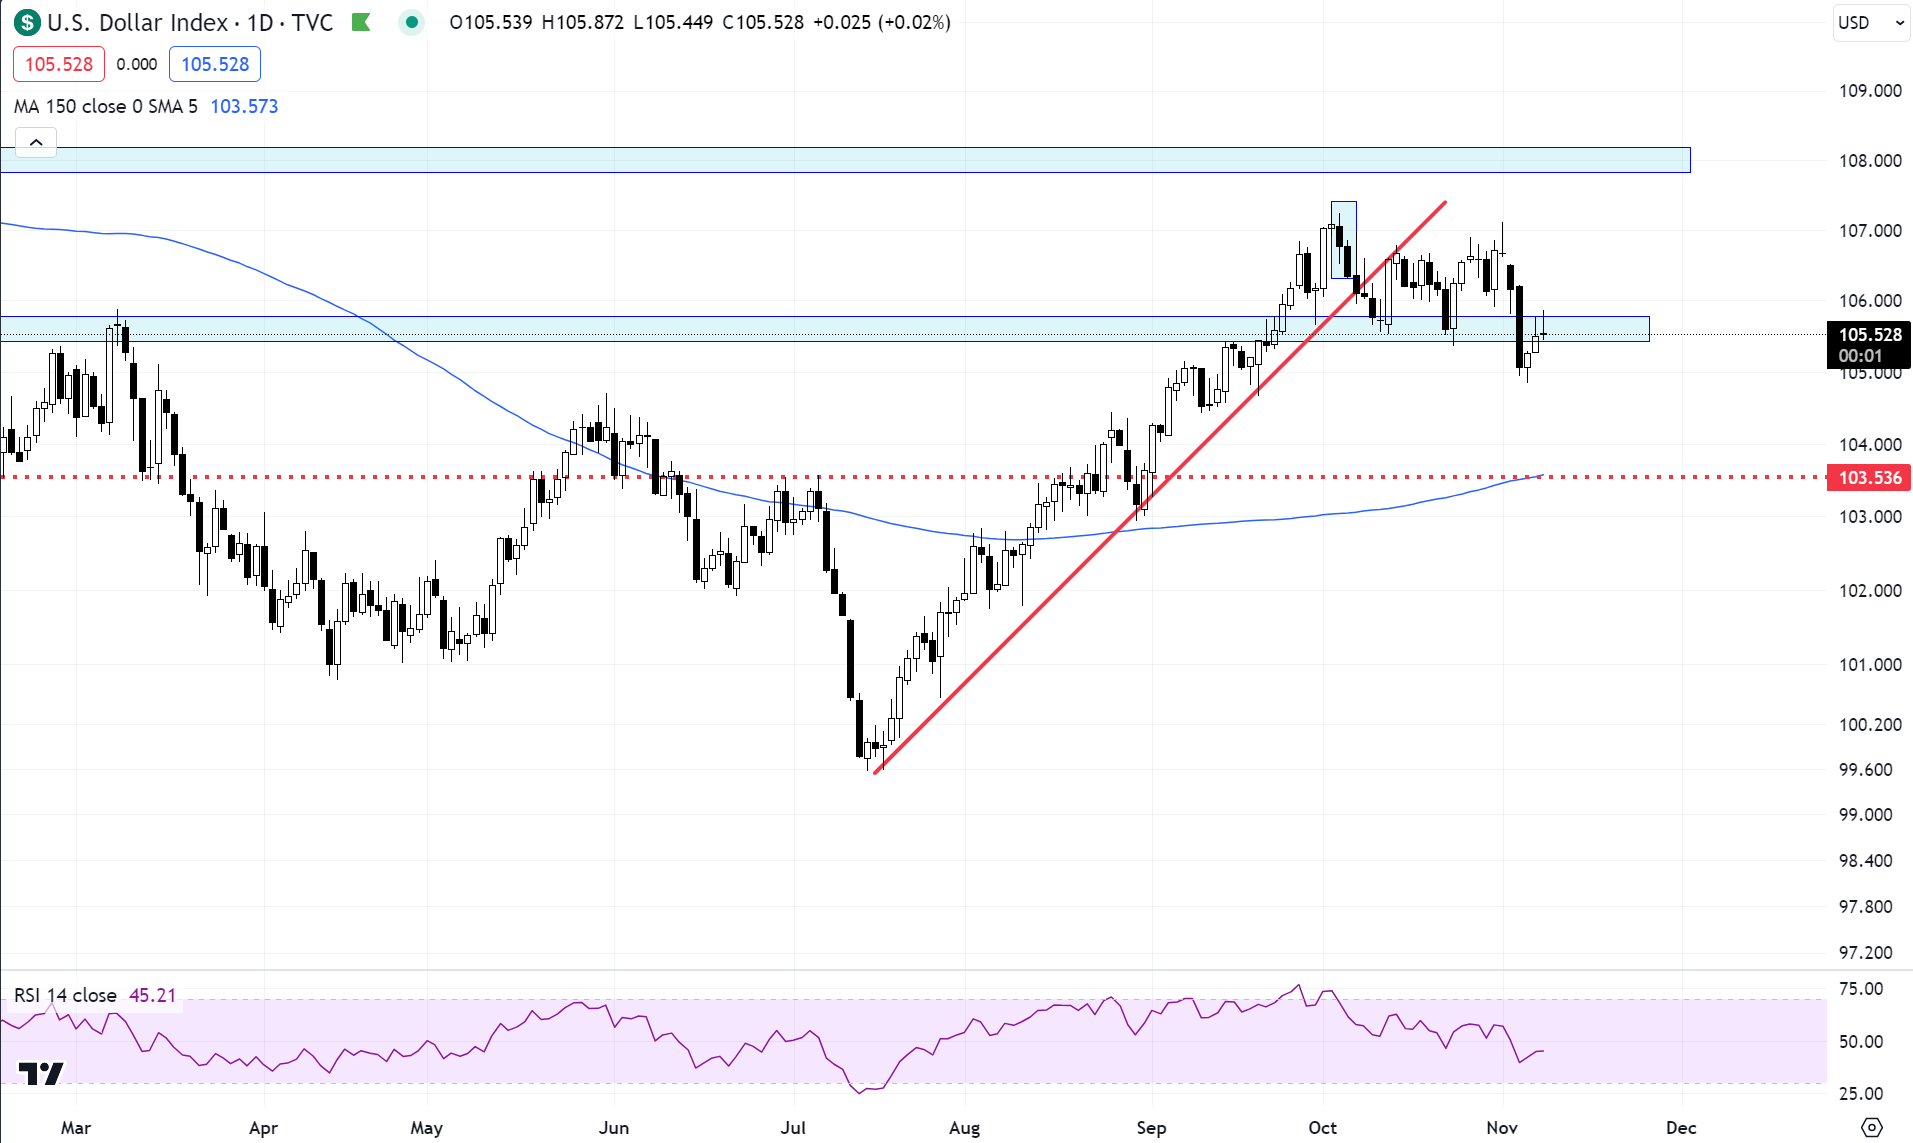
US Dollar and Yields
The dollar was mostly flat so no news there to speak about, but yields have dropped some more, ignoring the obvious trendline support for now. It does seem however that a 5 wave move in yields is being formed, which means that after a 3 wave setback , another lower leg will begin. That will mean higher bonds. The long end of the curve towards 30 years had even better performance.
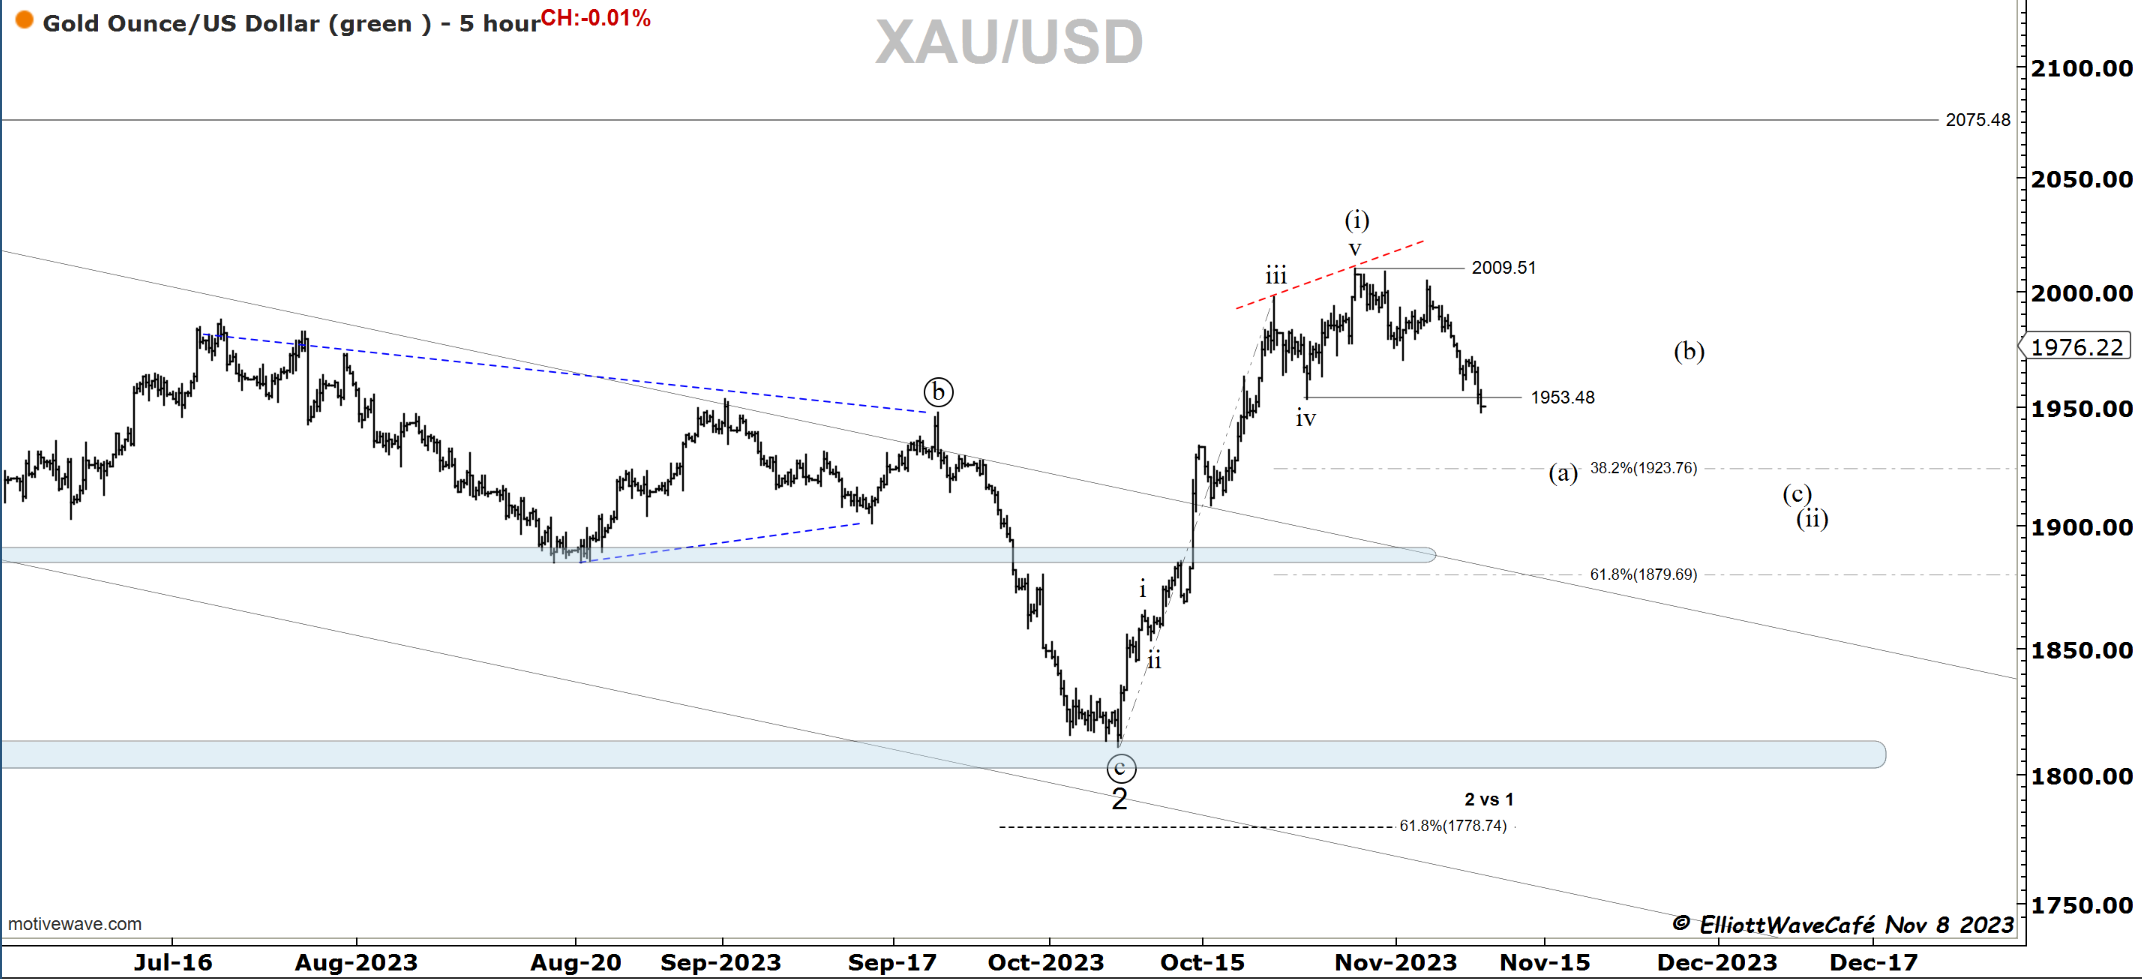
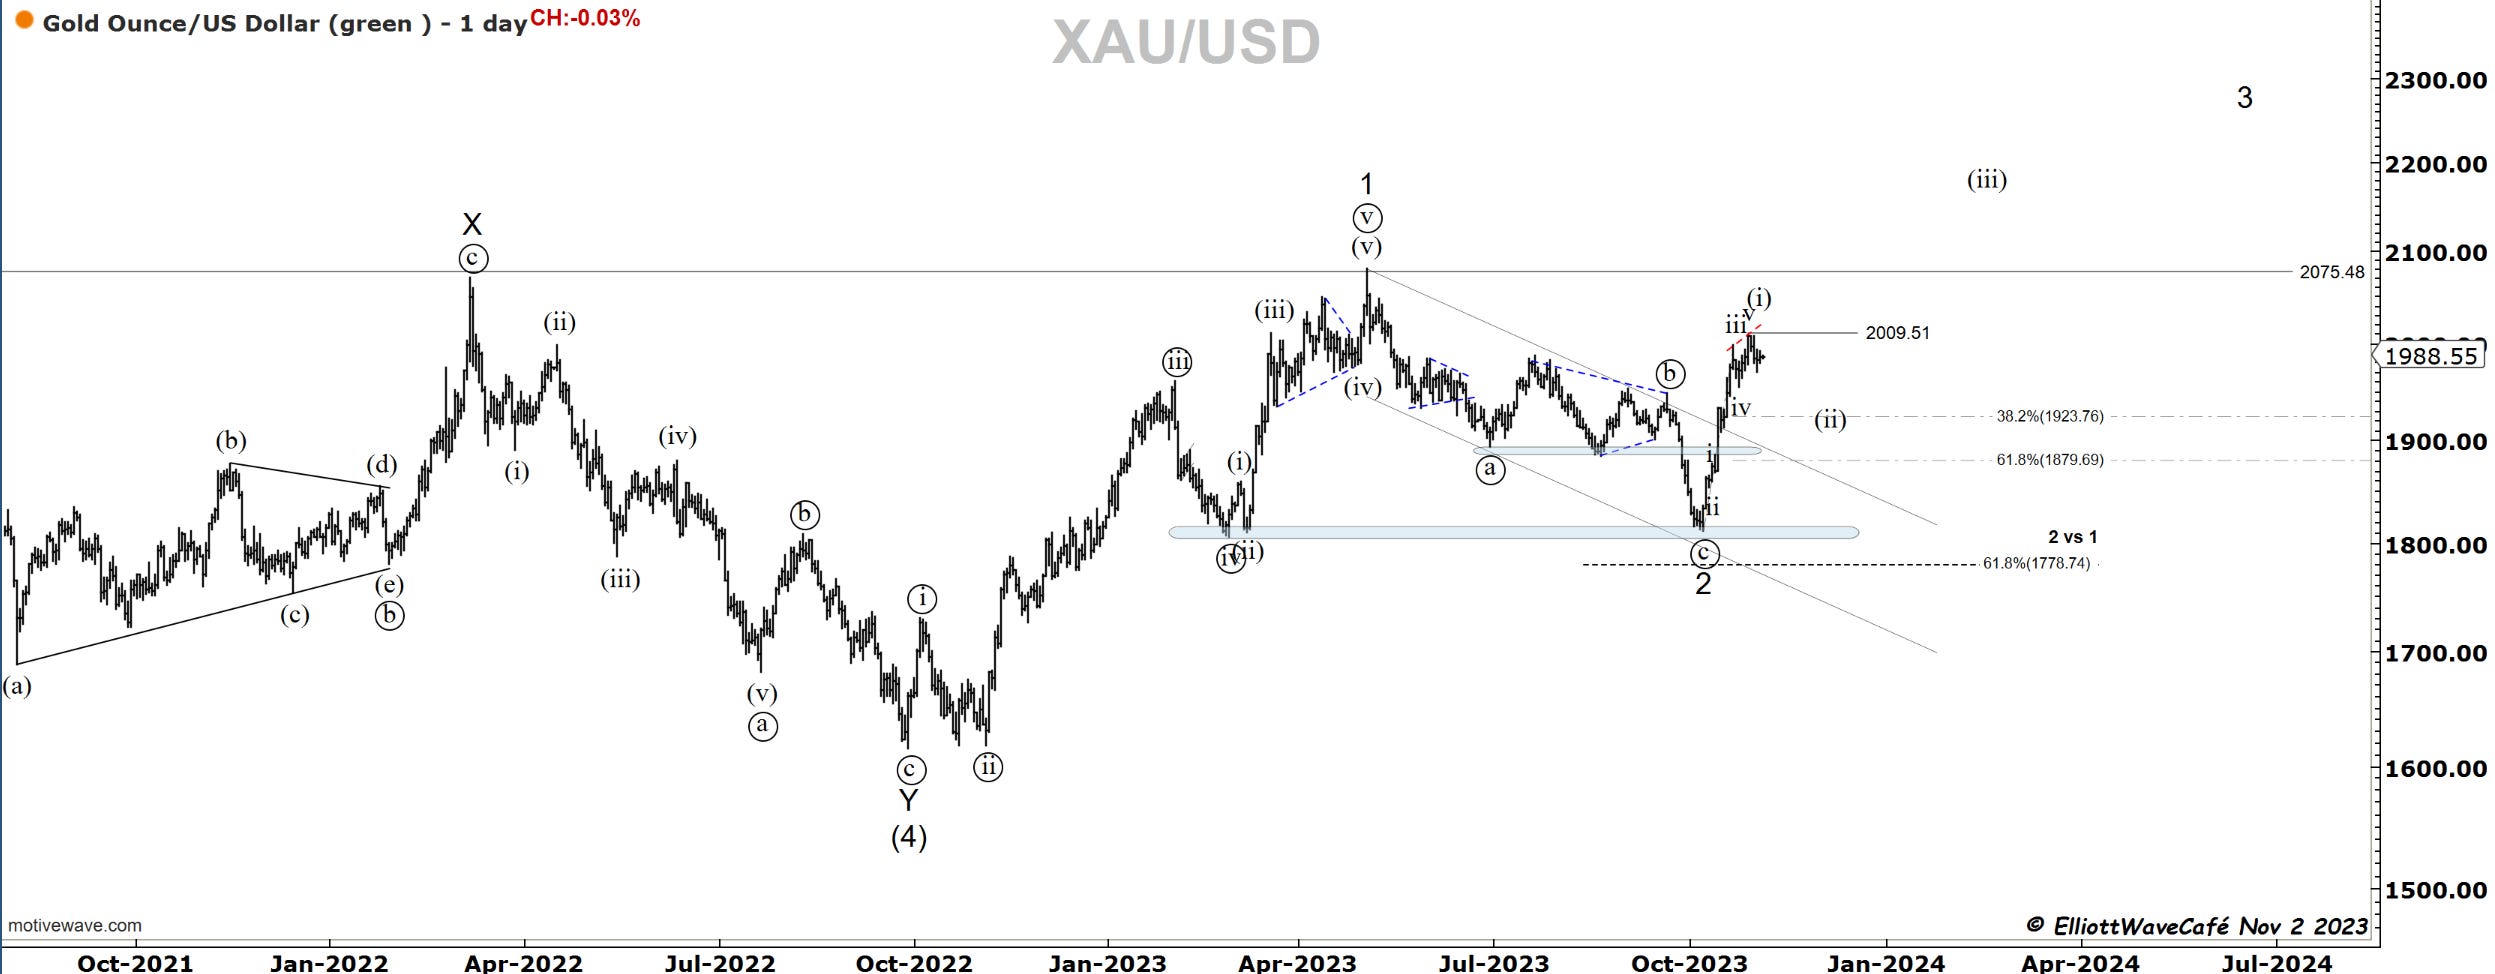
Gold
Gold broke below previous 4th and is starting to look more and more that it wants to build that wave (a) decline. There are only 3 clear waves from the top for now. Let’s see if she builds five. Then (b), then (c ).
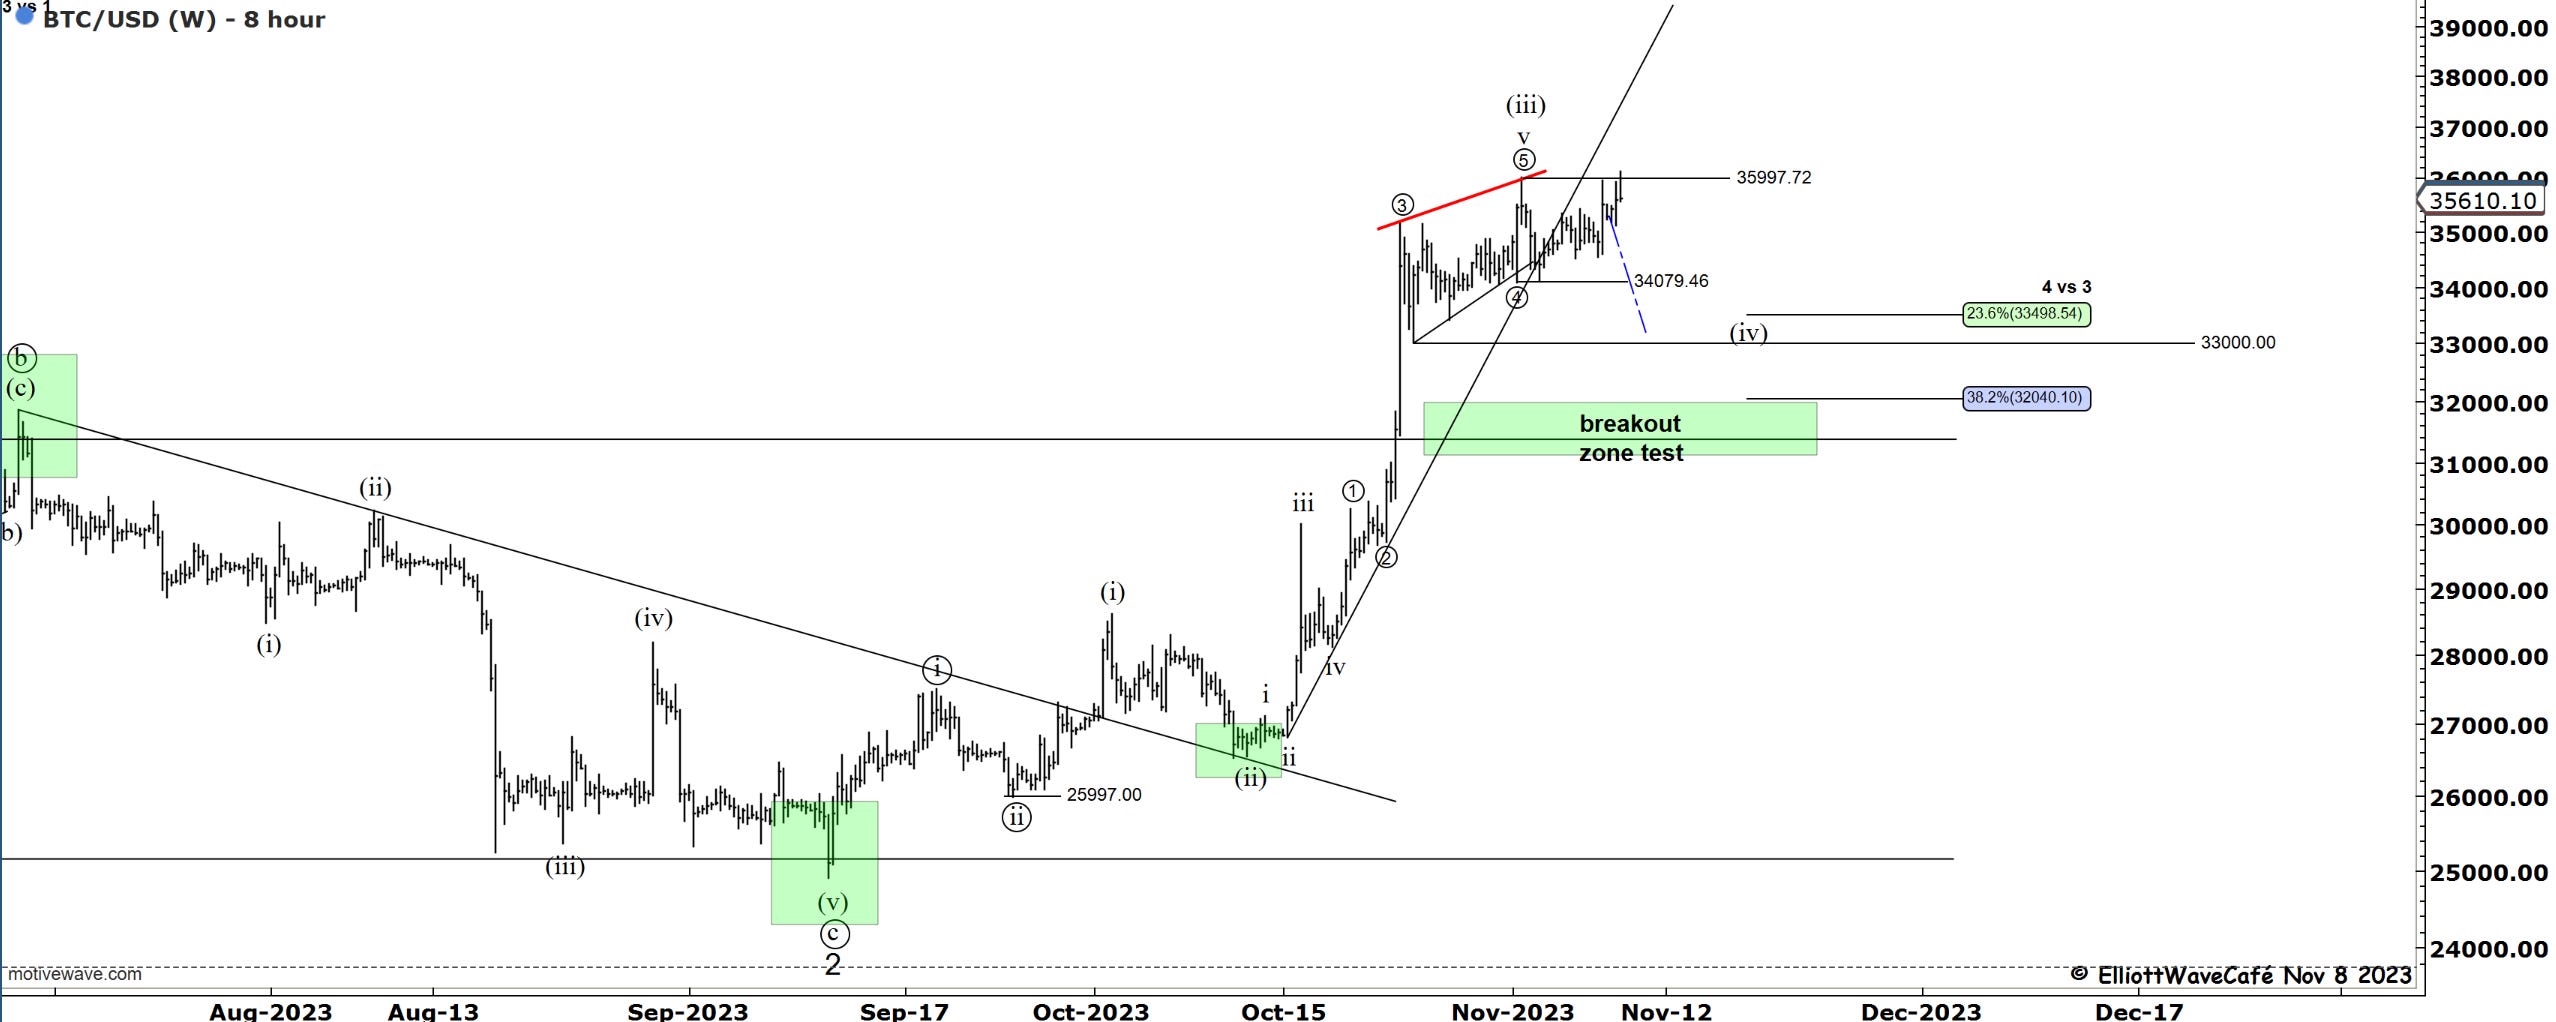
Bitcoin
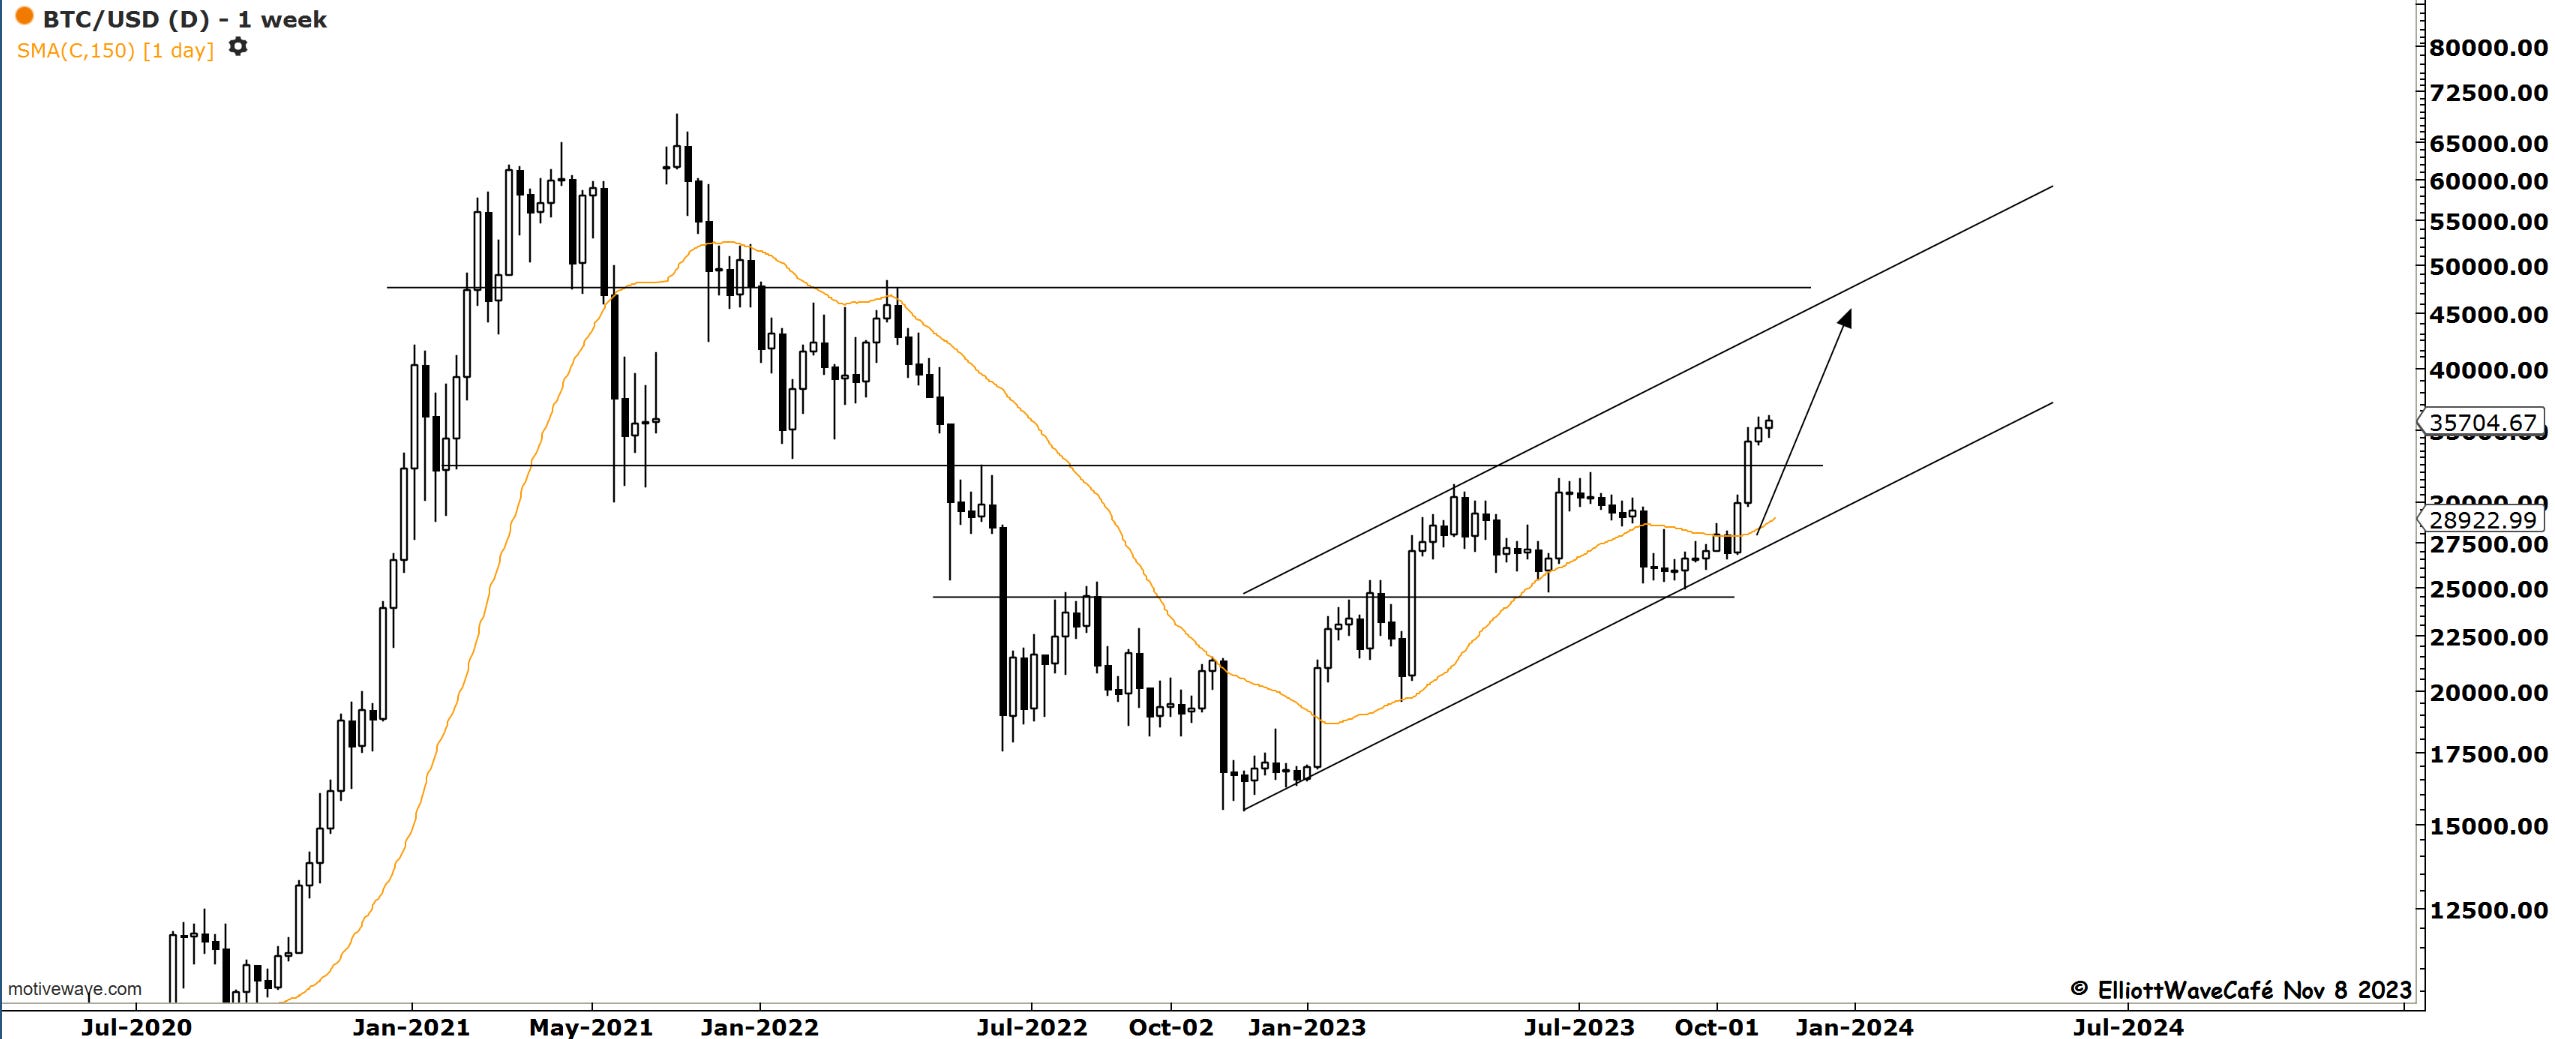
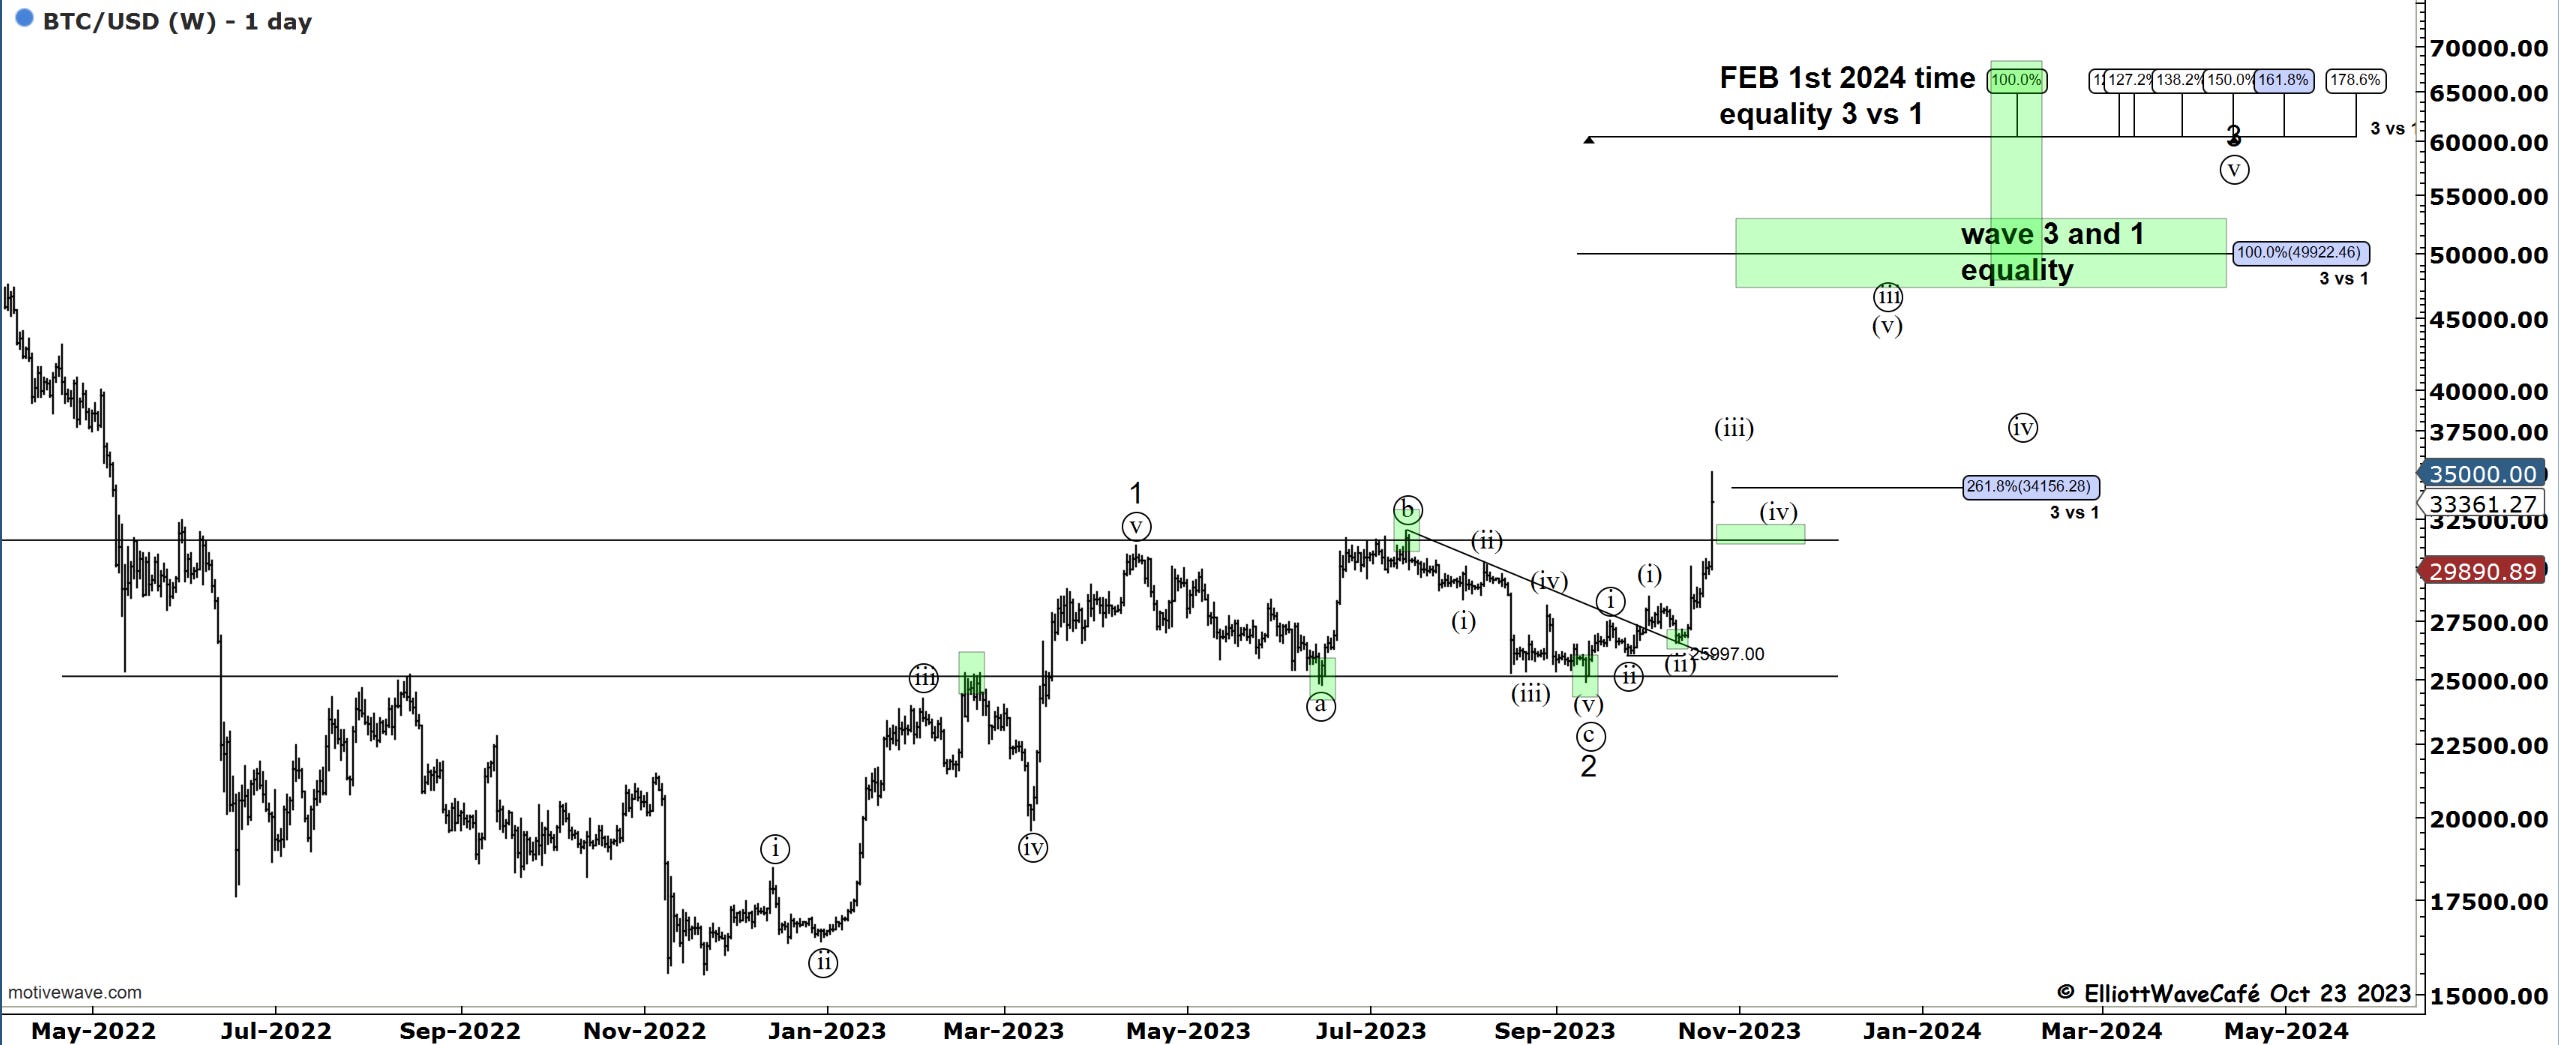
Marginal new highs in btc, but the story is unchanged. The expectations for a 4th wave continue and it’s up to the market on how it wants to display that going forward. There are multiple scenarios, none of which are worth speculating on. The bottom line remains that 33k should attract prices before this correction is completed.
There is always the potential for an upside breakout of course but in my view, that move would be an outlier at the current stage. The alts continue to act quite well and the space feels bid. I would check those Fomo feelings if you have them, as they tend to be good clues on sentiment.
As I said a few times, I maintain the bullish view ever since we cracked 27.5 and the odds of higher prices remain. Pending corrections, the upper targets are 40, then 45k. I would remind you of the cycle and seasonality charts from past posts as a few headwinds for the rest of the year.
Daily video coming up next,
See you tomorrow - trade well,
Cris
email: ewcafe@pm.me