Note: The counts on the right edge are real-time, and they are prone to adjustments as price action develops. Elliott Wave has a fluid approach, is evidence-based, and requires constant monitoring of certain thresholds.
In the counts below, this (( )) = circle on chart
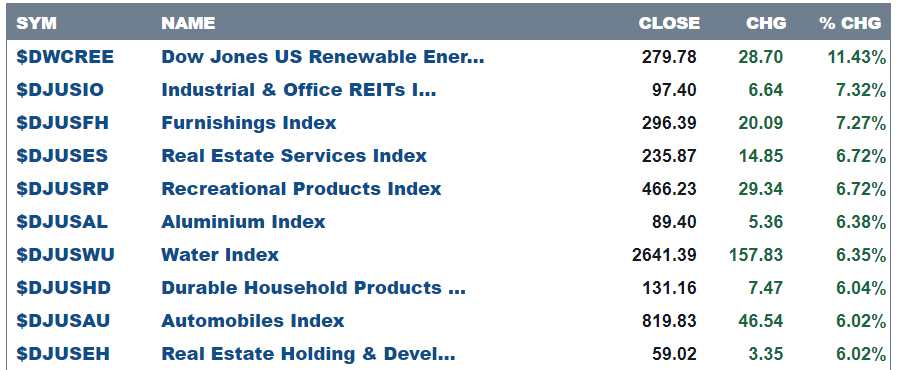
Here are today’s top 10 best performers out of 104 industries.
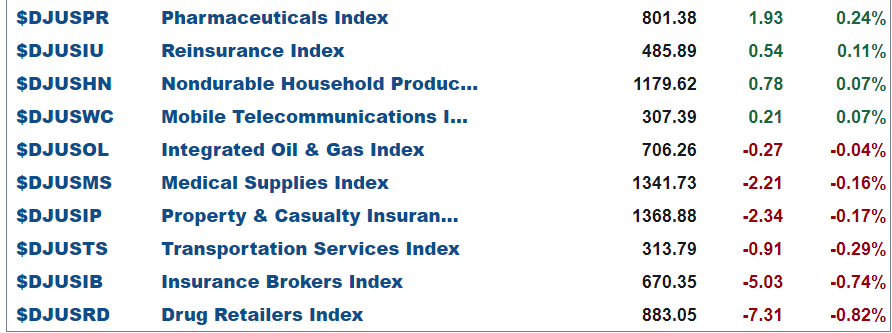
98 positive closes and 6 negative.
and bottom 10 …
SP500
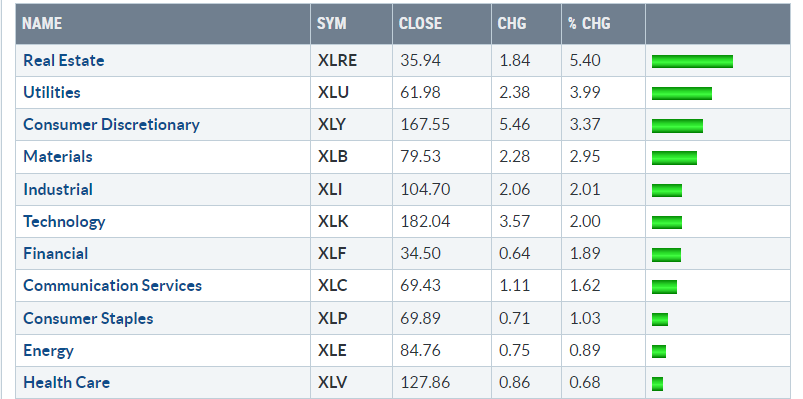
One of the best days of the year for indices, following a lower than expected CPI readings. The most rate-sensitive sectors, like real estate and utilities, gained +5.4% and 3.99%. This is based not only on declines in yields but also on the expectation of a Fed that would have fewer reasons to hike any further. I guess the market prices in that if the Fed doesn't raise, then it must be closer to cutting, hence these rate-sensitive sectors had an outstanding day. You add to that the fact the small caps were seriously hurt this year, and you get a +5.47% rally today alone in that area of the market.
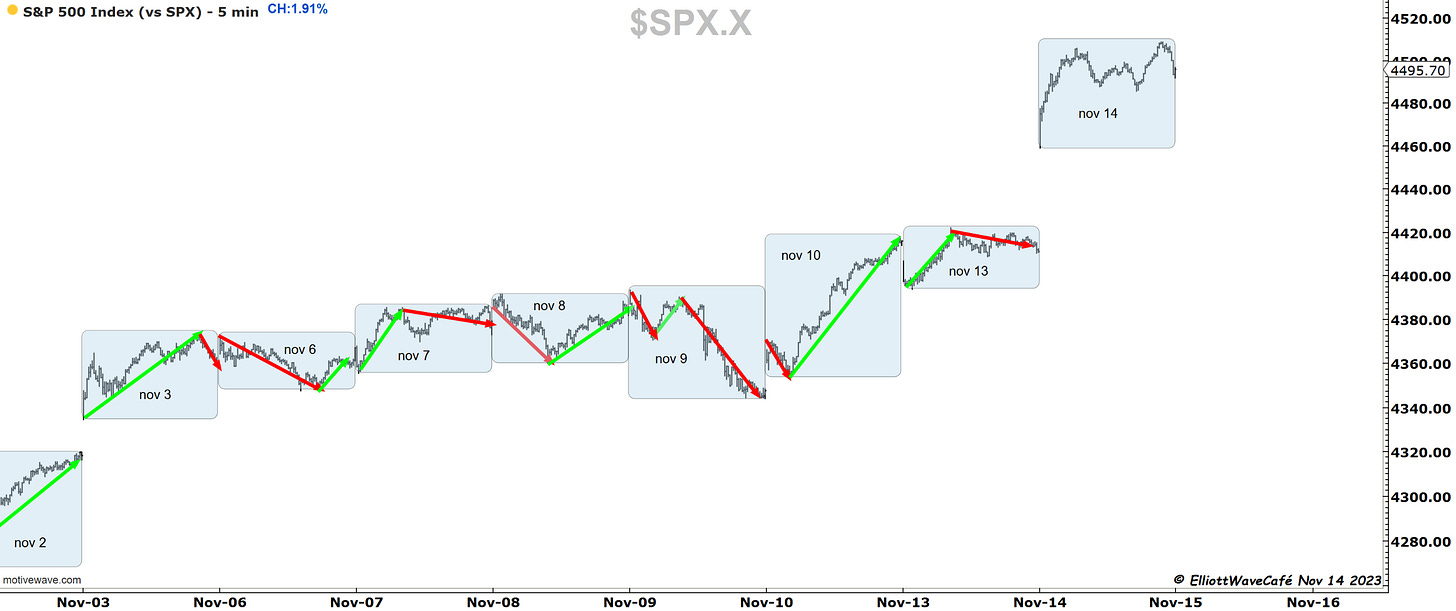
Here is today’s price action displayed on the 5 min charts. Large gap higher after CPI, followed by acceleration and a slight stalling into the close.
Here are the gaps that have been left behind since the late Oct lows. Usually, we get exhaustion gaps in fifth waves, however, if this is the beginning of a larger third wave, then this becomes a runaway gap. The other two types of gaps out there are common gaps and breakaway gaps. There is literature out there that explains how they work.
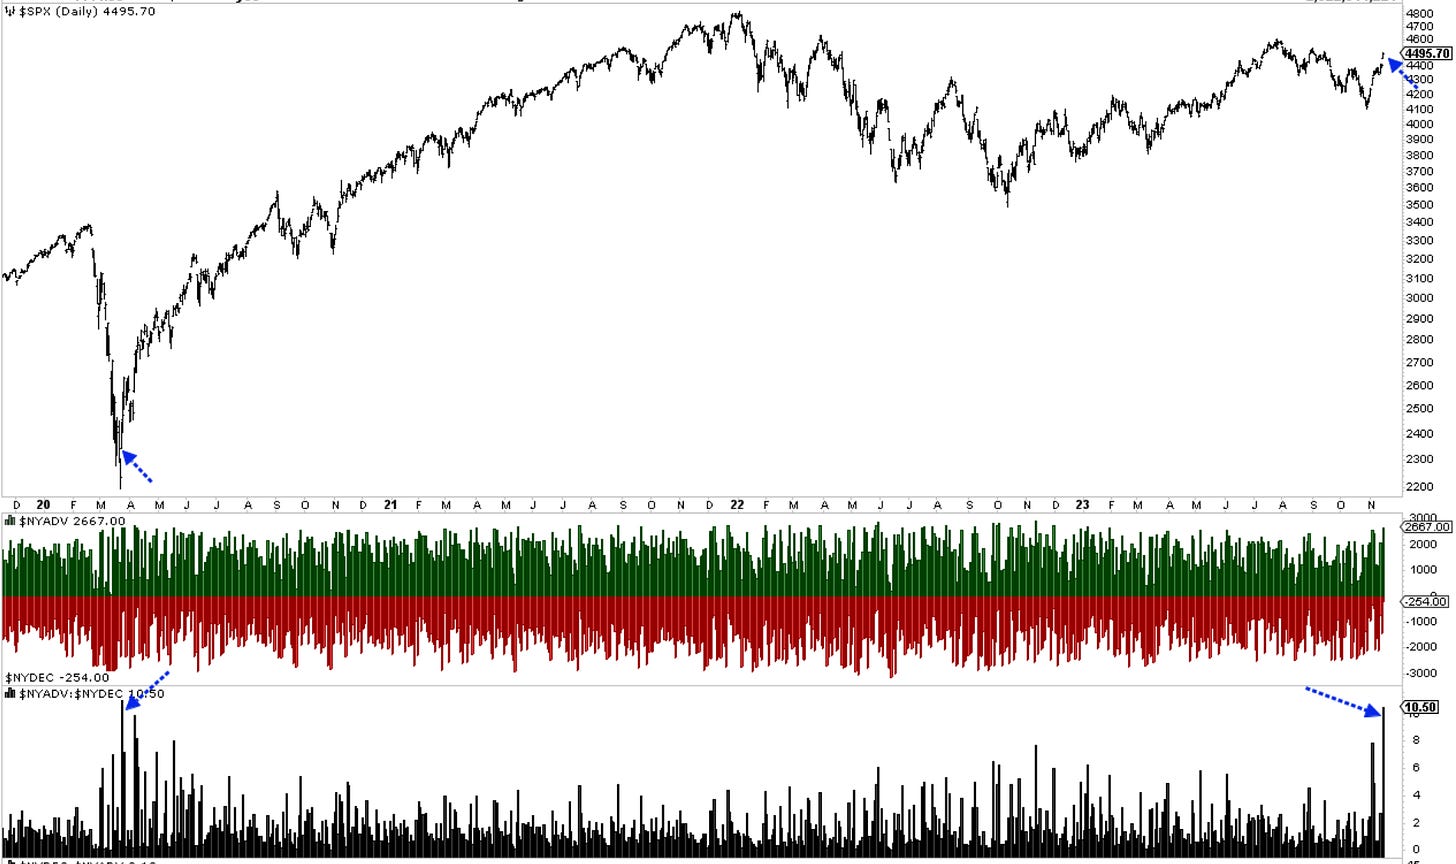
Today was the strongest advancing day vs declining since the lows of COVID-19. 10 times as many stocks advanced vs declined. Now this does not come from the lows but rather after an already strong advance so far this month. There is only one thing that comes to mind when seeing this type of price action. Positioning. As I was saying in the posts at the end of October, when we started positioning long, the market was quite bearish and flashing plenty of signals of turnaround into strong seasonality. However, I really did not expect such a strong move to come to fruition that fast.
The strong put buying seen during this rally has finally started to diminish after today’s action. Bears capitulation in mass. It increased somewhat through the day but at much lower rates than previously observed. This is usually a sign that markets cleaned up those bearish bets and will likely be due for consolidation or even correction.
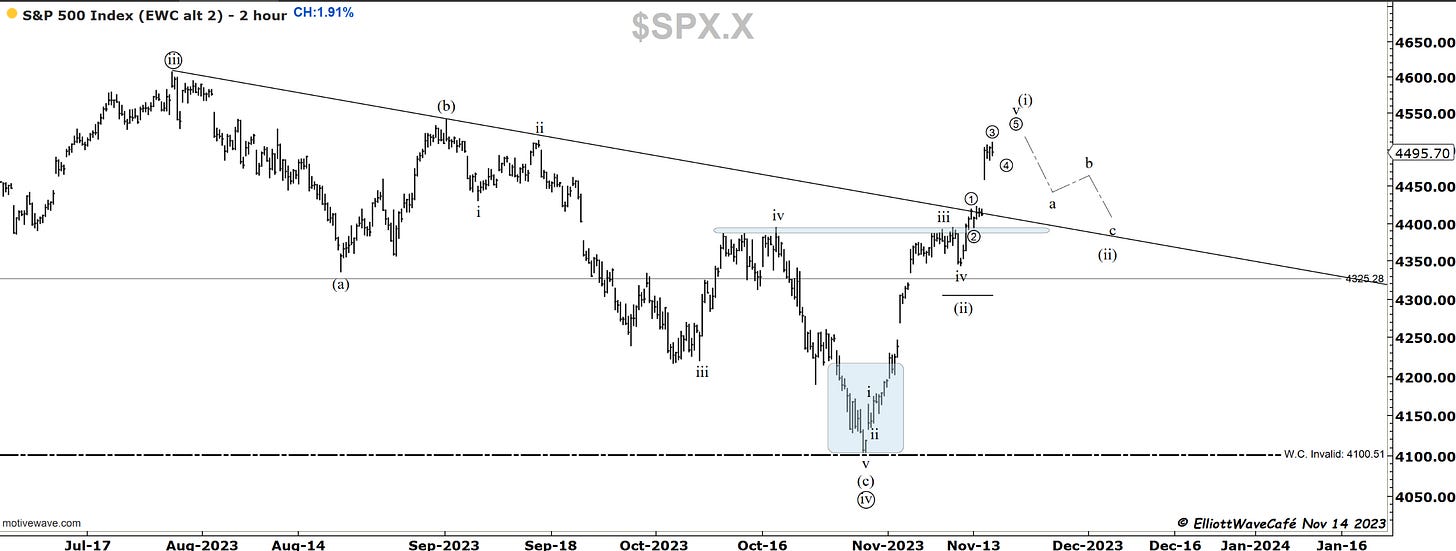
The index broke with conviction above the declining trendline, suggesting that we could actually be in wave (iii) already. You can see that placed as an alternate below the wave iv line. Like I said yesterday, it would be a very short wave (ii) compared to wave (i). My sense continues to be that a proper wave (ii) is still to be expected, via a retest of the trendline or even a brief break below that. Bids will likely be placed by traders at a convergence of the broken horizontal line with the sloped one.
Our main count continues to remain bullish from the wave ((iv)) low and looking for all-time highs next year. A straight shot from here to ATH without proper wave sequence it’s quite a stretch and not a bet I want to make.
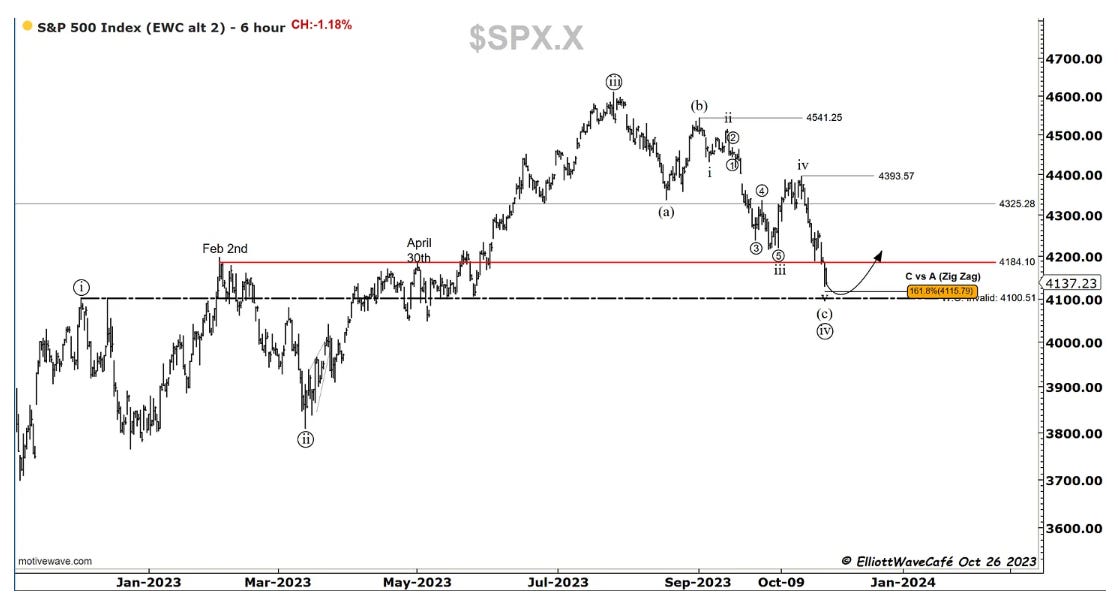
Here is the chart and post from Oct 26th before lows were made. Click here.
Nasdaq100
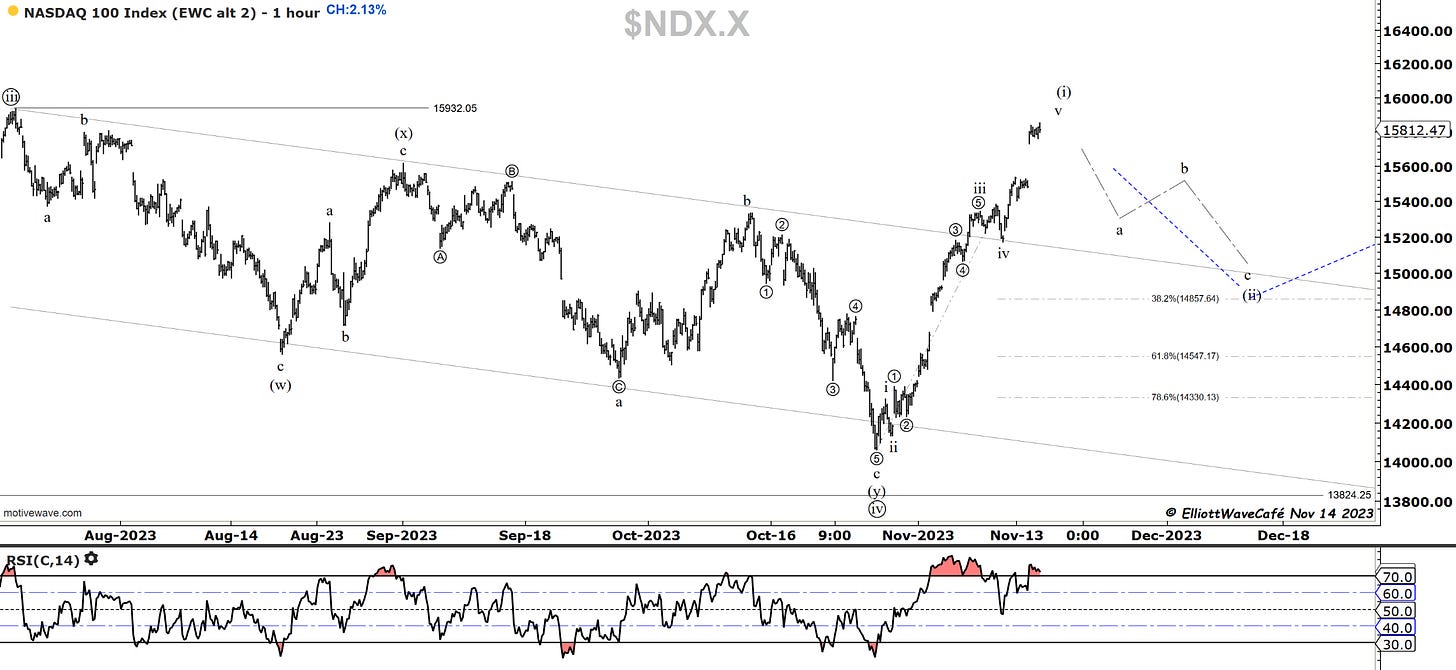
A +2.13% rally carried this index close to the highs from the end of July near 15,932. Just like in the spiders, it’s possible that wave iv was a wave (ii) instead. As strong and relentless as this rally feels, I am assigning a higher chance for a 5th wave presence rather than a third. The next point that I will be looking to get involved would be on a wave (ii) throwback if given a chance of a retest.
Here is the (i) (ii) idea with a kiss back towards the broken trendline before a larger wave (iii) can ensue.
RUSSELL 2000
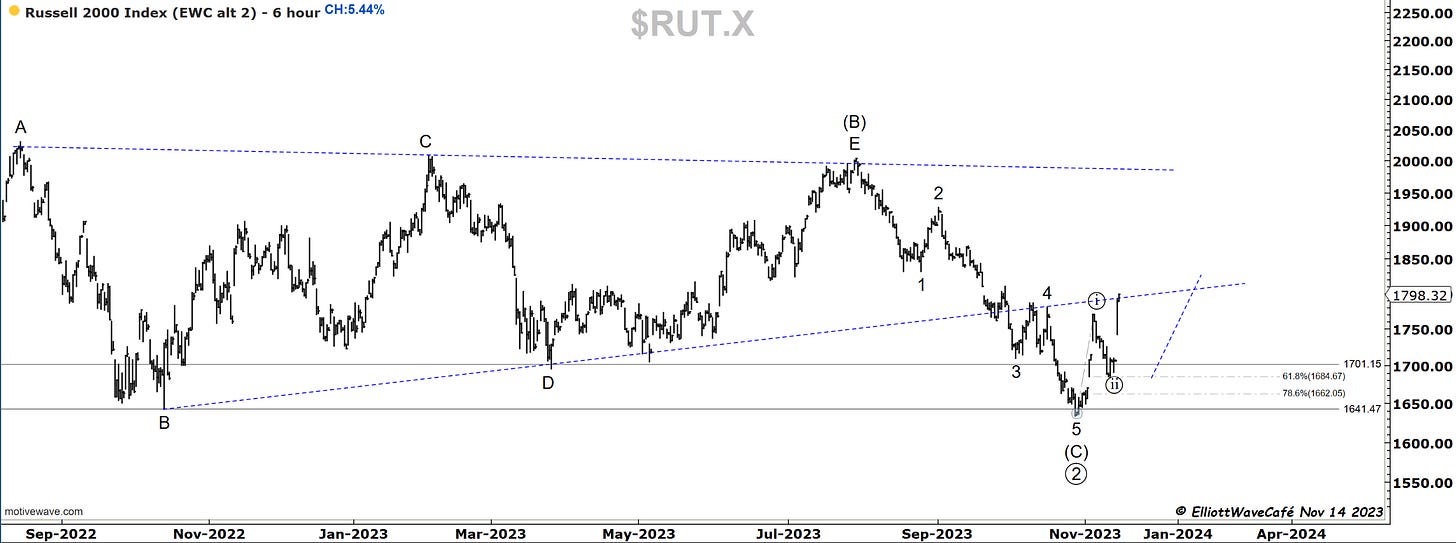
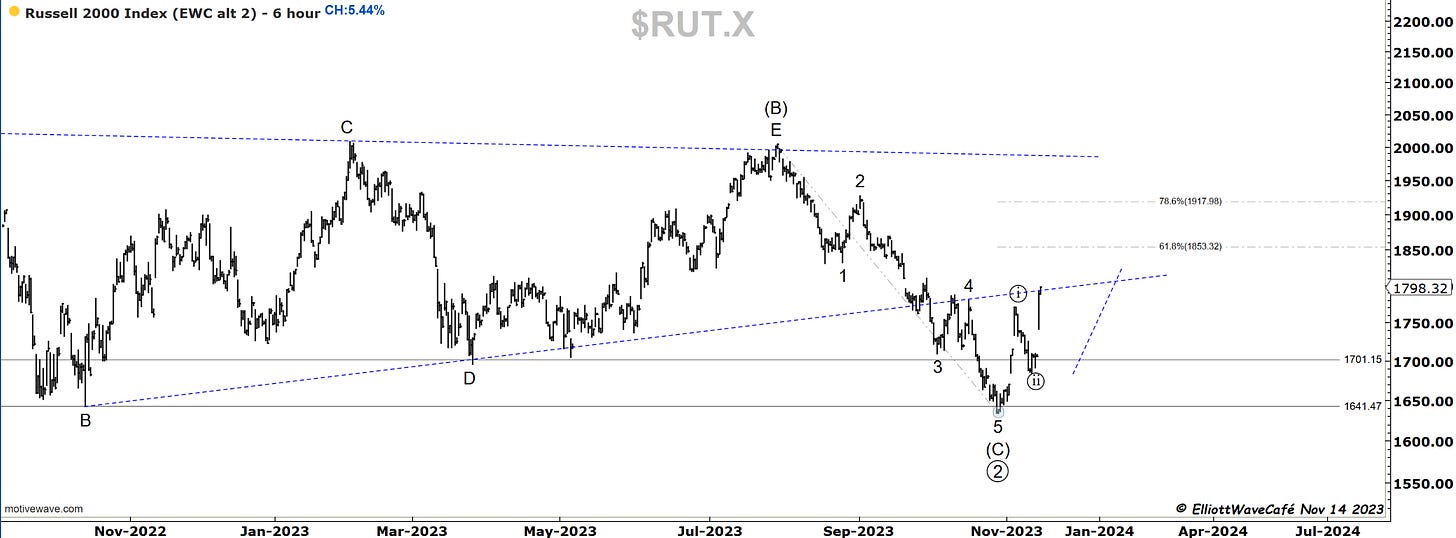
The only index that followed the suggested script was the small caps index. That 61.8% retrace proved accurate and it was followed by an impressive rally above wave ((i)) high. As mentioned several times in prior updates, this could be the beginning of a larger 3rd wave or just an ABC three-wave sequence followed by another leg lower.
The 61.8% retrace of the entire decline comes in at 1853 and it would be the first level to monitor on further advances. Above those levels it will be very for the bears to maintain their stance. Another strong clue would be a 5-wave advance which is yet to be present. We will monitor that here, day by day.
Dow30
Approaching the next resistance in the Dow and looking for a wave ii throwback.
Here is the larger count if you haven’t seen it already.
US Dollar and Yields
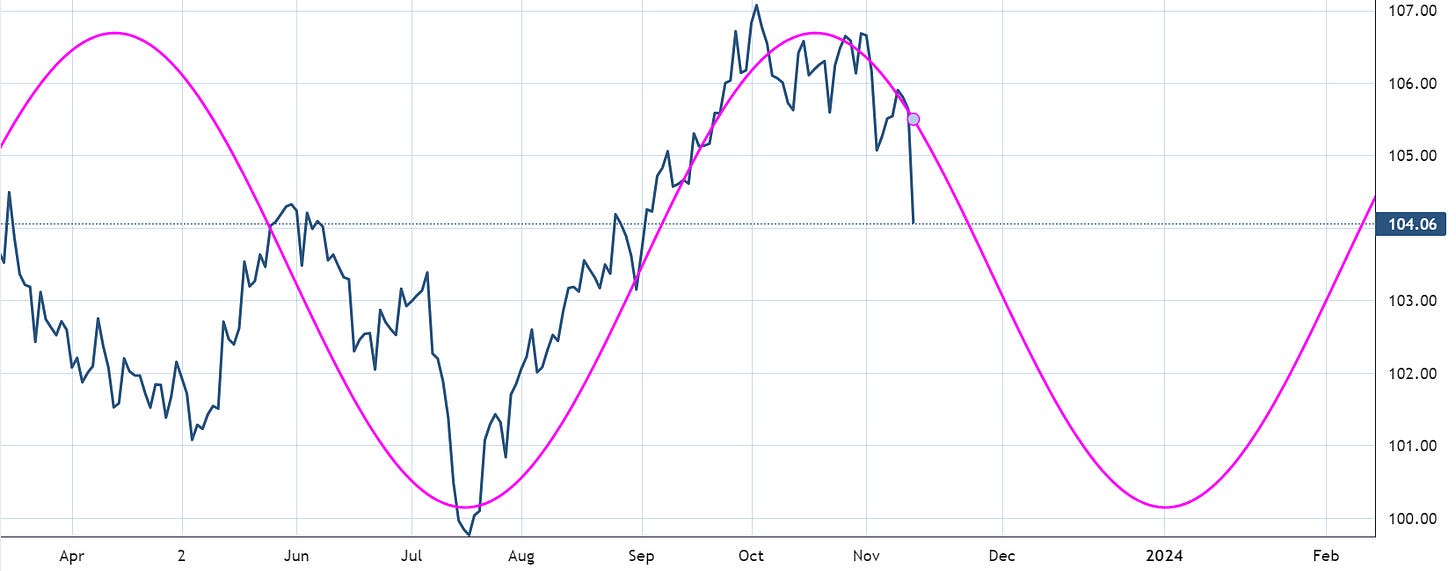
The dollar has finally broken below 105 levels. Along with the drop in yields it was a perfect storm for the risk assets. Few sessions ago I talked about a possible 1,2 1,2 and the need for reaction lower if that would be the case. Today’s drop sure feels like that might be the correct path.
I haven’t shown this chart since mid-October. It shows the count variations either via a flat in 2/B complete or an ongoing 2/B with waves ((b)) and ((c)) still developing. Both should result in lower dollar ahead in 2024.
Here is the current active 134-day Dollar cycle.
We could argue that an impulsive decline has been established in yields. A 3-wave setback should lead to the next leg lower. This correction in yields would be a headwind for risk assets and would coincide with that corrective leg we’re expecting there as well.
Gold
Today’s drop in the dollar was mimicked by a rally in gold. Since we have penetrated the lows of wave i, labeling this rally as wave iv would be incorrect. It’s possible that wave (a) has already been completed. Since the decline from highs appears as a motive, we still need a (b) wave to form followed by some sort of (c ) to complete (ii).
Bitcoin
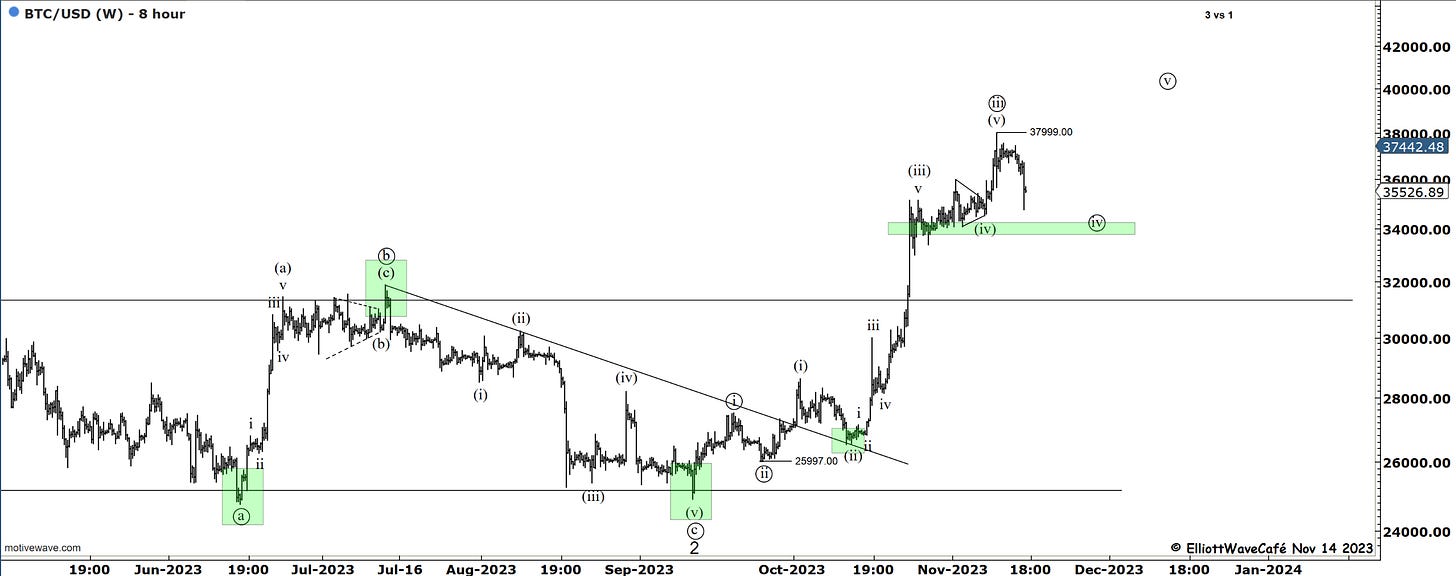
Prior BTC comments remain. Today’s drop is in line with expectations. Support below at prior wave (iv). Once wave ((iv)) runs its course, wave ((v)) will begin.
BTC buyers have dried up a bit, and there was no power to take this any higher over the weekend. Stalling after that thrust higher in wave (v) increases the odds of that wave being accurate. I would expect at least a return back toward the prior wave (iv) as part of a corrective wave ((iv)). Even tho the sentiment is not at super laser eyes extremes, it was high enough at the end of the week, by my monitoring of social media and other outlets, to warrant some pullbacks near term.
Here is a bit of a count variation over the next couple of months, that points sideways to down in a series of 4th waves.
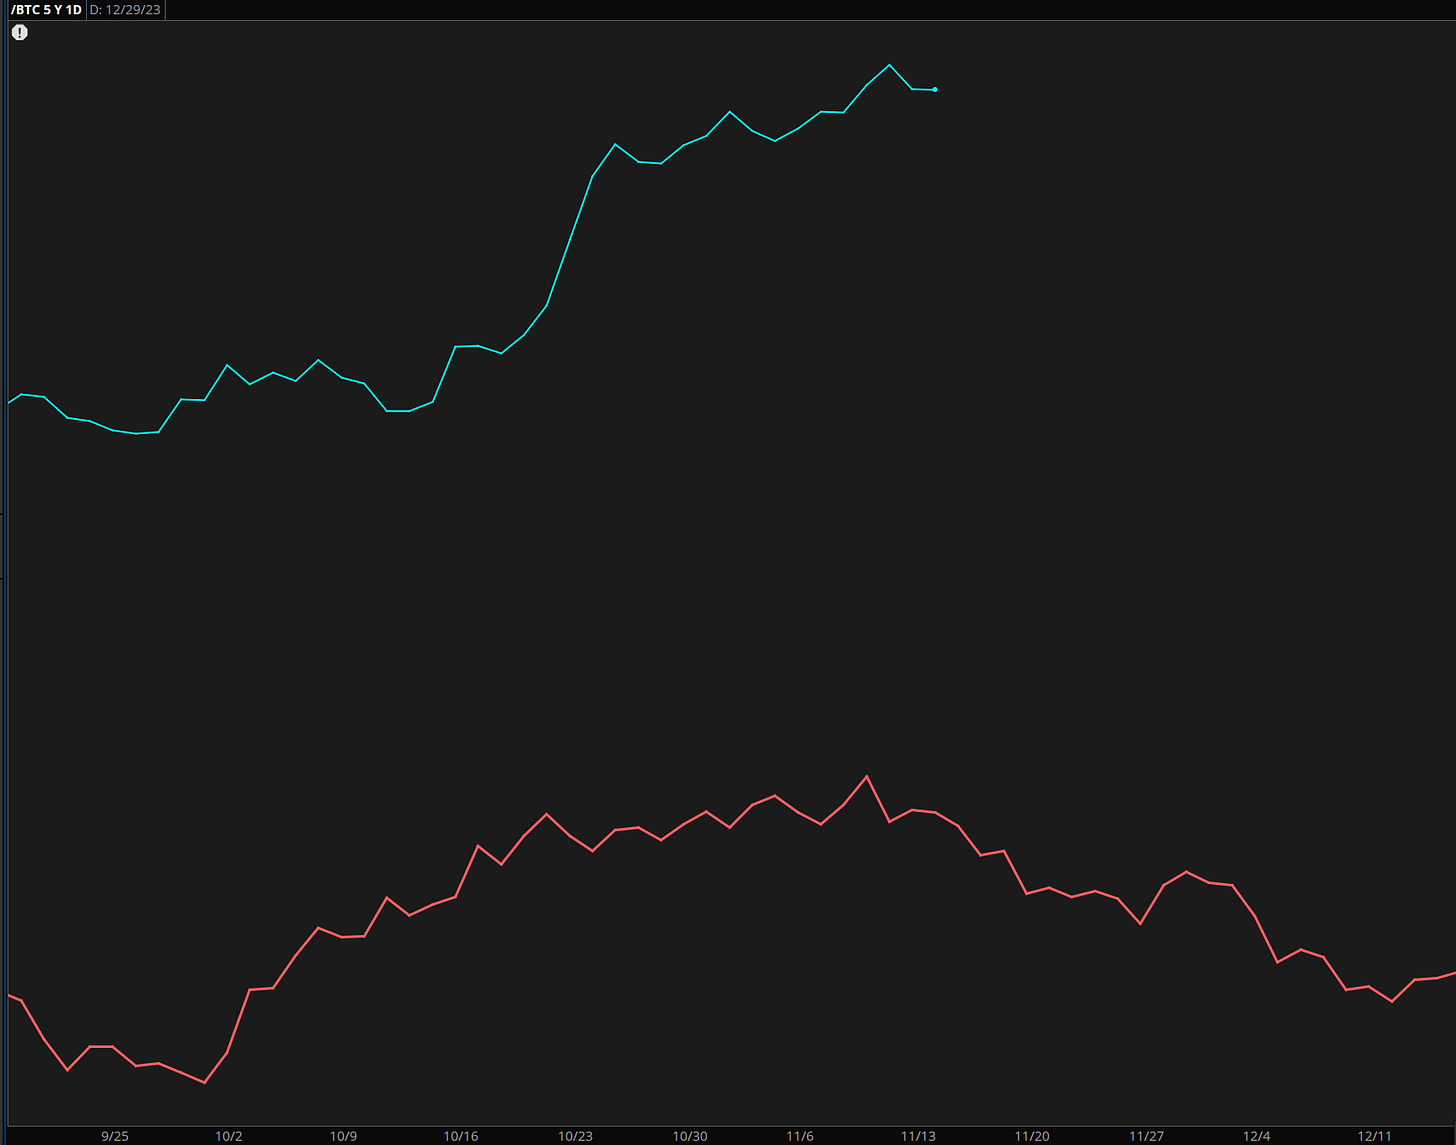
Once again BTC seasonality until roughly mid-December.
Daily video coming up next for members,
Have a great day wherever you are! - trade well, and don’t forget to subscribe and drop a like if this letter helps you in any way.
email: ewcafe@pm.me

