
The Daily Drip
Core markets charts updates and commentary
Note: The counts on the right edge are real-time, and they are prone to adjustments as price action develops. Elliott Wave has a fluid approach, is evidence-based, and requires constant monitoring of certain thresholds.
In the counts below, this (( )) = circle on chart
SP500
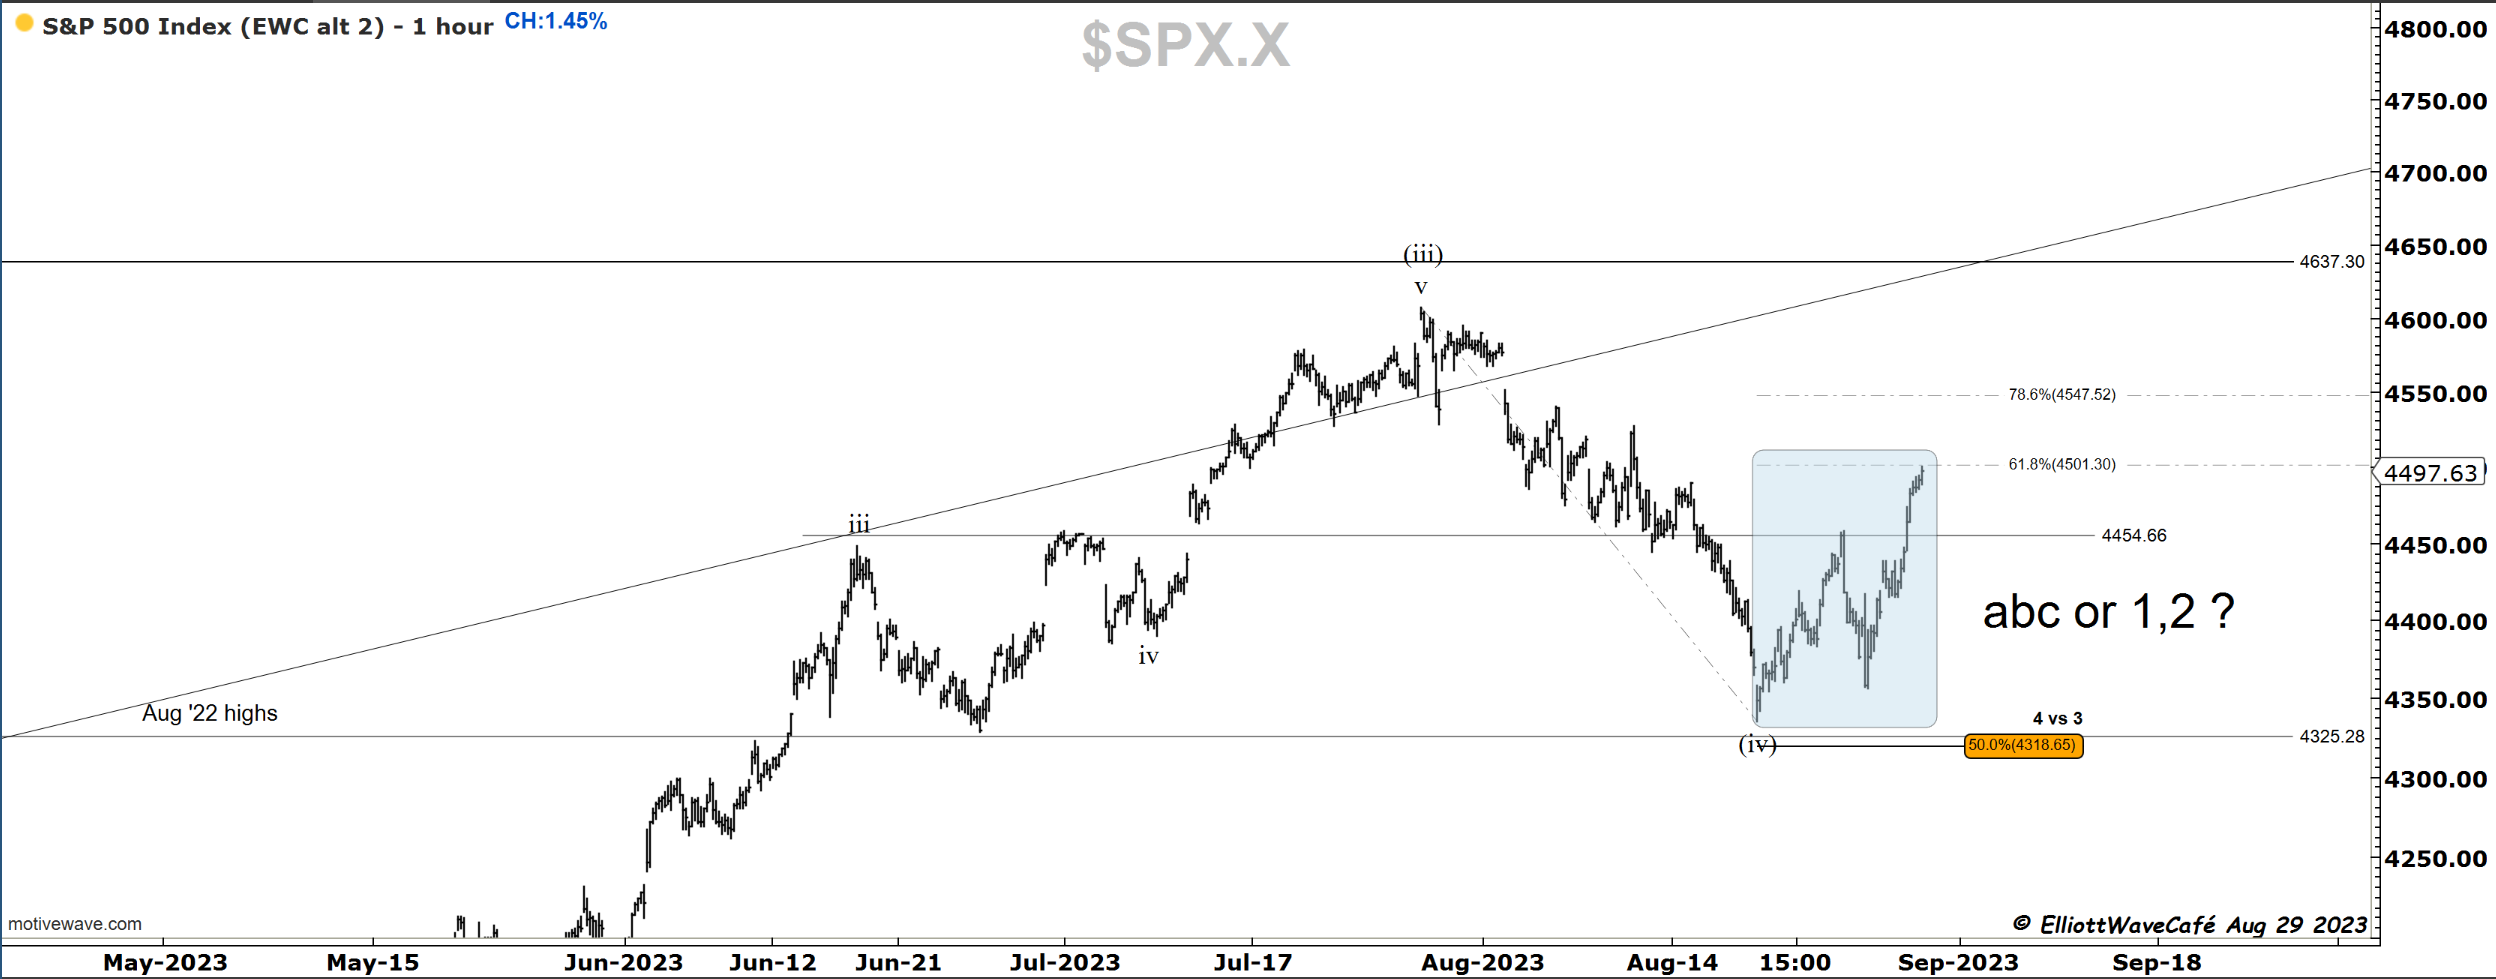
Impressive rally today of +1.45%. It ran above the resistance lines mentioned yesterday and hit 61.8% of the August decline. The question we now face is, is this a 3-wave rally in ABC or the beginning of the impulsive wave (v). It is always the case when impulsive moves get going. One clue is that we need to remain above 4440 on any throwbacks. The other is getting above 78.6% and keeping the buying momentum going.
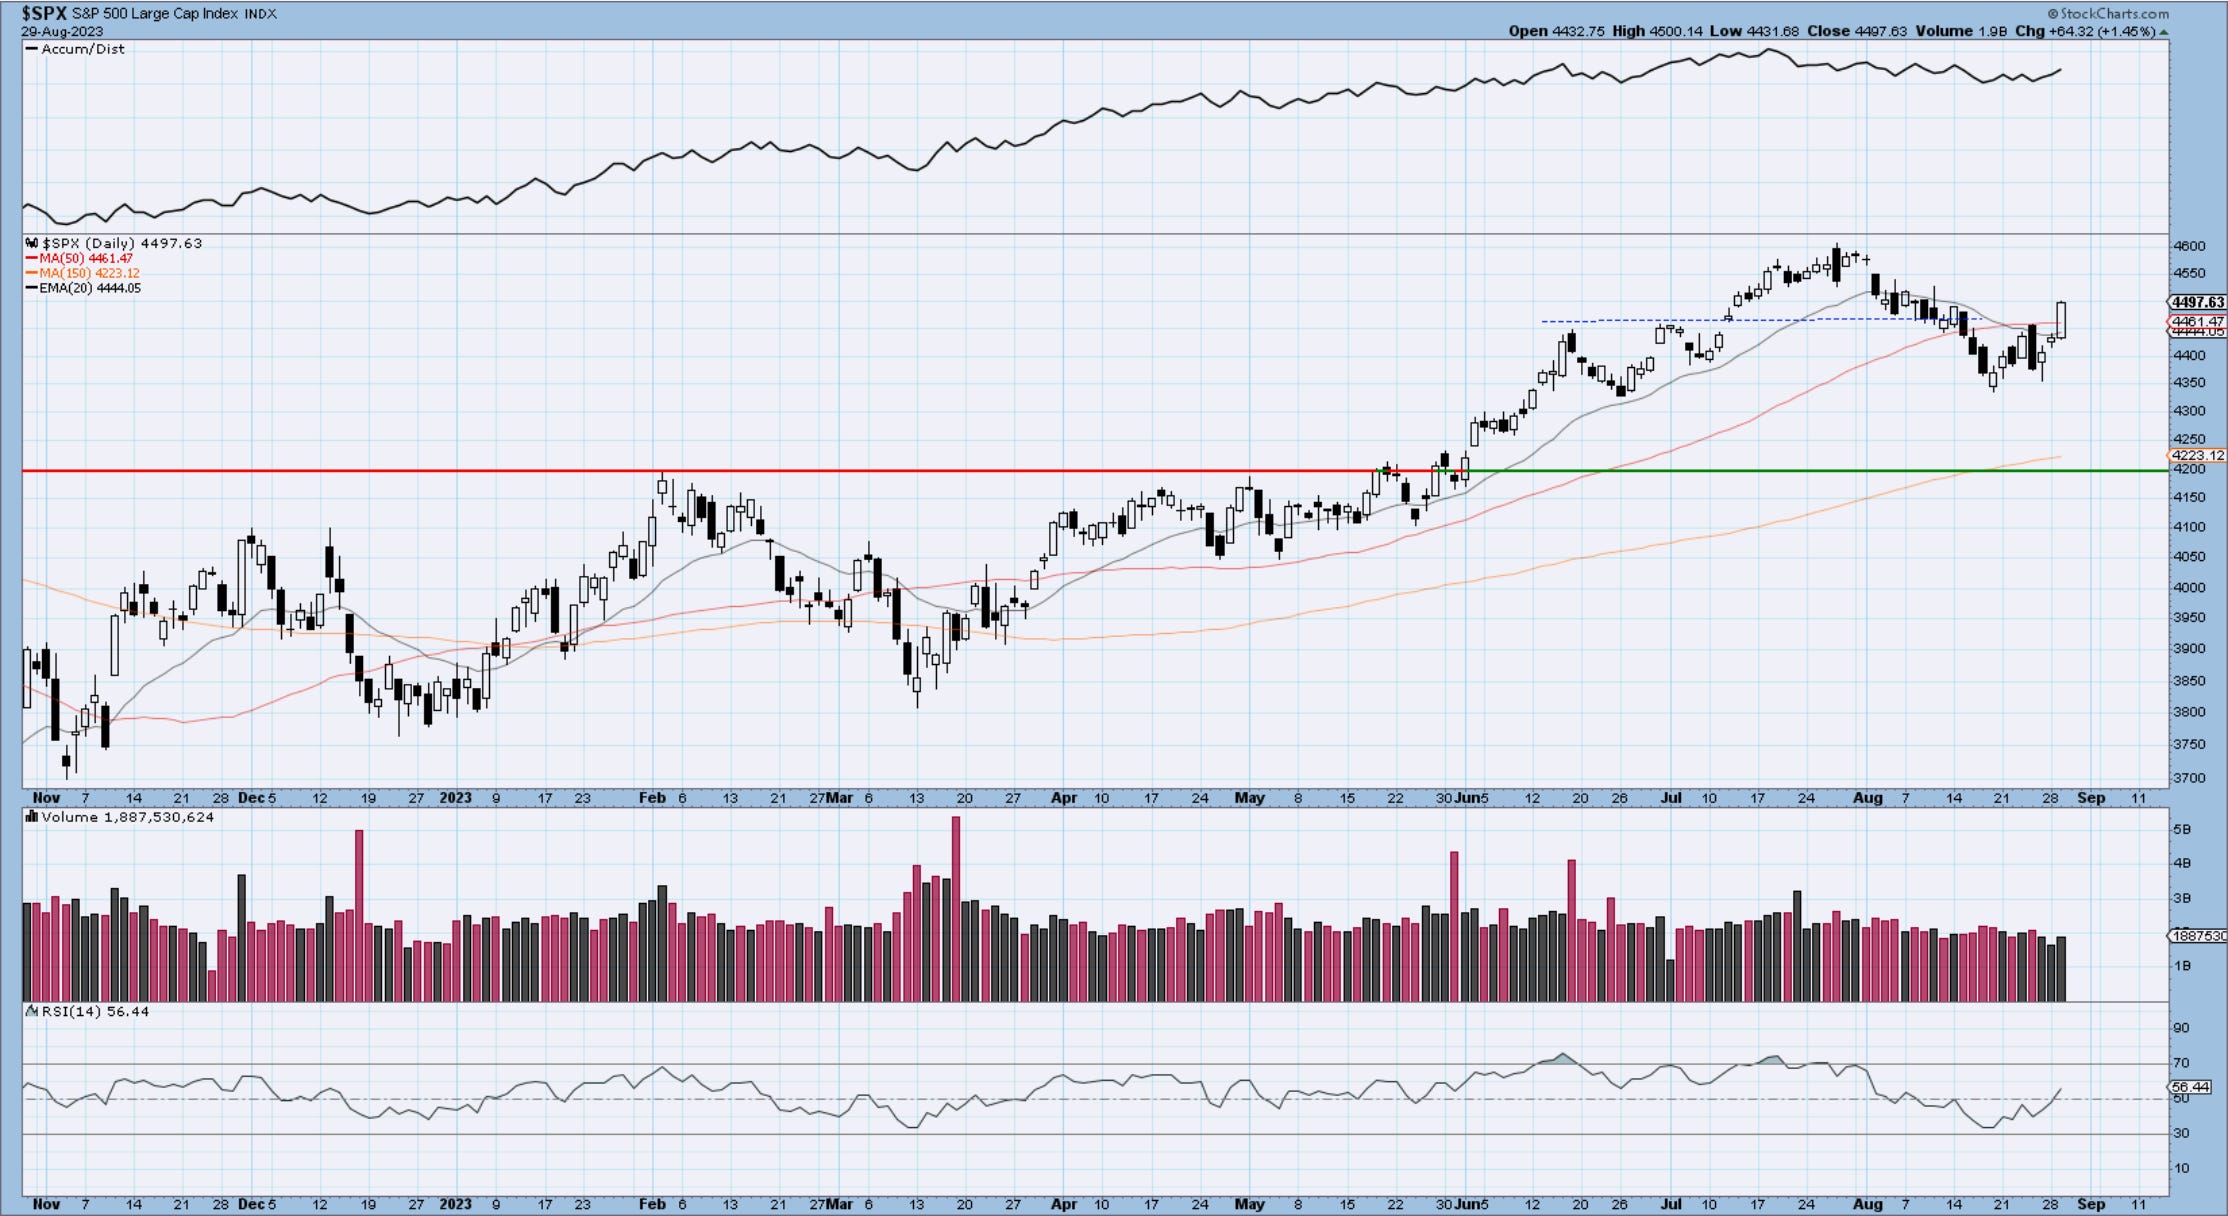
Notice the daily candle below, which is quite strong and above the levels mentioned previously. A black candle tomorrow, engulfing today would qualify as a failure and raise the odds that the latest move was nothing but a C wave. The volume picked up but is still a bit low as August draws to a close.
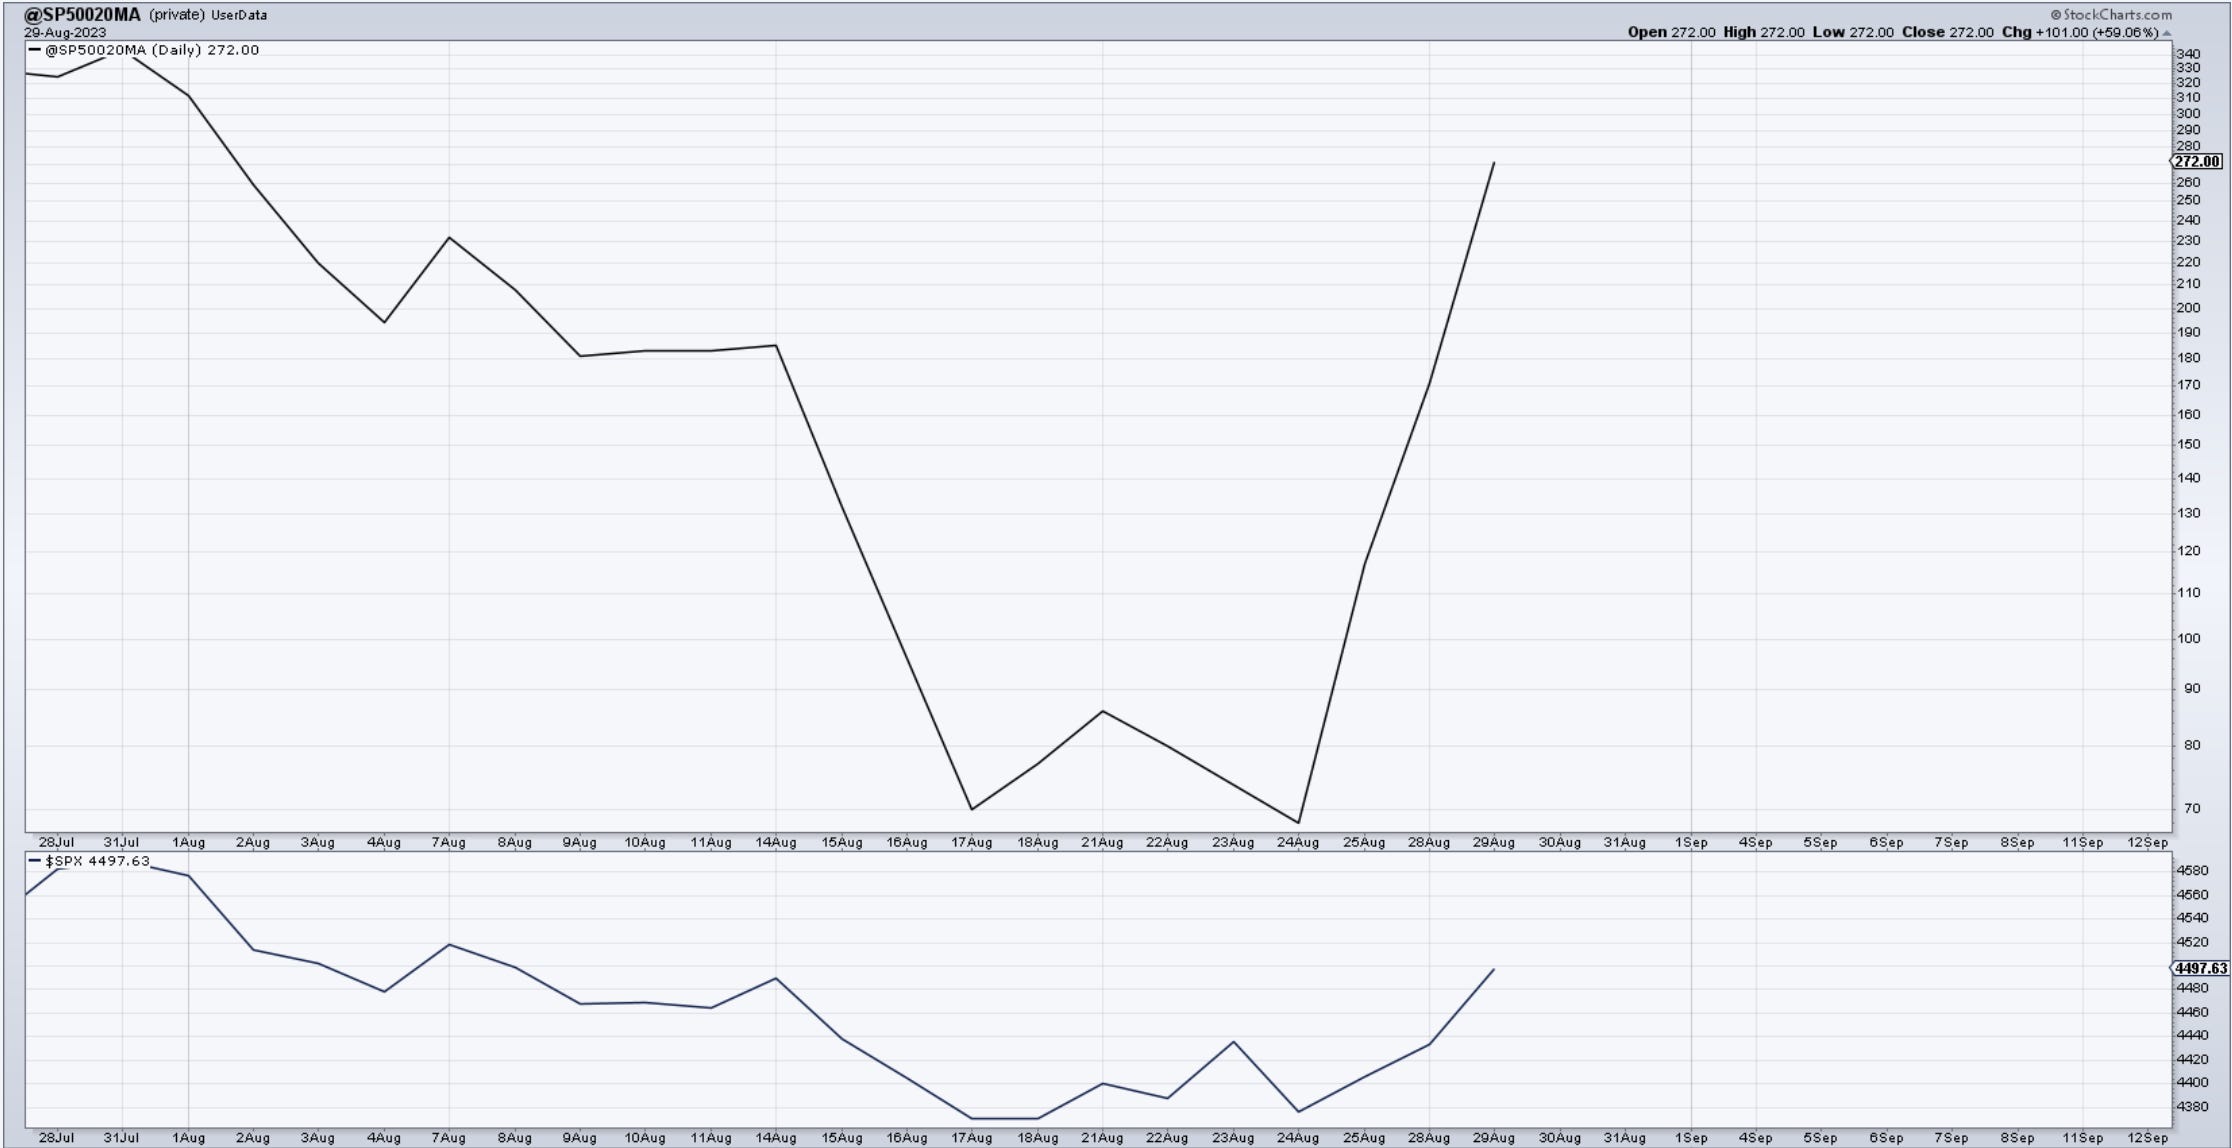
Today alone, we had over 100 stocks in the Sp500 climbing above their 200-day MA. (See the 3rd chart where I track this via private data). See the climb in stocks around Aug 18th vs the one now and how much more impressive it is. It’s a clue that this might be 3rd wave-type price action.
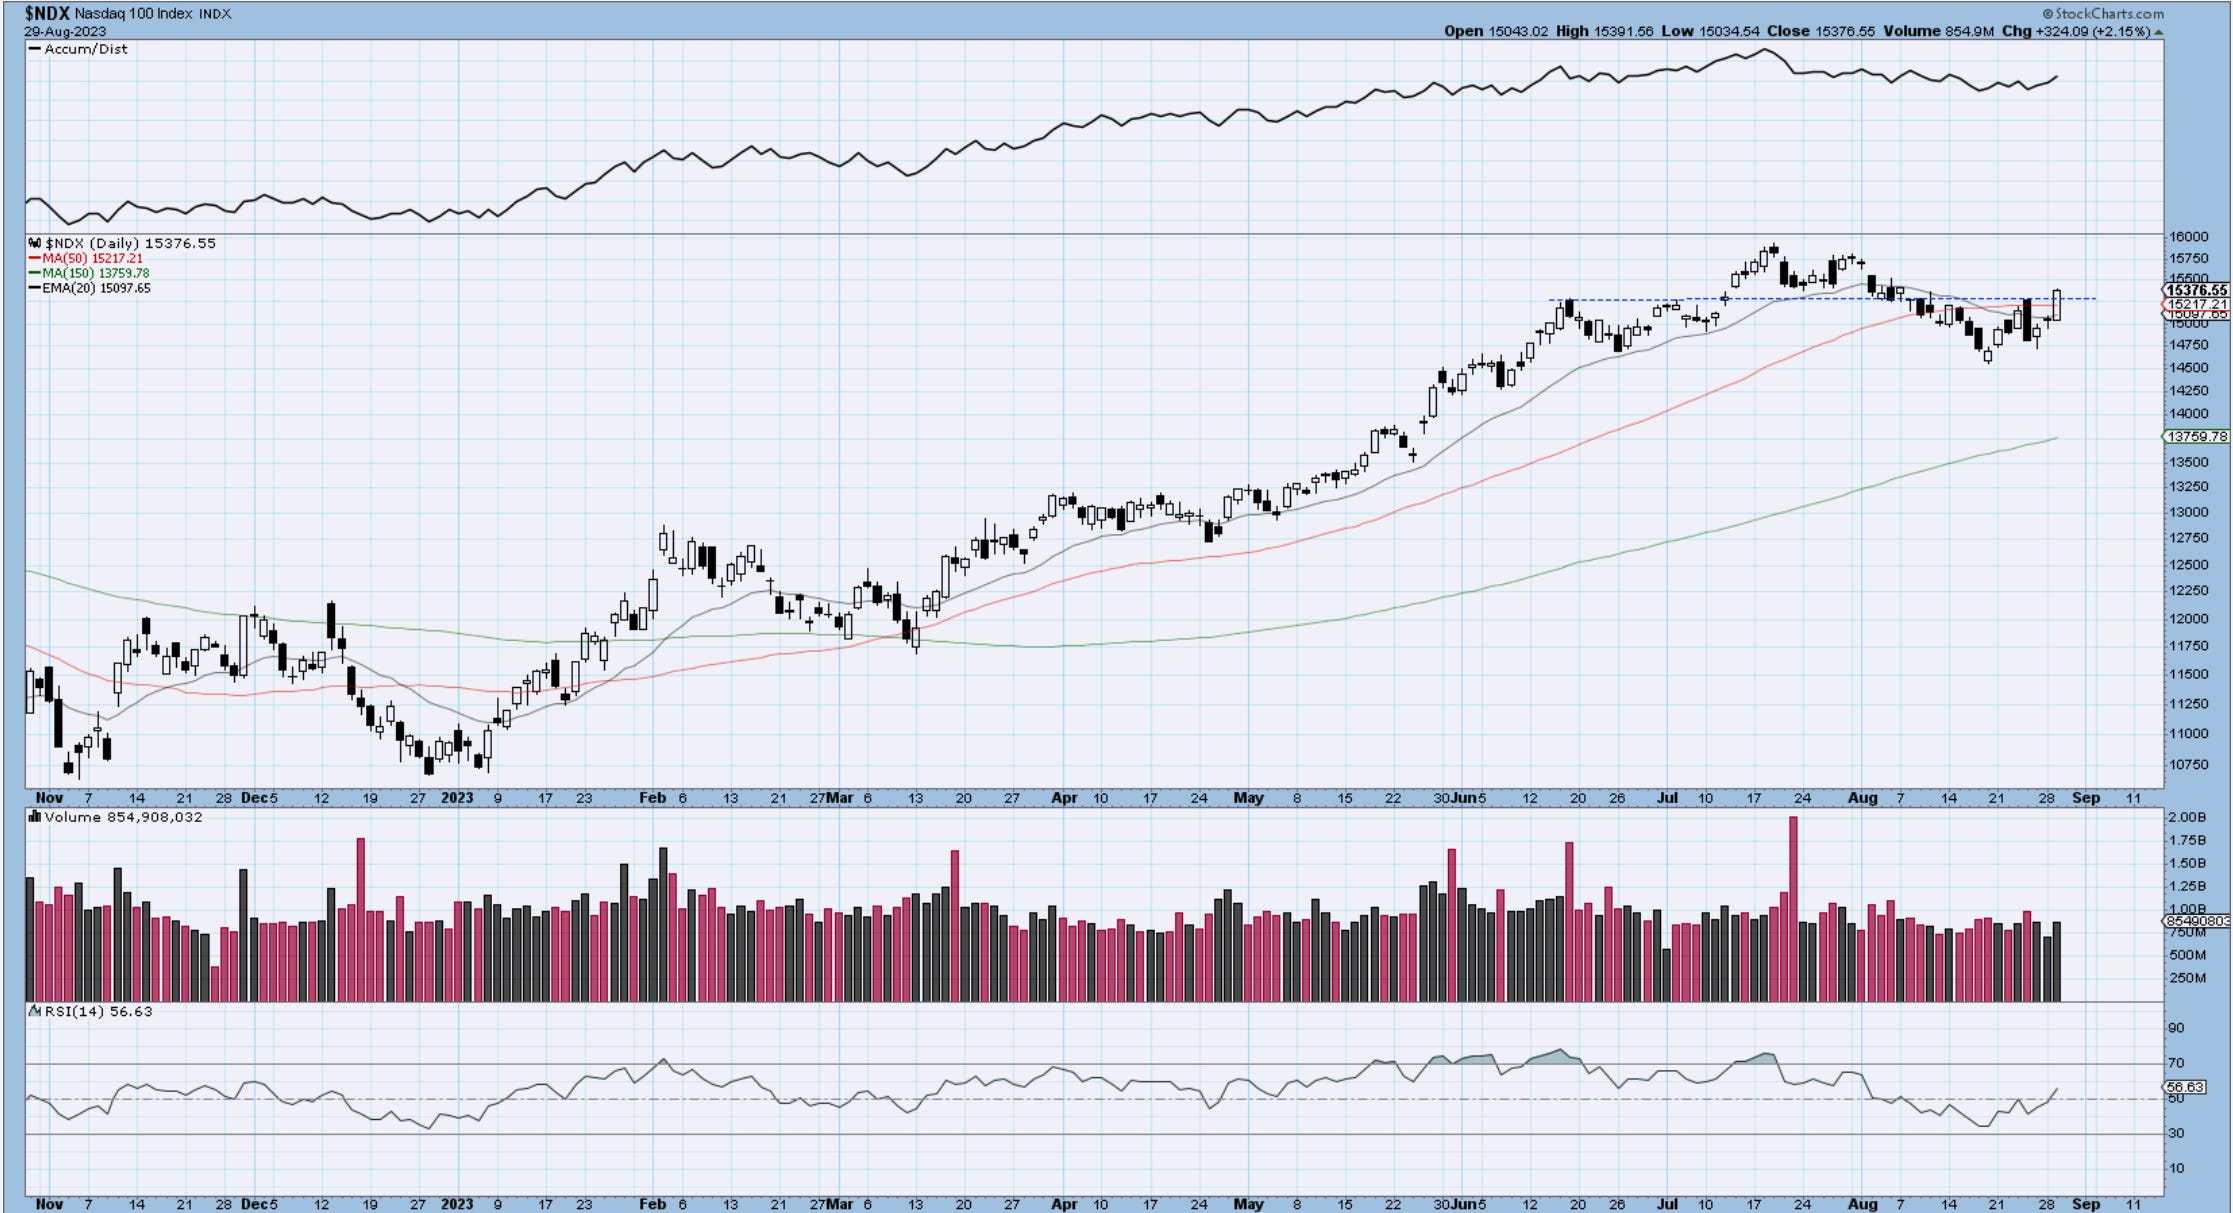
Nasdaq100
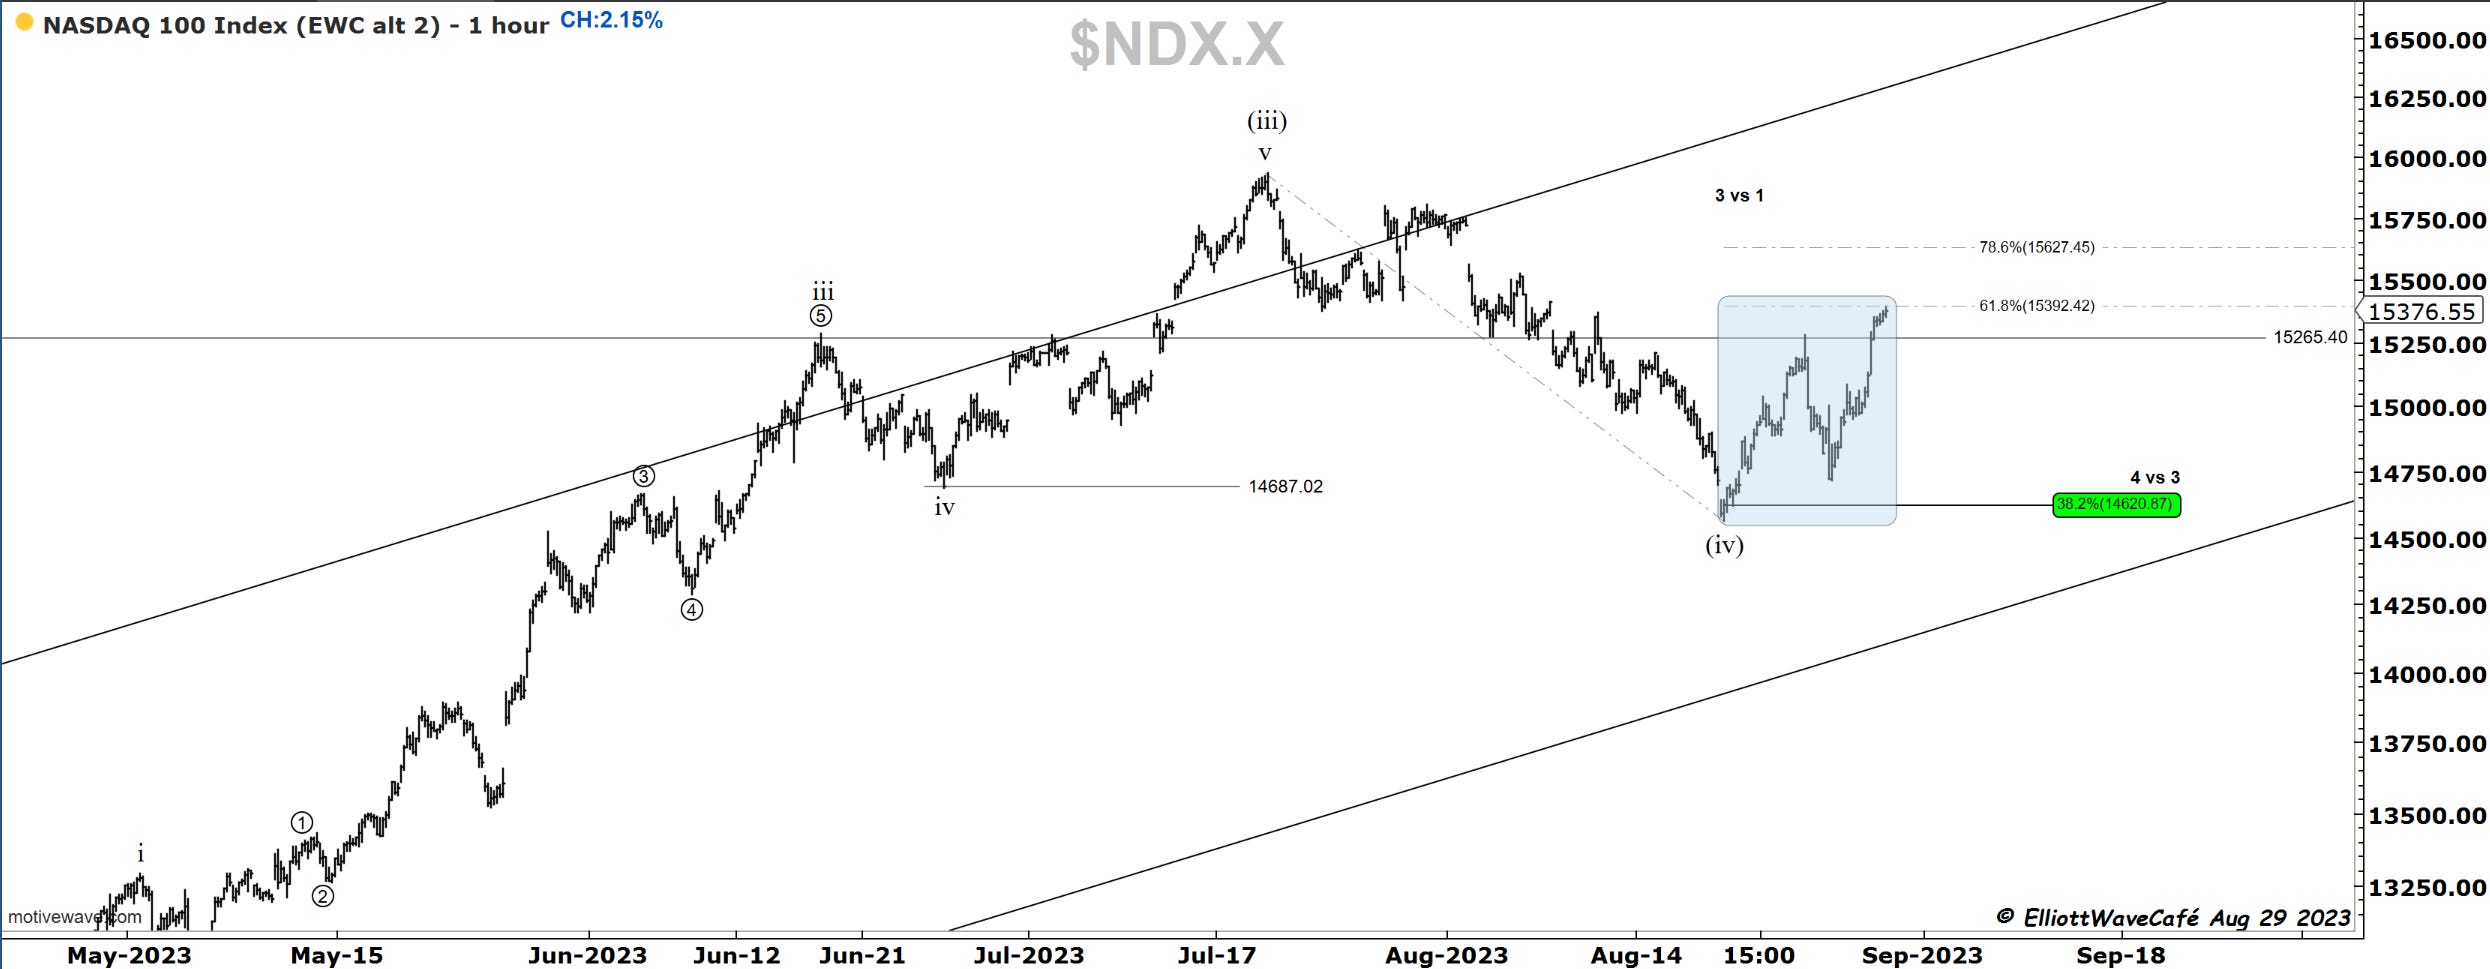
Take everything I said above and apply it to the Nasdaq 100. The moves are perfectly in sync. A close above resistance and the main averages we’re tracking. I have taken some partial profits today in the TQQQ leveraged long position that we built during the correction. In case this turns out to be a 3 wave corrective move, I’d like to at least get paid for this advance we expected. There is still exposure if we continue to move higher above 78.6%. See the 38.2% wave (iv) in the vicinity of the prior wave iv at smaller degree? It’s textbook EW retracement. This builds confidence, that a solid low was established and we’re on our way towards wace (v) above 16k.
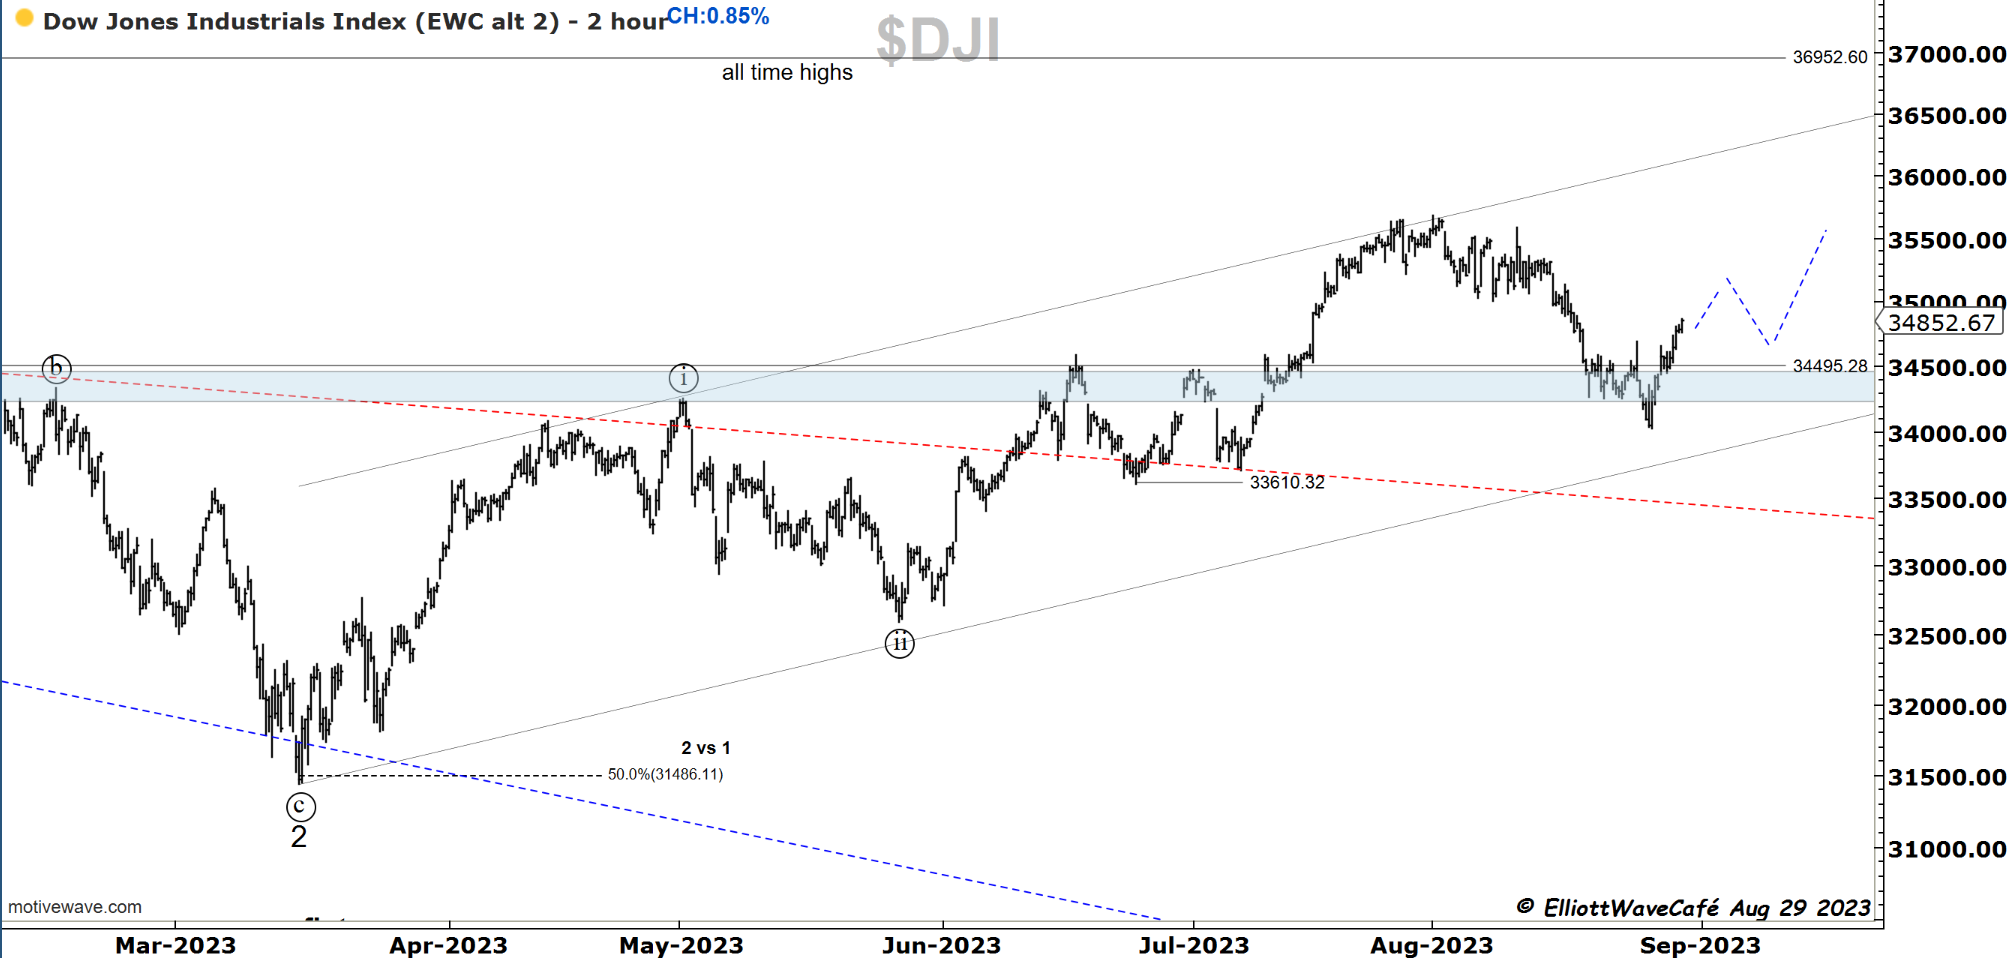
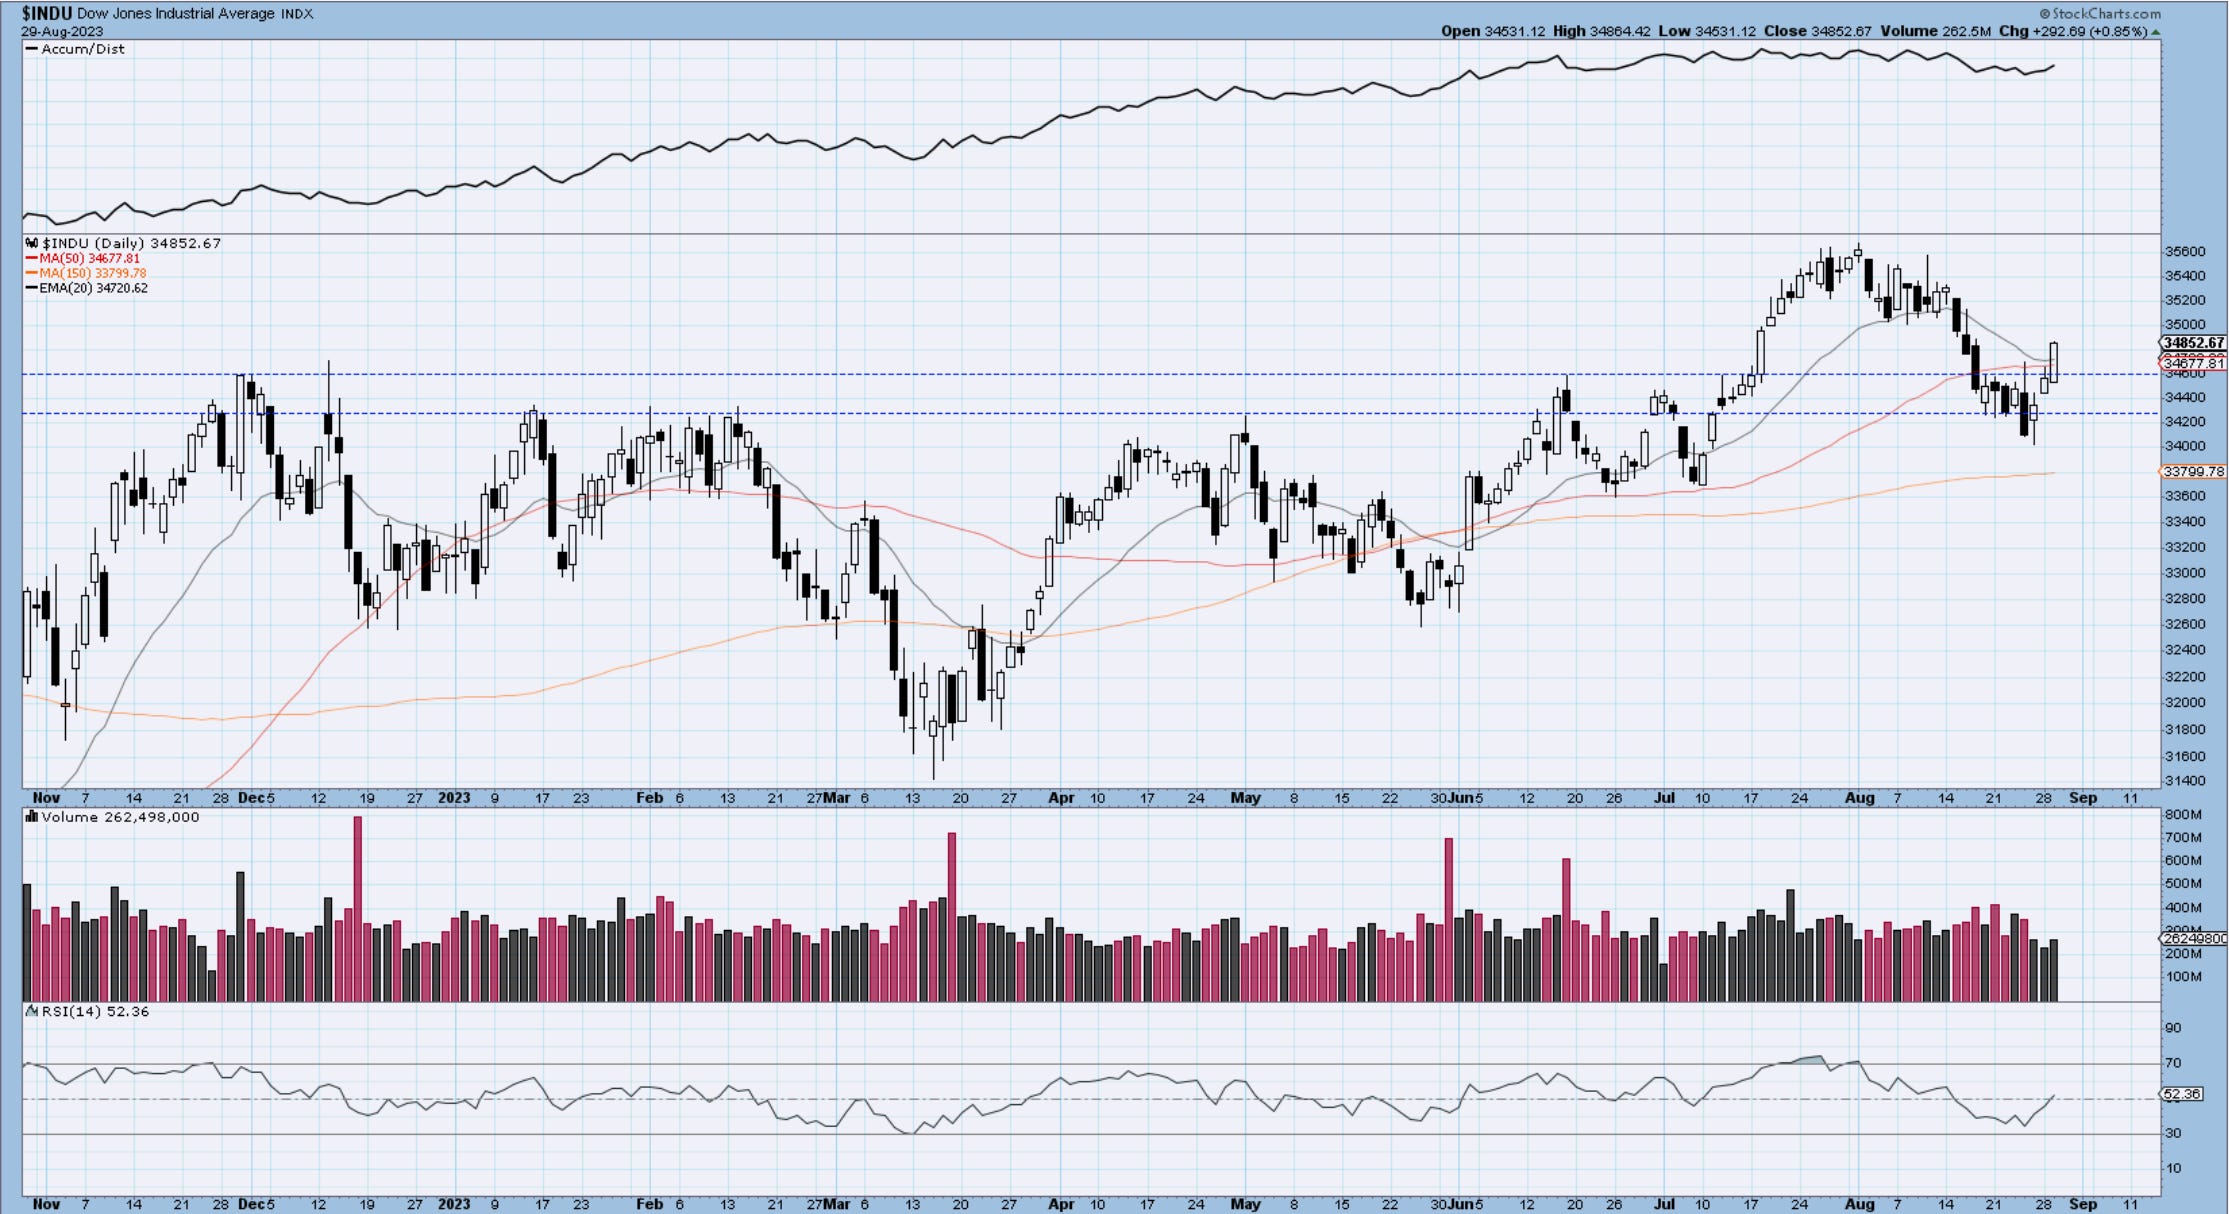
Dow30
This index is a bit trickier the way it’s been behaving. The count structure is muddy for now but at least trending on a higher high, higher low stair step. I would like to see it travel on the blue dotted line projection, hold 34500 on throwbacks and bounce higher. The move of the July highs seems a bit impulsive, so if we can survive without an ABC here, we can find ourselves very quickly to new ATH. Volume is still somewhat below average.
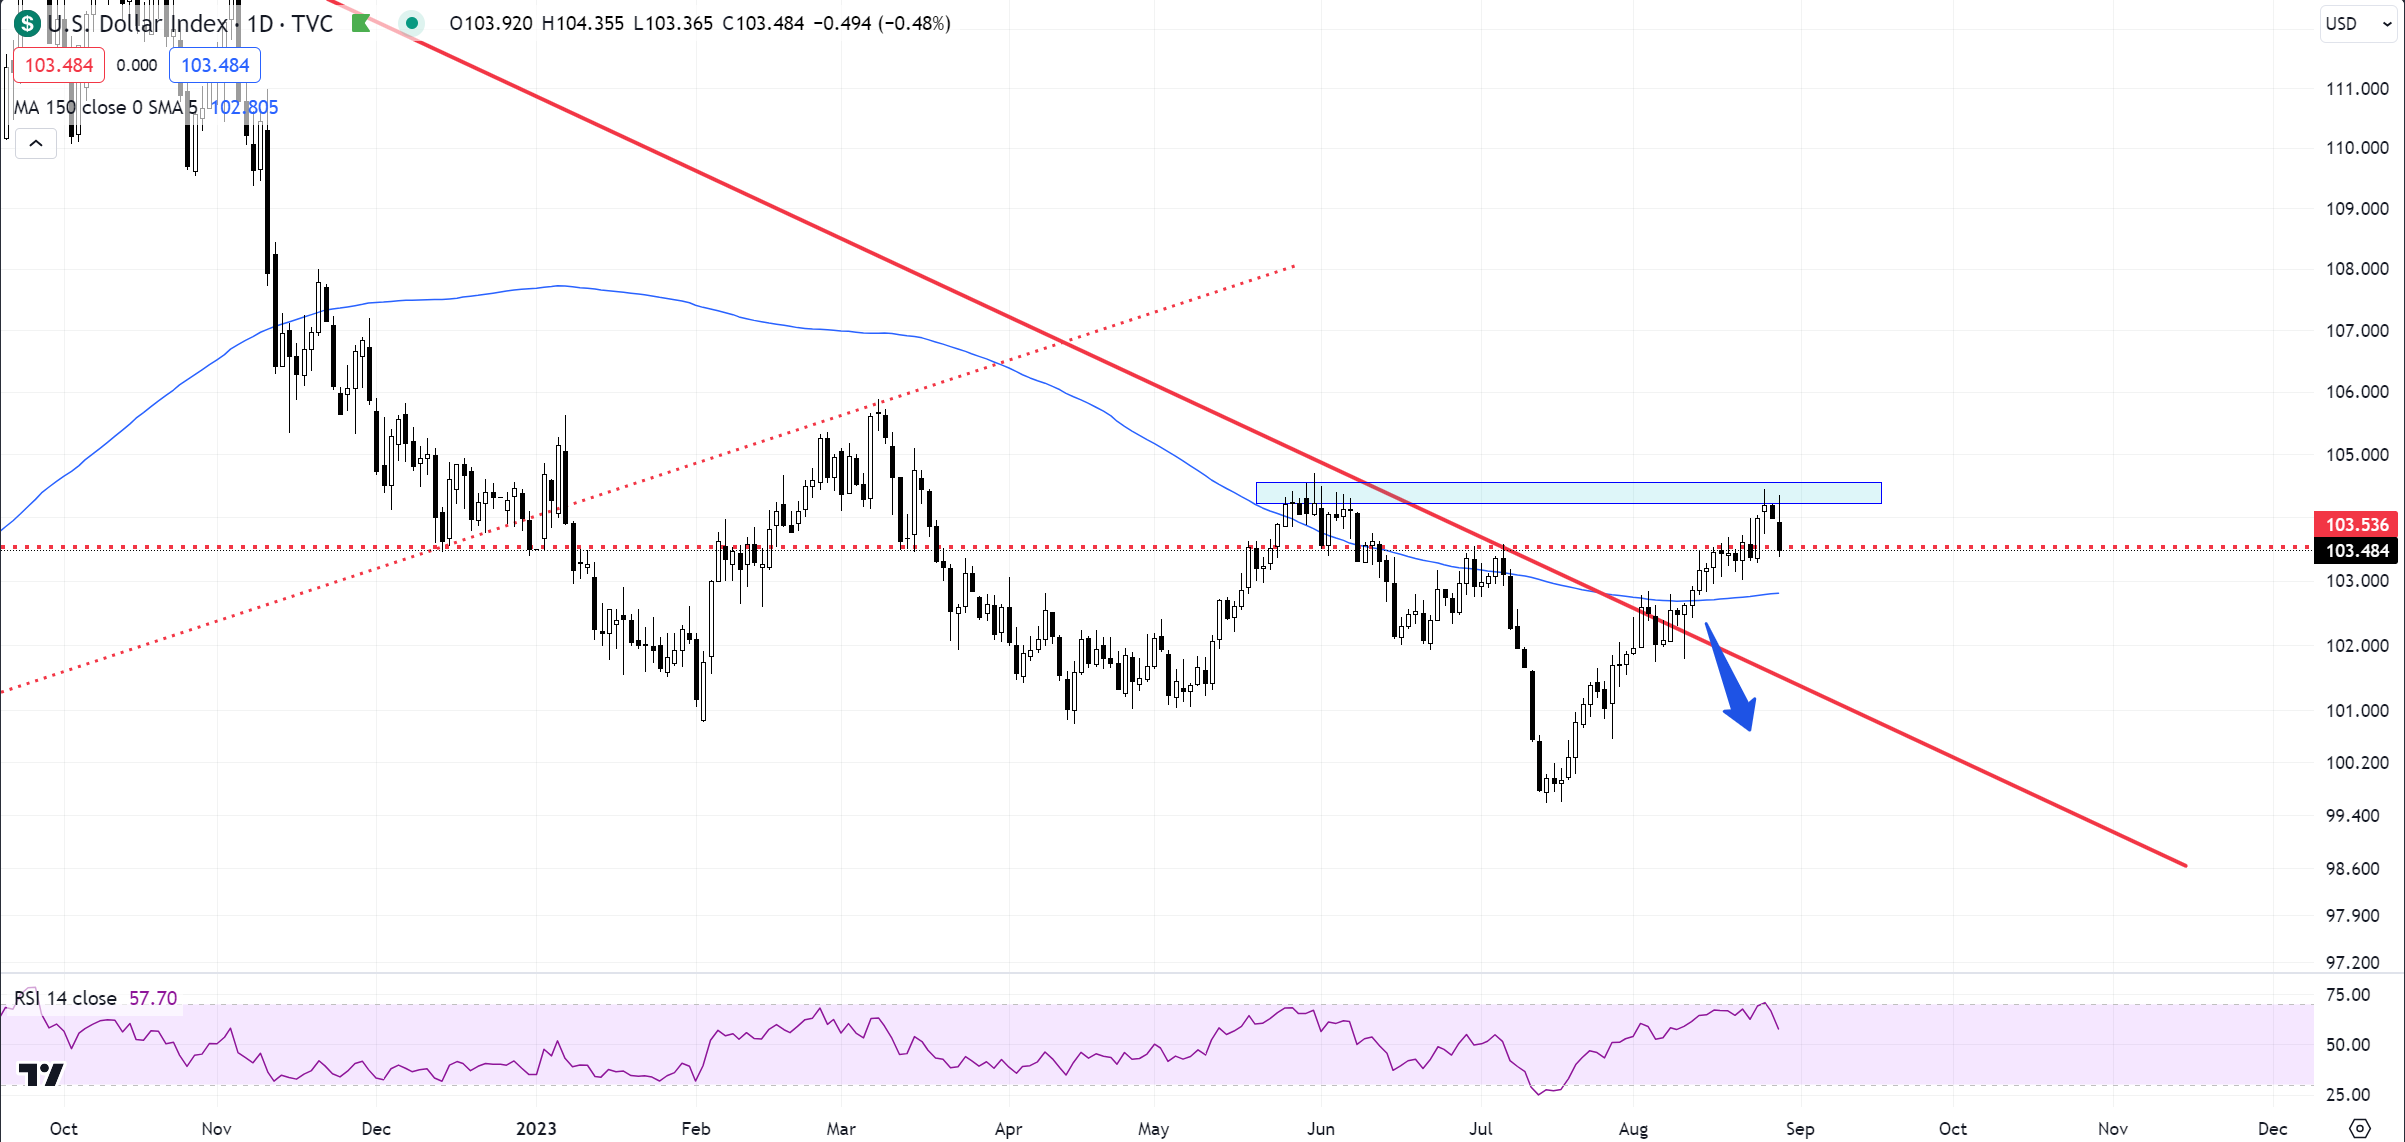
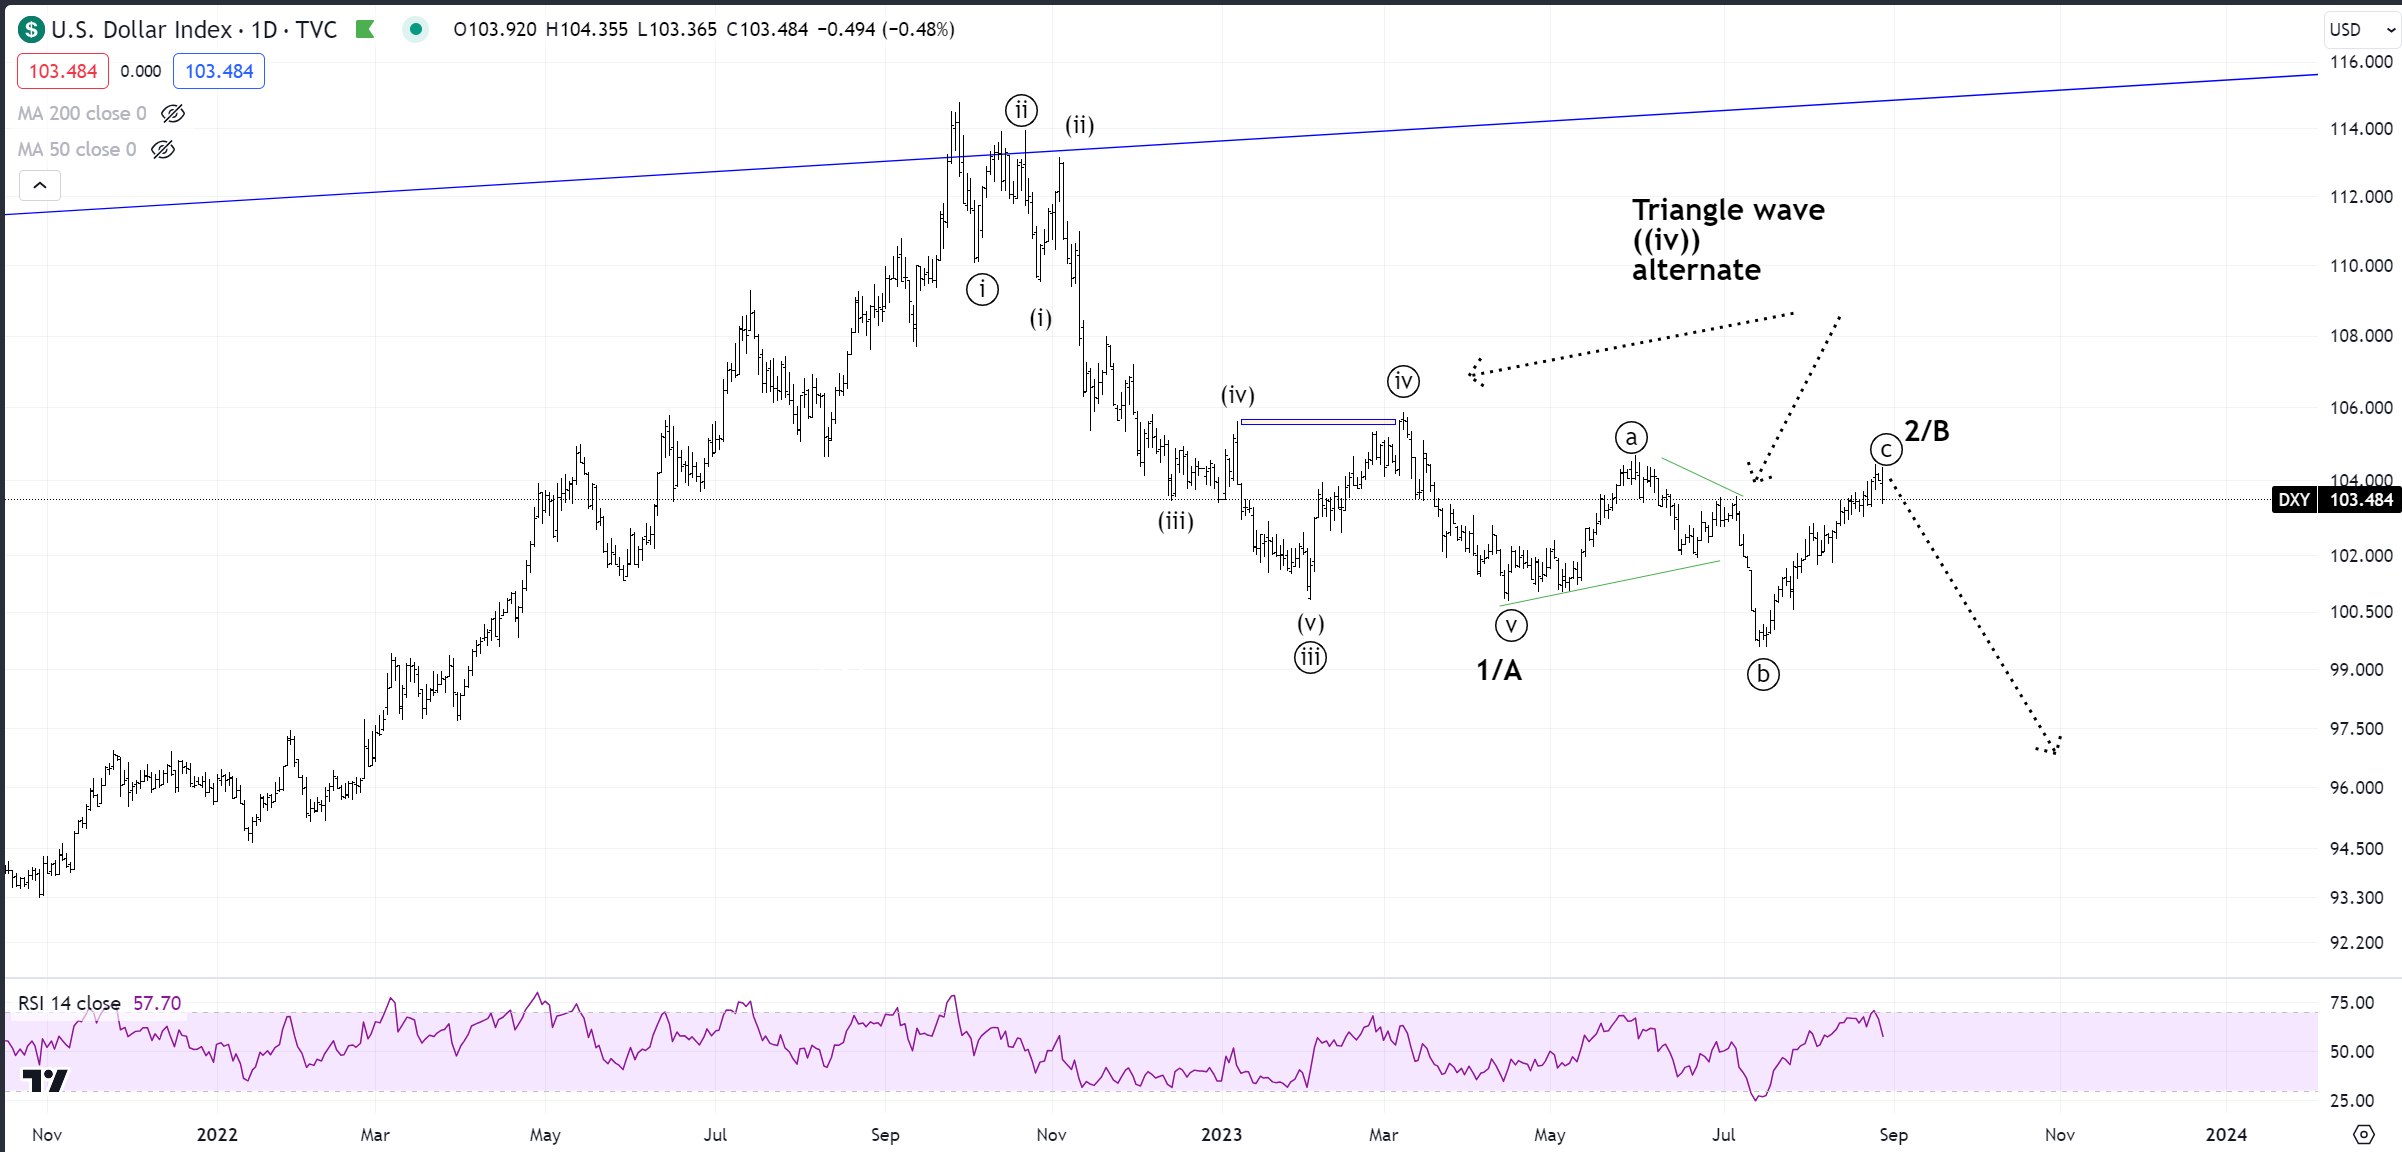
US Dollar
We got the needed response from the US dollar. It reacted a touch higher from the May highs and you can see how it’s all the same trade. Risk on works better when the dollar is weaker. We will see if this is the beginning of the next lower leg for the greenback as per the count below. If we can get below the moving average and break 101, I think we have the answer. Until then, any throwbacks here could be just a 2/b wave-type action under the triangle scenario. Stay tuned. I will explain more in tonight’s video.
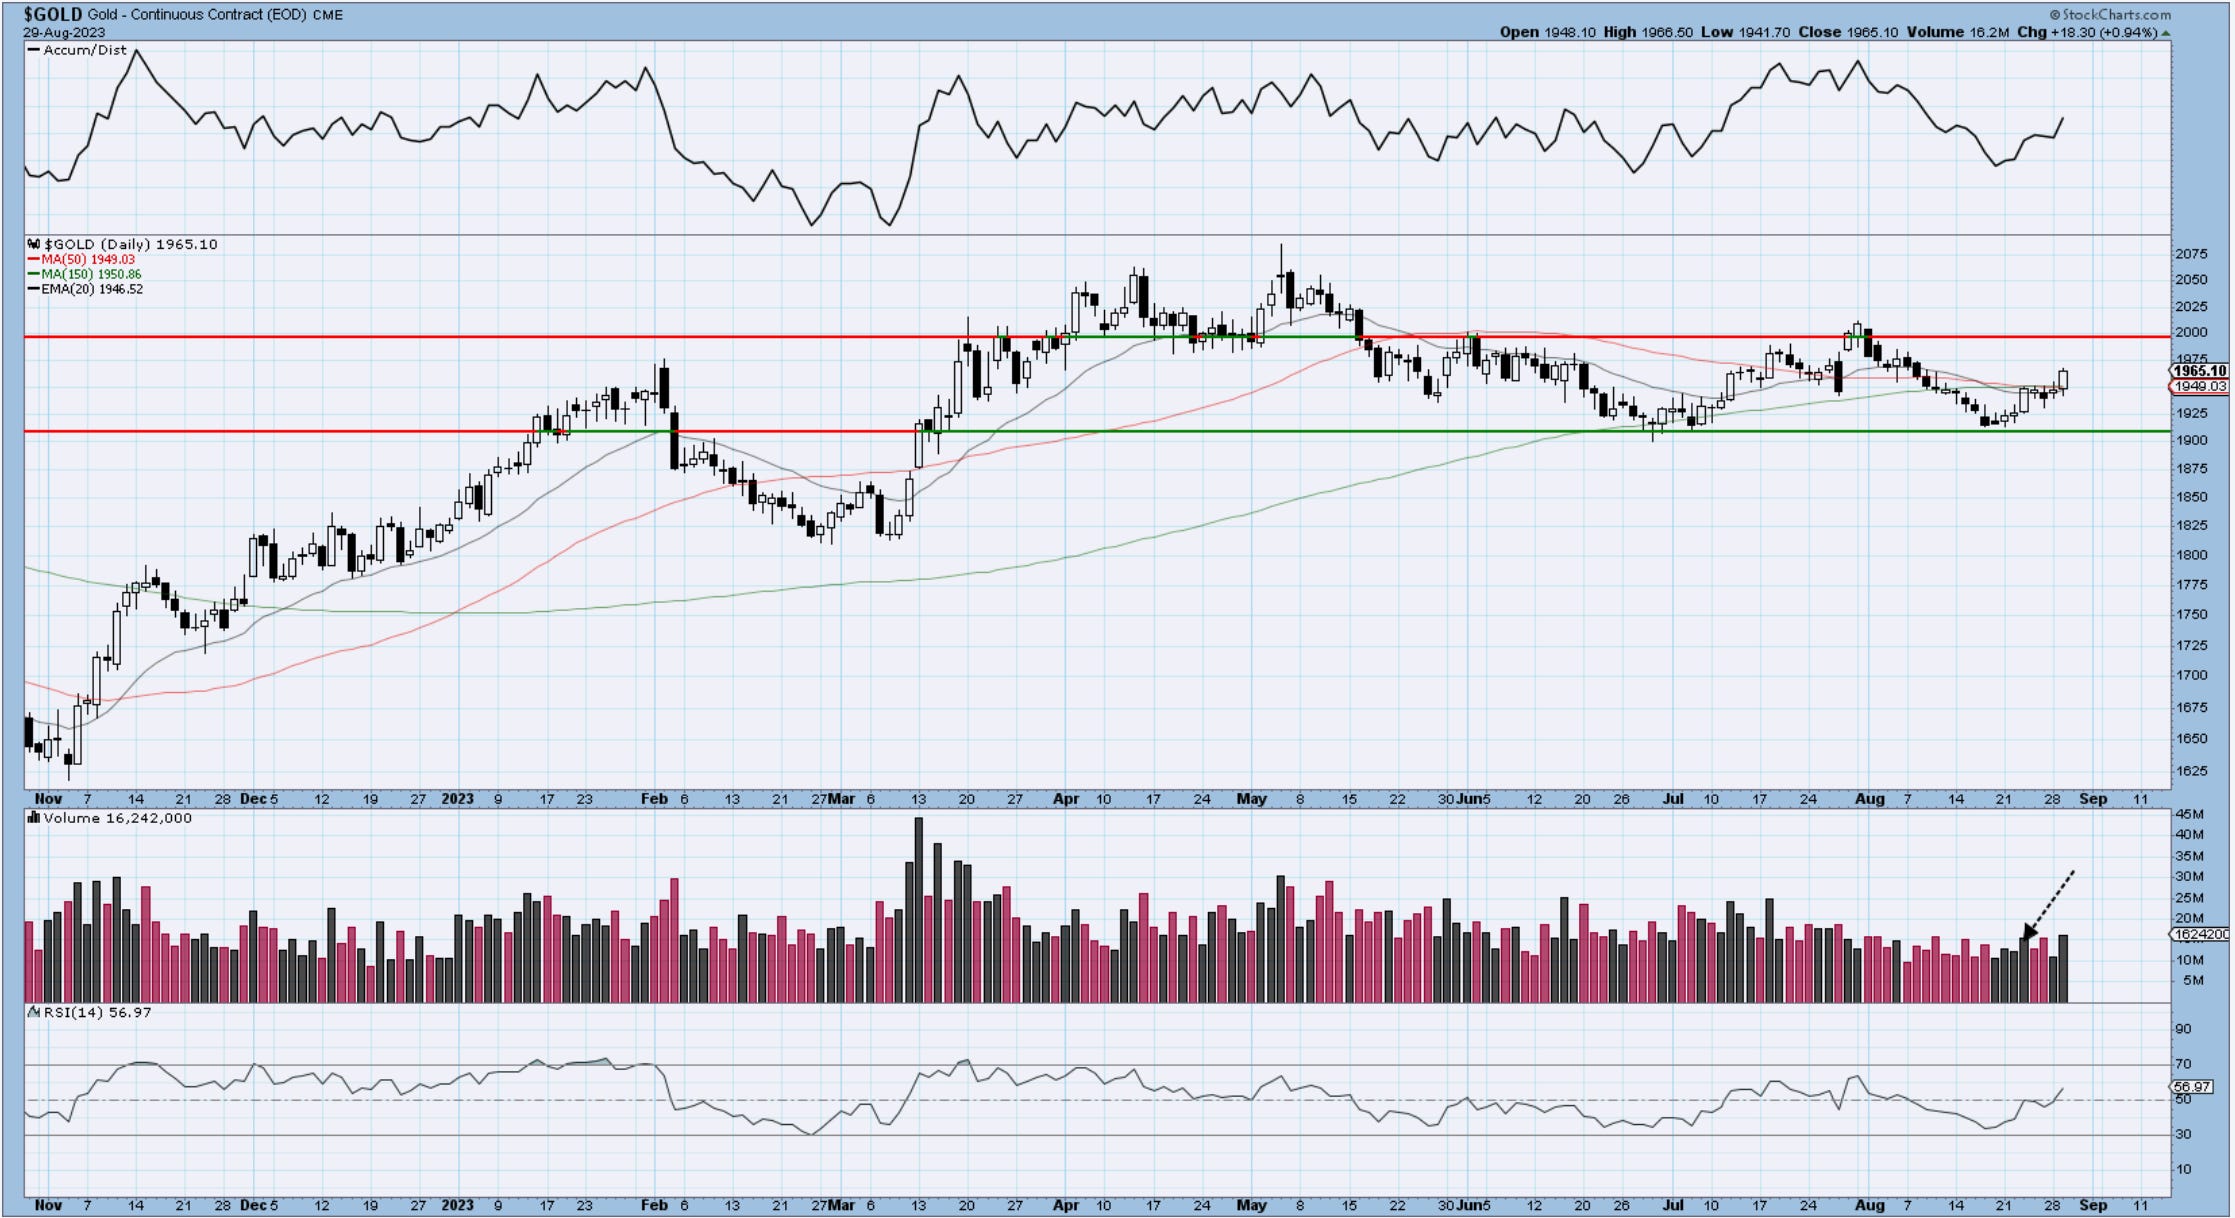
Gold
Metals continue to act well here as we’re entering a seasonally favorable period. They actually hinted to dollar weakness ahead of time, we touched on this in prior commentaries. Below are yesterday’s comments which stand. 2000 is the next big hurdle.
Gold has been acting bouncy lately and it attempted a breakout today, before retreating quickly. It looks more and more that the low was at 1888 via a ((c )) wave. See all those moving averages clustered above the price? If we can close above them, its 1-0 for Gold bulls. Overall a pretty nice range for the entire year. September is usually bullish for metals.
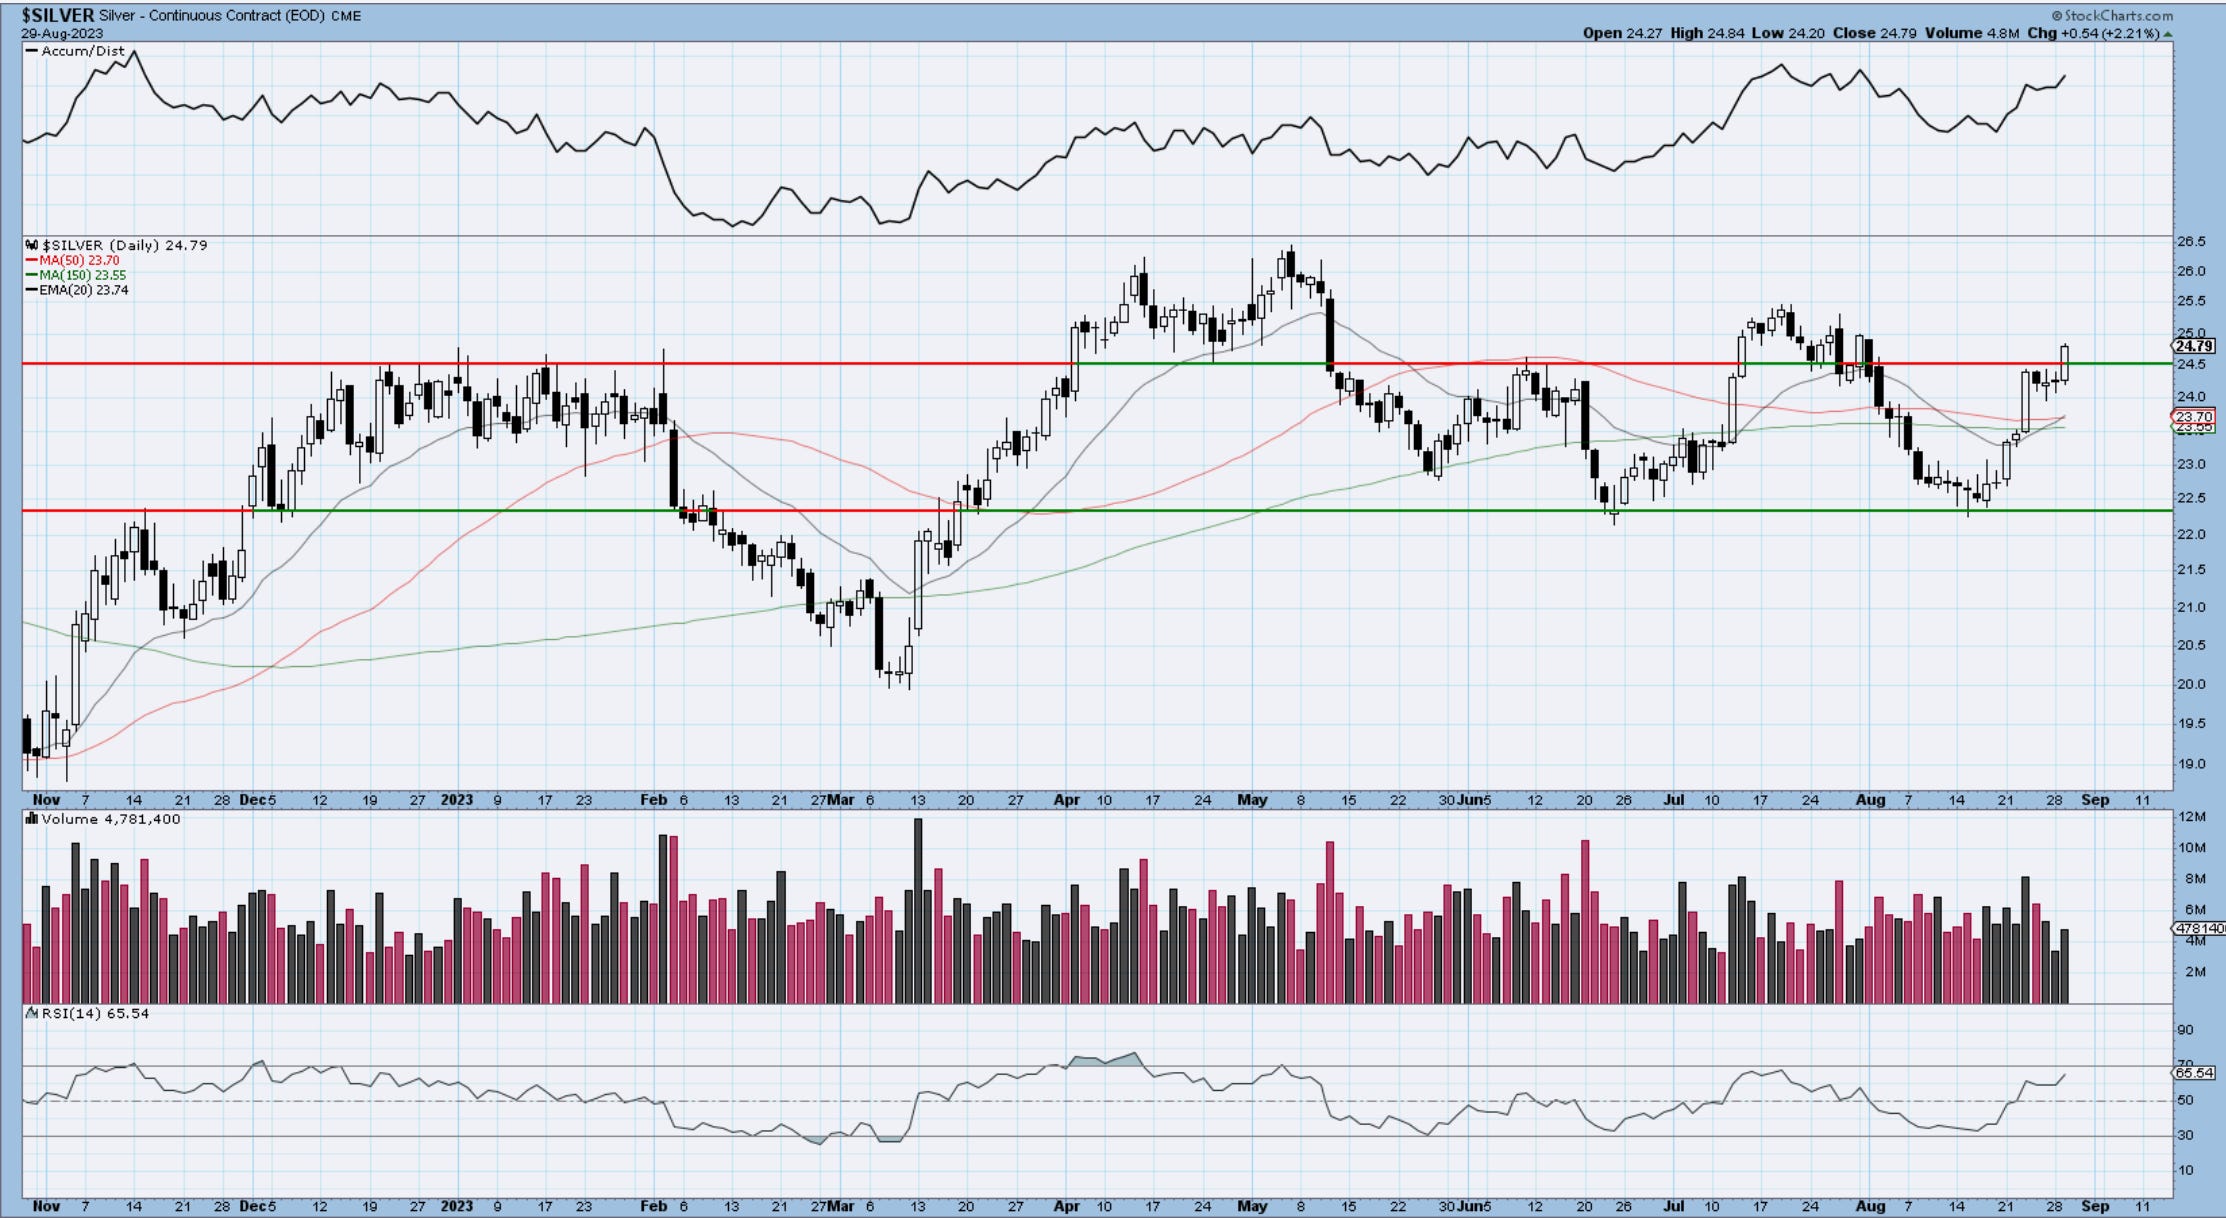
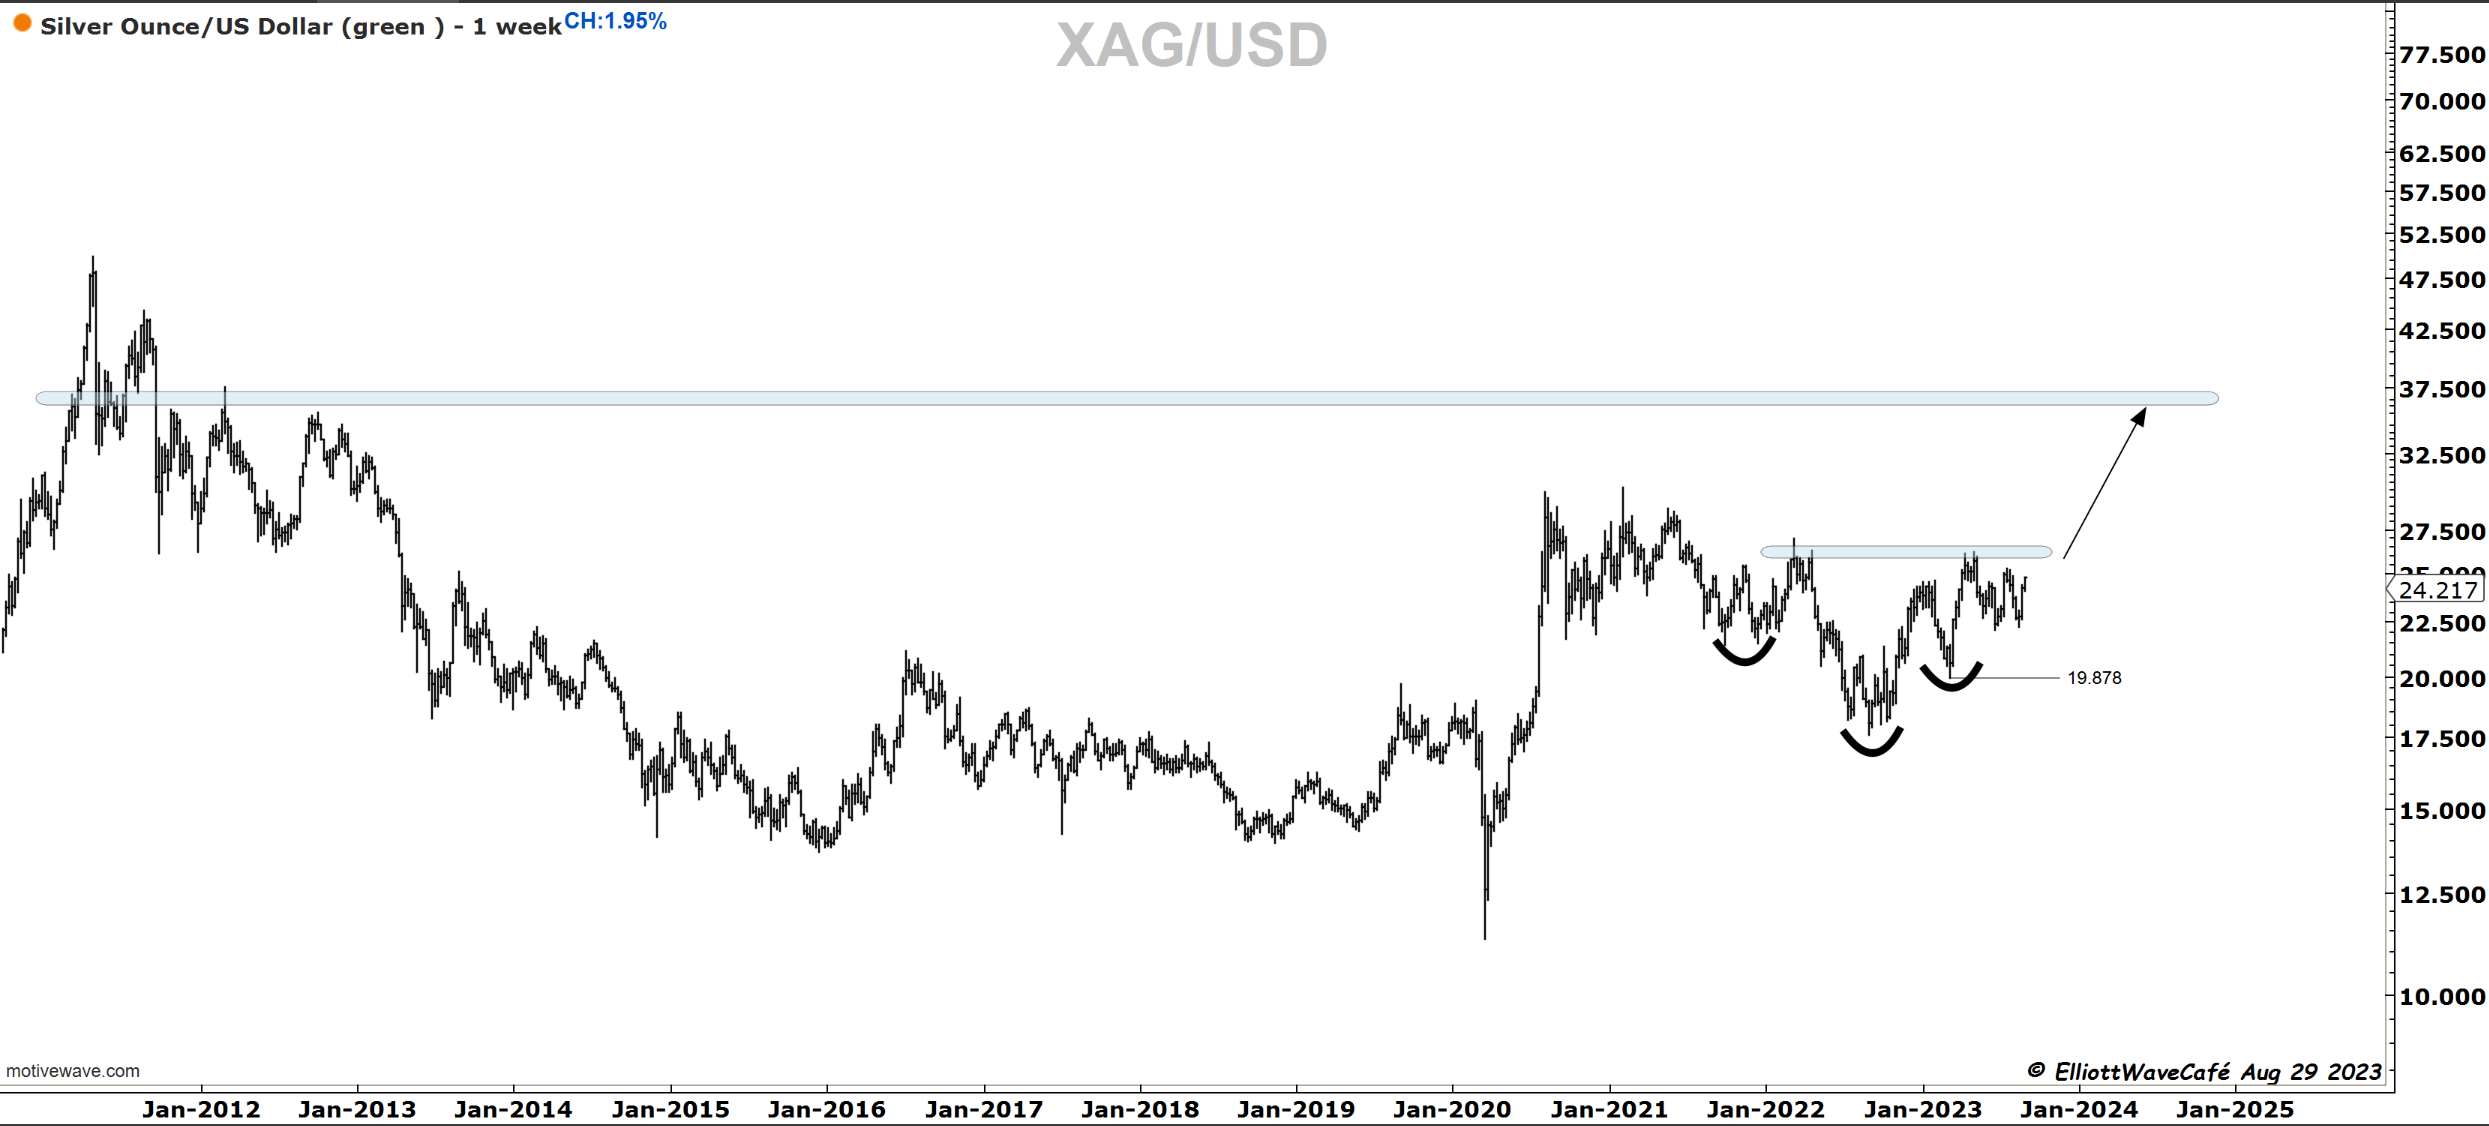
Silver
Silver back a being a beast today nd cracking above the strong horizontal resistance. The bullish count likes it and if completed a wave 2, the move that’s coming will leave people speechless. There is great potential above 26.30. We discussed Silver bullish outlook several times in the last couple of weeks. Volume still low.
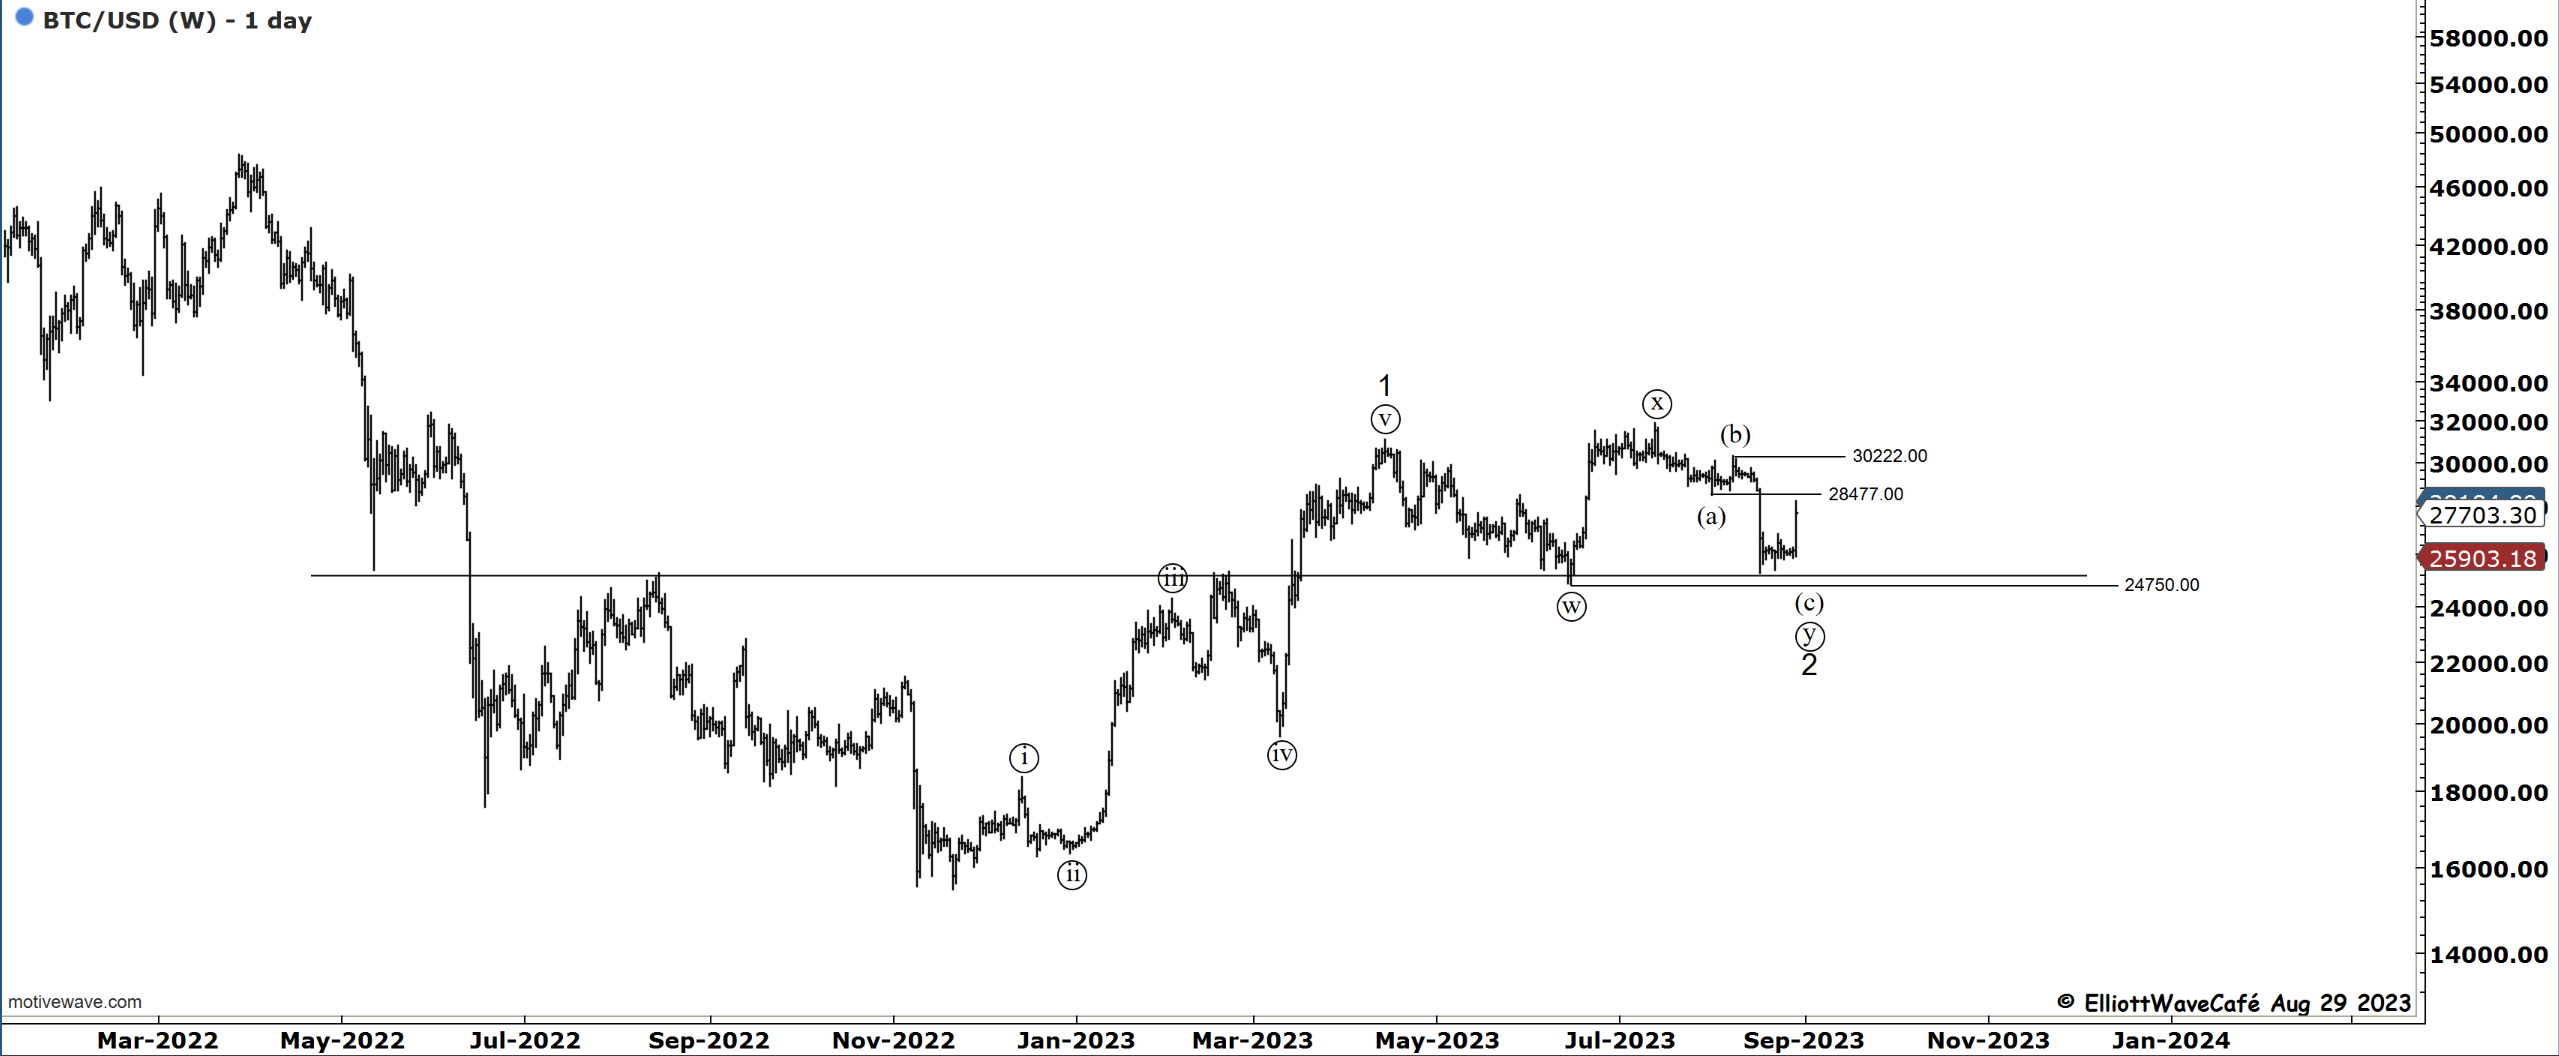
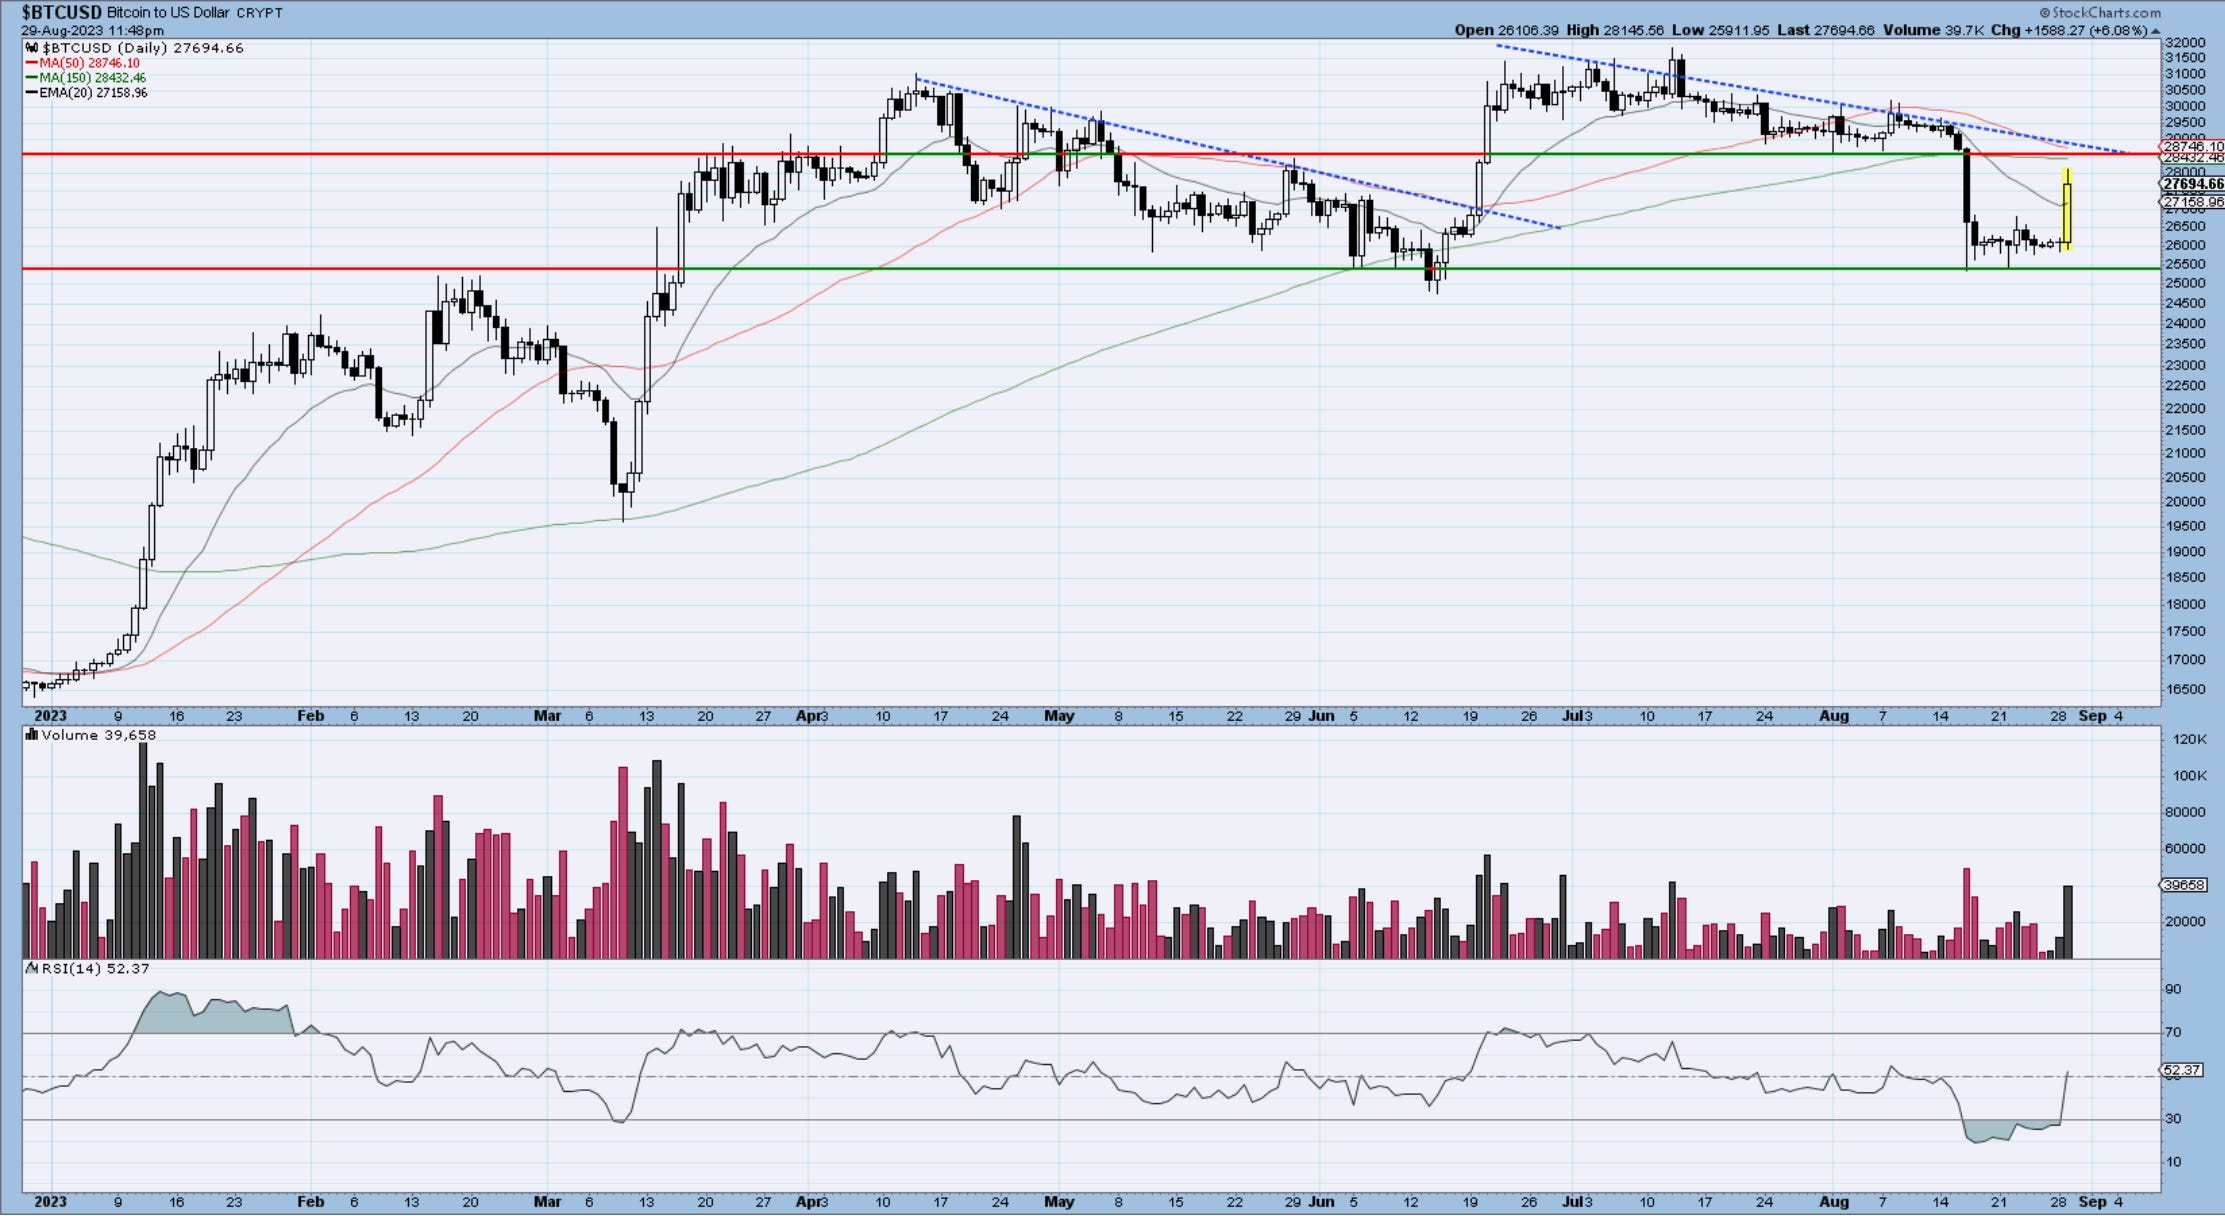
Bitcoin
Yesterday I was pretty disappointed with the lack of movement from BTC, today we ripped higher on the SEC Grayscale news. It’s a good move, but keeping a cool head here when we look at charts. I don’t want this to be another fade. I think we need to get above 29k and then 30,200. Good volume candle. If any excited traders bought this on emotion, the market might have a way to test their resilience a bit. I have seen it too many times before.
On a positive note, if wave 2 is completed, we have a long way to go in wave 3. I am positioned long via BITX in the active trading sheet.
See you tomorrow - trade well,
Cris
email: ewcafe@pm.me