
The Daily Drip
Markets review, strategy and analysis
Note: The EW counts on the right edge are real-time, and they are prone to adjustments as price action develops. Elliott Wave has a fluid approach, is evidence-based, and requires constant monitoring of certain thresholds.
In the counts below, this (( )) = circle on chart
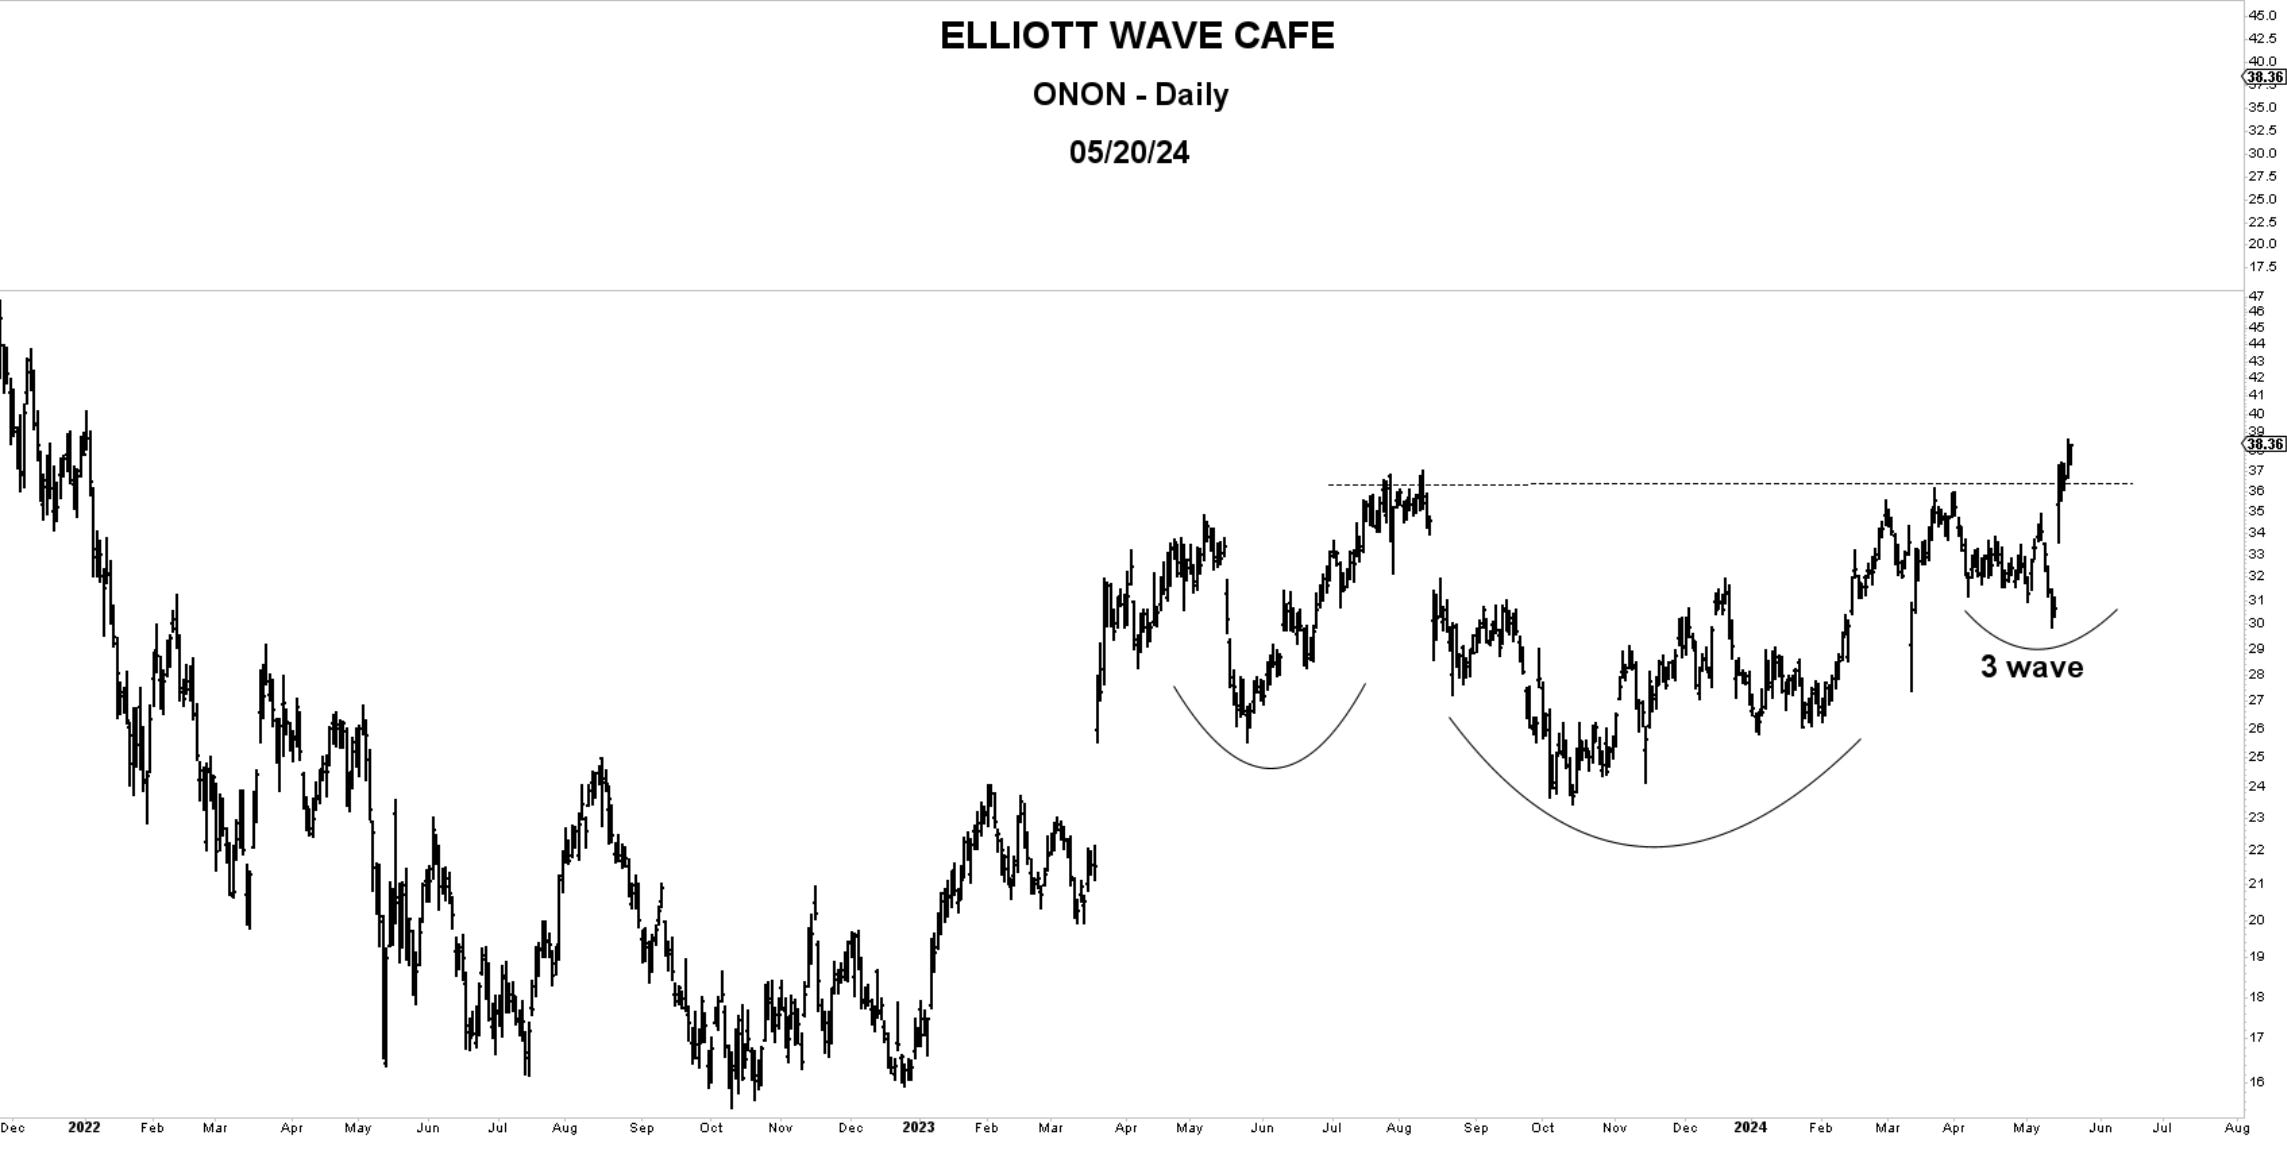
Chart of the Day—ONON—Earnings pushed this above resistance neckline at 37. The last correction was a three-wave move. It is signaling its attempt at a new trend.
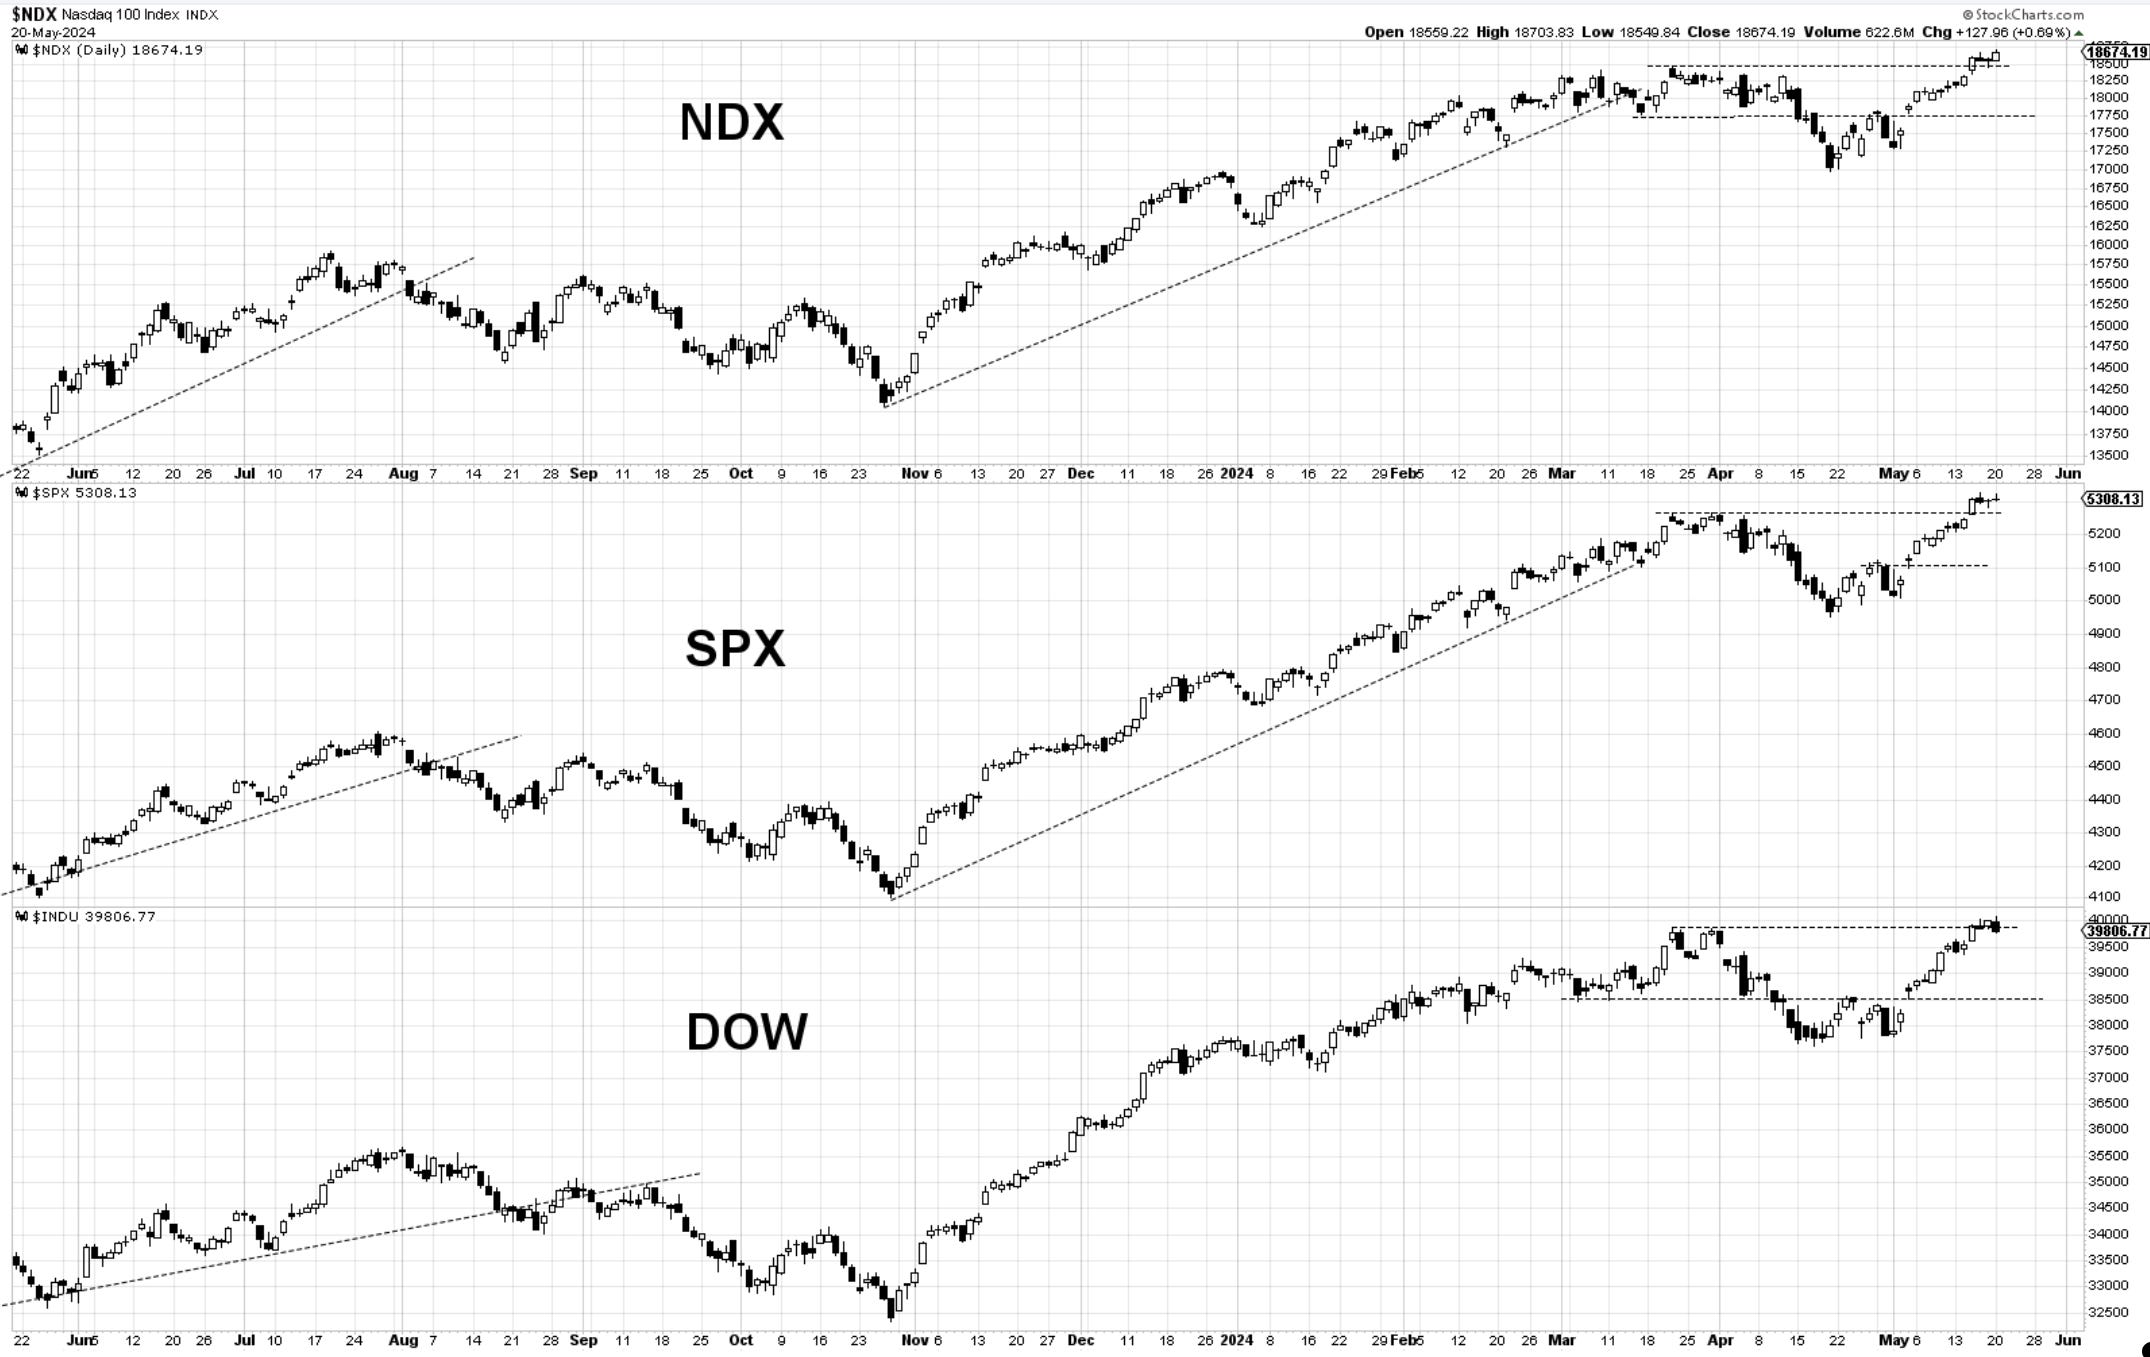
Bottom Line: The market is consolidating after the May 15th breakouts. With a very important stock reporting earnings on Wednesday, the price action is not yet suggestive of playing defense. Offensive positioning remains at the forefront.
Let’s now dive into charts and further analysis below… then the Double Shot daily video.
