
The Daily Drip
Markets review, strategy and analysis
Note: The EW counts on the right edge are real-time, and they are prone to adjustments as price action develops. Elliott Wave has a fluid approach, is evidence-based, and requires constant monitoring of certain thresholds.
In the counts below, this (( )) = circle on chart
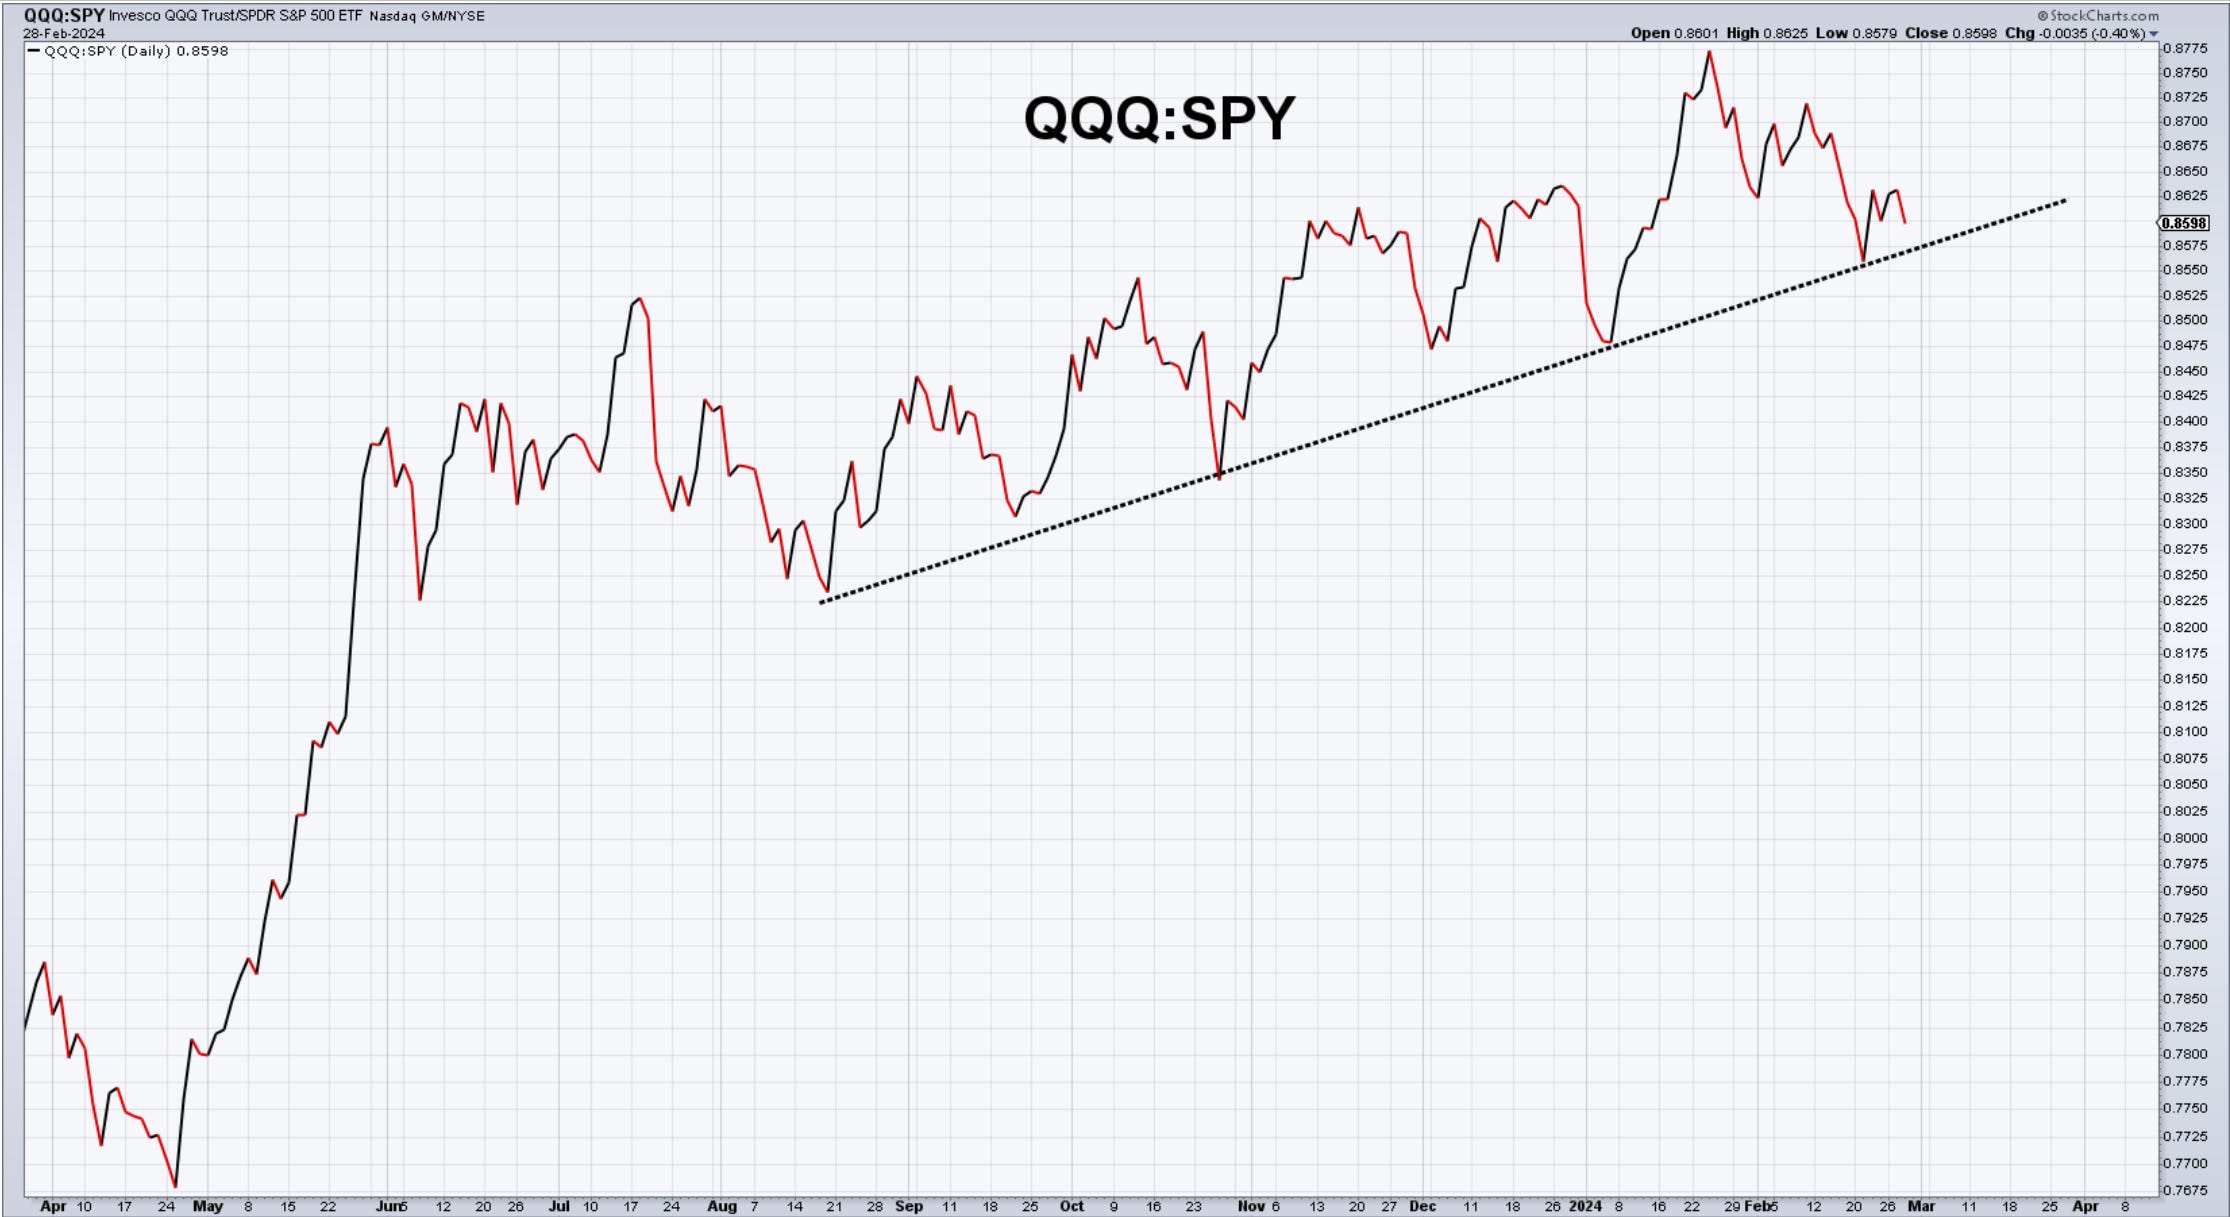
Chart of the Day QQQ:SPY ratio - Since Jan 24th, the tech-heavy Nasdaq100 has been losing ground in favor of the SP500. Will the trendline hold and tech will start to outperform again, or are we already in a more balanced regime?
SP500
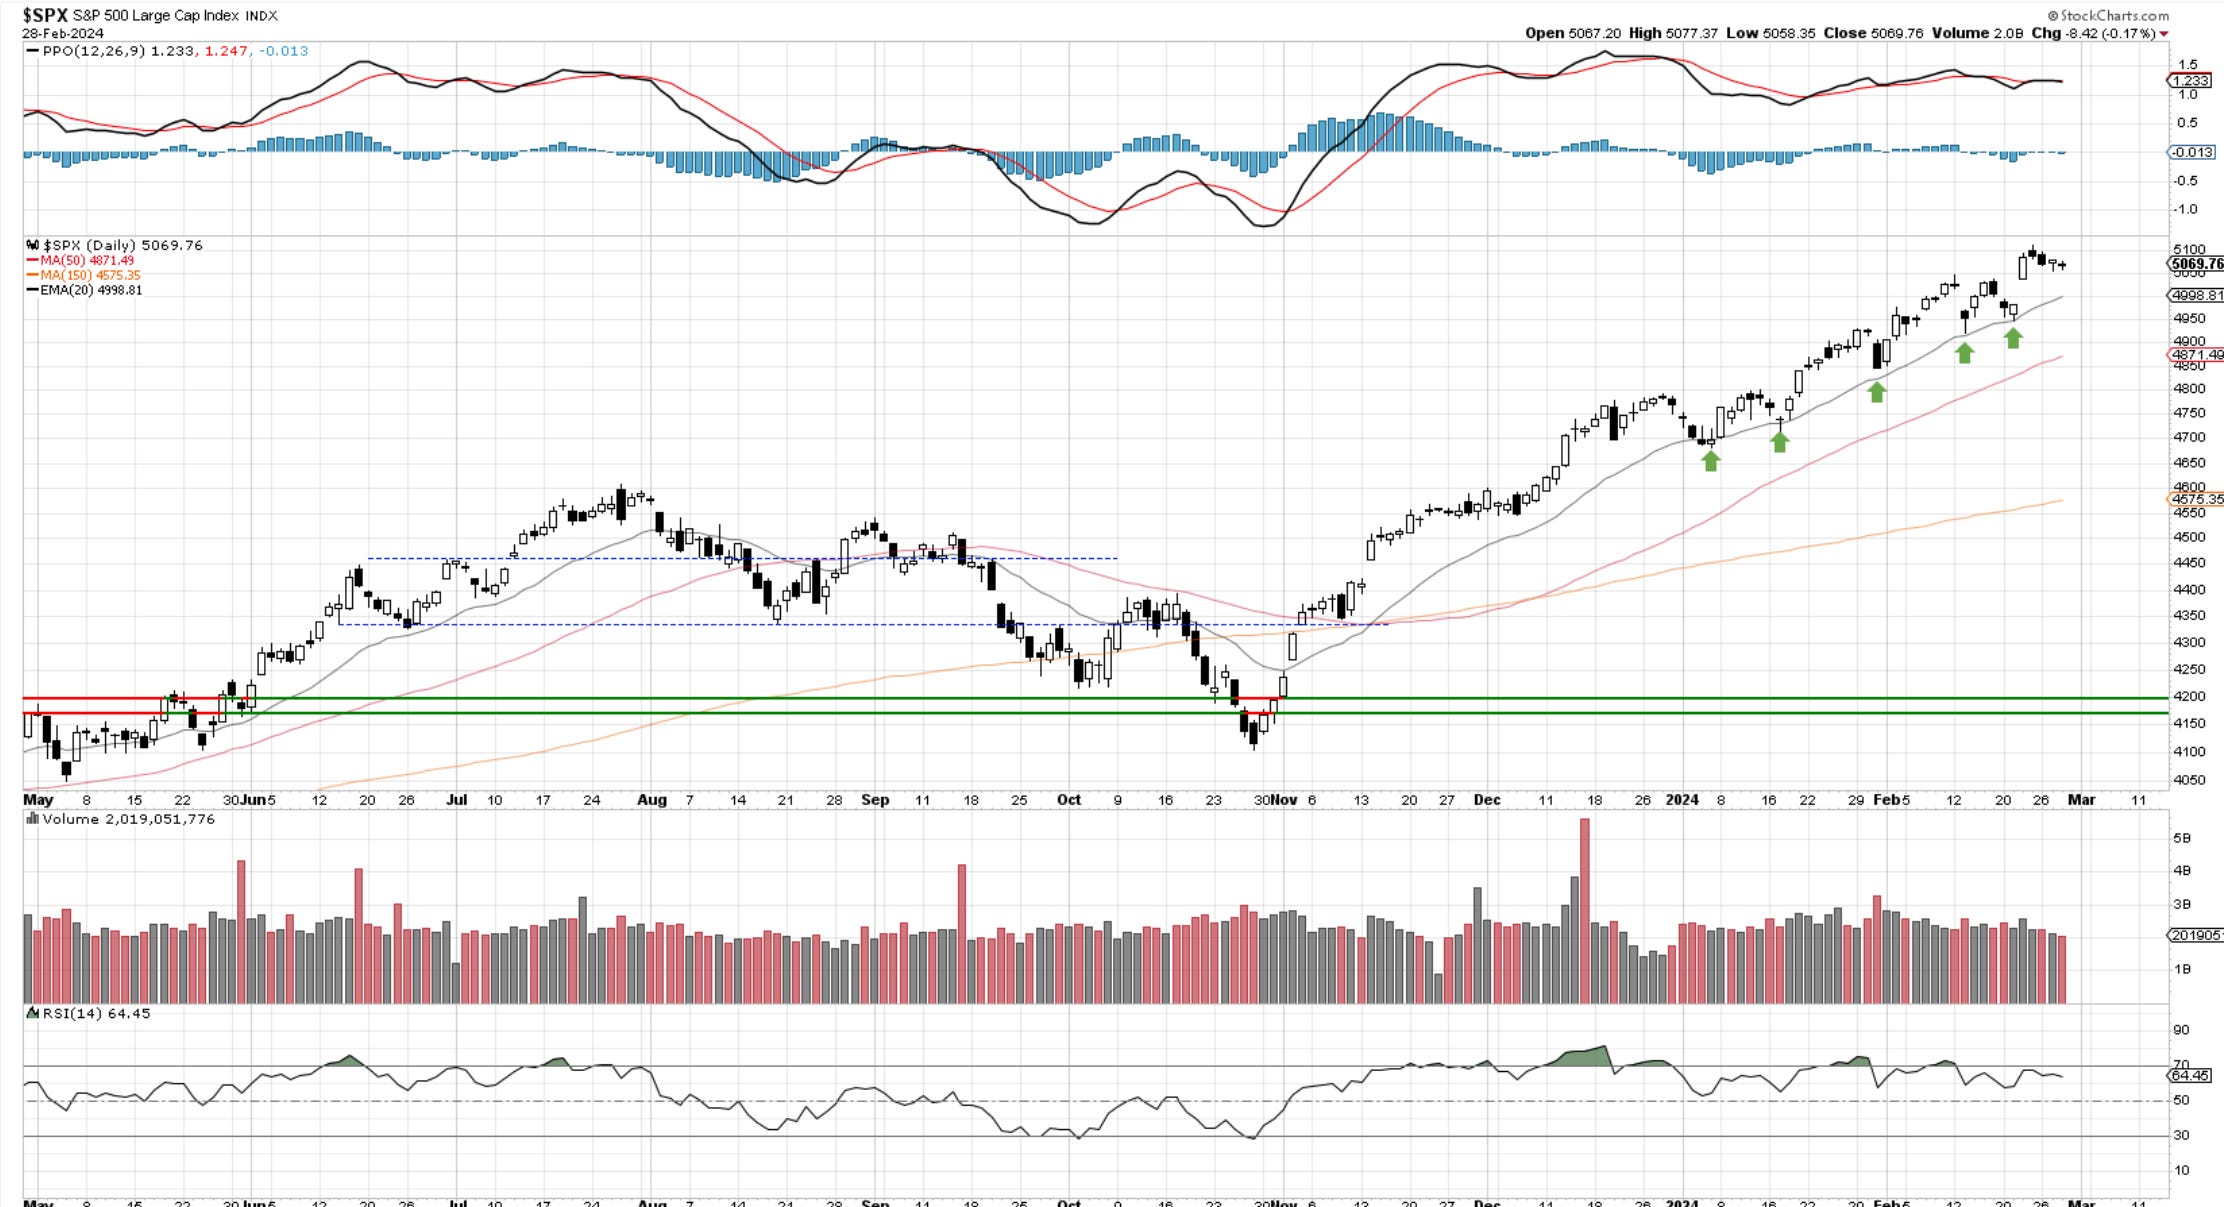
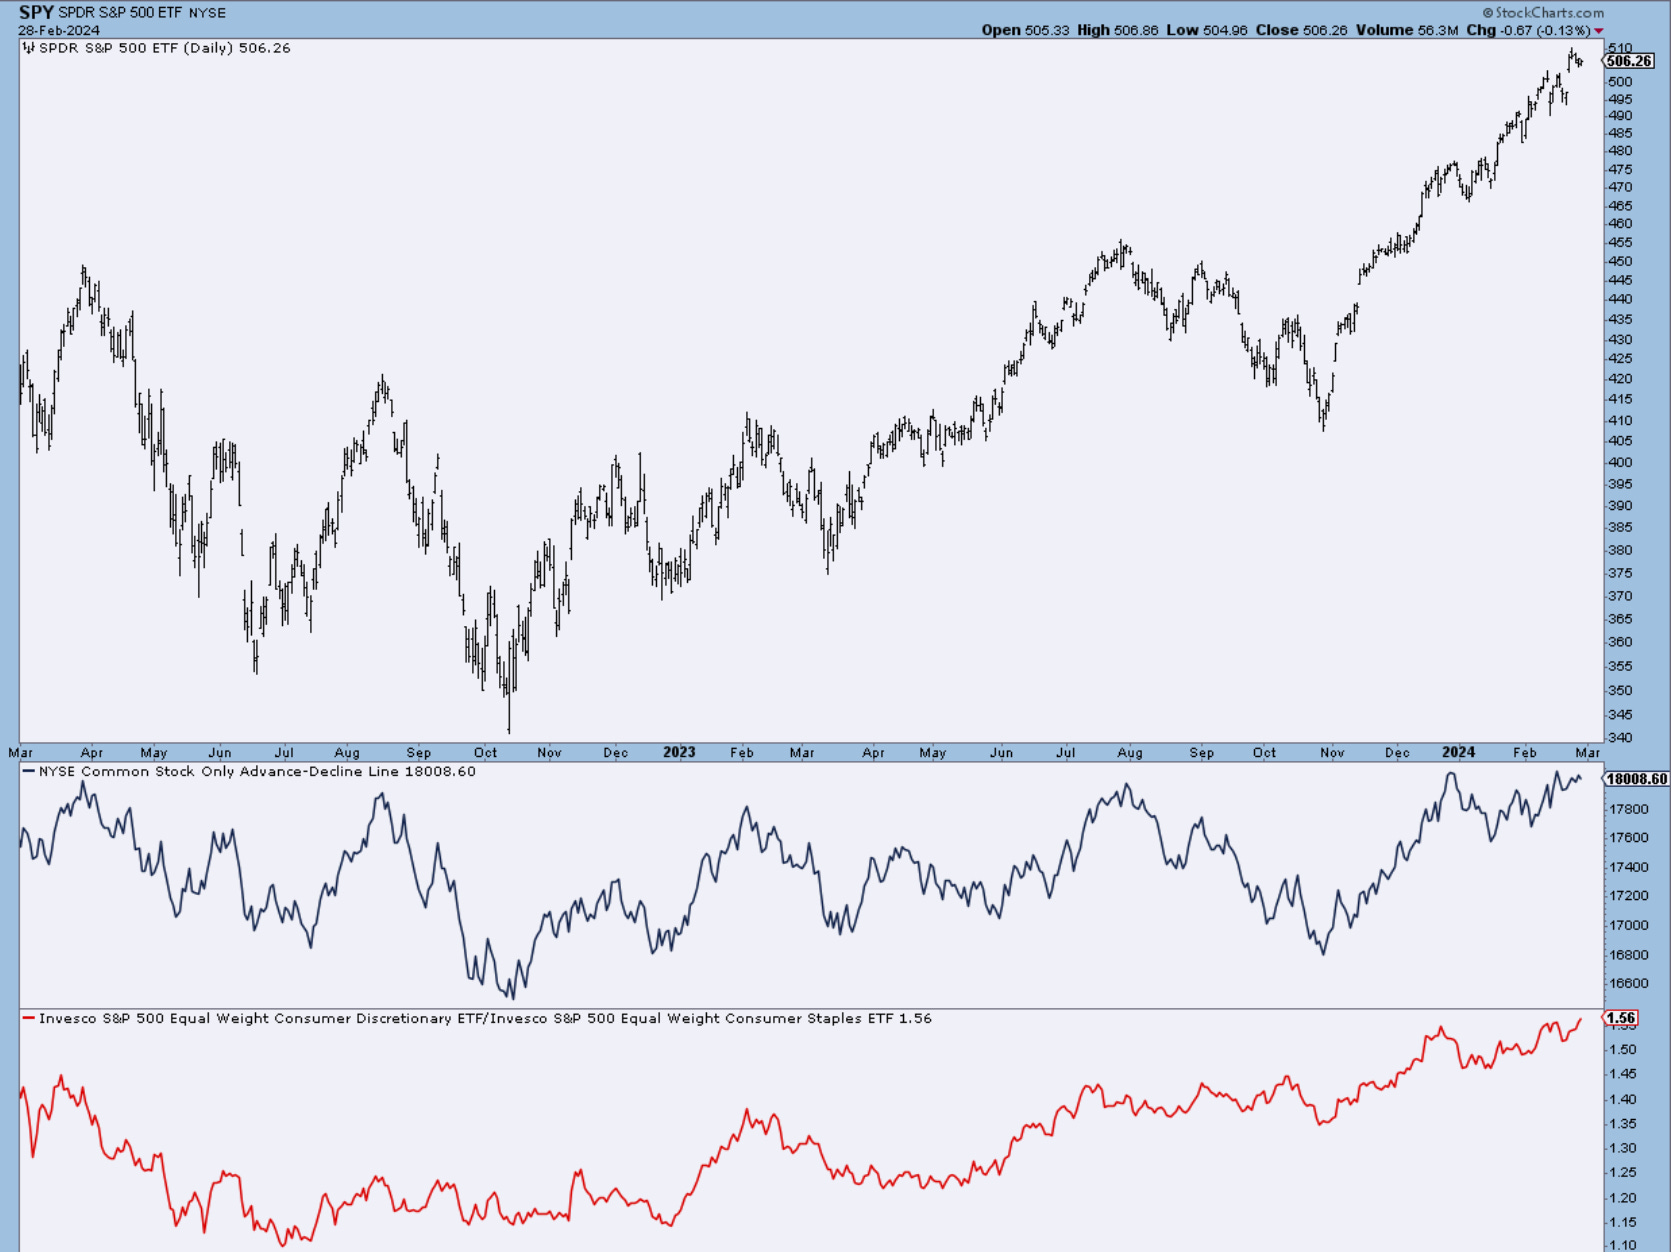
Markets are really quiet ahead of tomorrow's Fed-preferred PCE data ( inflation that excludes food and energy). The trends remain intact with almost no evidence of abating. 5045 is the level to be watched on a closing basis. 5000 just below that is the 20day trend MA. If these come under pressure over the next several days, one can consider a change in character and expect a corrective period to unfold.
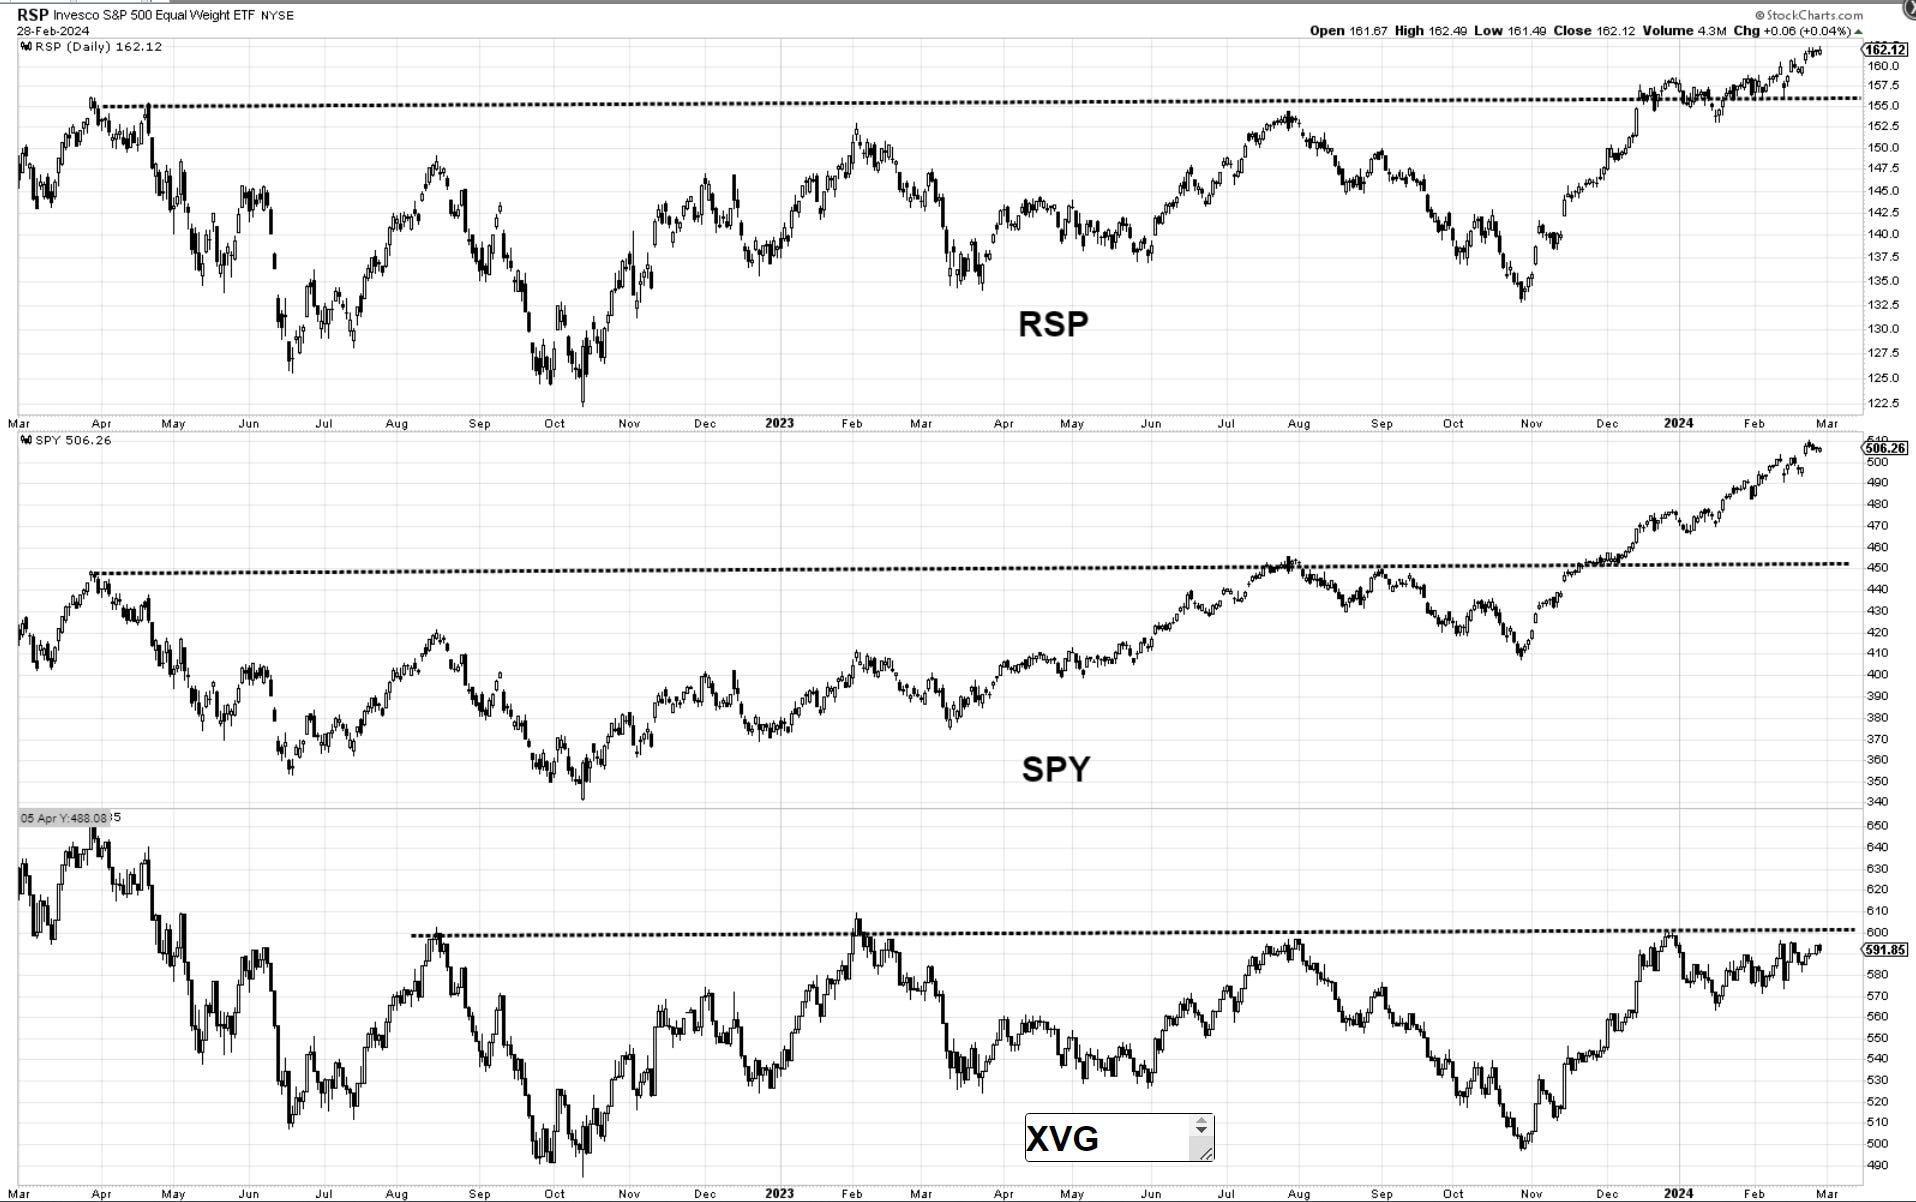
Here are the three charts depicting the RSP, SPY and XVG. Keeping a close eye on the value line geometric index XVG for a potential breakout. That is the average stock in US. A break here would suggest a much healthier and larger participation. The equal weight RSP has already done it, and it looks to continue gathering strength. Back below 158 would carry us into correction territory.
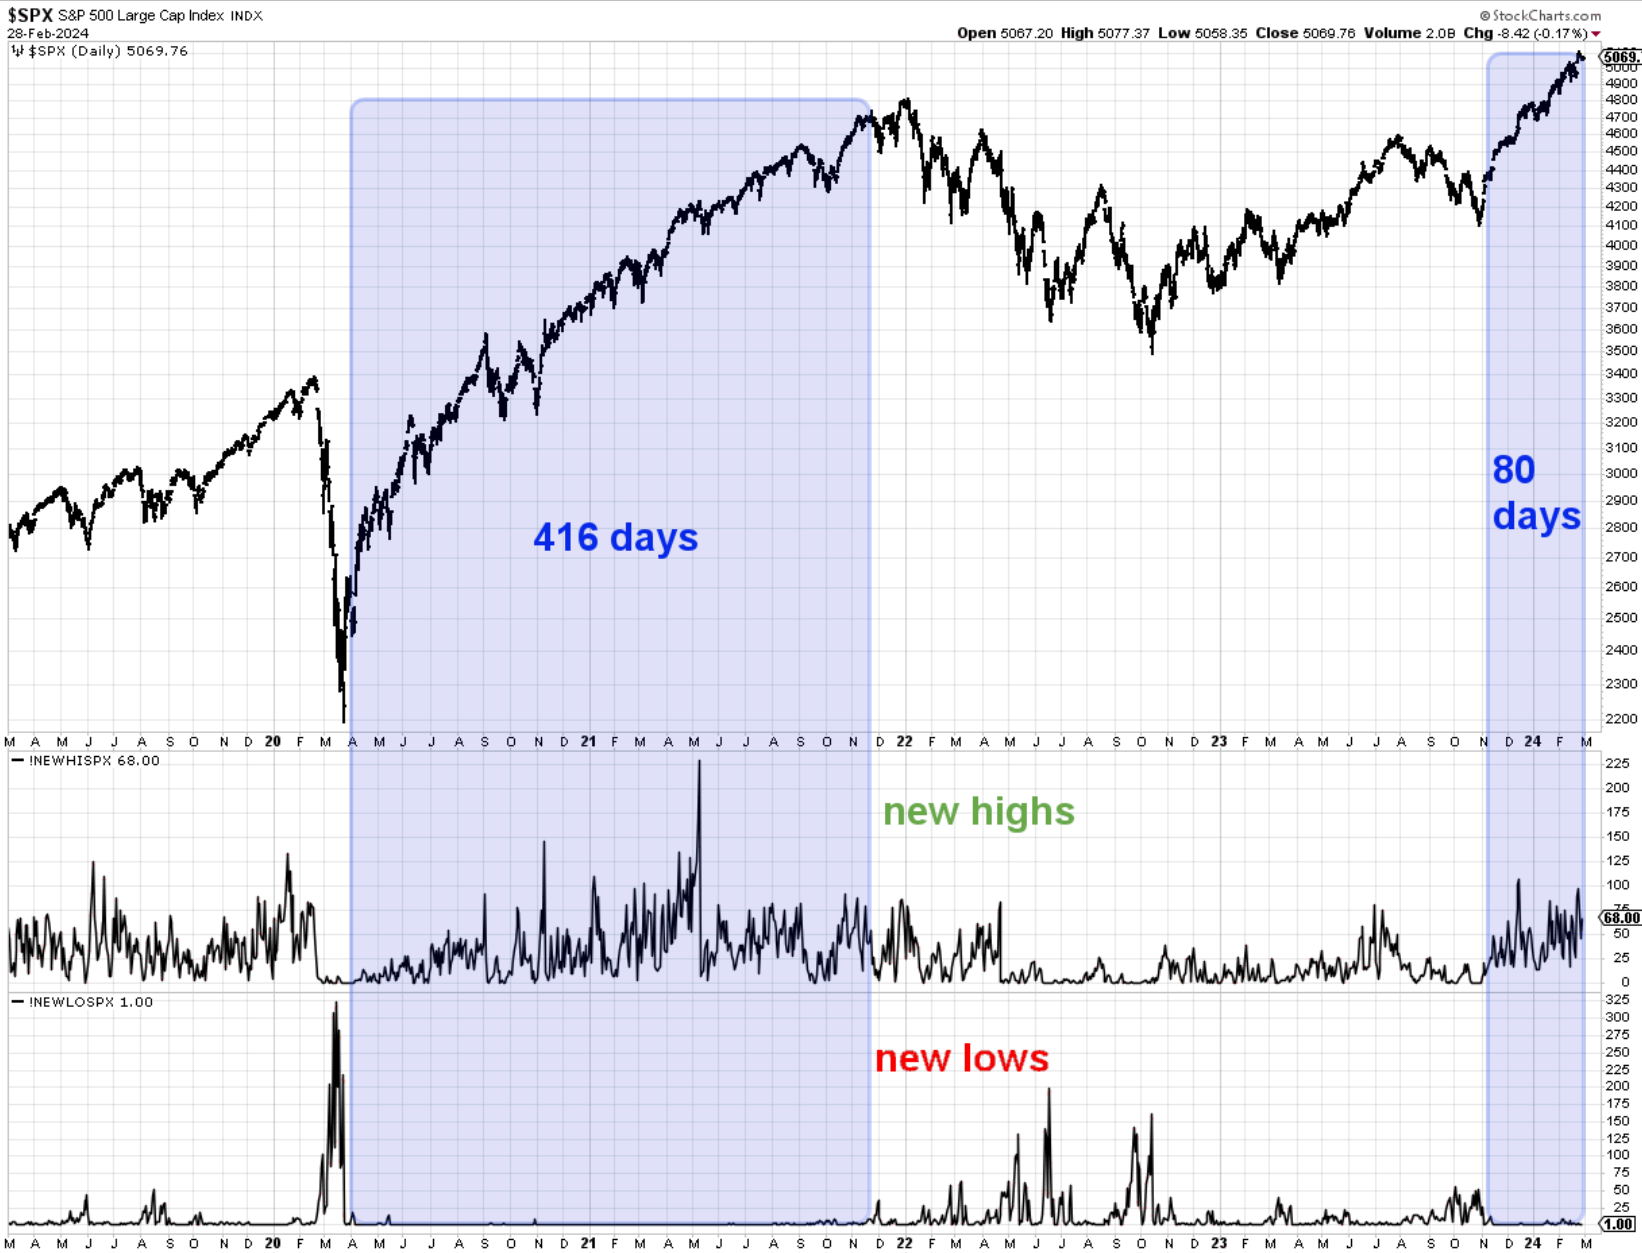
I wanted to show you this chart of new 52-week highs and lows in the Sp500. We are now about 80 days into this regime of almost nonexistent lows and a constant level of new highs. Just to put things into perspective, during 2020 and 2021 we went aproximately 416 days without making a new lows. This is also the longest period since the bottom in October 2022. We have had rallies like the one last year in spring-summer, but it was not nearly as clean as this one is. It is tough to continue to make bearish arguments until we see at least some level of deterioration here.
I like to monitor a simple ratio. That of discretionary vs staples. Offense vs defense in red below. It is presented on an equal-weighted basis which is the proper way to do it by eliminating the large caps stocks that can distort it. It continues to trend higher.
Nasdaq100
Nasdaq dropped 1/2 of a percent today on very light volume. It has actually been declining for the past 4 days ( volume, that is). We can’t read much into this until we see support levels getting taken out. 17,680 is the one to watch nearby. We have a visible loss of momentum, but the price needs to confirm it by taking out levels. Until then, it could simply be a “gather steam” type of action.
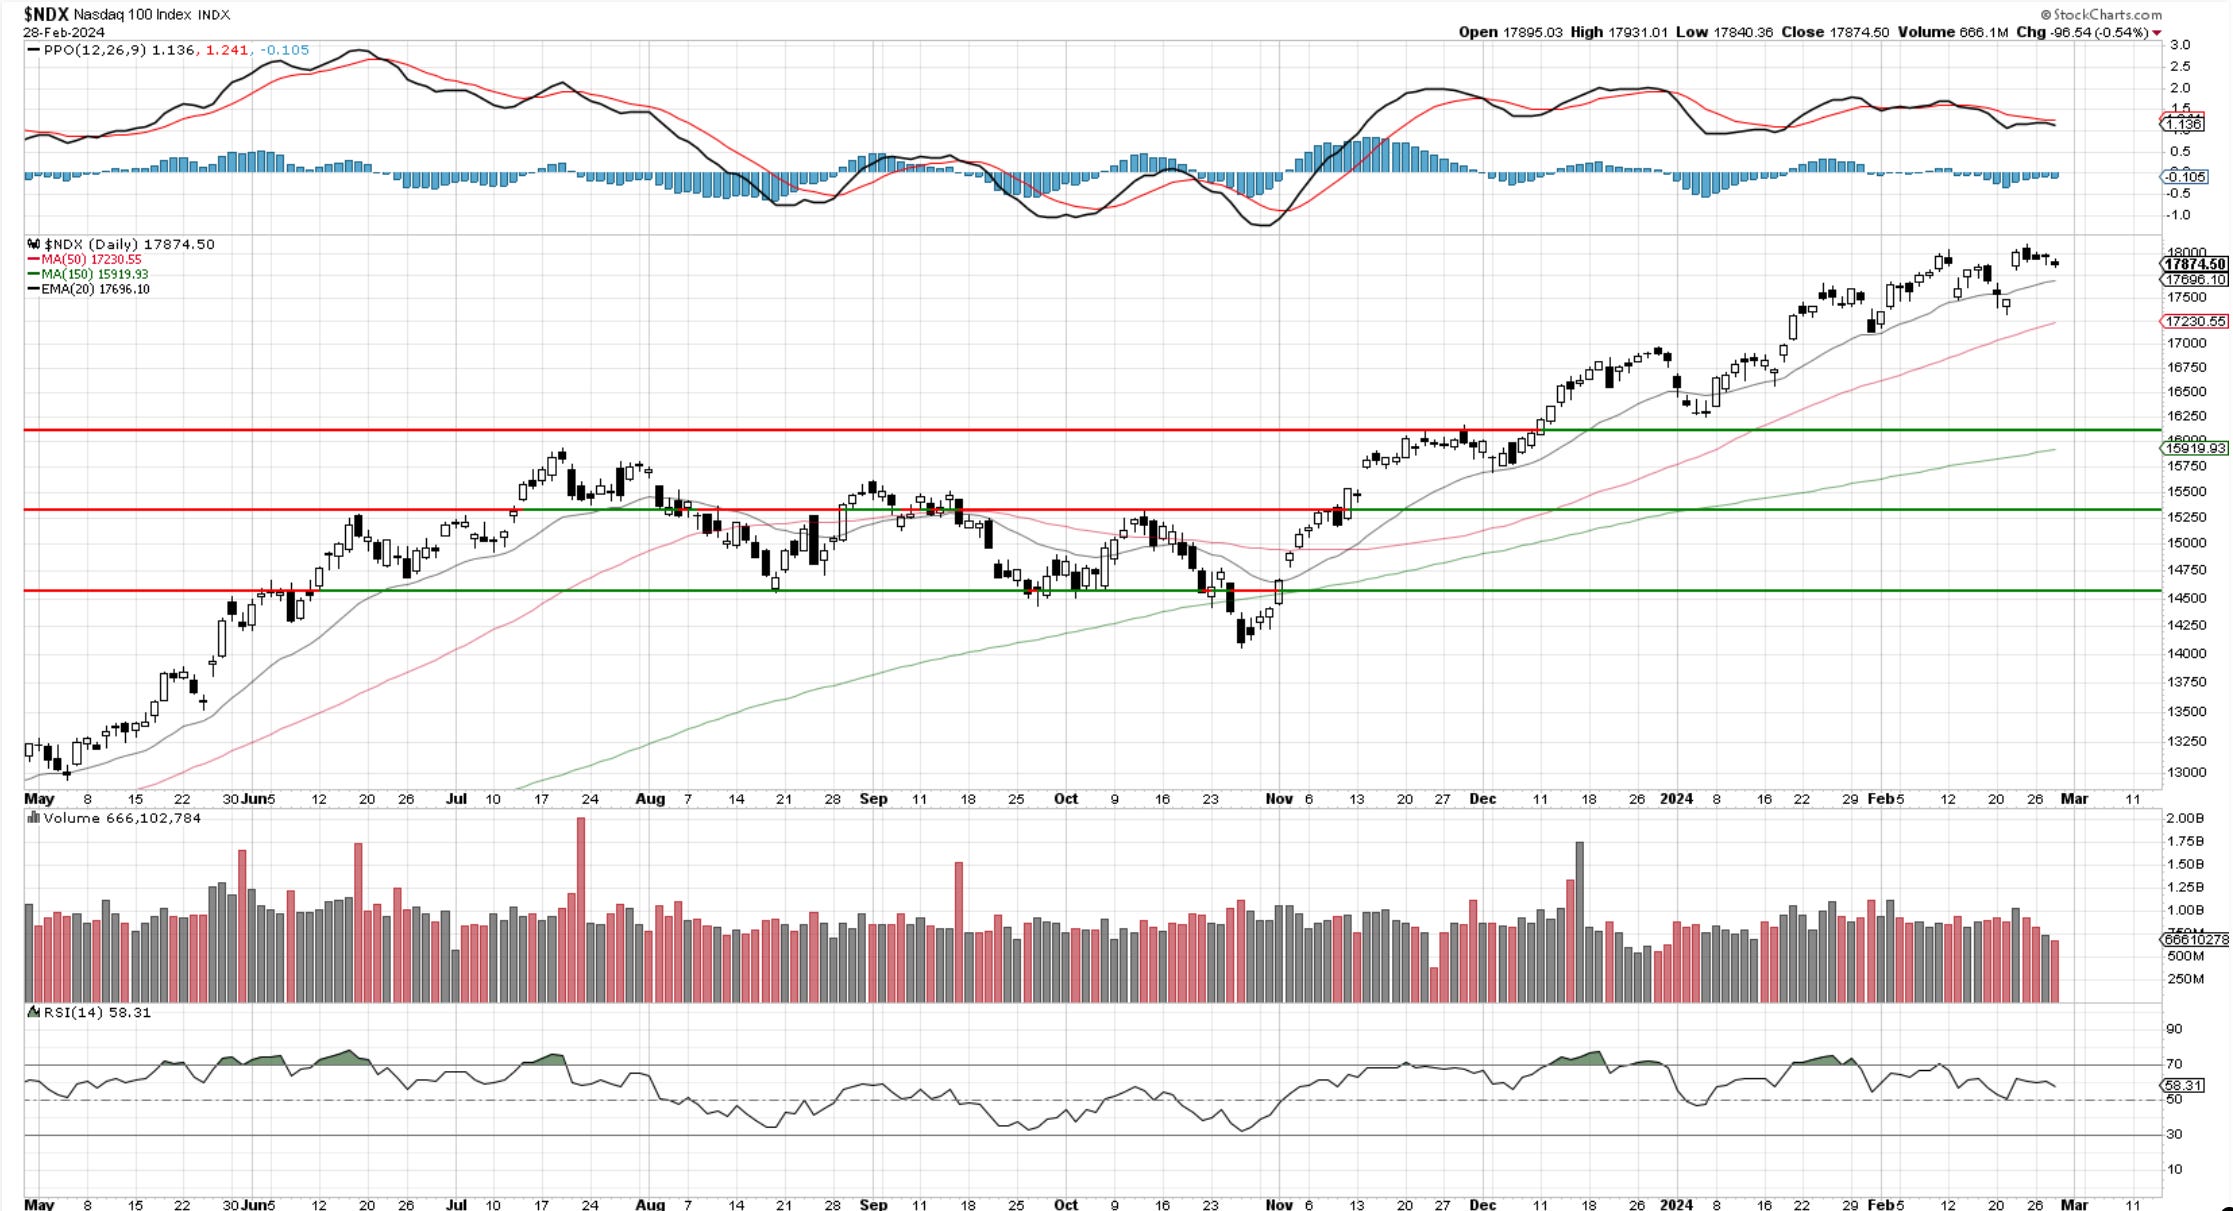
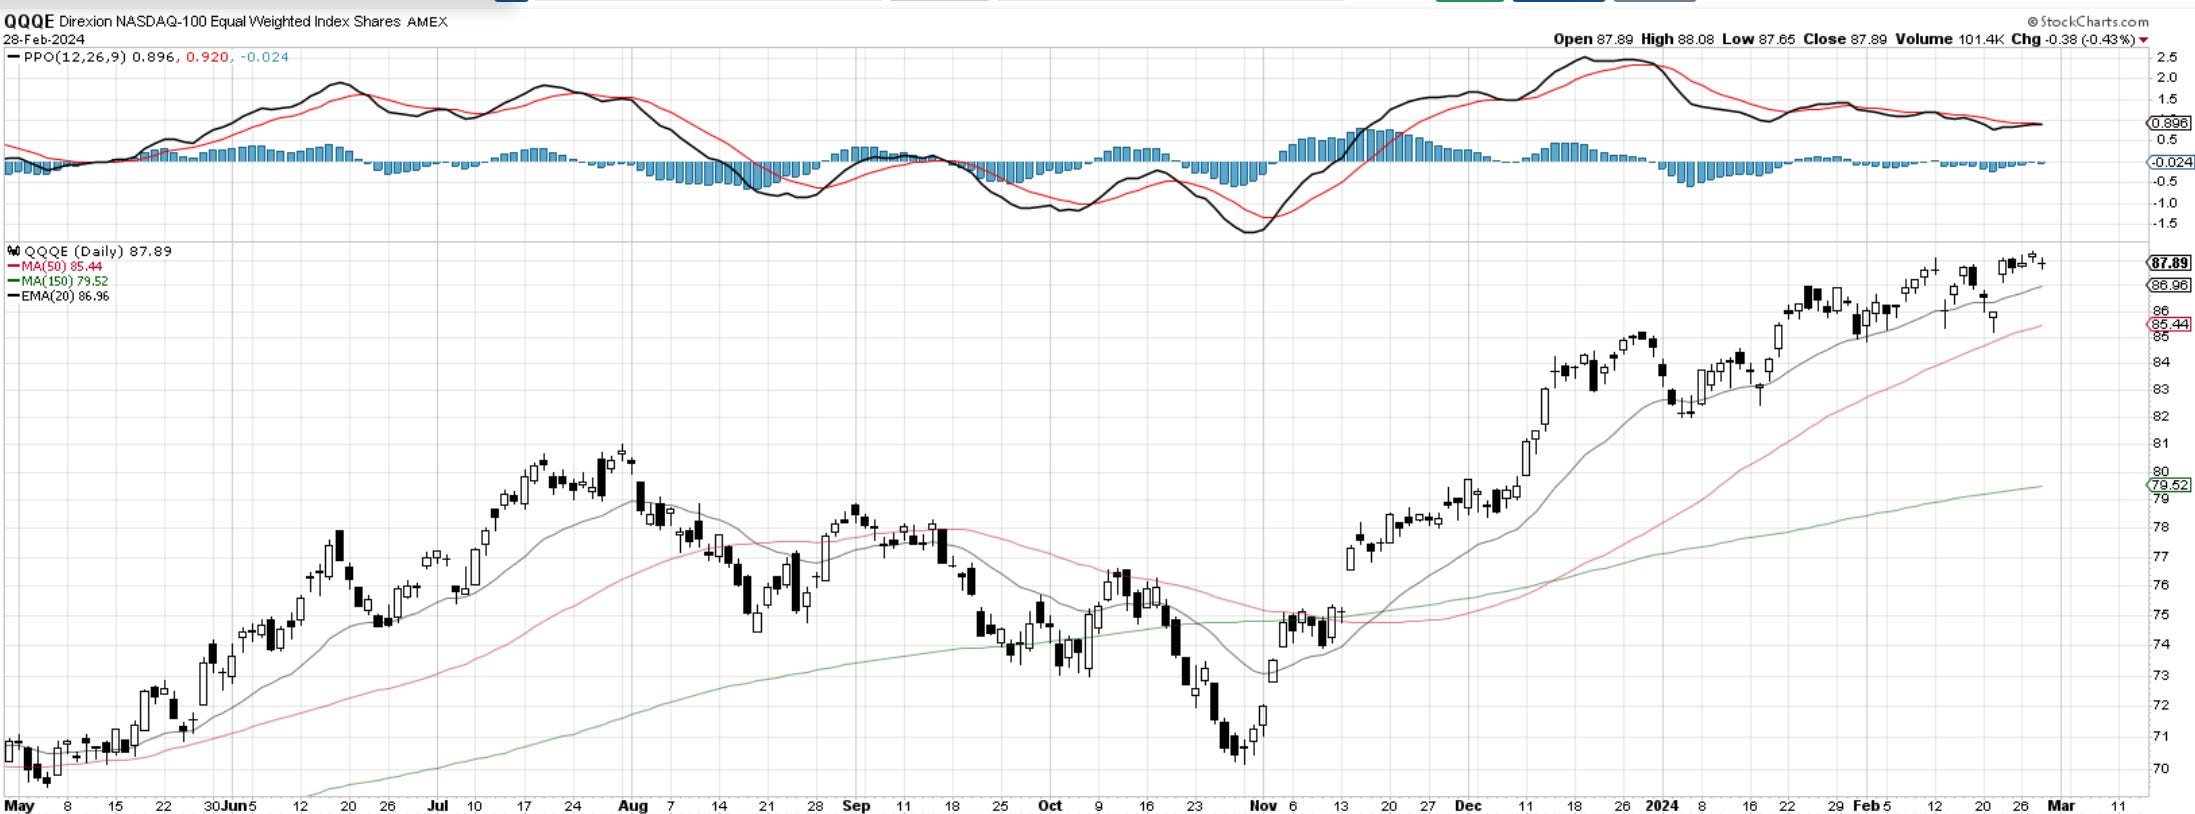
For comparison, take a look at QQQE - equal weight. Looking better. AAPL and GOOGL underperformance leaving marks on the cap weighted index.
RUSSELL 2000
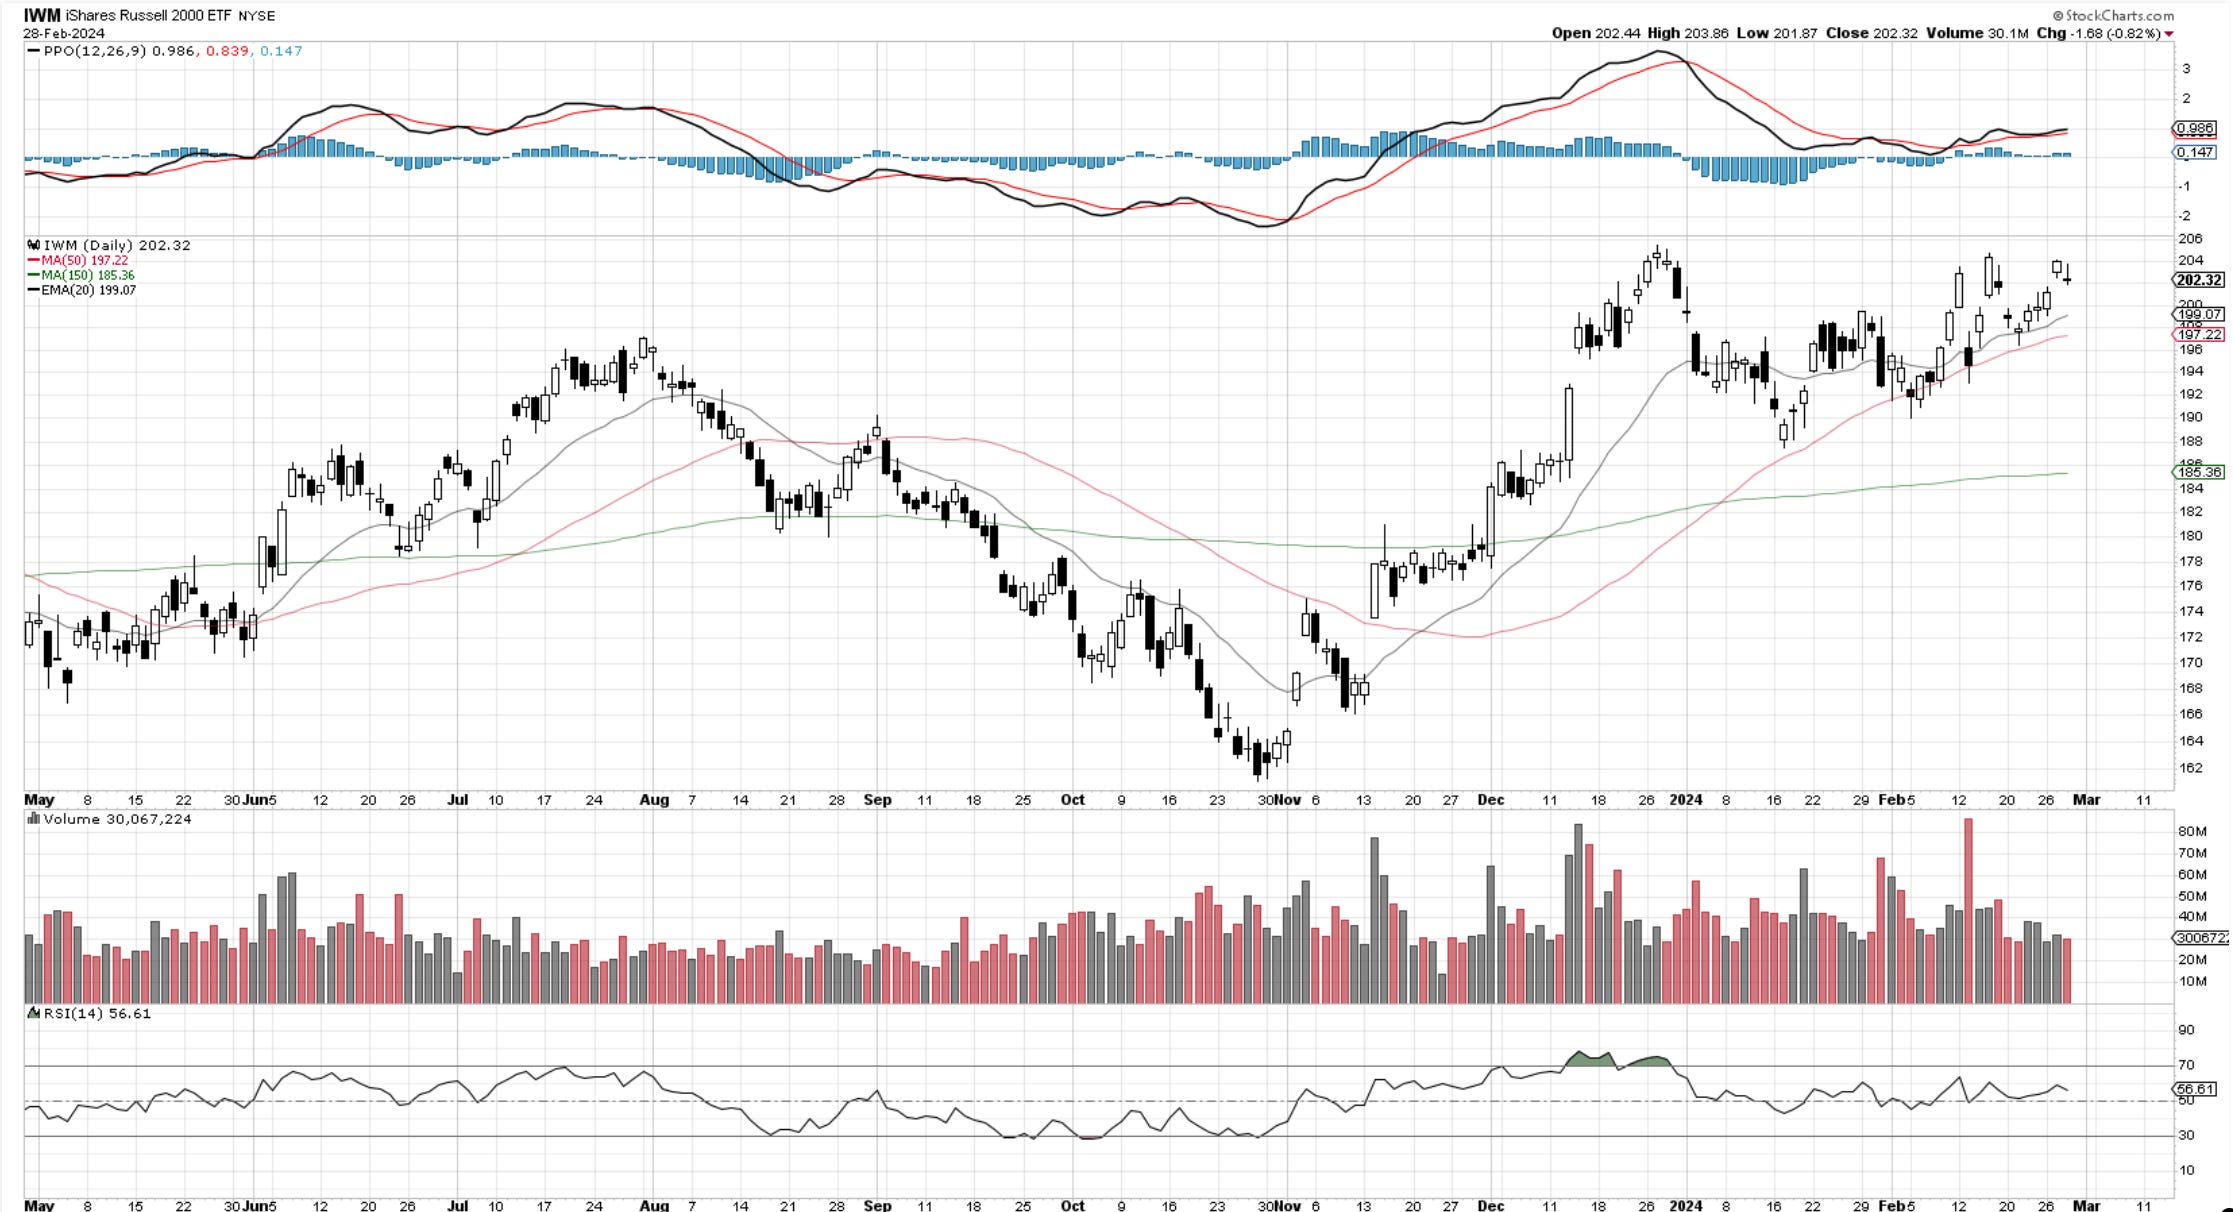
IWM dropped a bit but insignificant. Price holding above those upward-sloping moving averages is a good indicator of momentum buildup. Needs to break above 205, and once it does, it can really start accelerating. It has quite a bit to do with rates. Any Fed cuts will likely help this area of the market a great deal.
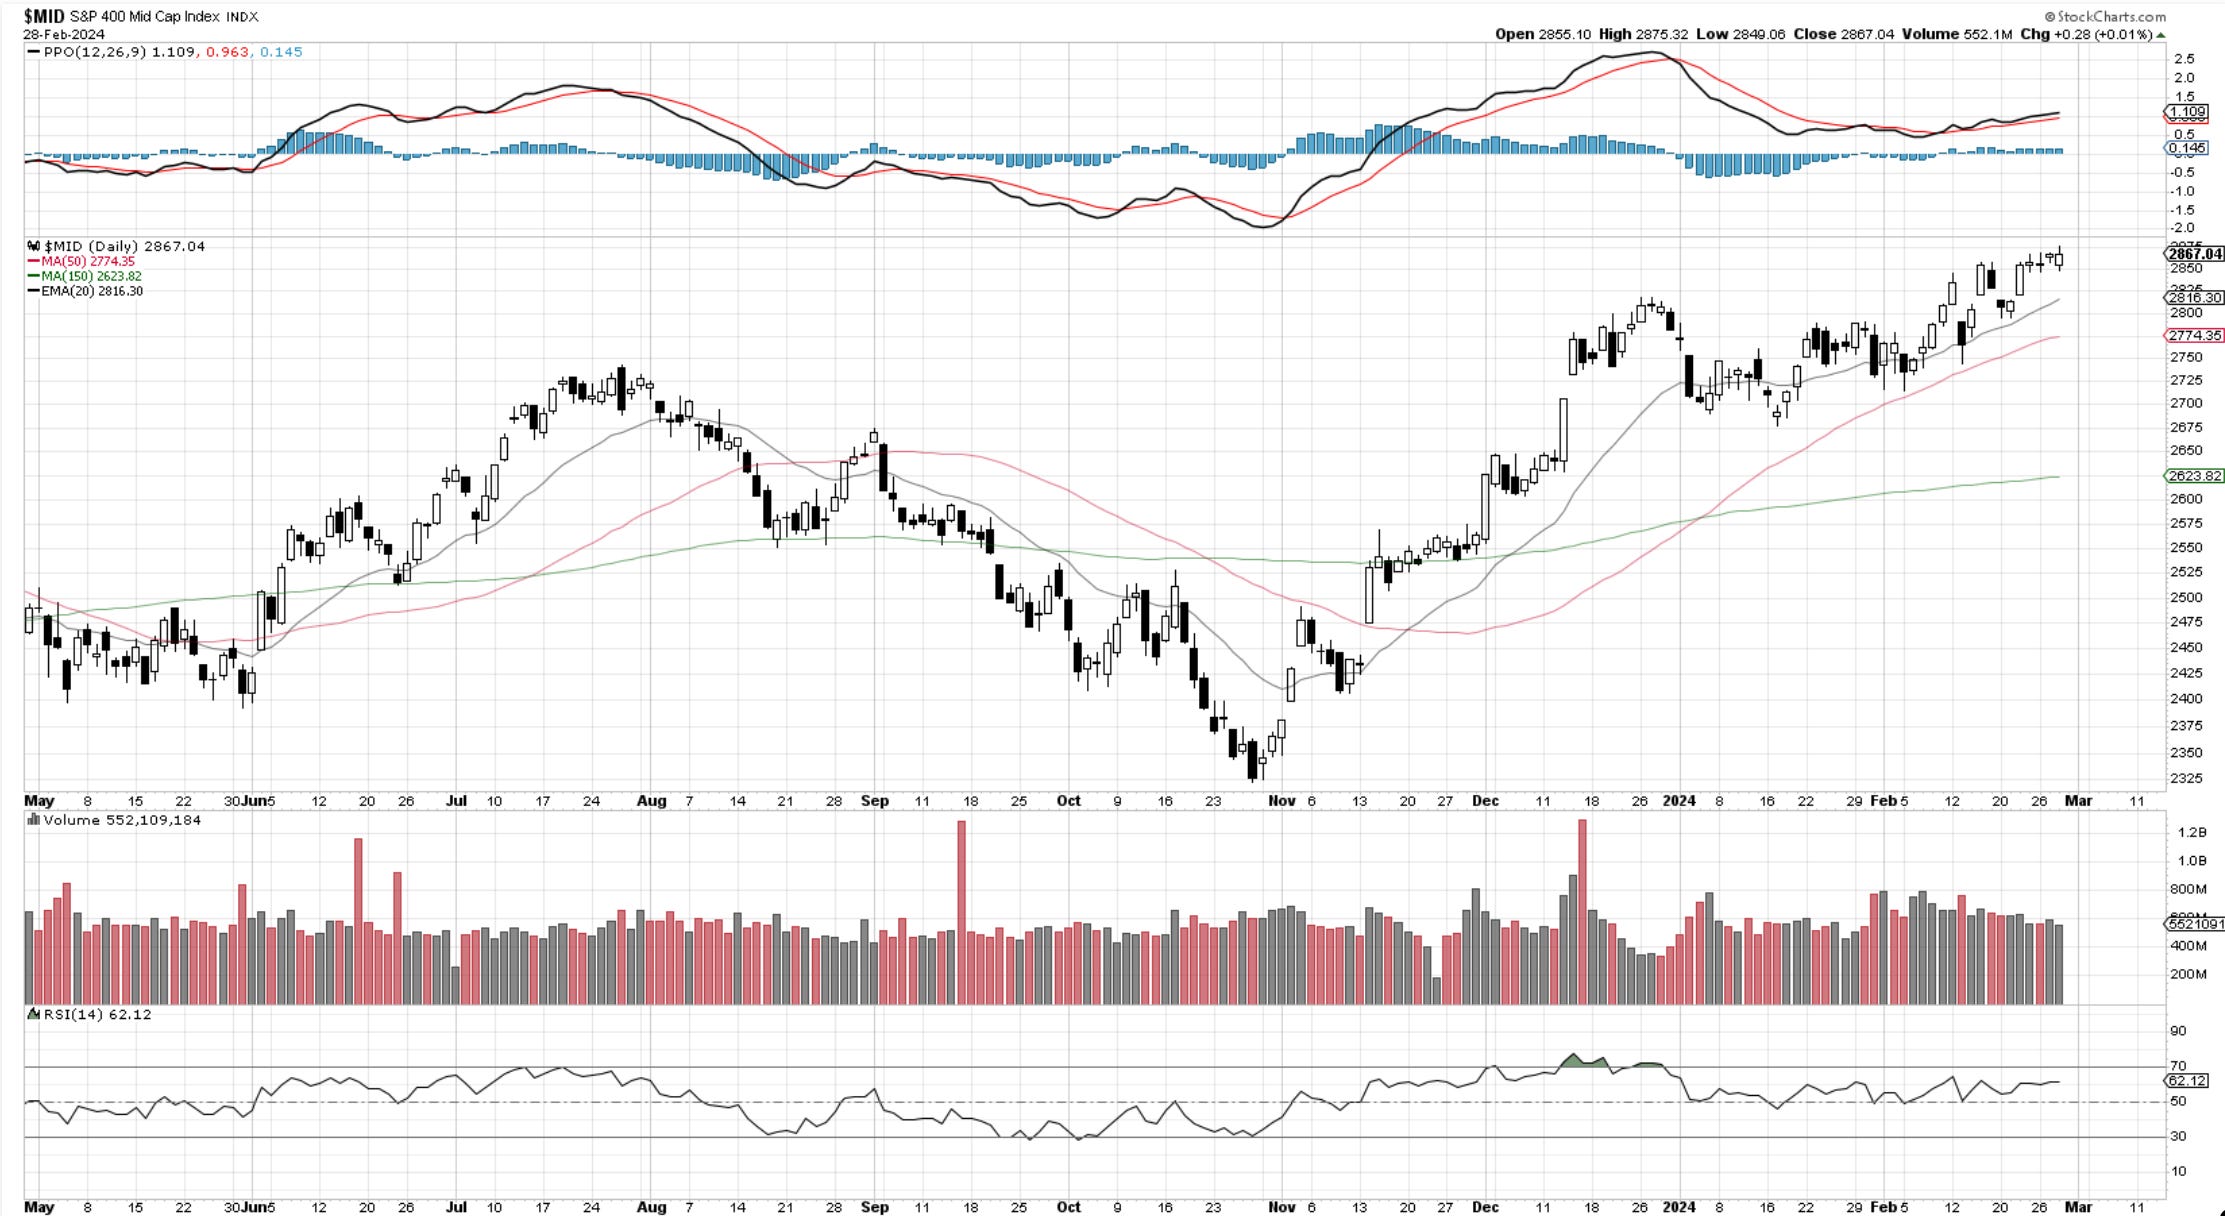
Here are mid-caps for comparison. Notice how the trend is trying to pick up.
For those wanting to chat with fellow traders, the link is below.

Dow30
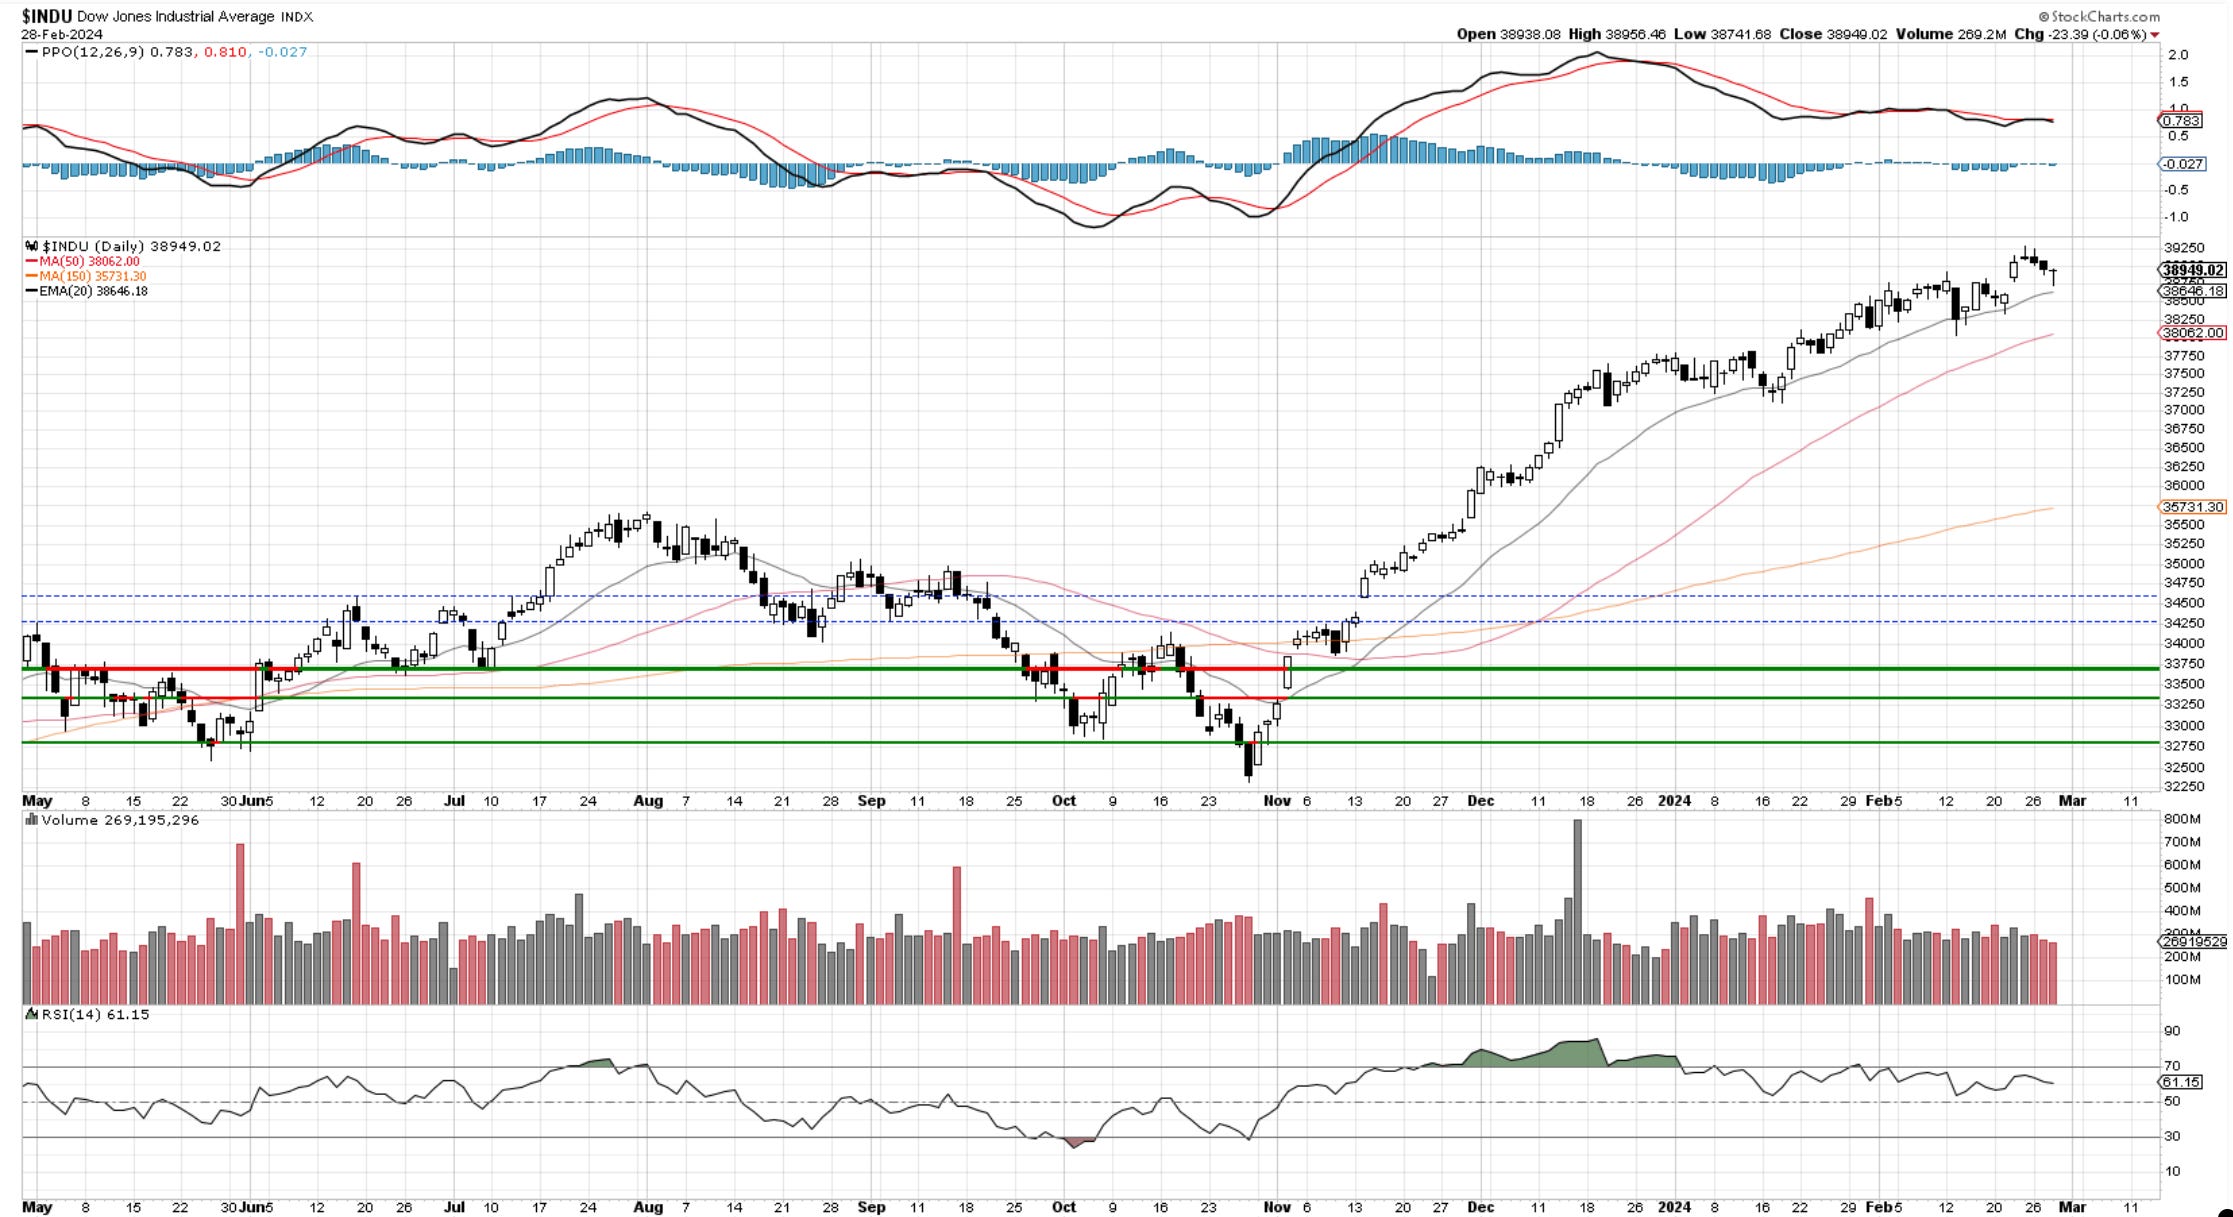
Check out that touch and bounce of the 20day. These are momentum-type accounts that buy no questions asked on any test of that indicator. The bottom line on something like this goes: the trend is up until it isn’t. They don’t make it any more complicated than that.
US Dollar and Yields
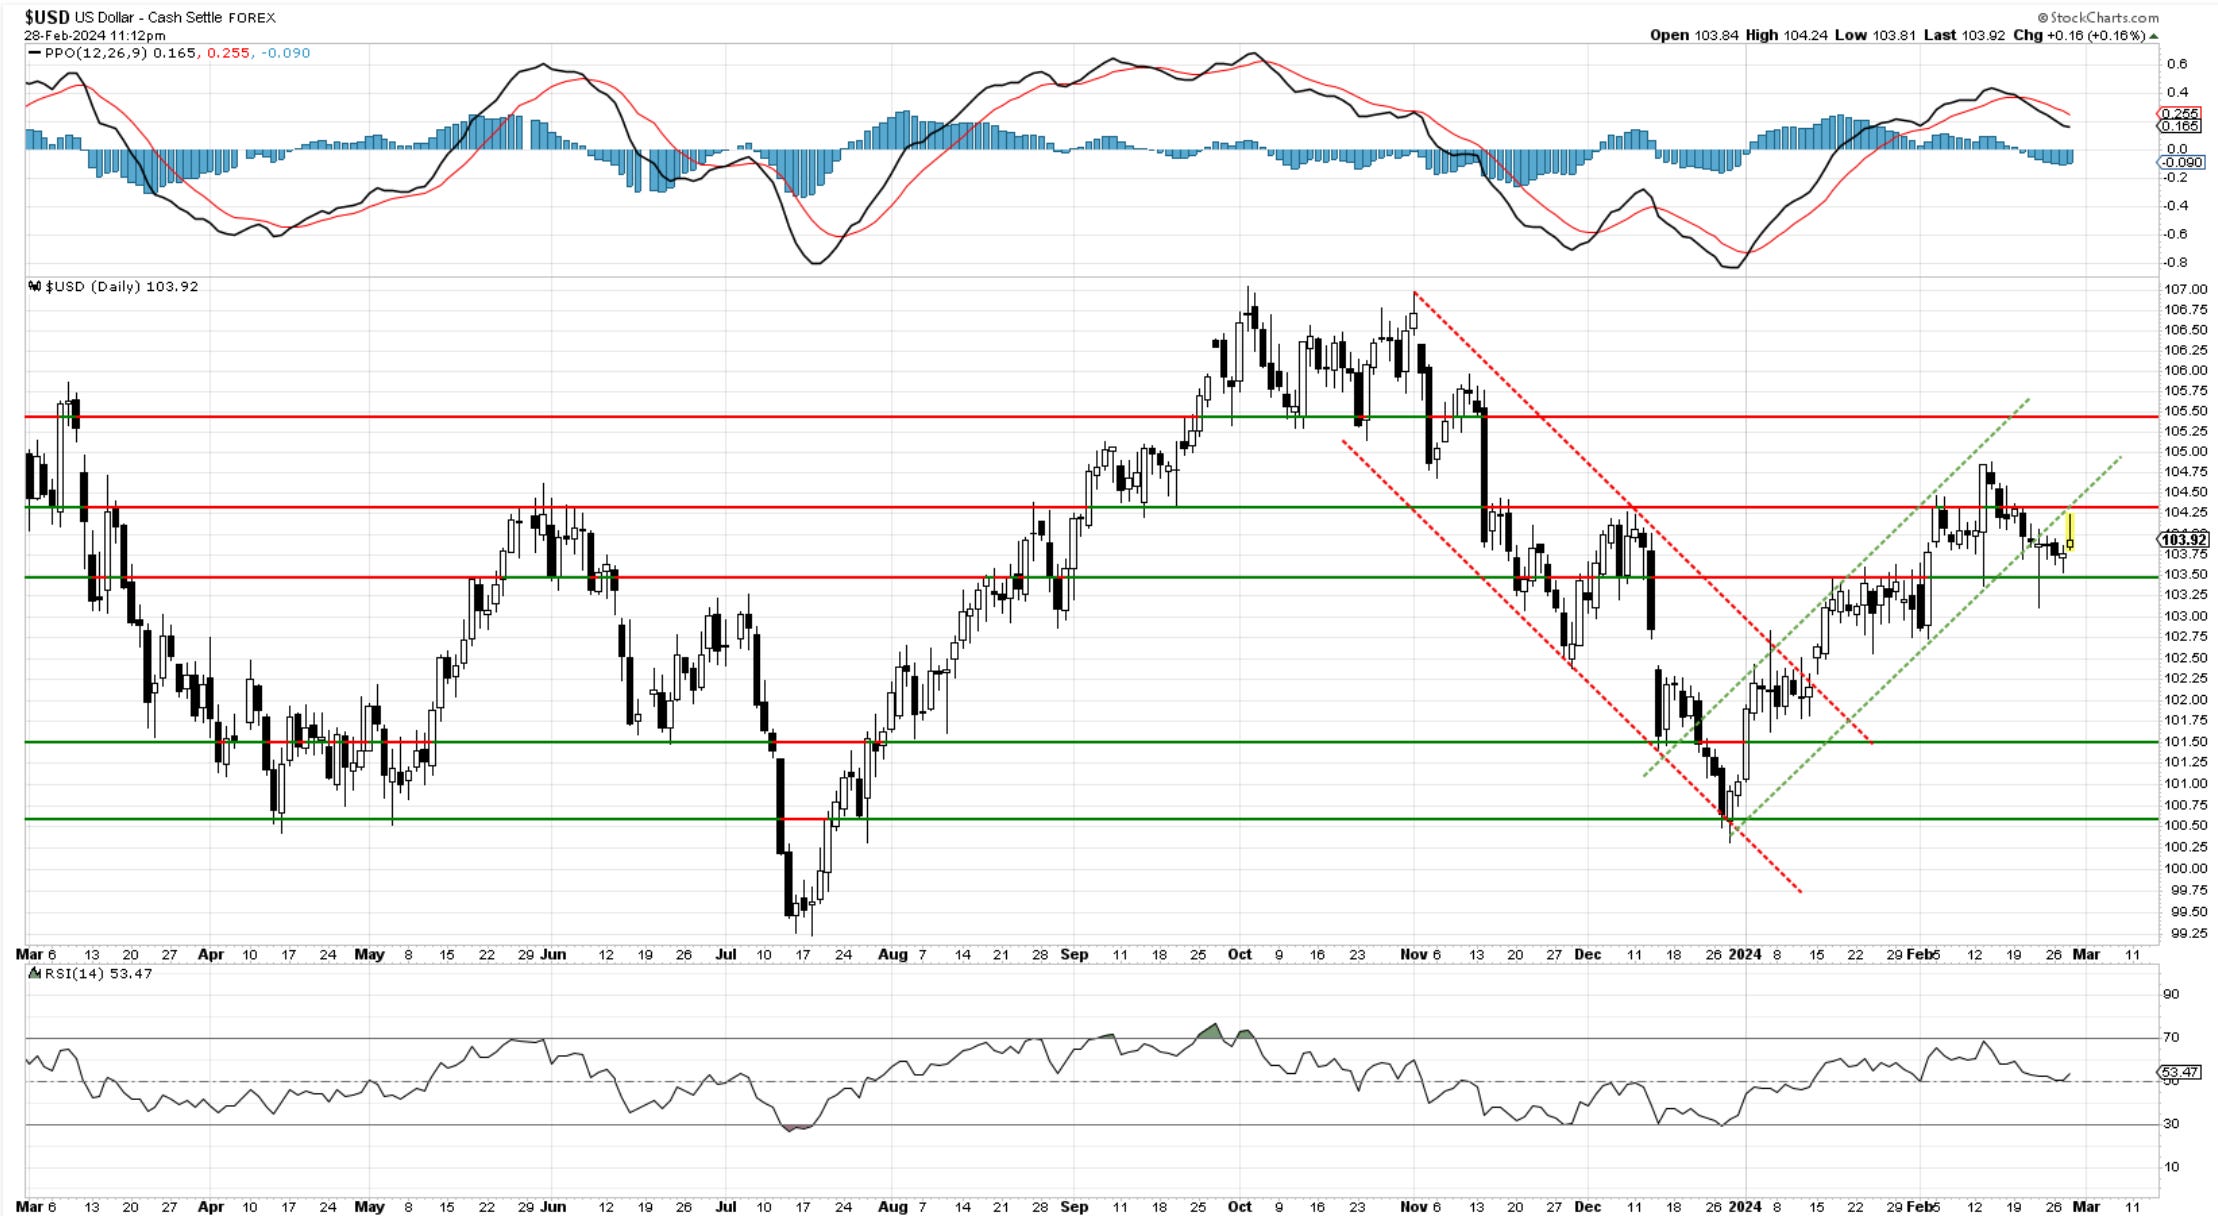
The dollar is not really in focus at the moment. Its price action is muted and does not provide good visibility. I will say that it has stopped trending up and broken the uptrend since last year. If it manages to crack and close below 103.50, I would take it as a signal positive for risk assets. 102.80 would be the next target. PCE tomorrow might have something to say on this, so hold tight.
10-year yields are coiled below 4.3%. A strong PCE tomorrow would break that level to the upside a create a risk event. If in line or lower, I would not be surprised to see yields at 4.1%.
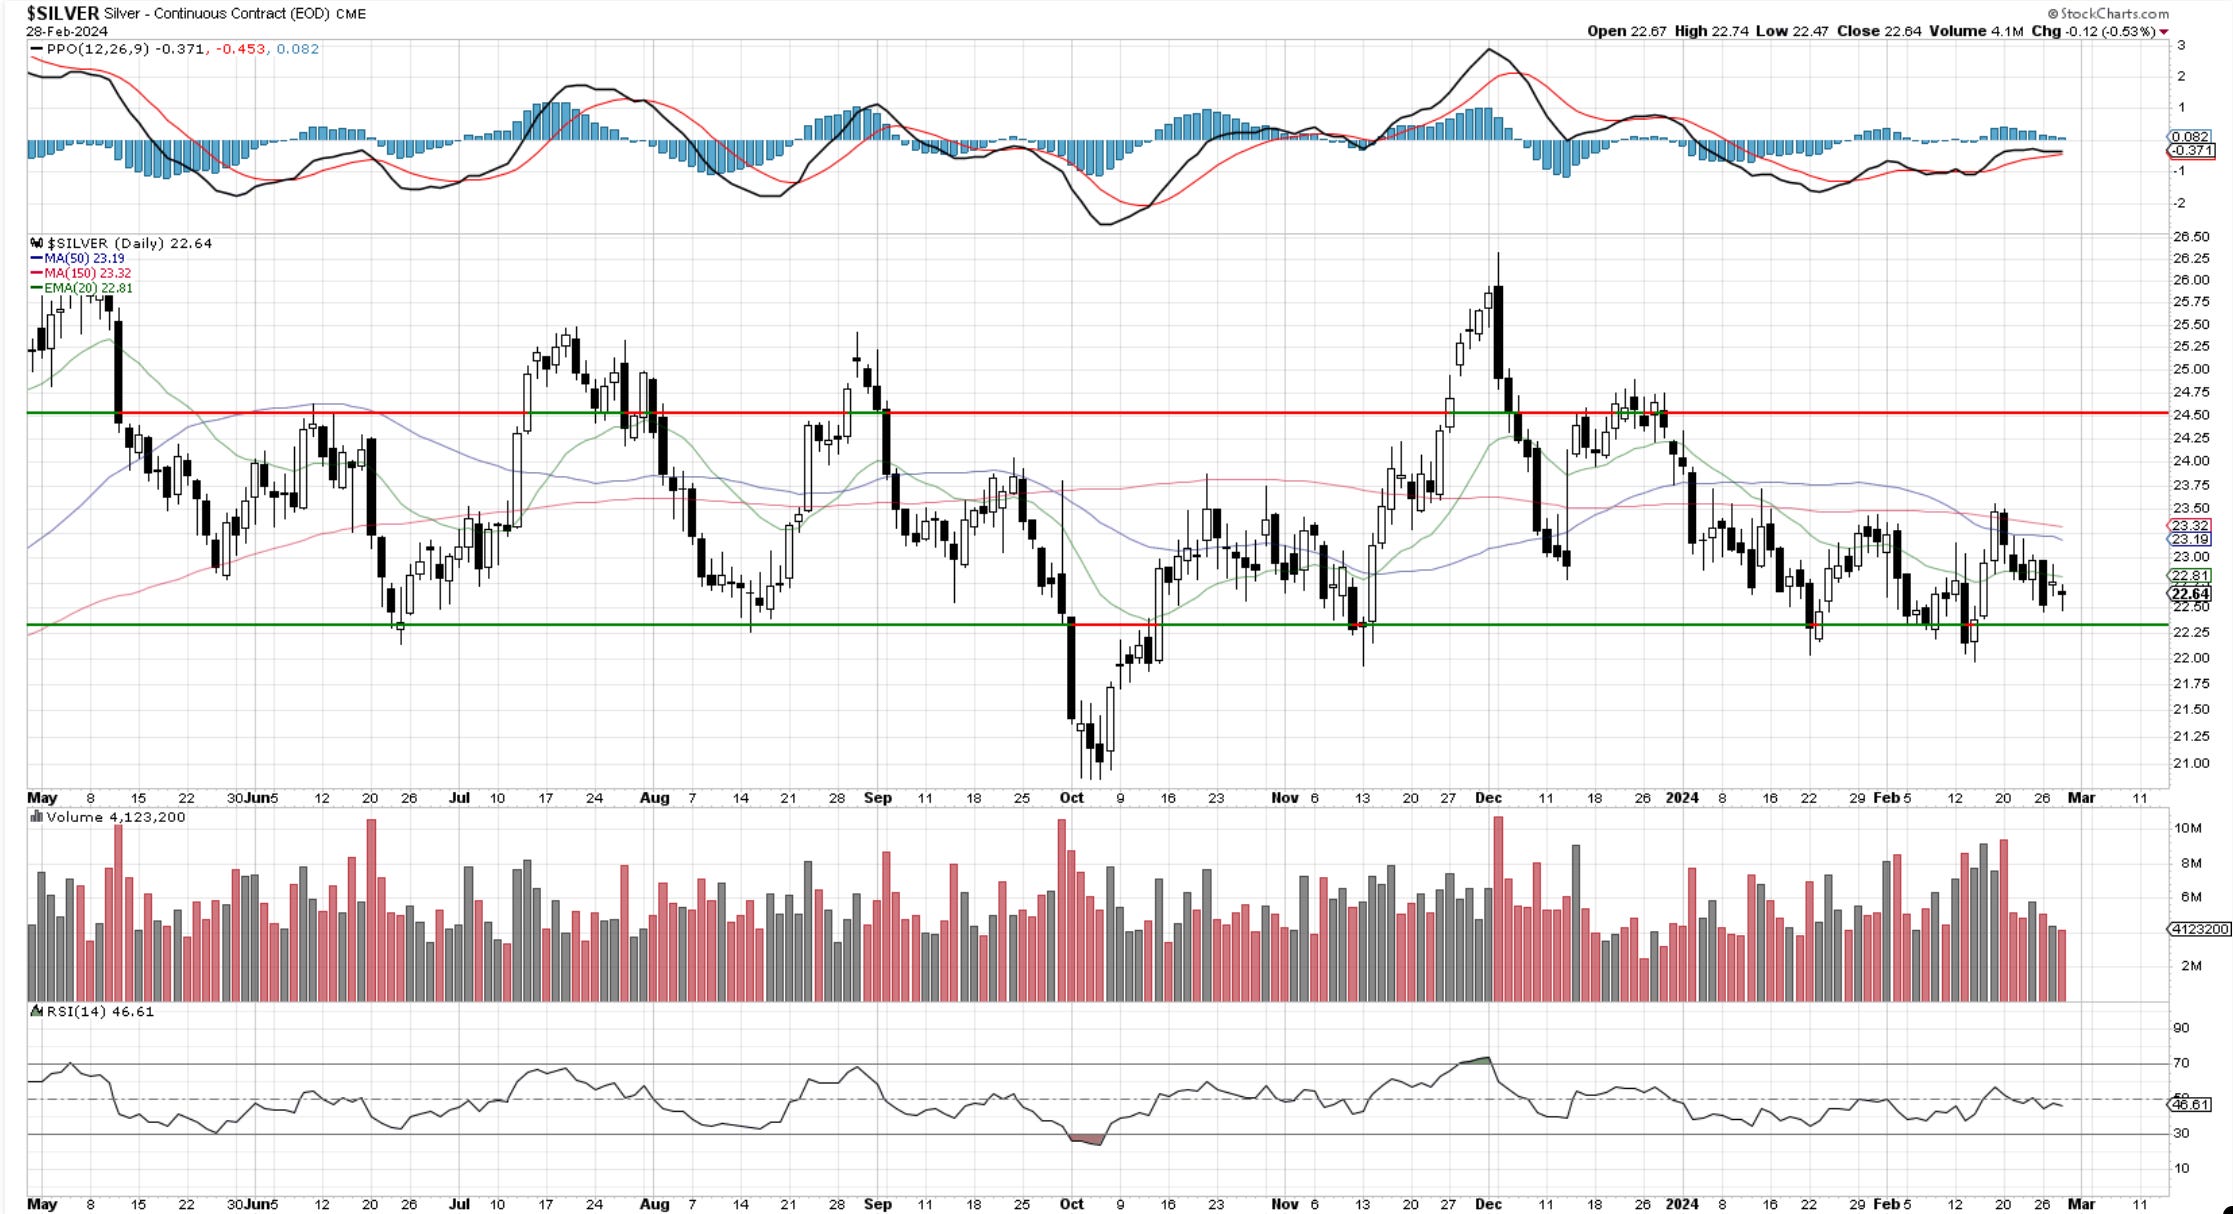
Gold and Silver
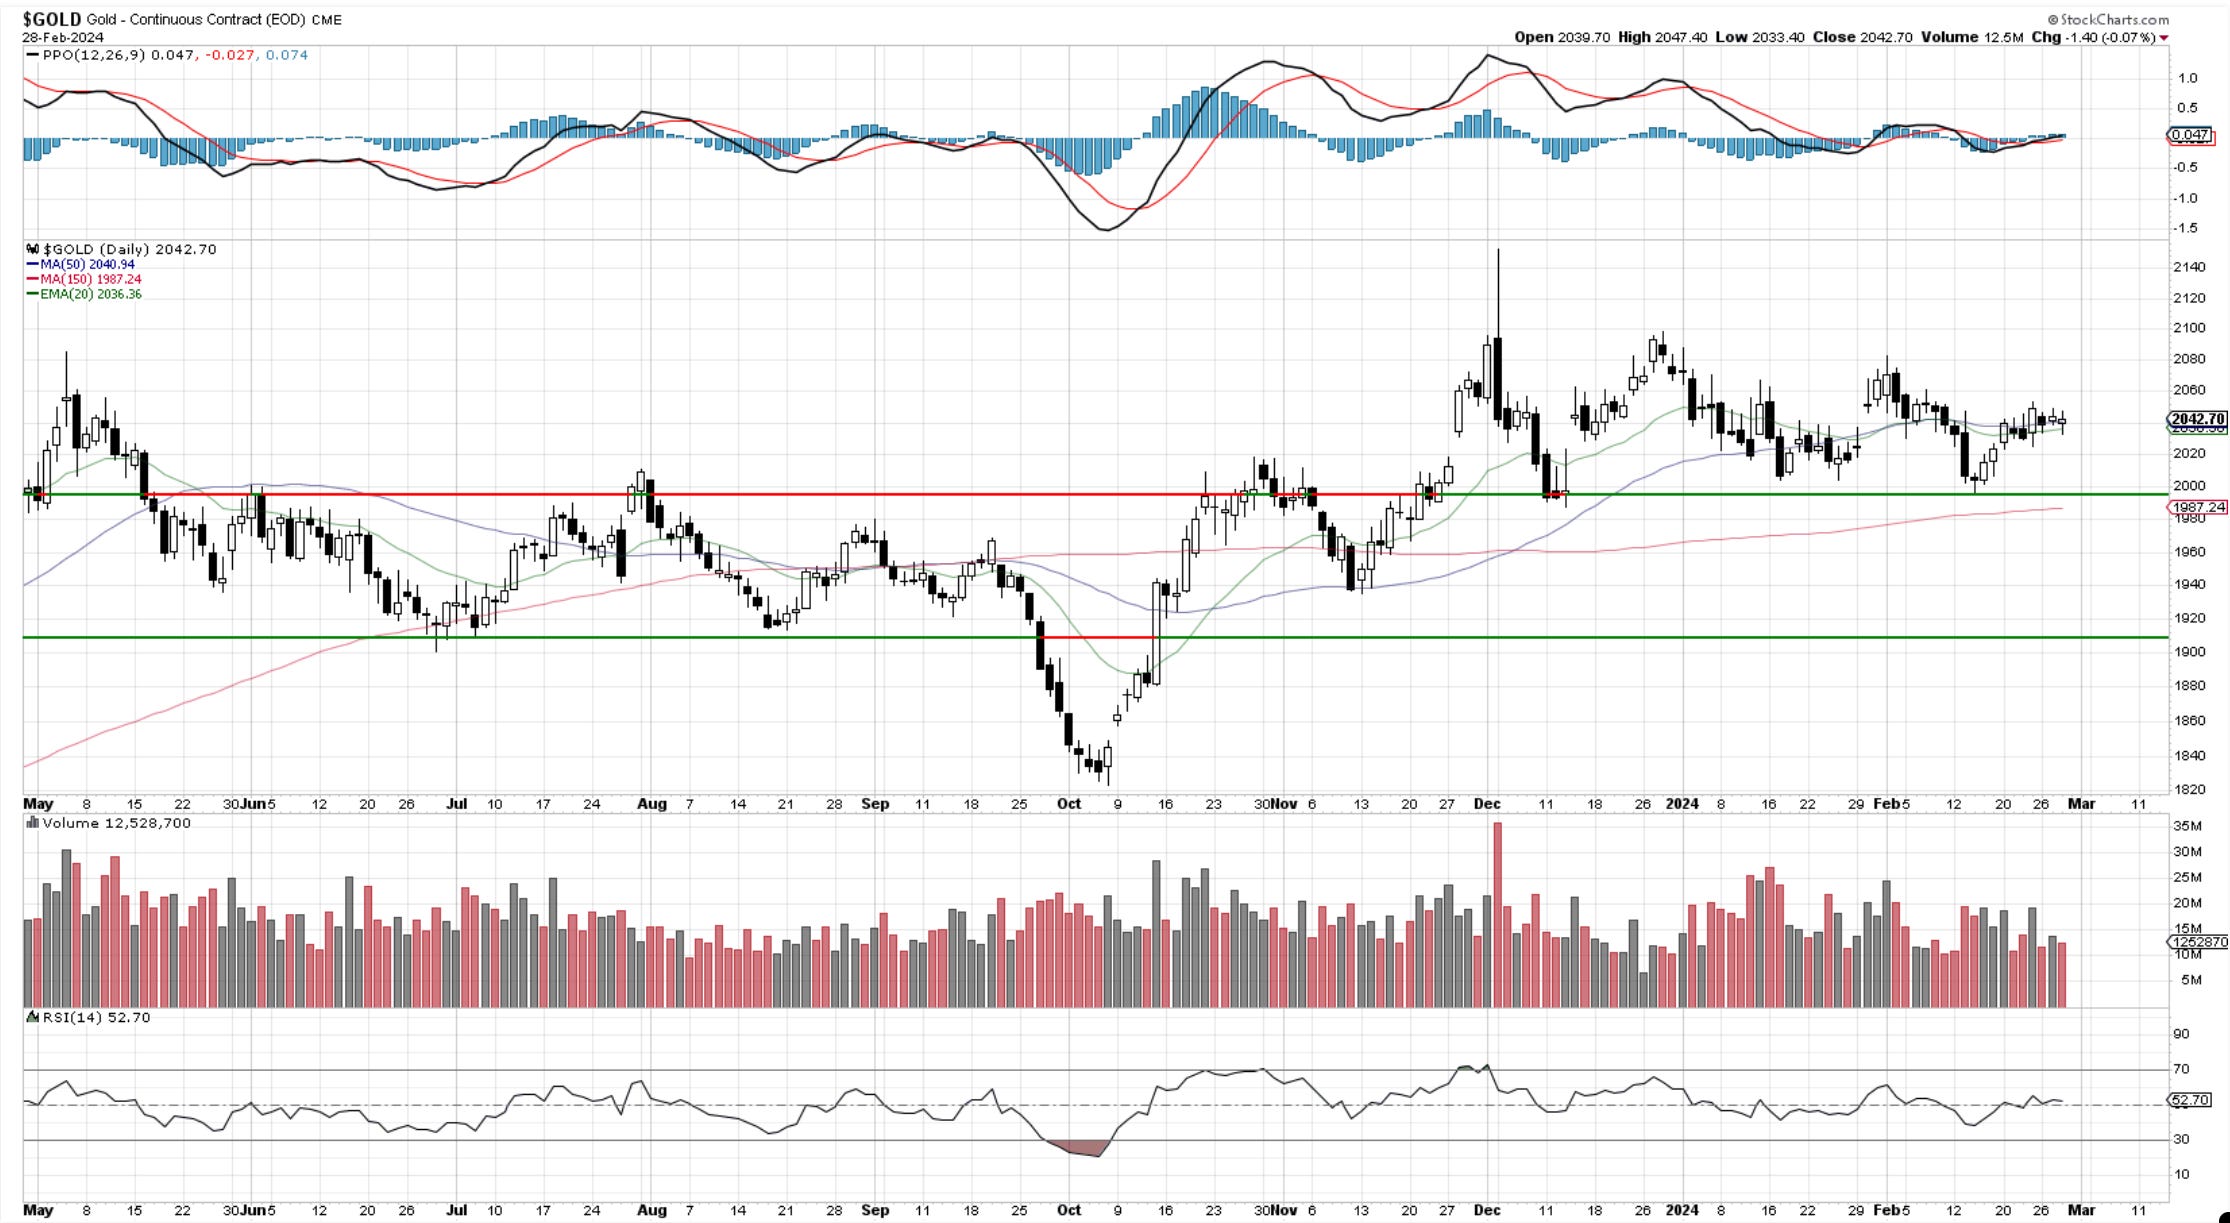
Gold is tight. Very tight. Converging price action and flat MACD. Basically non-trending. But from this come explosive moves. I will not guess which way it will be, but rest assured, once we see it break, one must jump on the train and let it ride. It could try a shakeup first. We will see. I have my eyes on it daily, and I will bring it to your attention once it warrants commentary.
Silver is just above massive support and has been sitting here since mid-January with some false starts. Targeting the top of the range near 24.50 with stops below 22 is a trade idea.
Bitcoin
Since I am displaying weekly charts, here is the main one I follow in Bitcoin. It speaks for itself; it just needs time to play out.
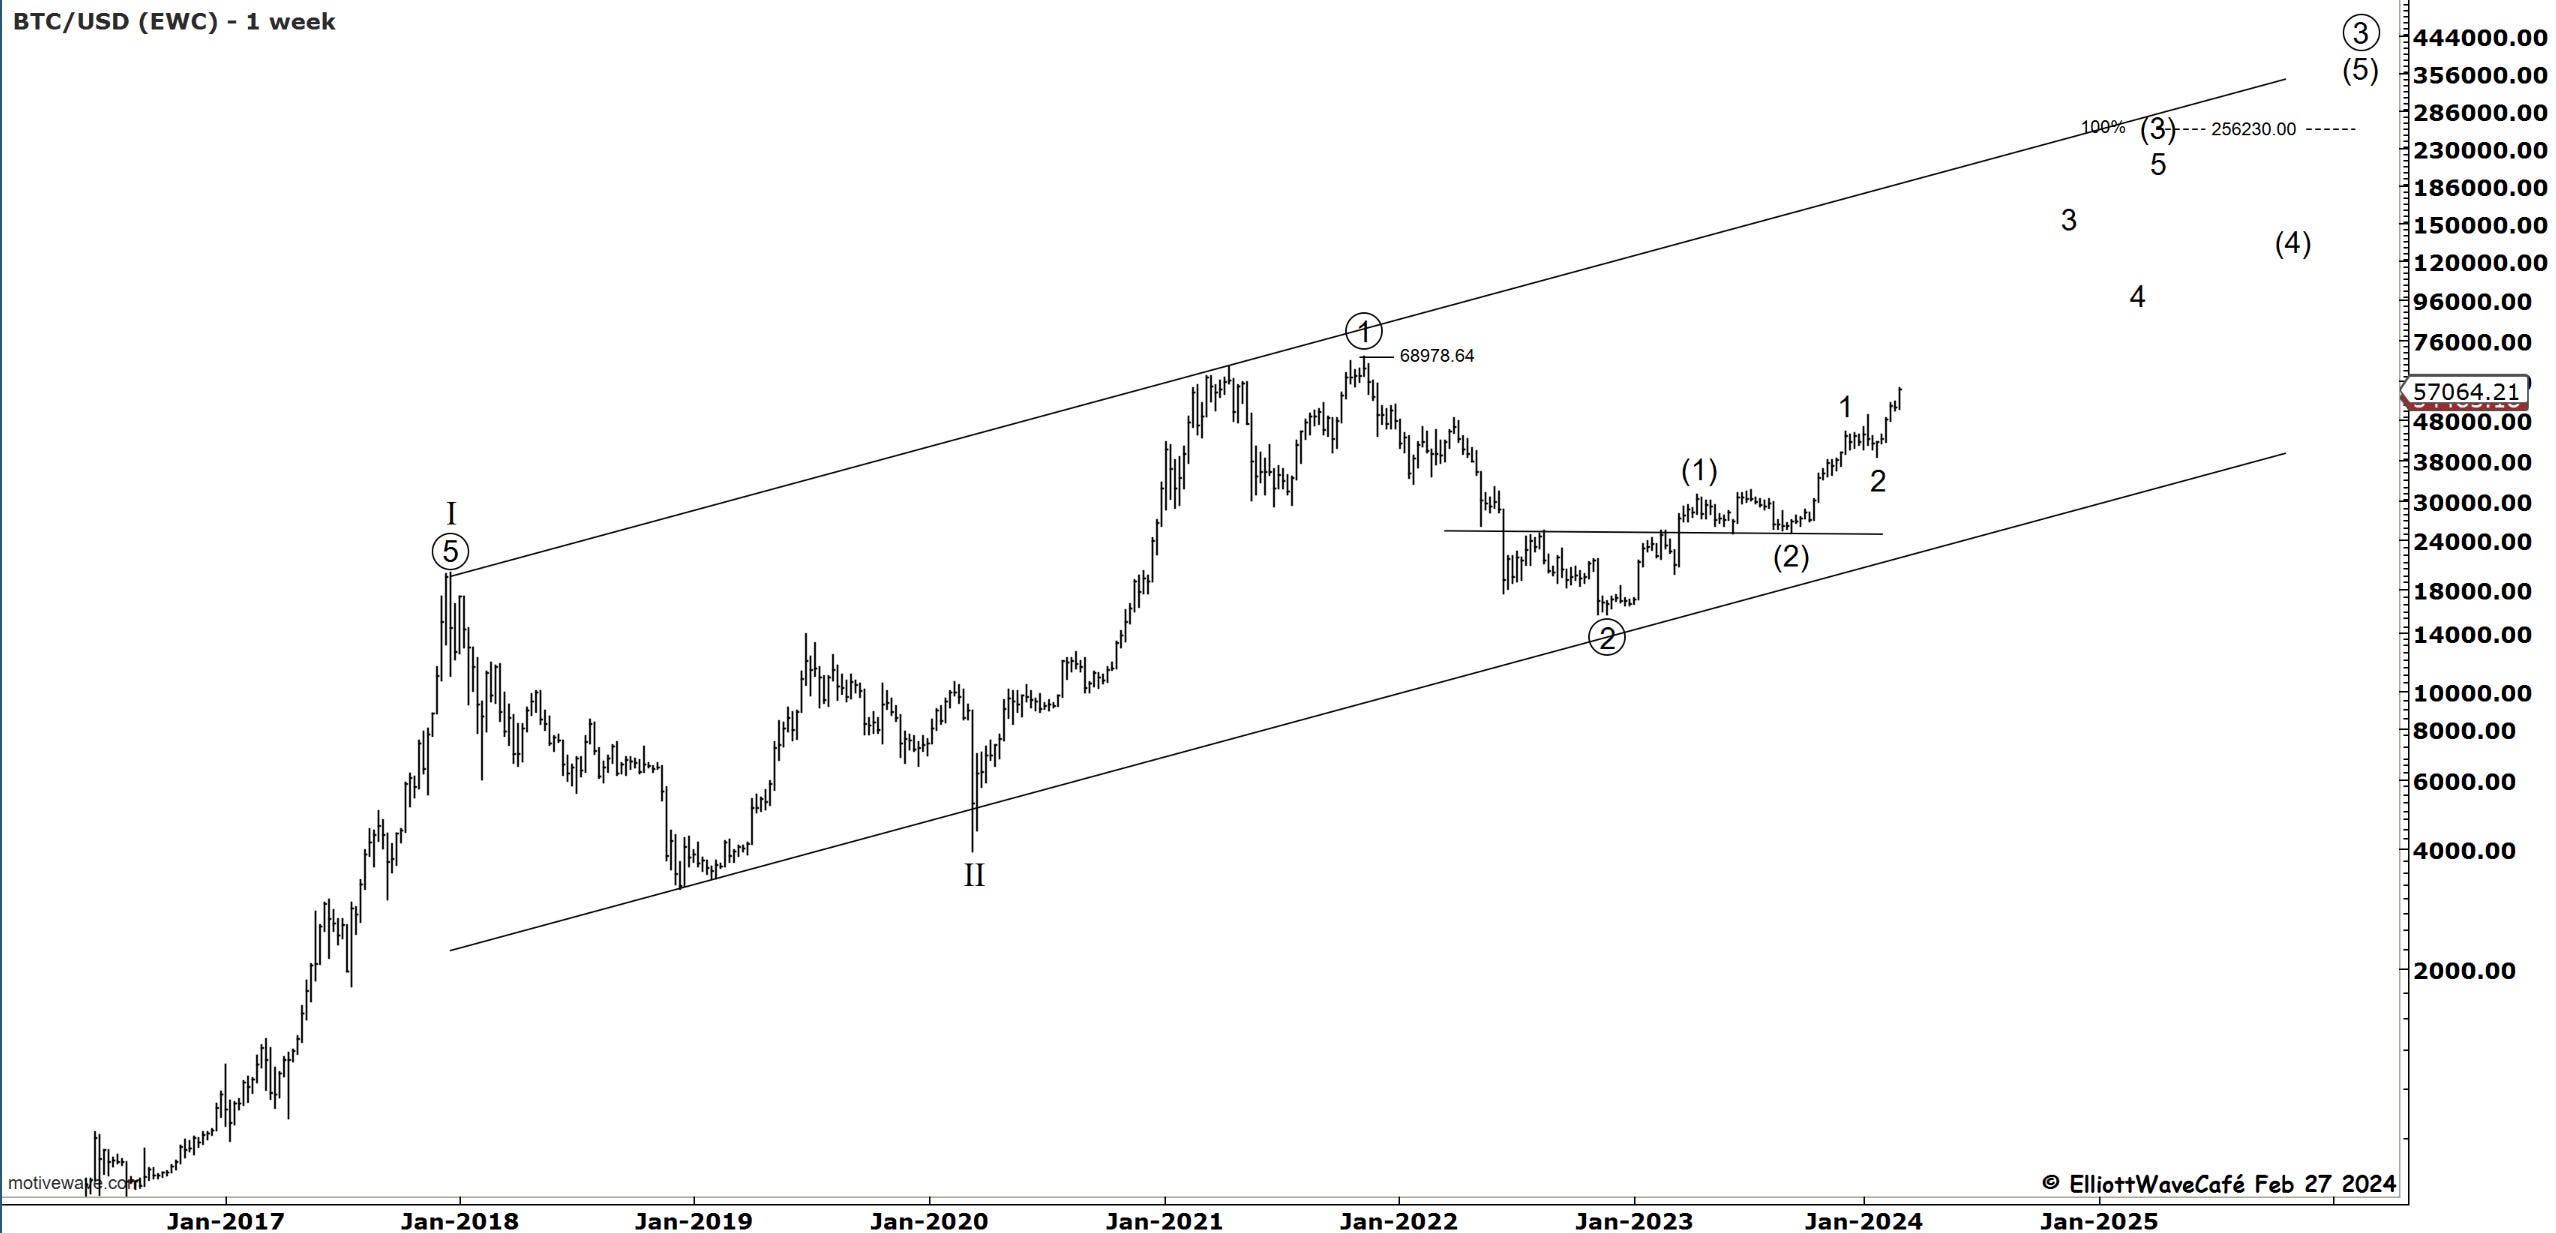
This is why one cannot make wave-top assumptions in strong trends and why I said no reason to get cute with it as it has good momentum. BTC touched way past my 60k mentions, hitting almost 64k. A 1,2 1,2 is a very powerful count and leads to explosive action. Notice how we broke above the top of the channel, another sign that we are currently in a wave 3 setup.
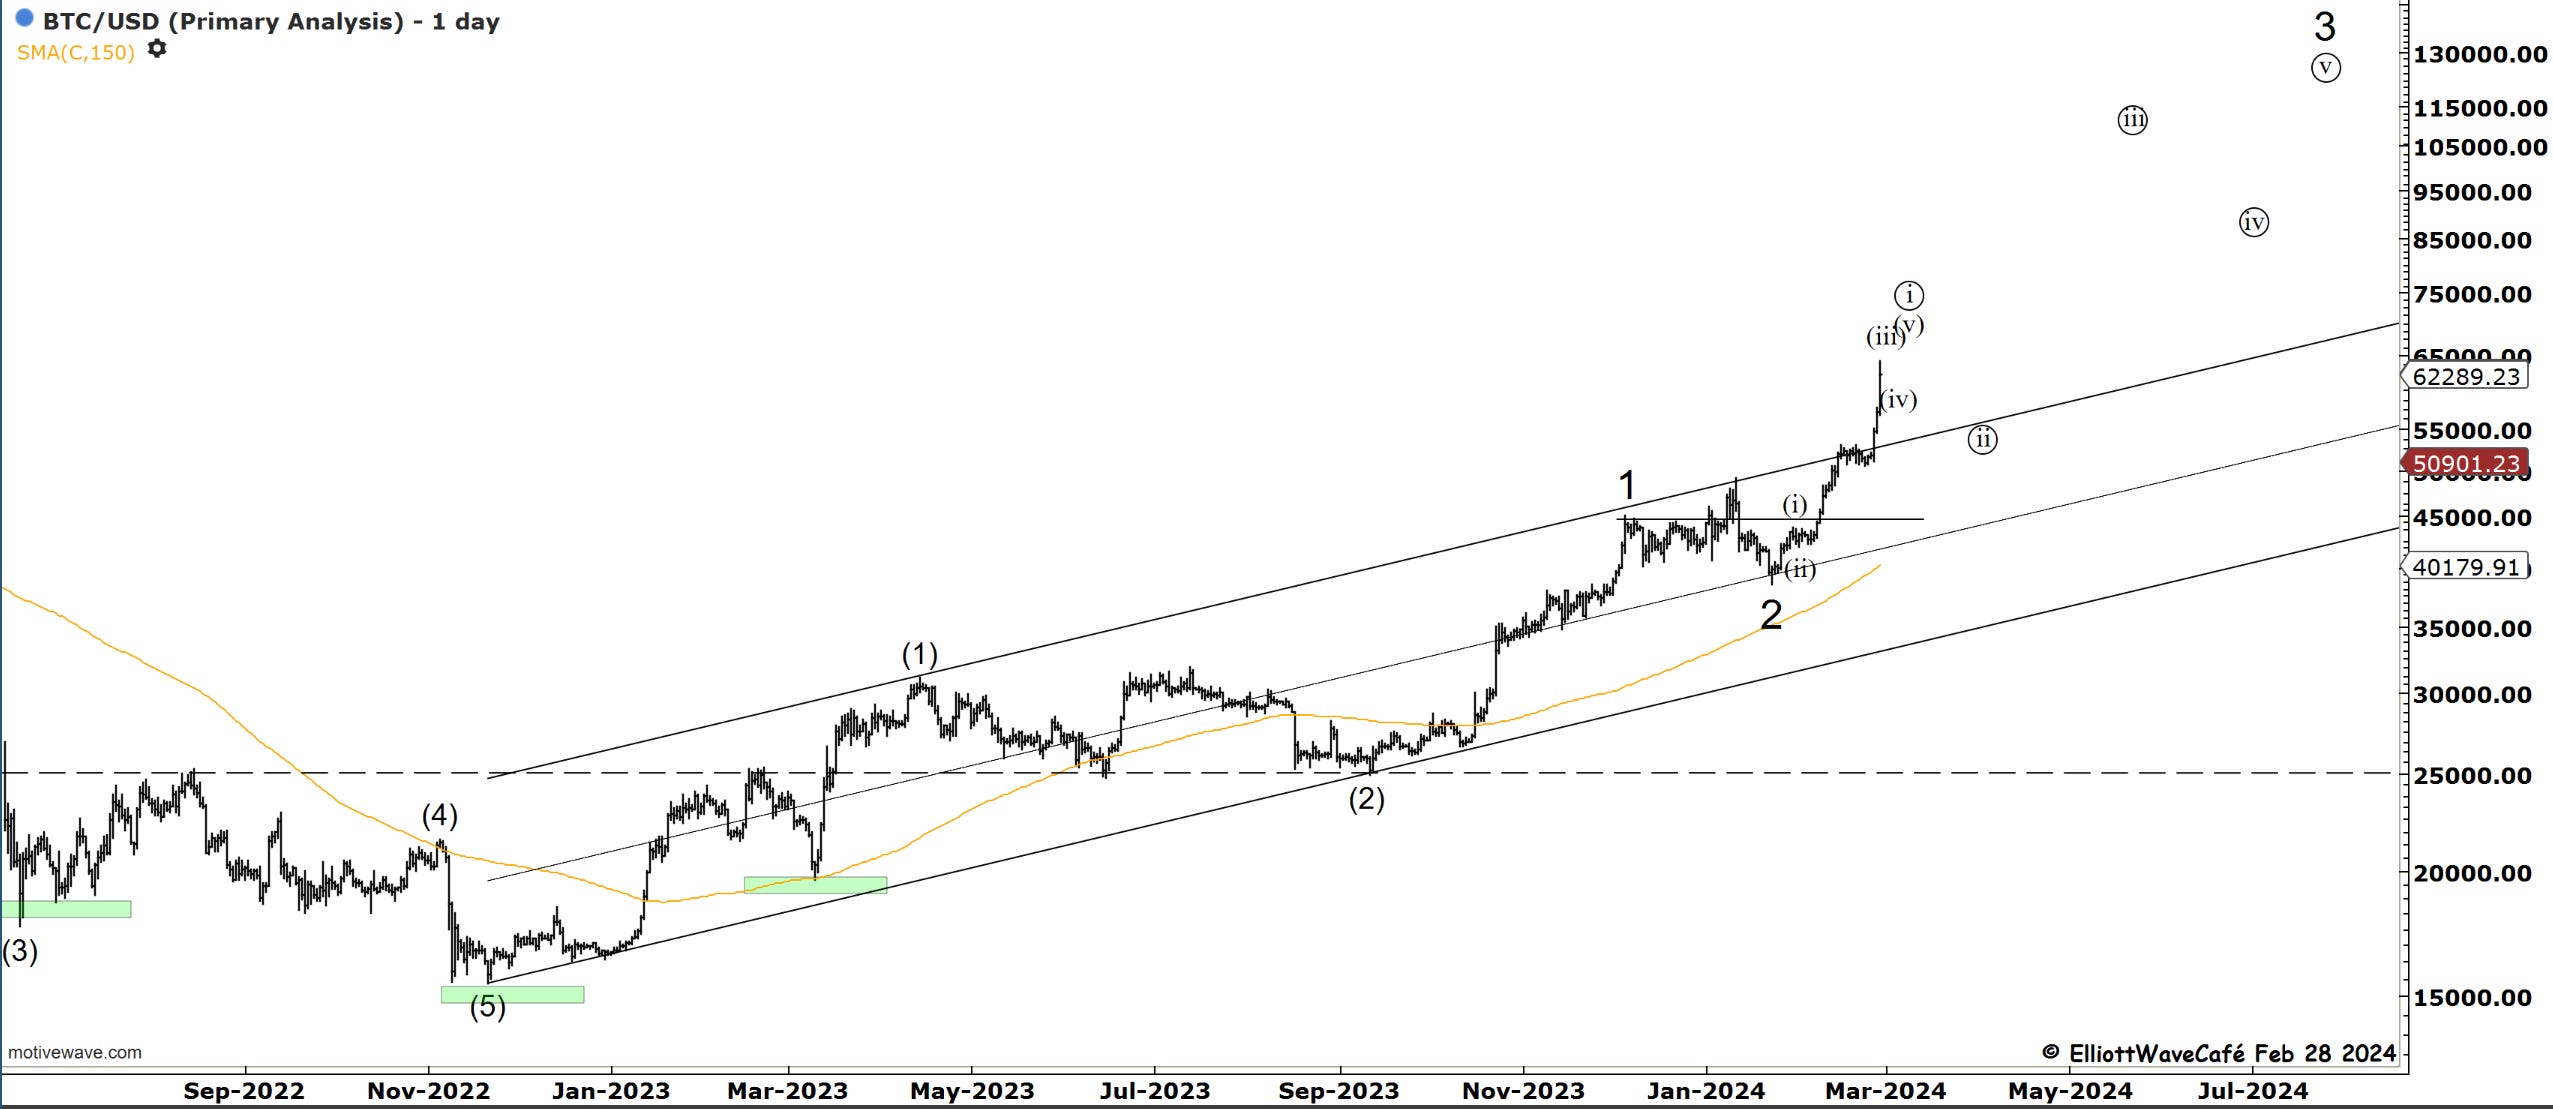
A shorter-term market might listen to a wave ((i)) formation, or it might not. The labels presented are suggestions as per the EW principle. The reality of trends could be very different. All I am saying is, let’s give the market the benefit of the doubt and let it breathe as it wants to. Once it’s ready to start some levels of correction, I think it will become apparent. It has not yet.
Are the “laser eyes” back or has the crypto community learned its sentiment lesson?
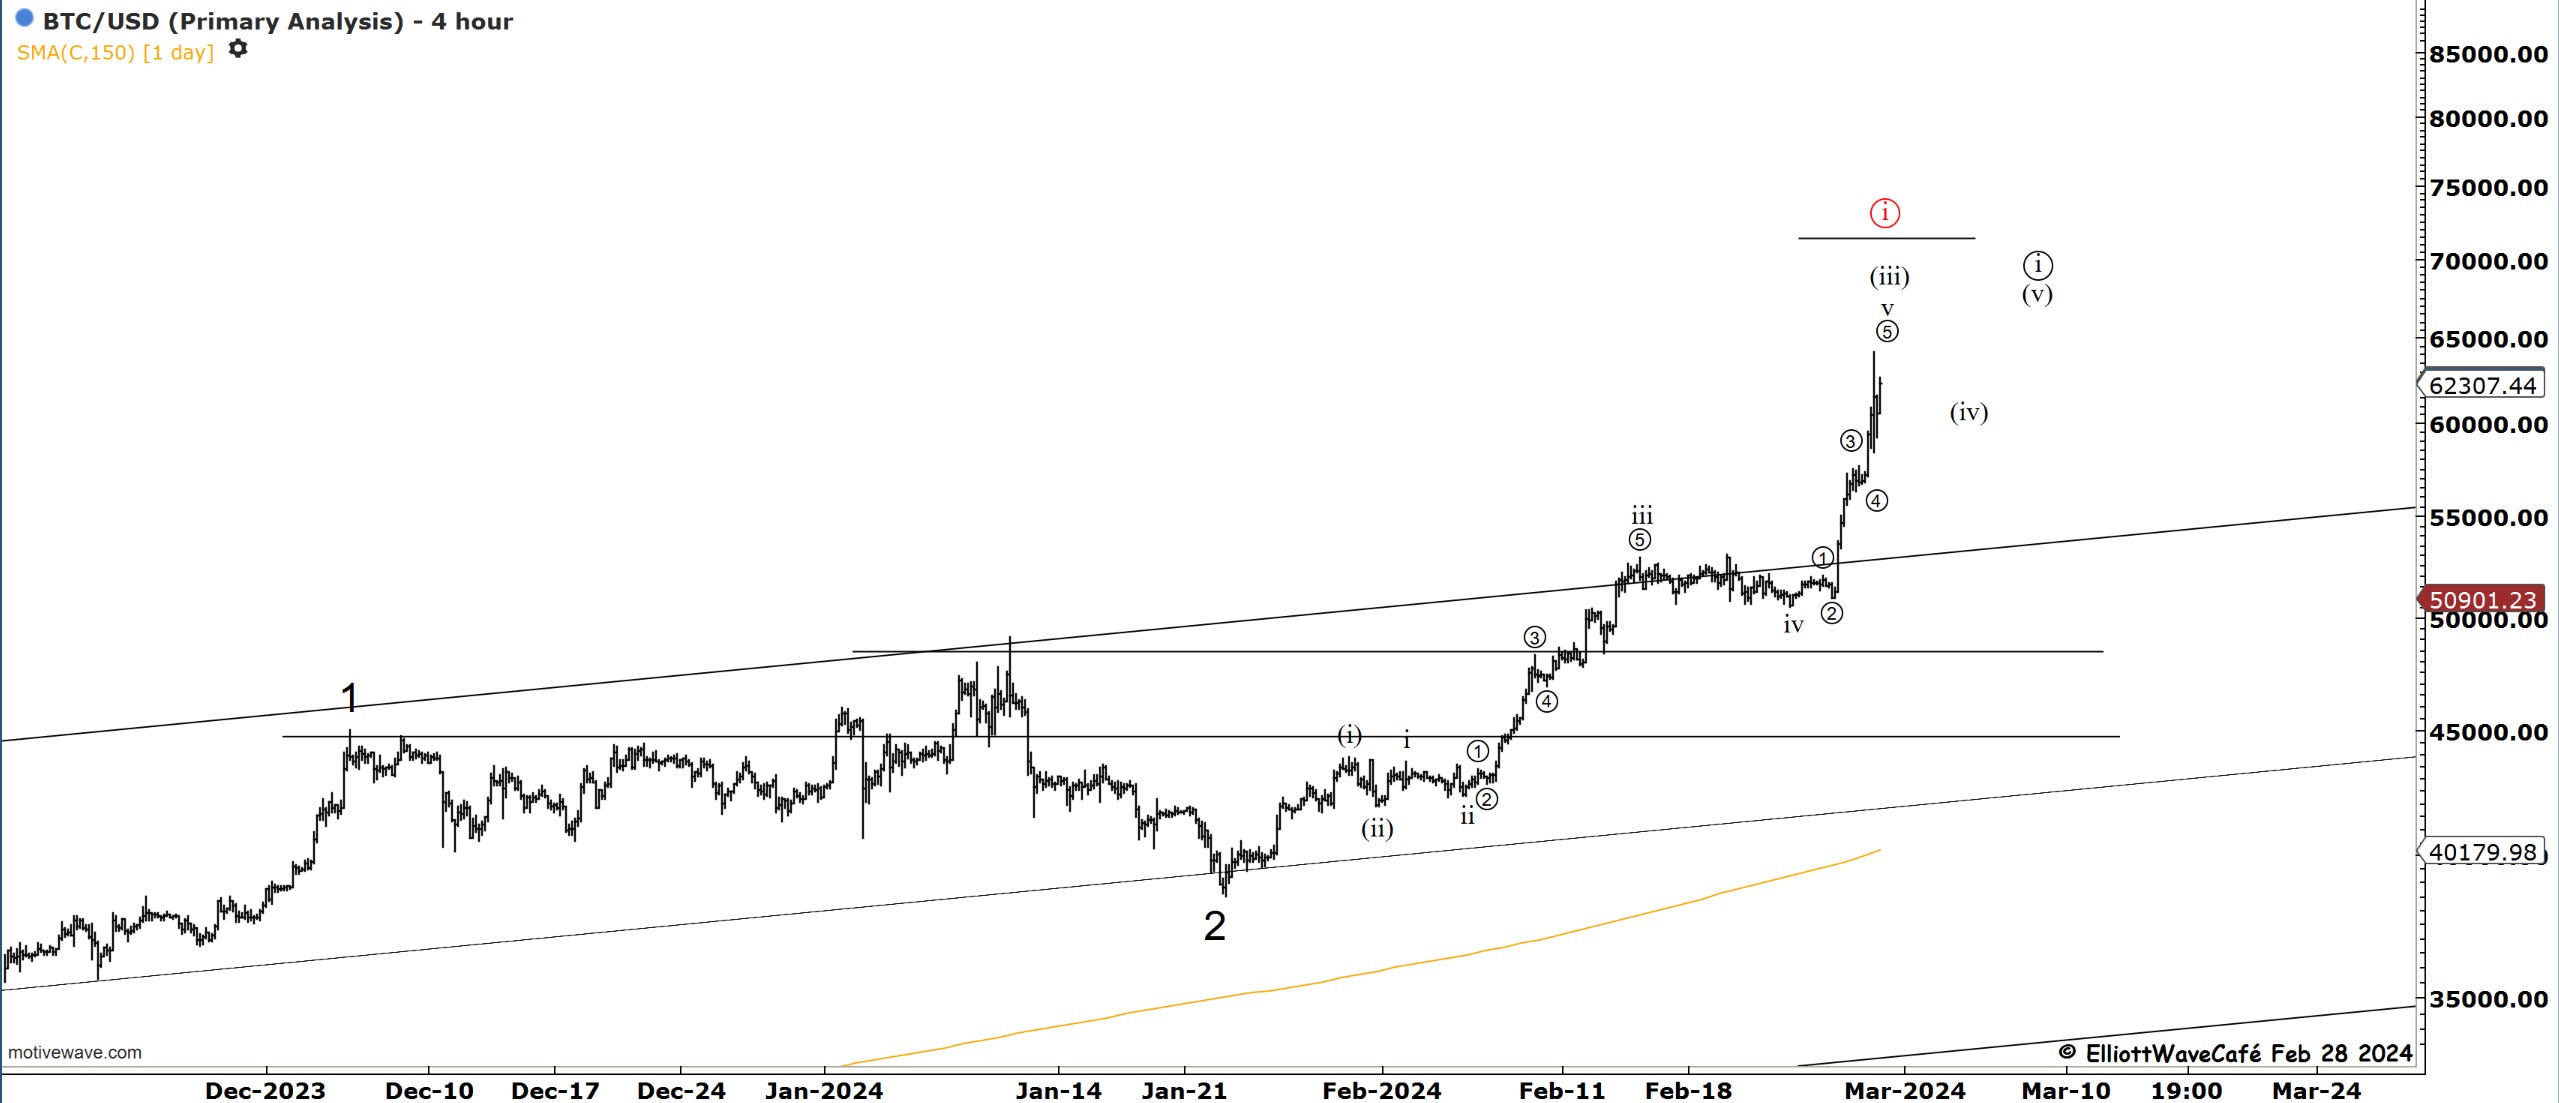
Look at that 3rd wave volume.
If you’re new to Elliott Wave or need to refresh, there is a 7-hour video course with downloadable slides under The Coarse tab on the website.
Have a great day wherever you are! - trade well, and don’t forget to subscribe and drop a like if this letter helps you in any way.
Cris
email: ewcafe@pm.me