
The Daily Drip
Core markets charts updates and commentary
Note: The counts on the right edge are real-time, and they are prone to adjustments as price action develops. Elliott Wave has a fluid approach, is evidence-based, and requires constant monitoring of certain thresholds.
In the counts below, this (( )) = circle on chart
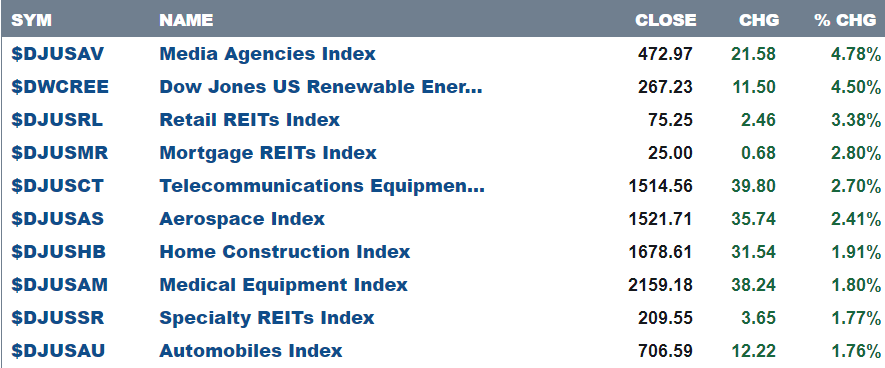
Here are today’s top 10 best performers
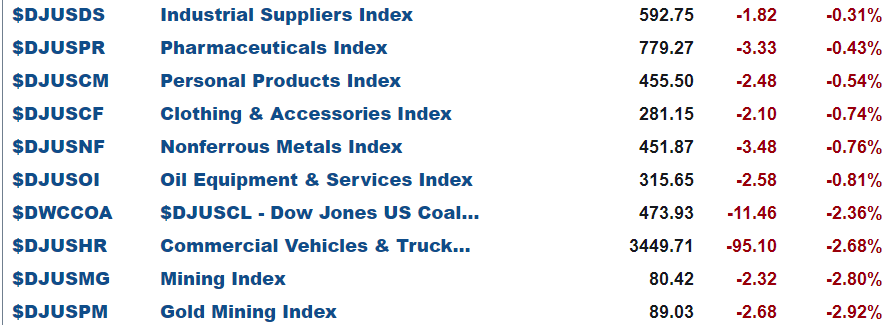
and bottom 10
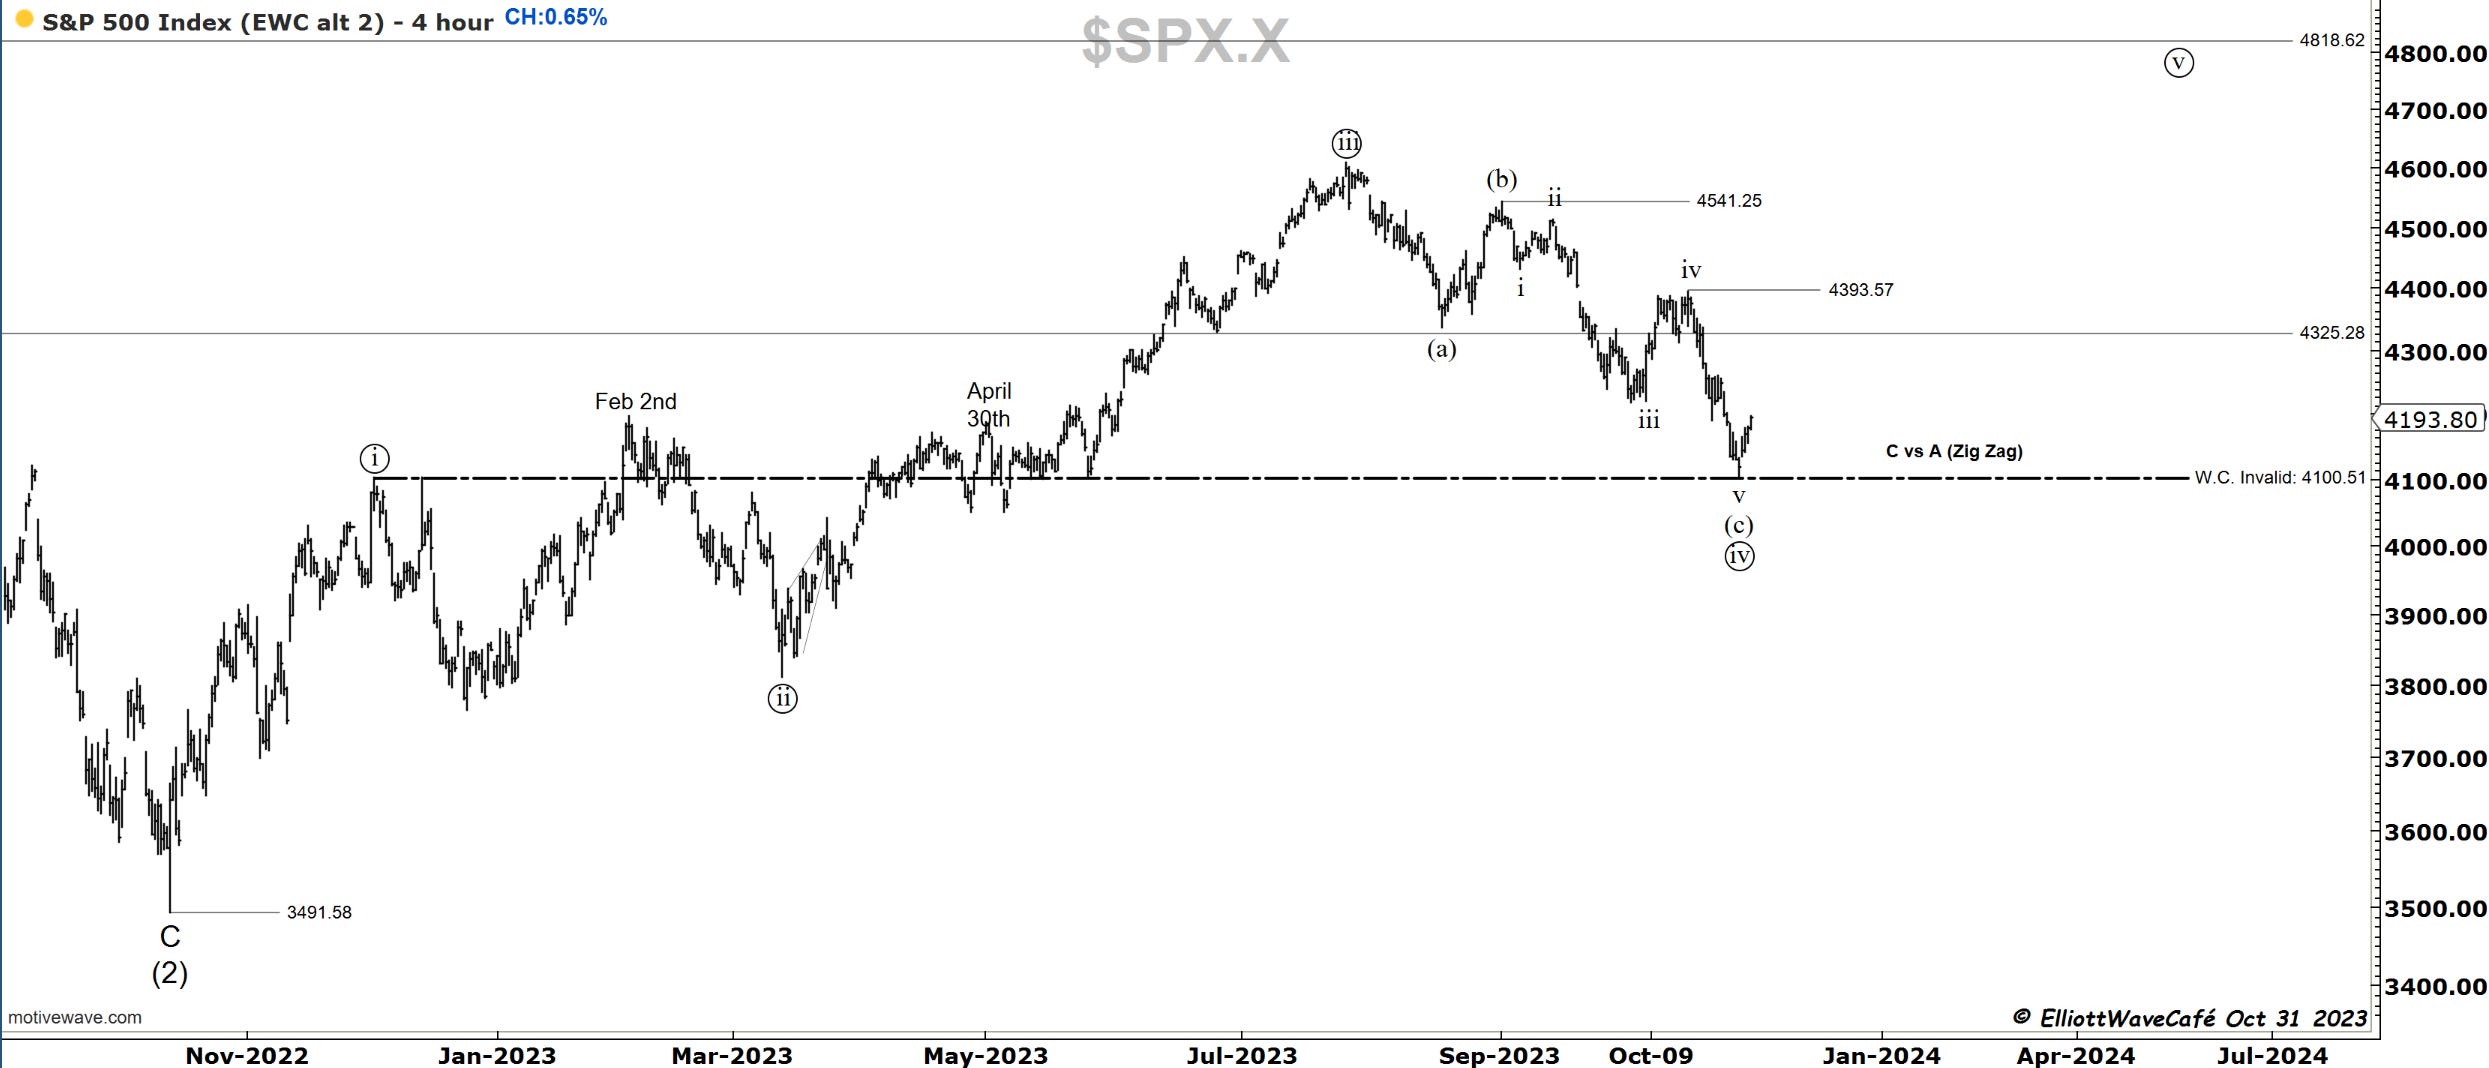
SP500
The rally of the 4100 lows continues today with a +0.65% increase. Likely a volatile day tomorrow with the Fed announcement on rates and press conference. They are expected to hold Fed Funds at the current rate of 5.25-5.50. The current count is still alive with the hold above wave ((i)) top and the bounce so far seems impulsive enough to raise the odds of a low being established.
Here is the 2-day look at the larger direction towards new ATH by the time we complete wave the proposed wave 1.
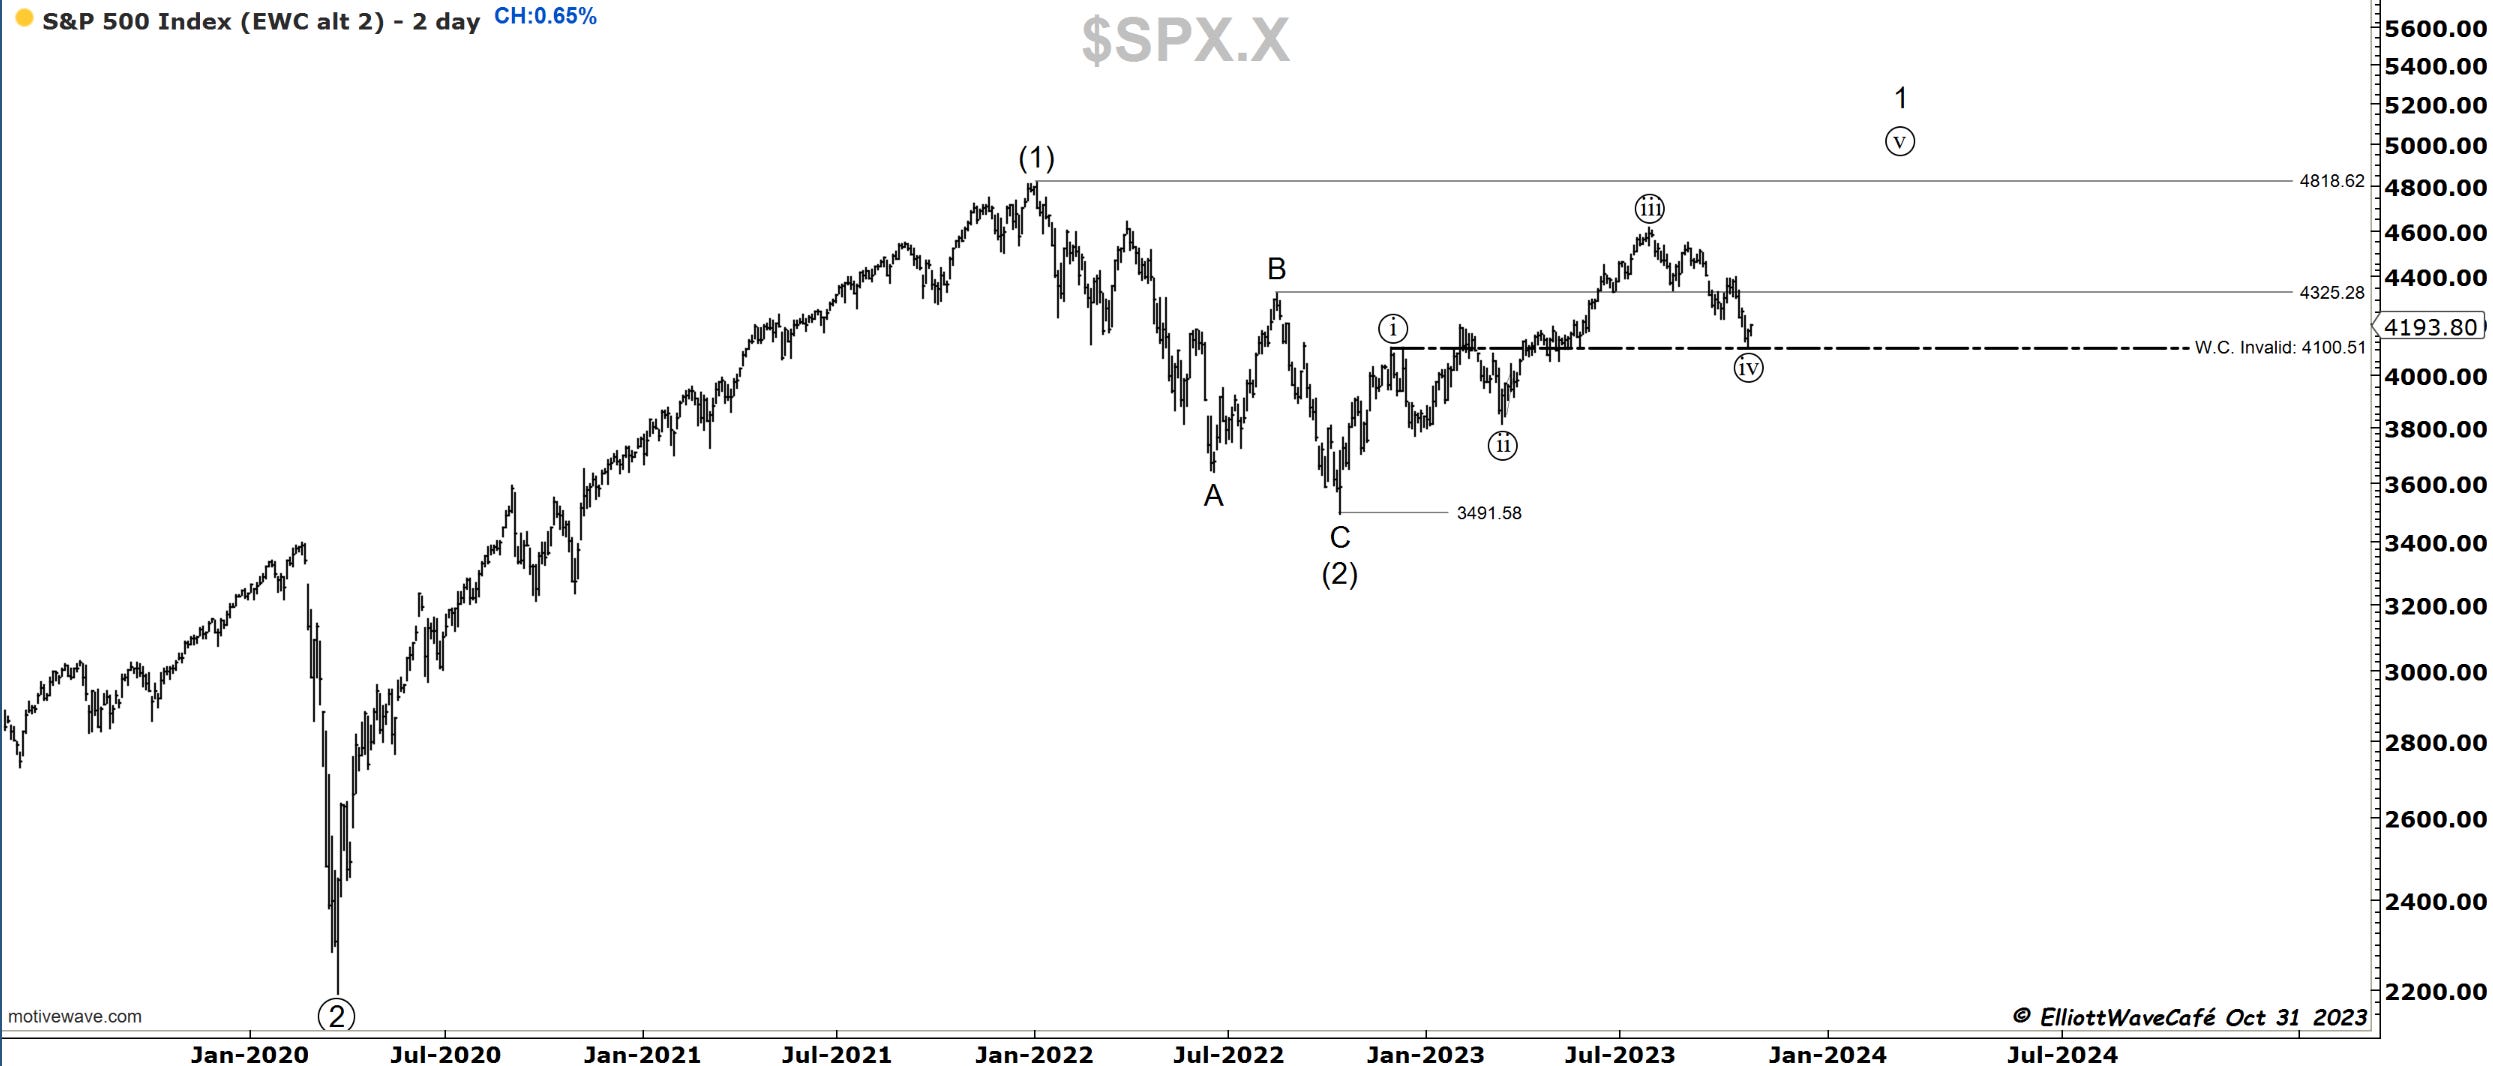
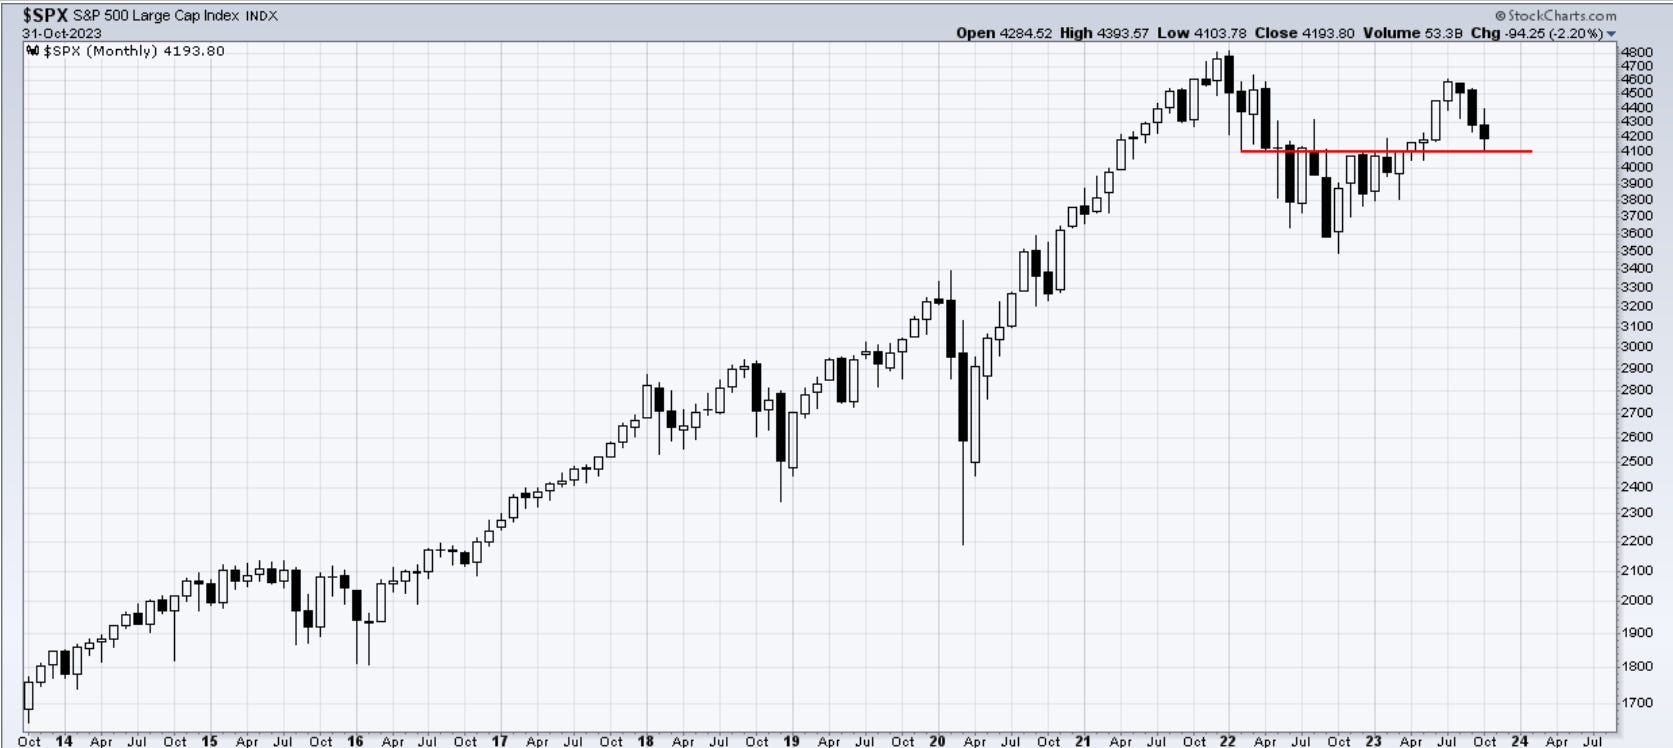
The monthly close has not given in to the bearish narrative as it has not closed below 4100. This is a positive sign going into November and into the strongest period for stocks historically.
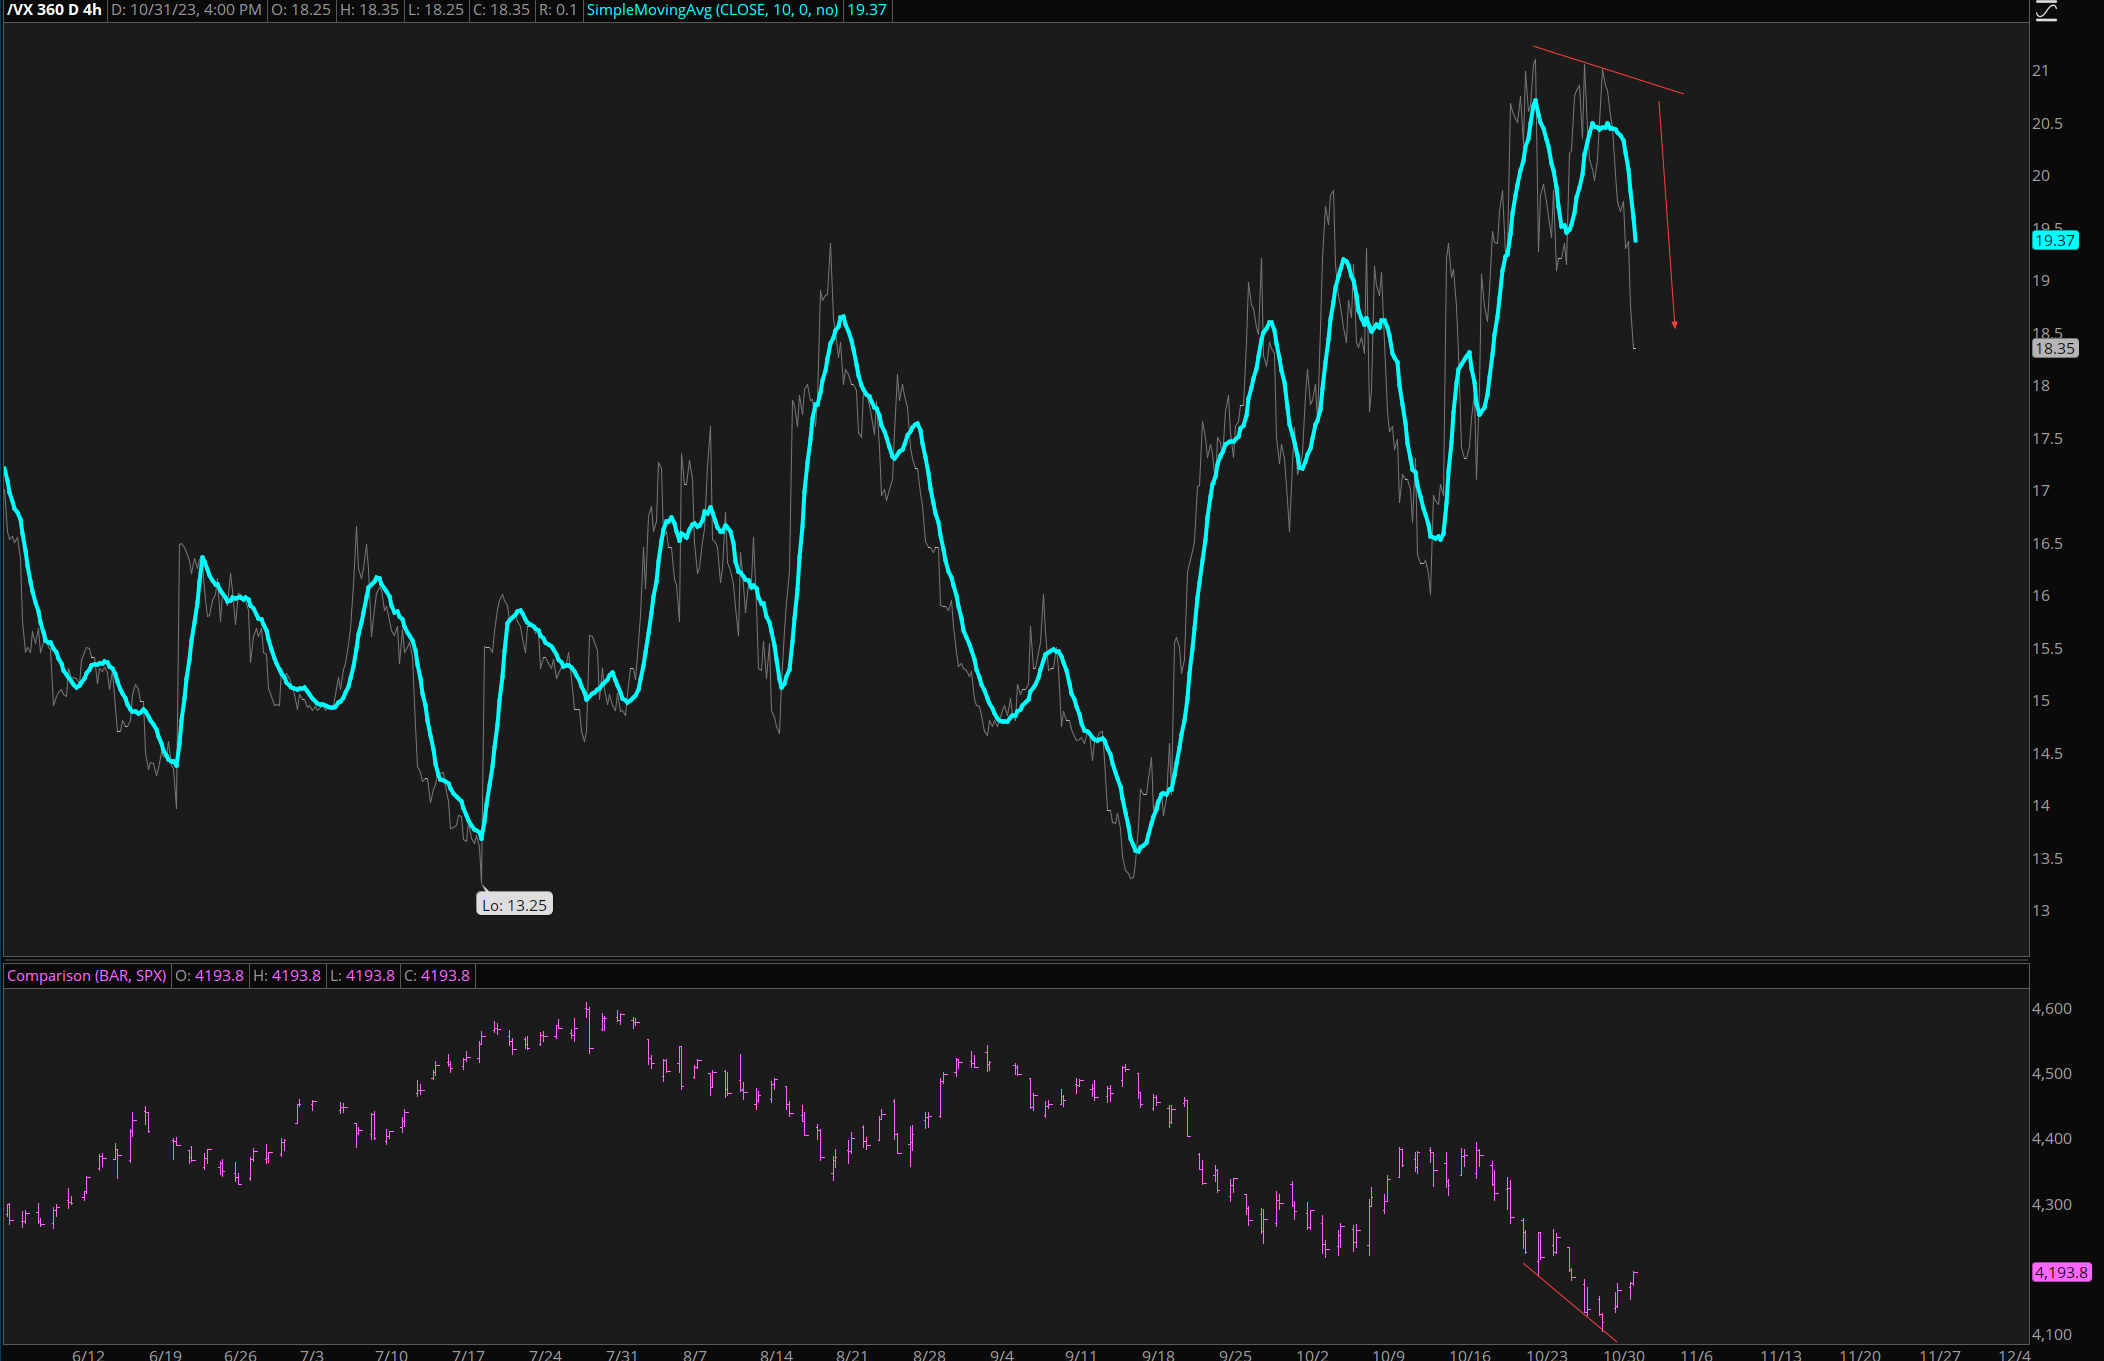
Interestingly enough we have a drop in VIX ahead of the fed meeting, when actually one would expect increased fear going into it. It might be the market’s way of saying they do not expect much to come out of it. I view it as a positive for risk. I have mentioned the divergence in at the money options vs sp500 in previous posts.
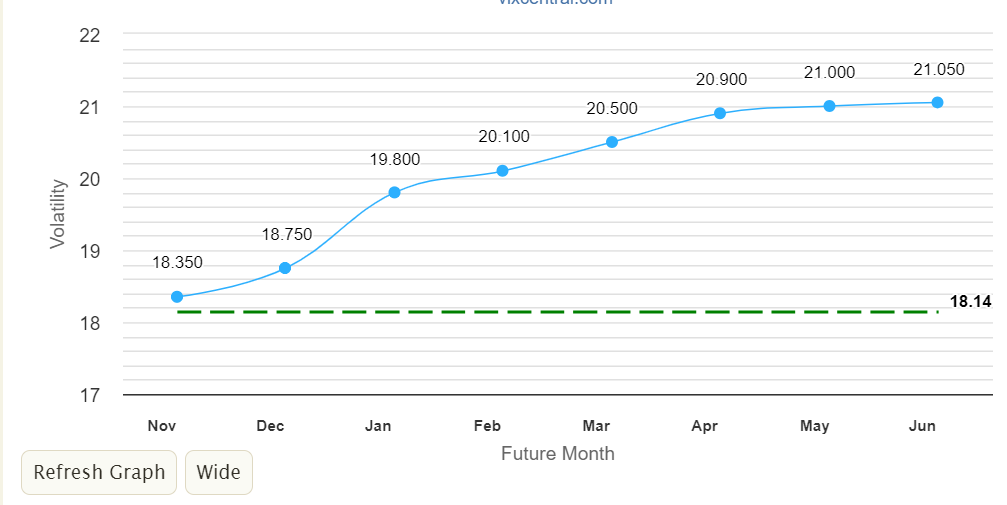
VIX curve is also back in contango, as fears of a market collapse have been reduced.
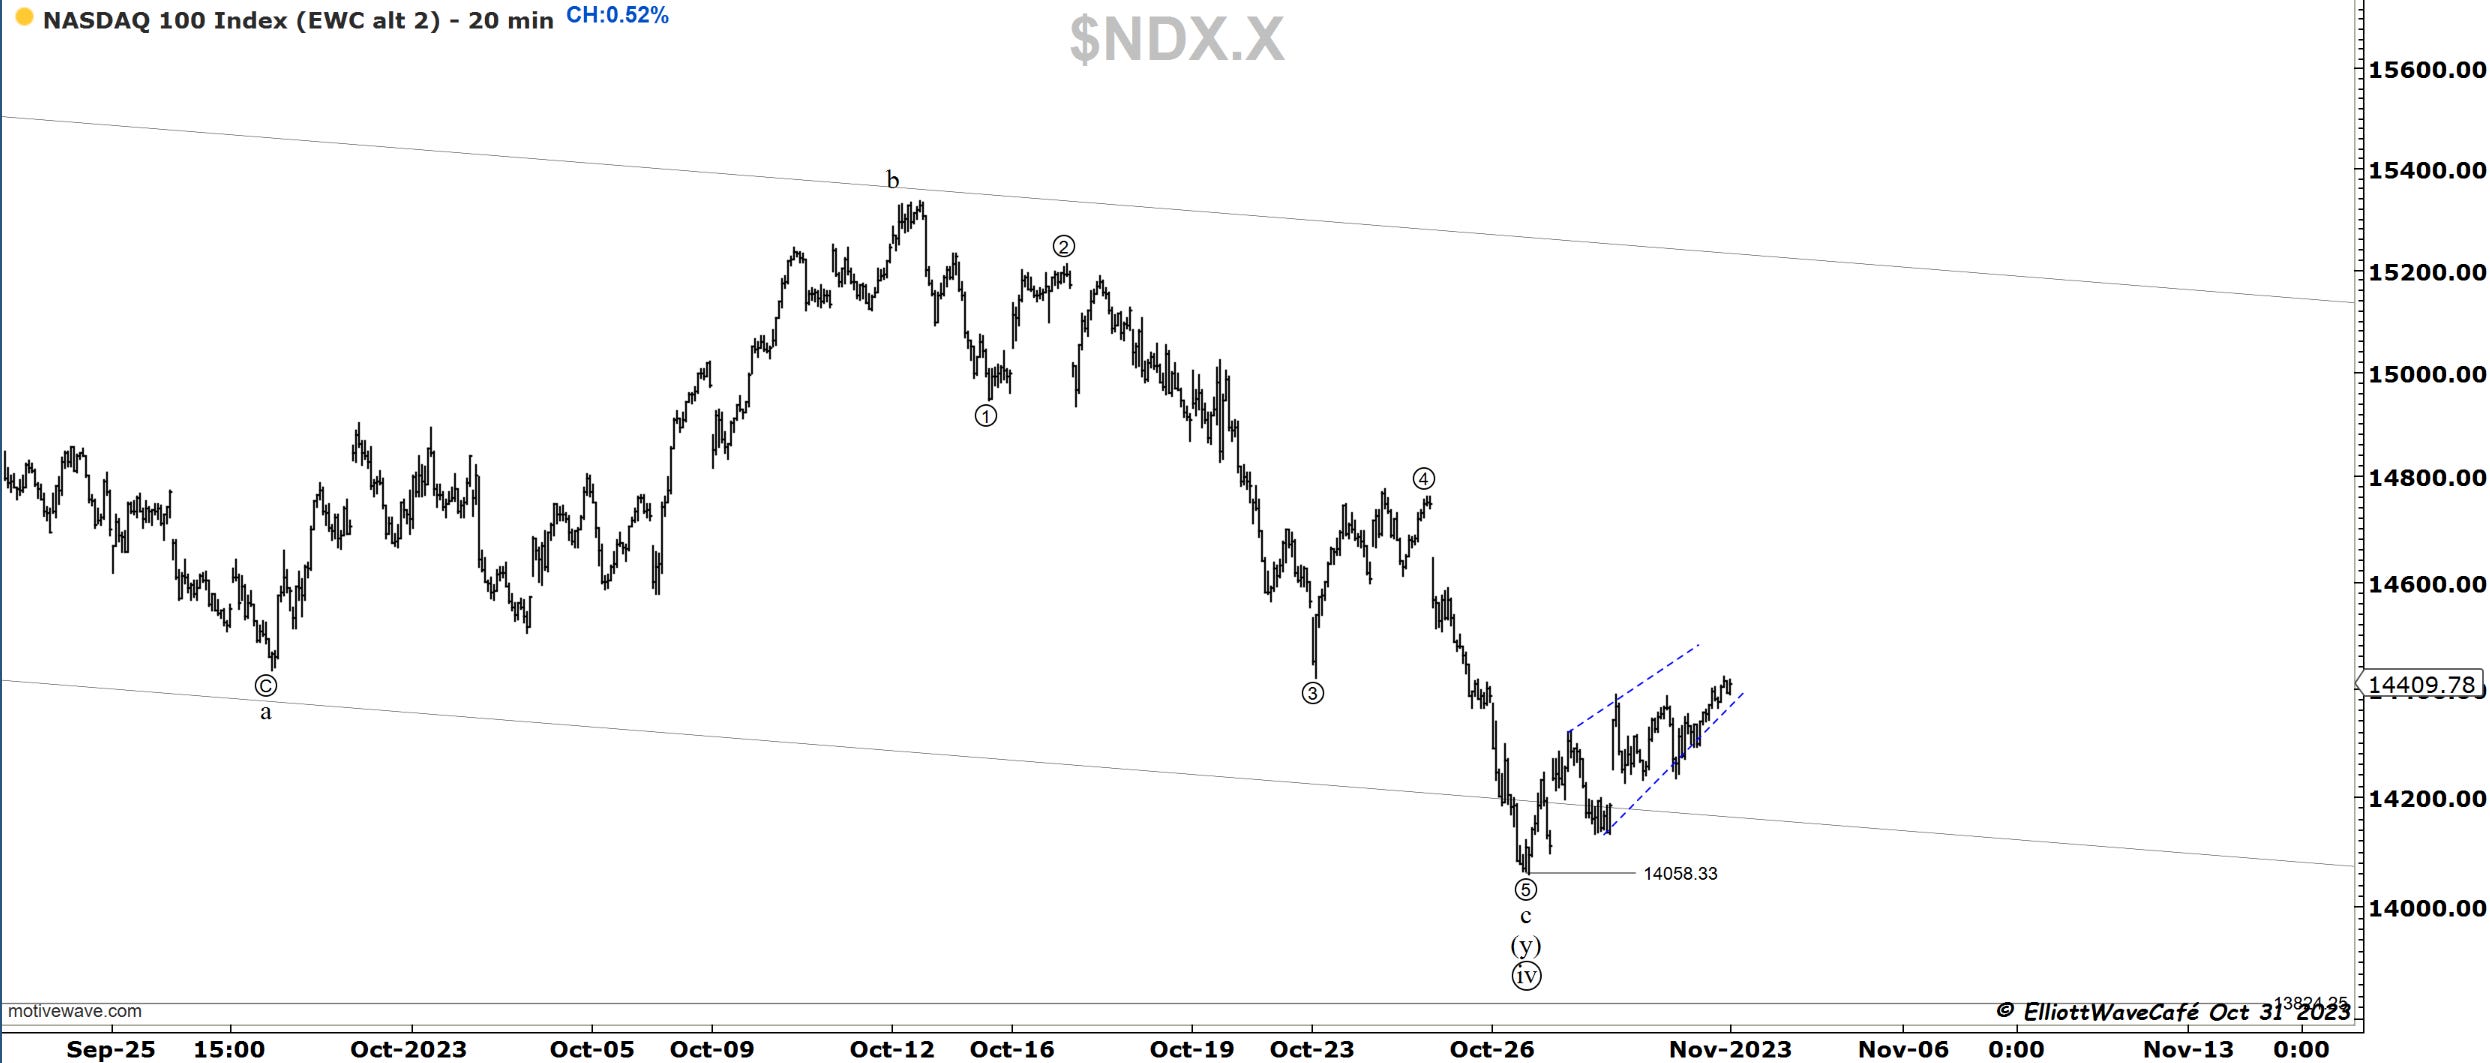
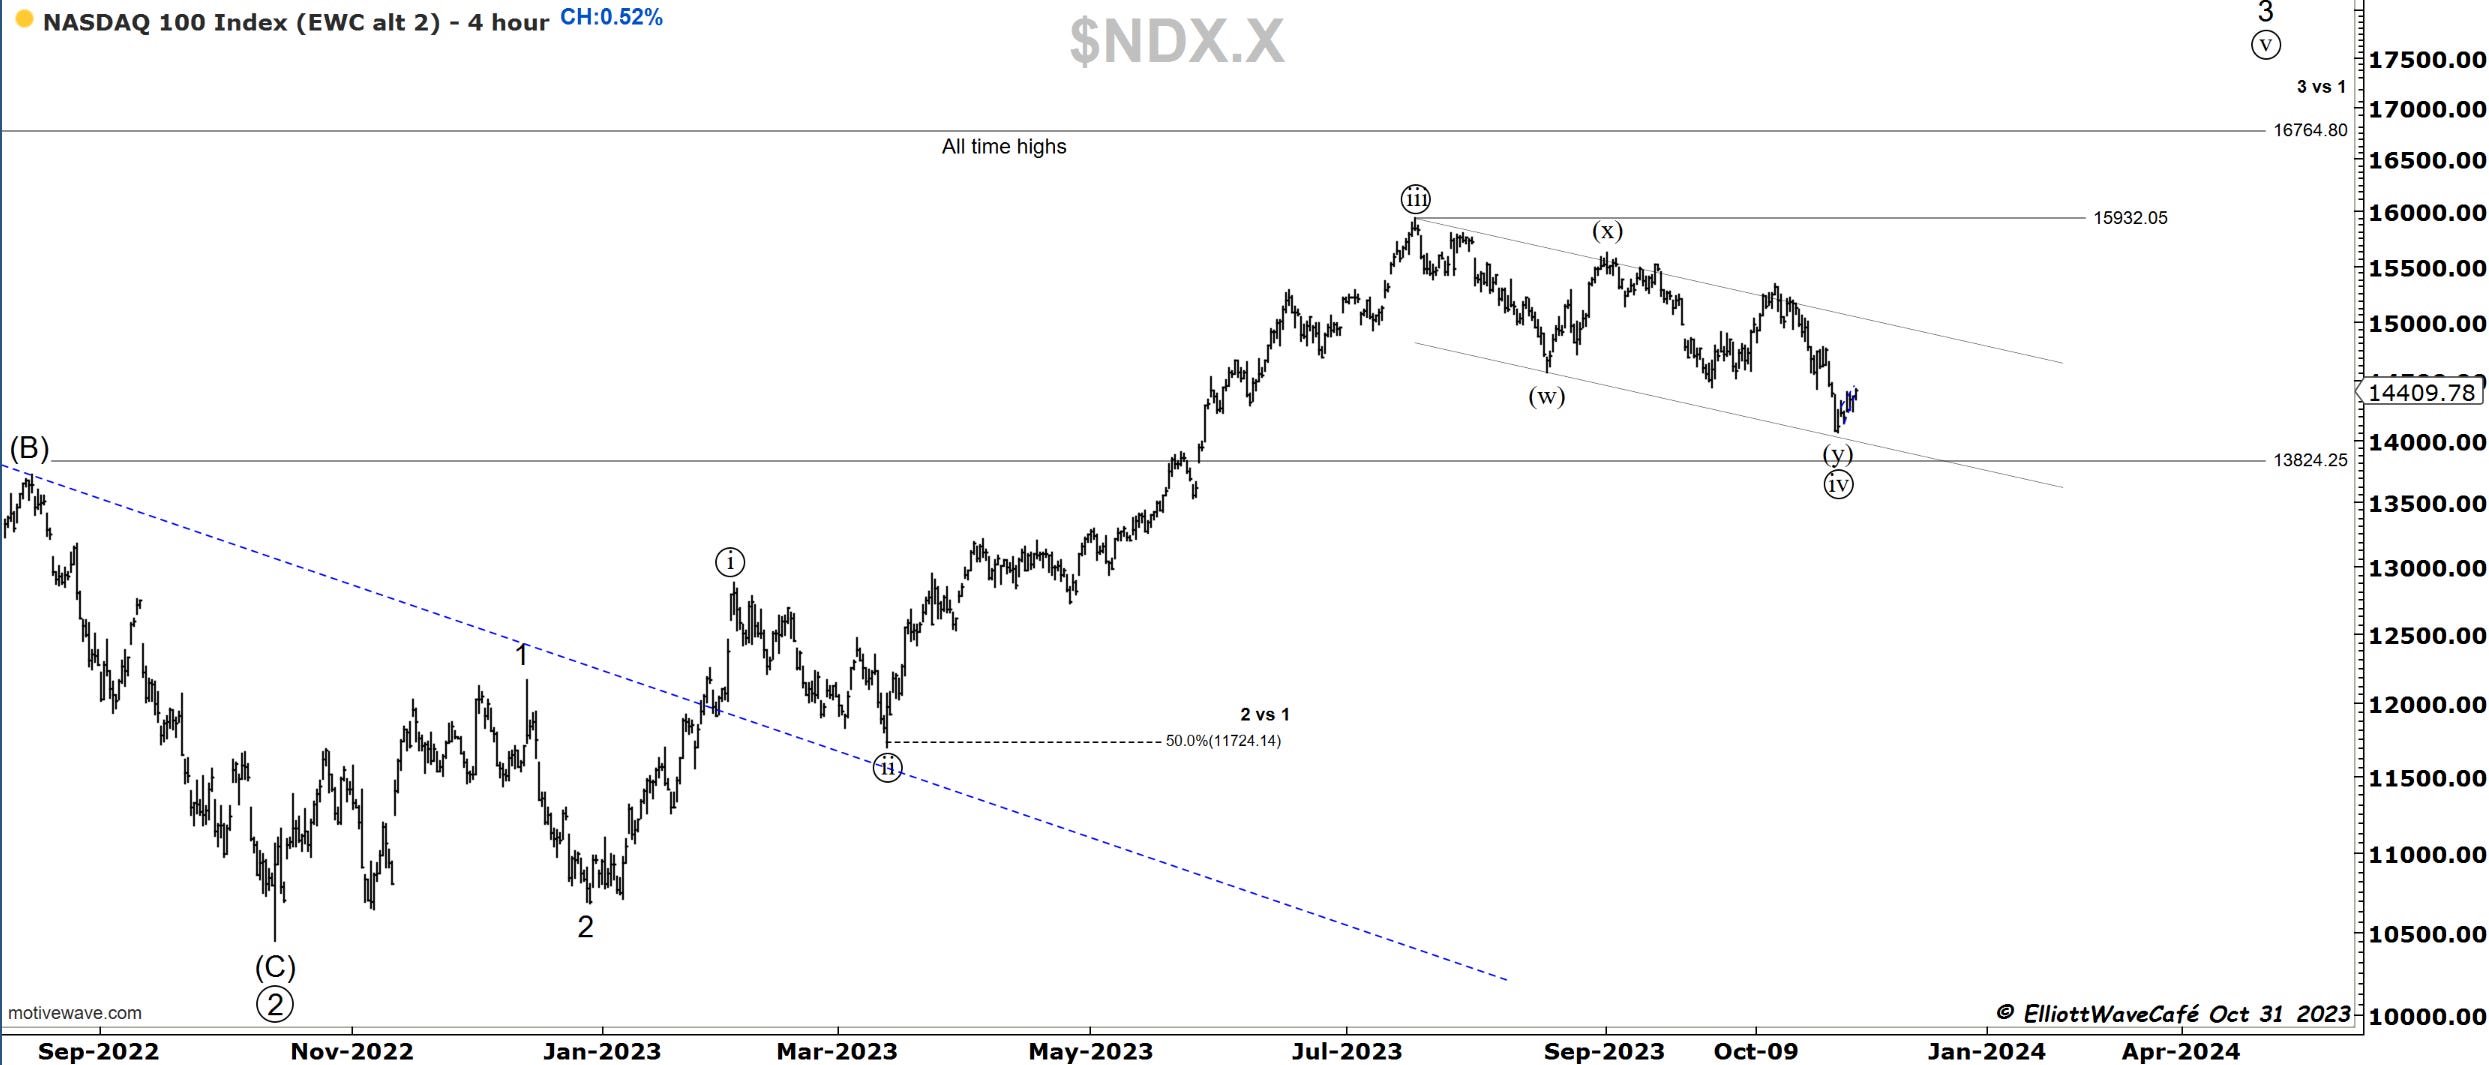
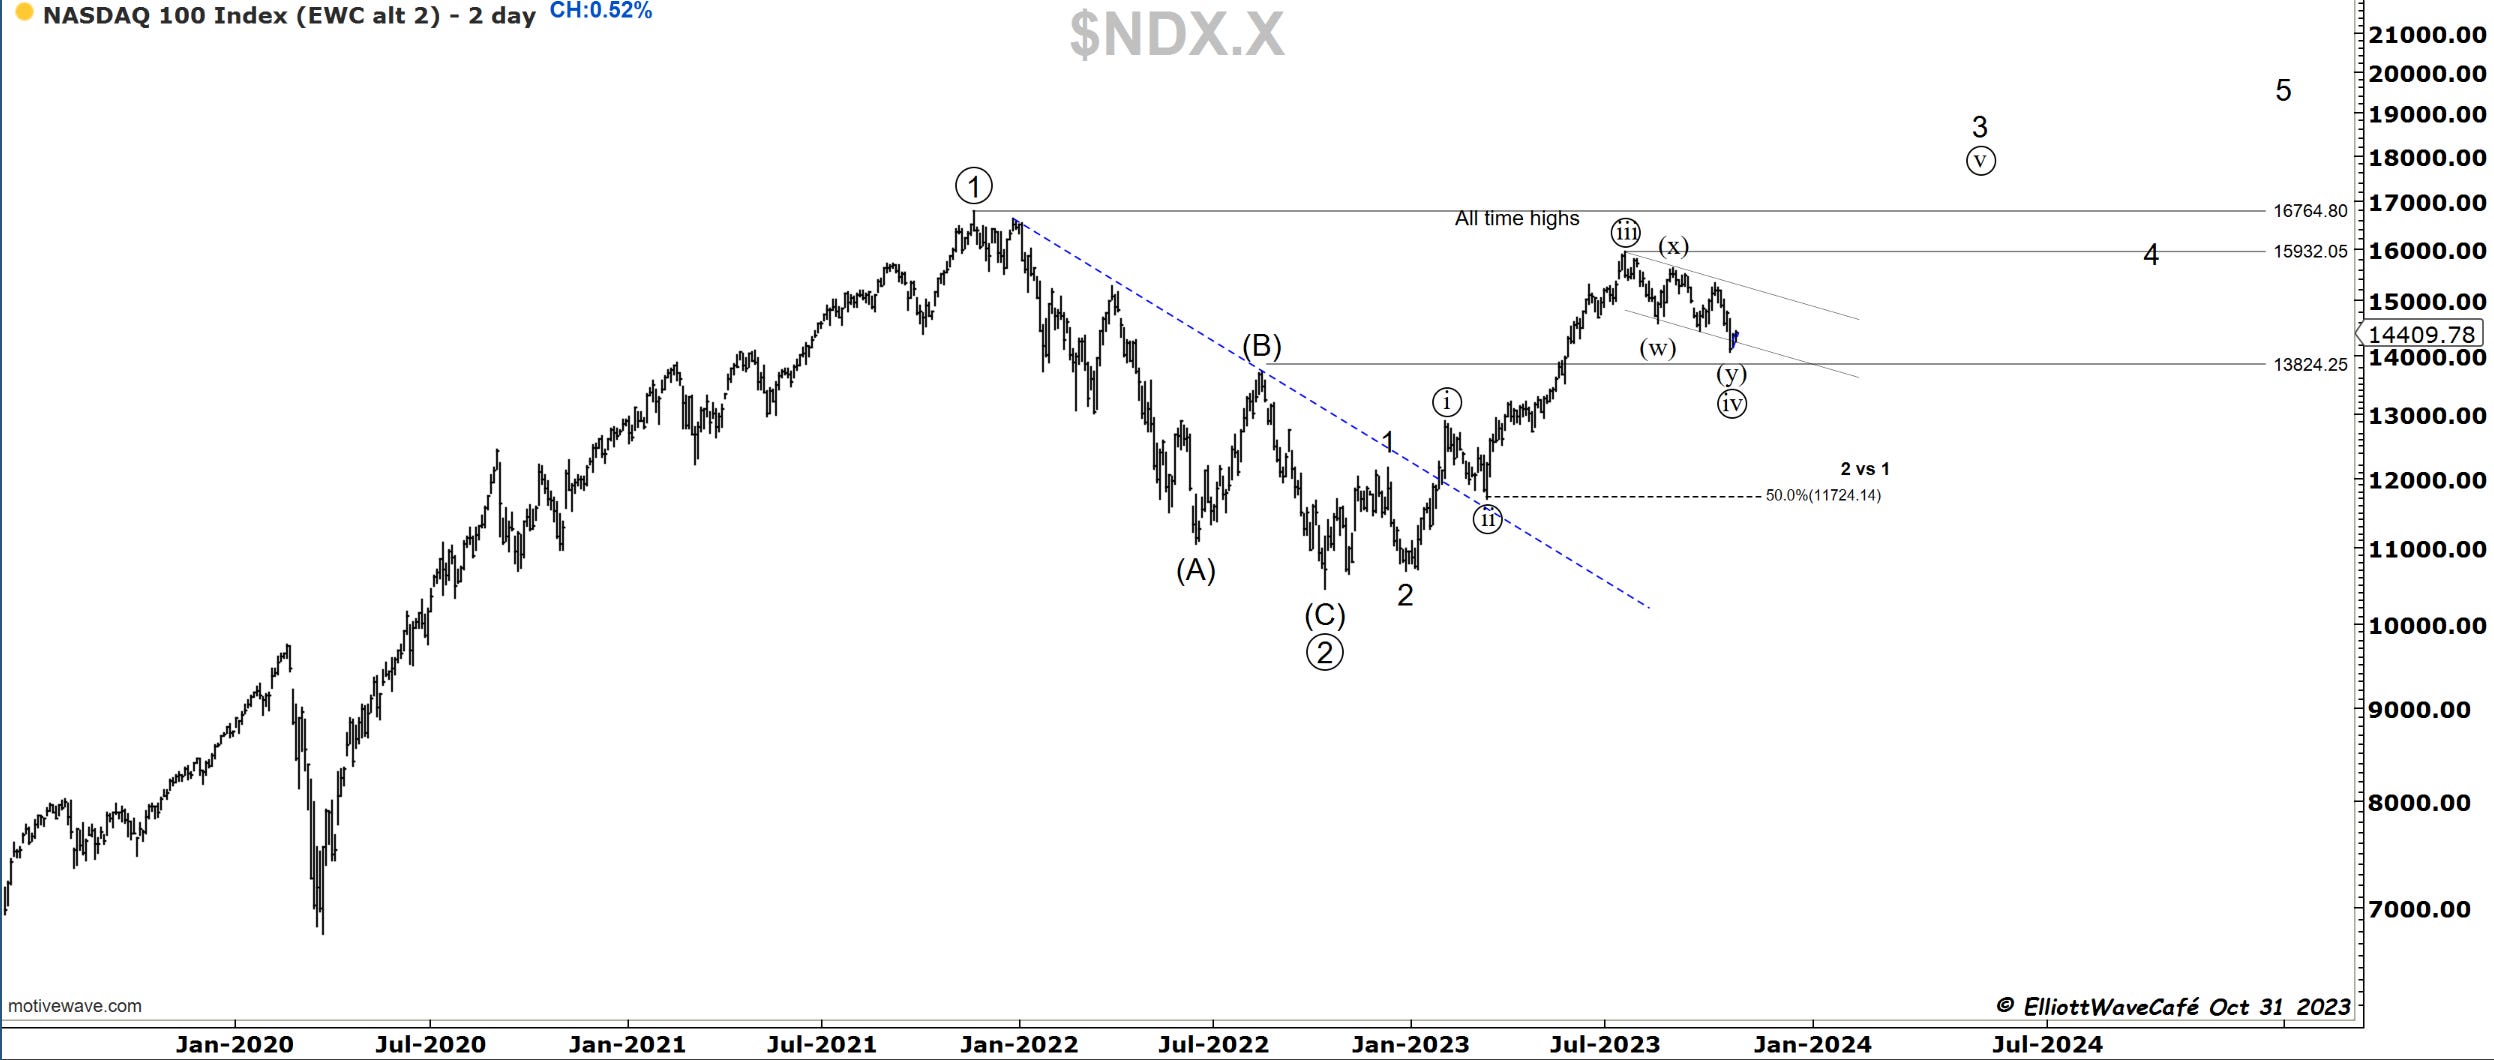
Nasdaq100
Nasdaq squeezed another 1/2 percent in choppy fashion. It’s trying to build something constructive but still a bit messy. 14,058 is the line in the sand as defense, but would not want to see it break 4130.
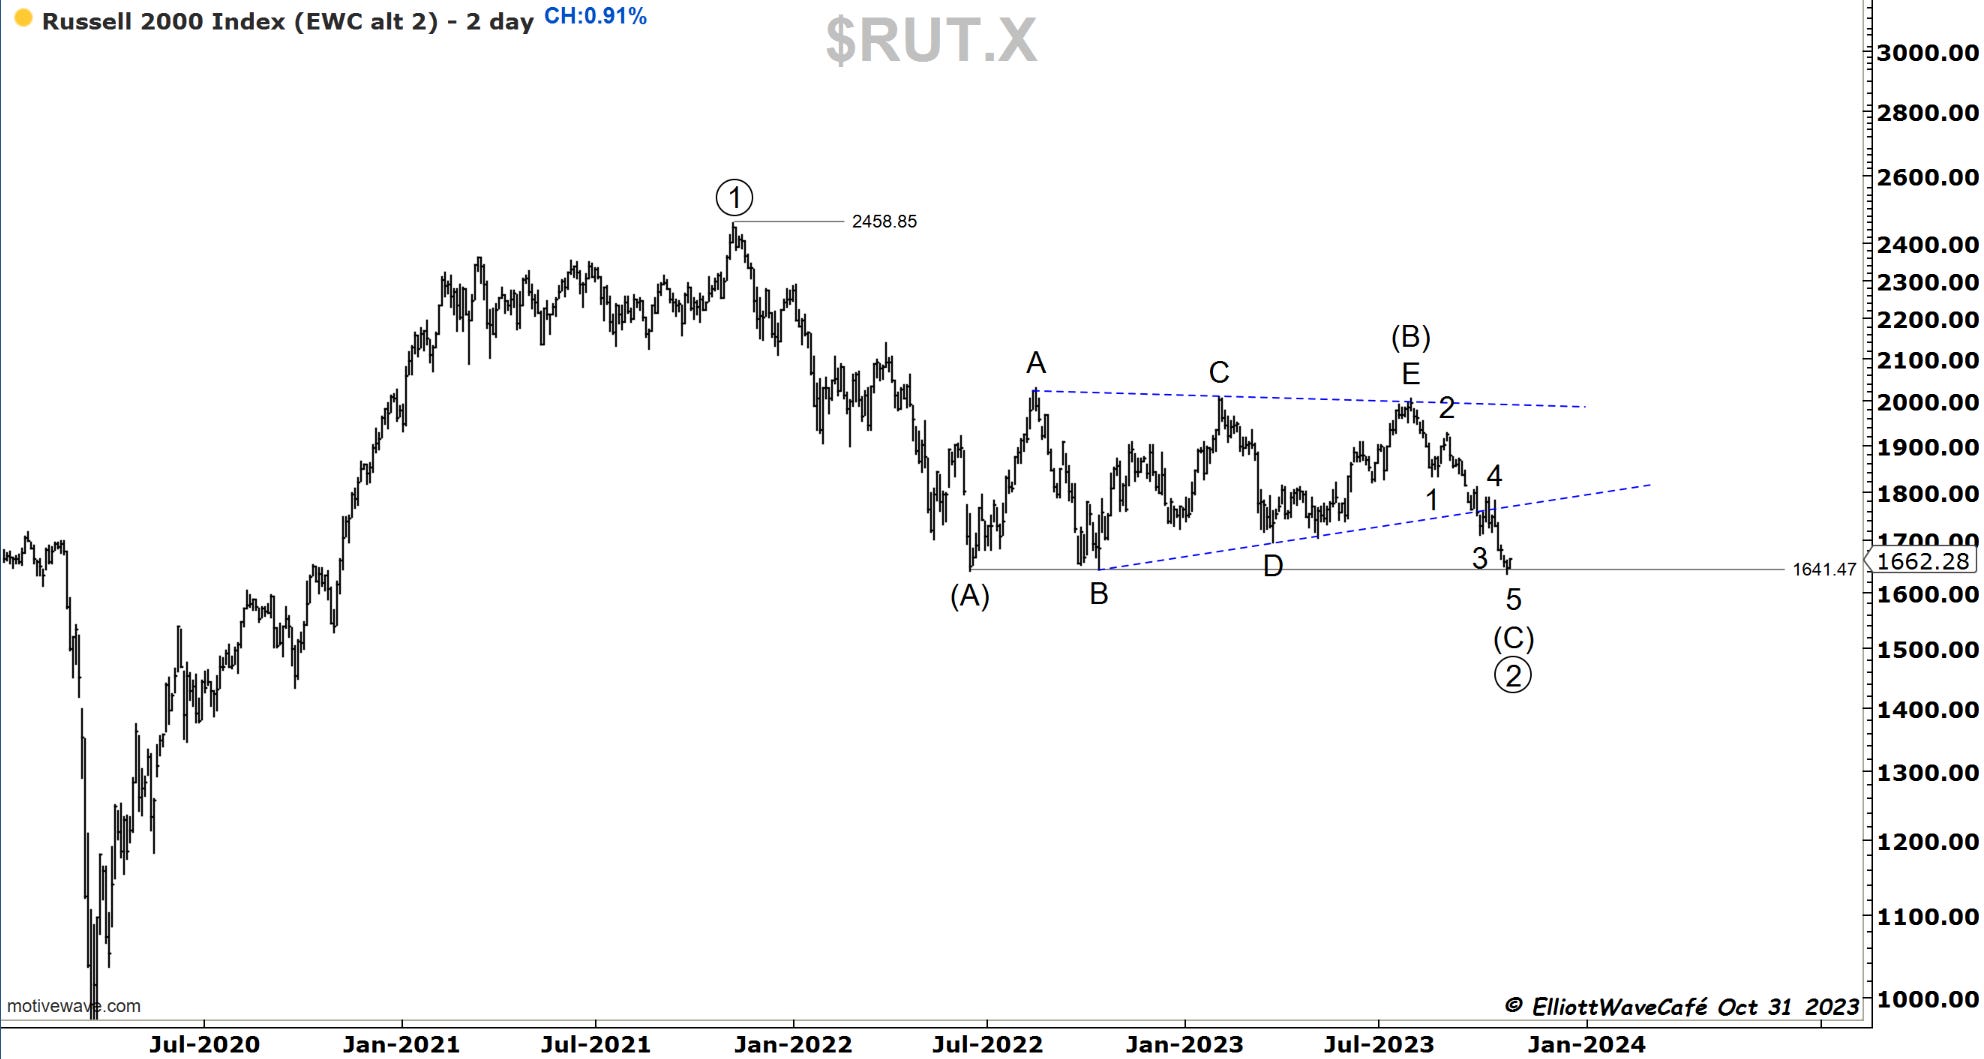
RUSSELL 2000
I know small caps were a disaster in terms of performance ever since the top exactly 2 years ago at the end of this week. We took last summer’s lows by a brief amount and bounced slightly. These are not the best stocks in the world, that’s why they are small caps. There is a lot of garbage in there for lack for lack of a better term. But if they are to stage a recovery I think they can do it from here after they dropped in 5 waves and got everyone bearish on them with the breakdown.
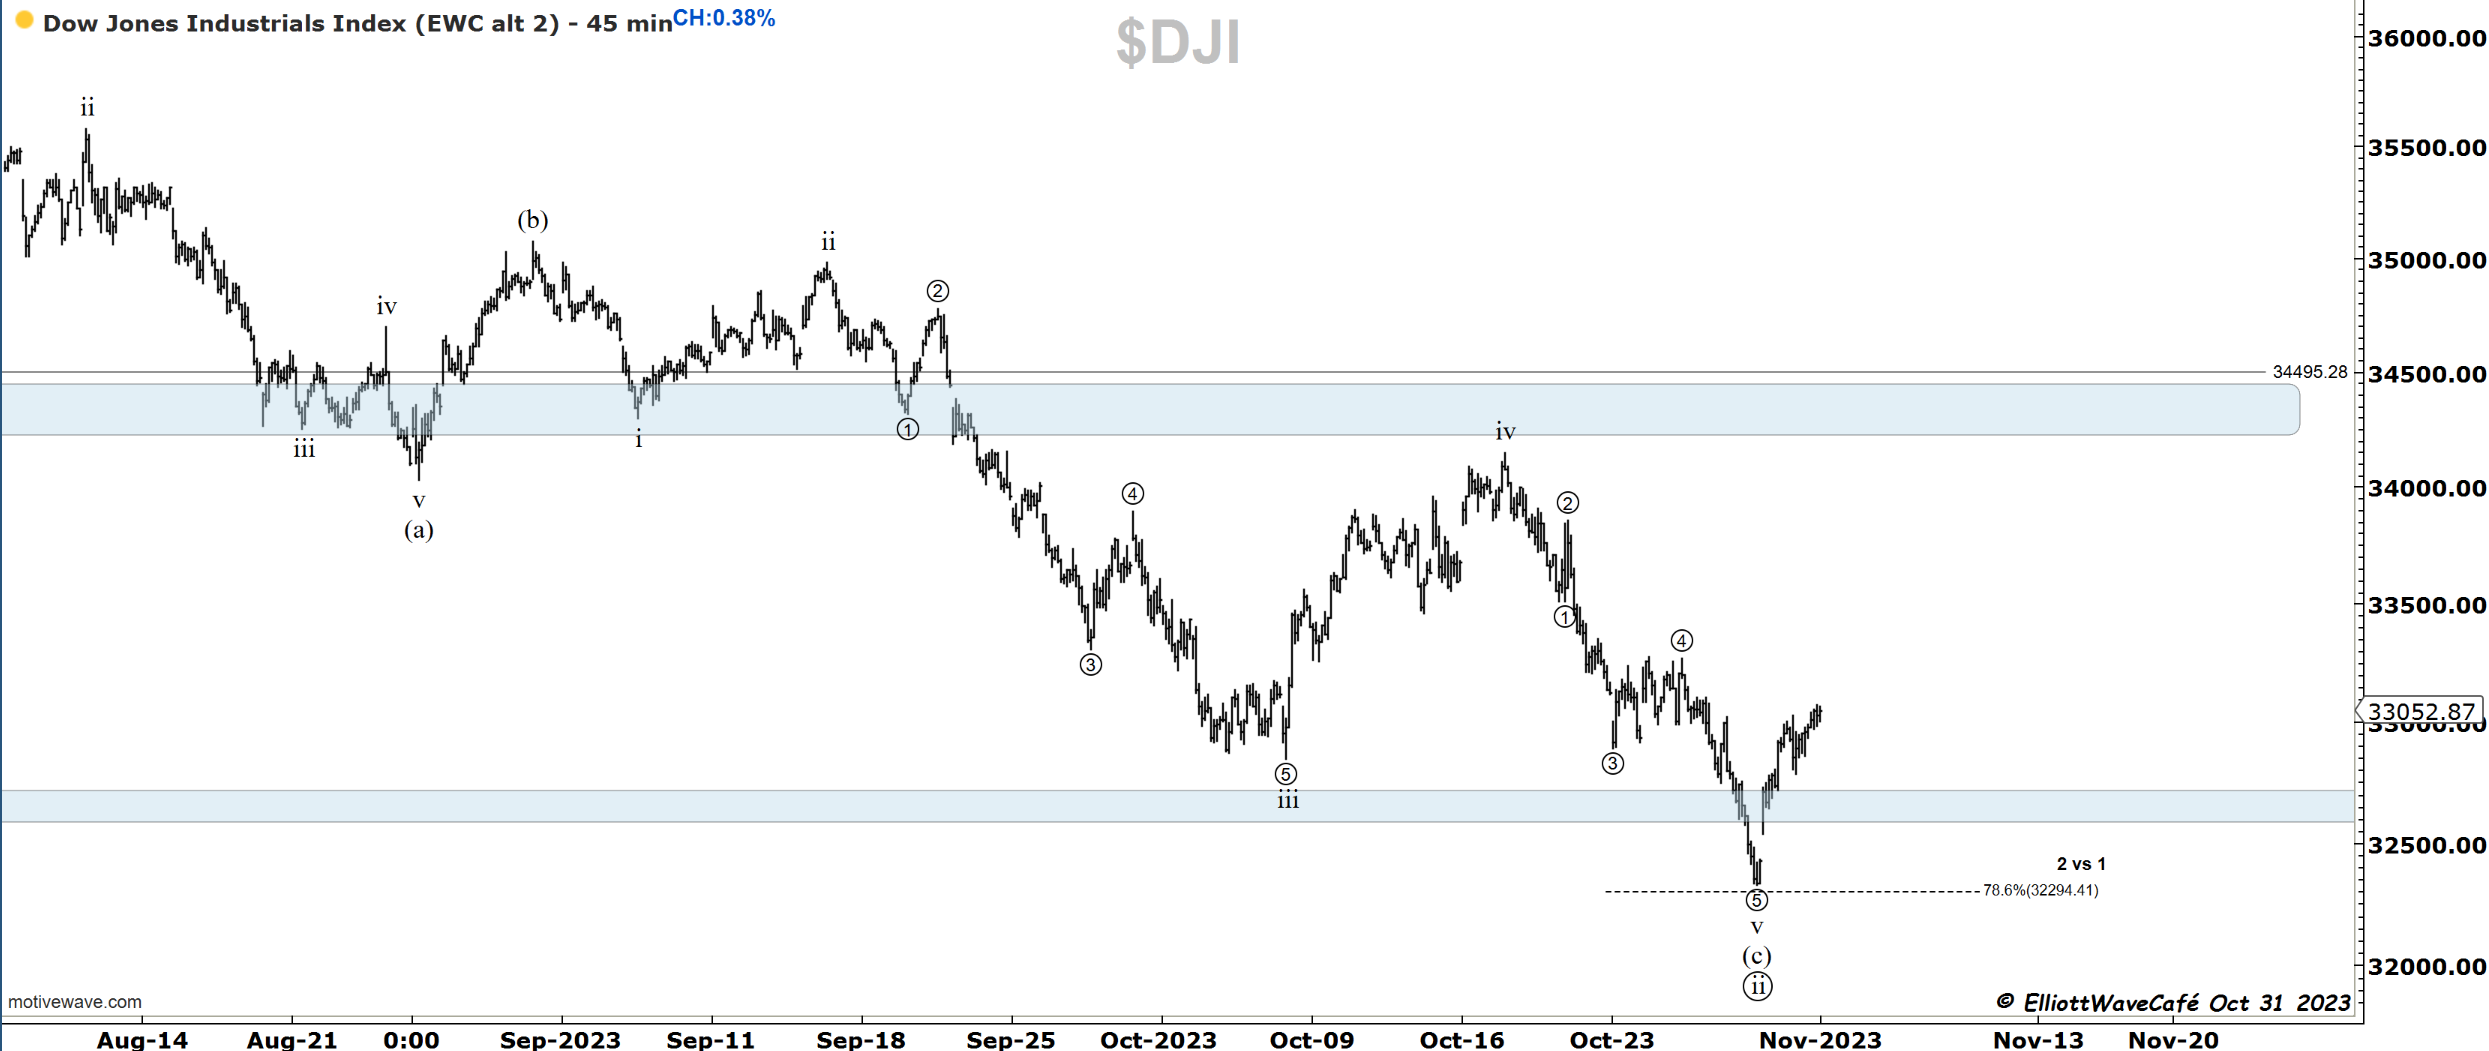
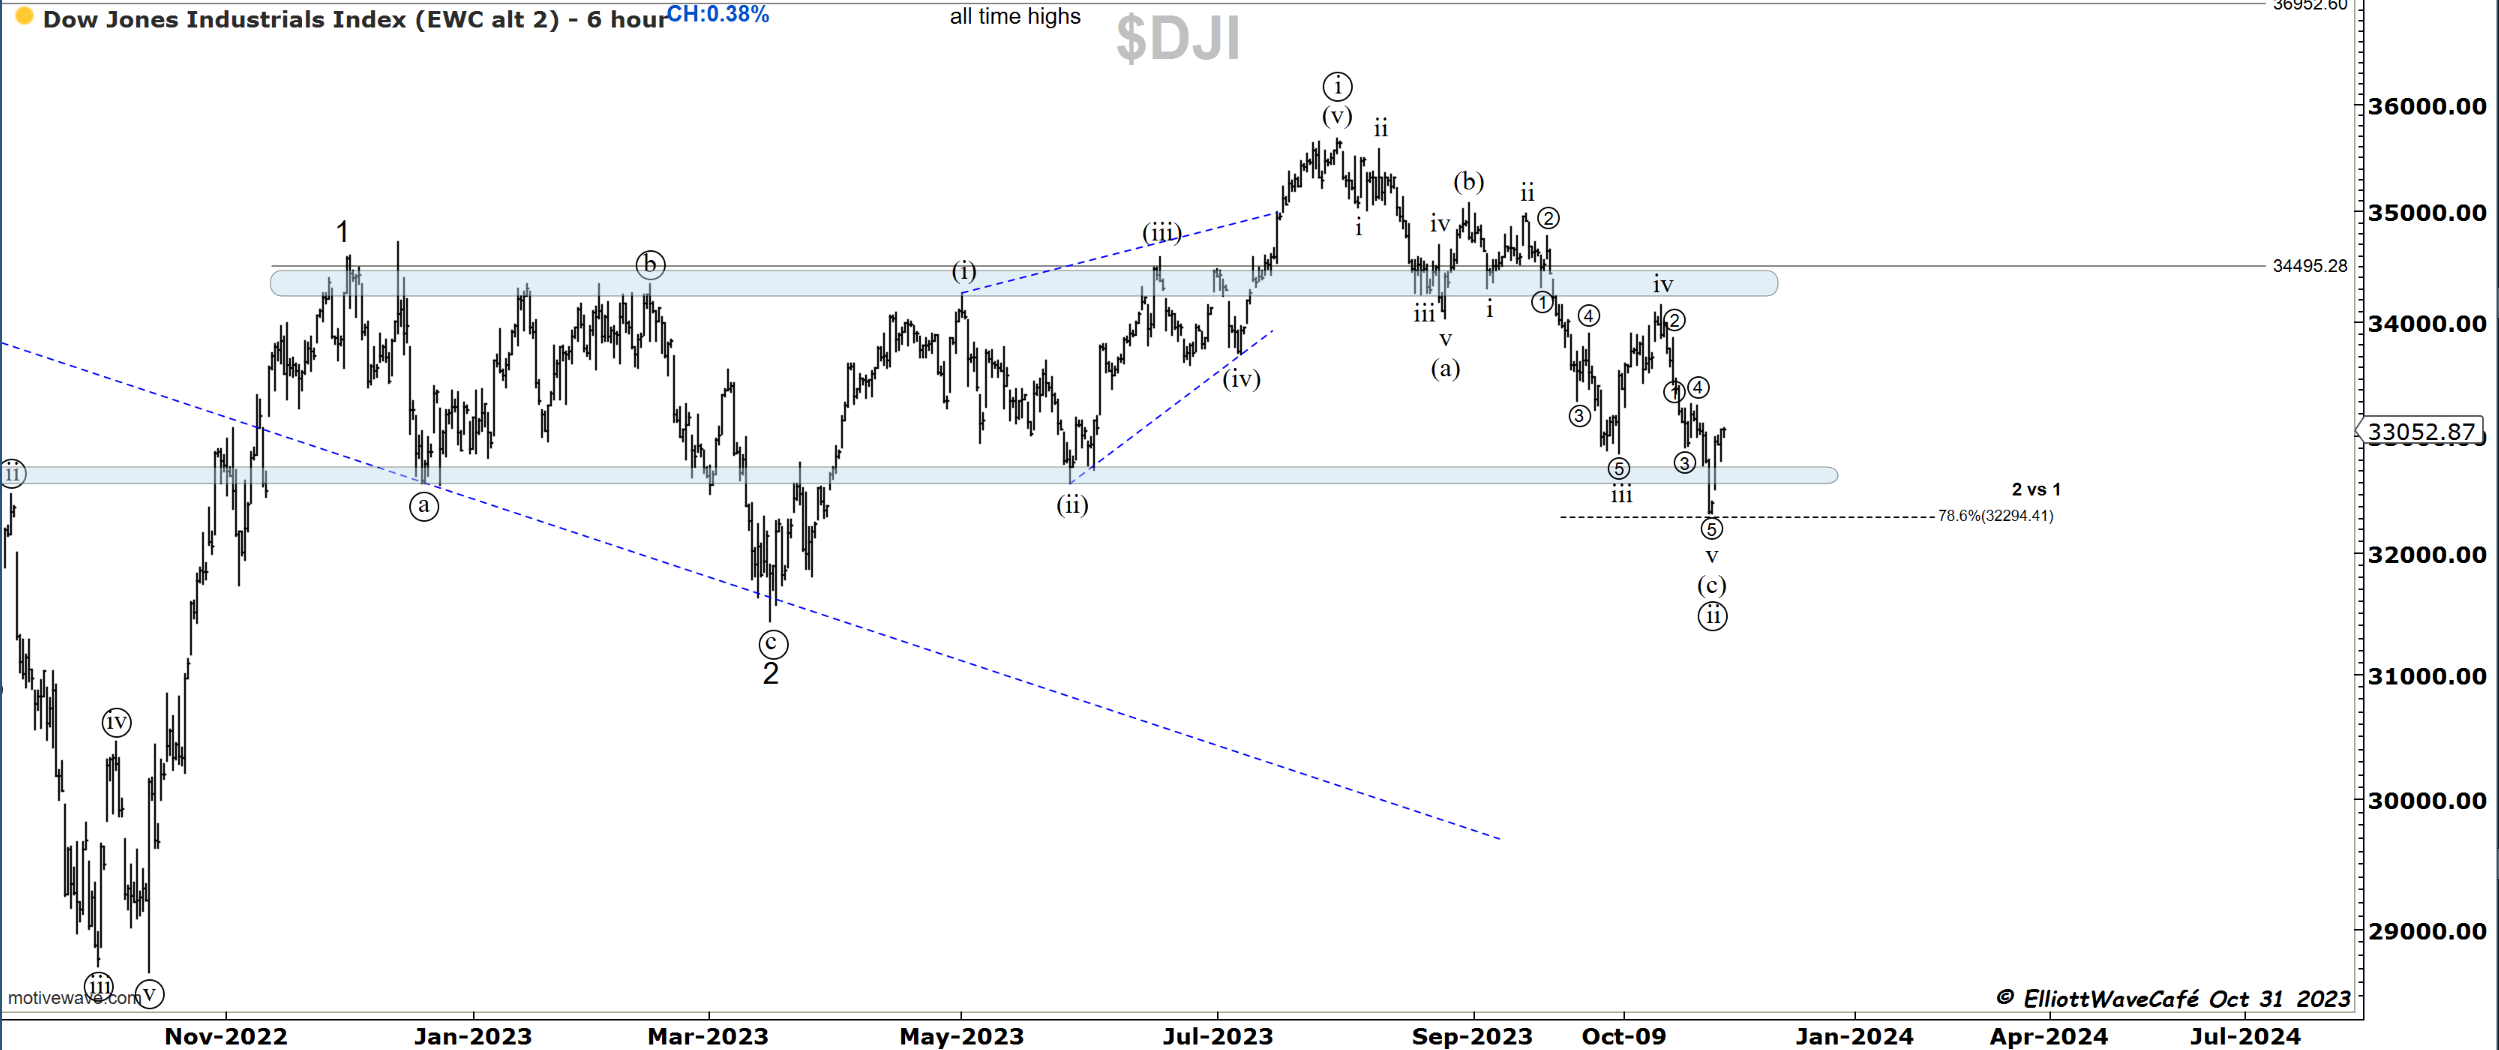
Dow30
Here is a look at a 45-minute dow for those wanting to see intraday counting. Nice impulse of the lows suggests dips are likely to get bought.
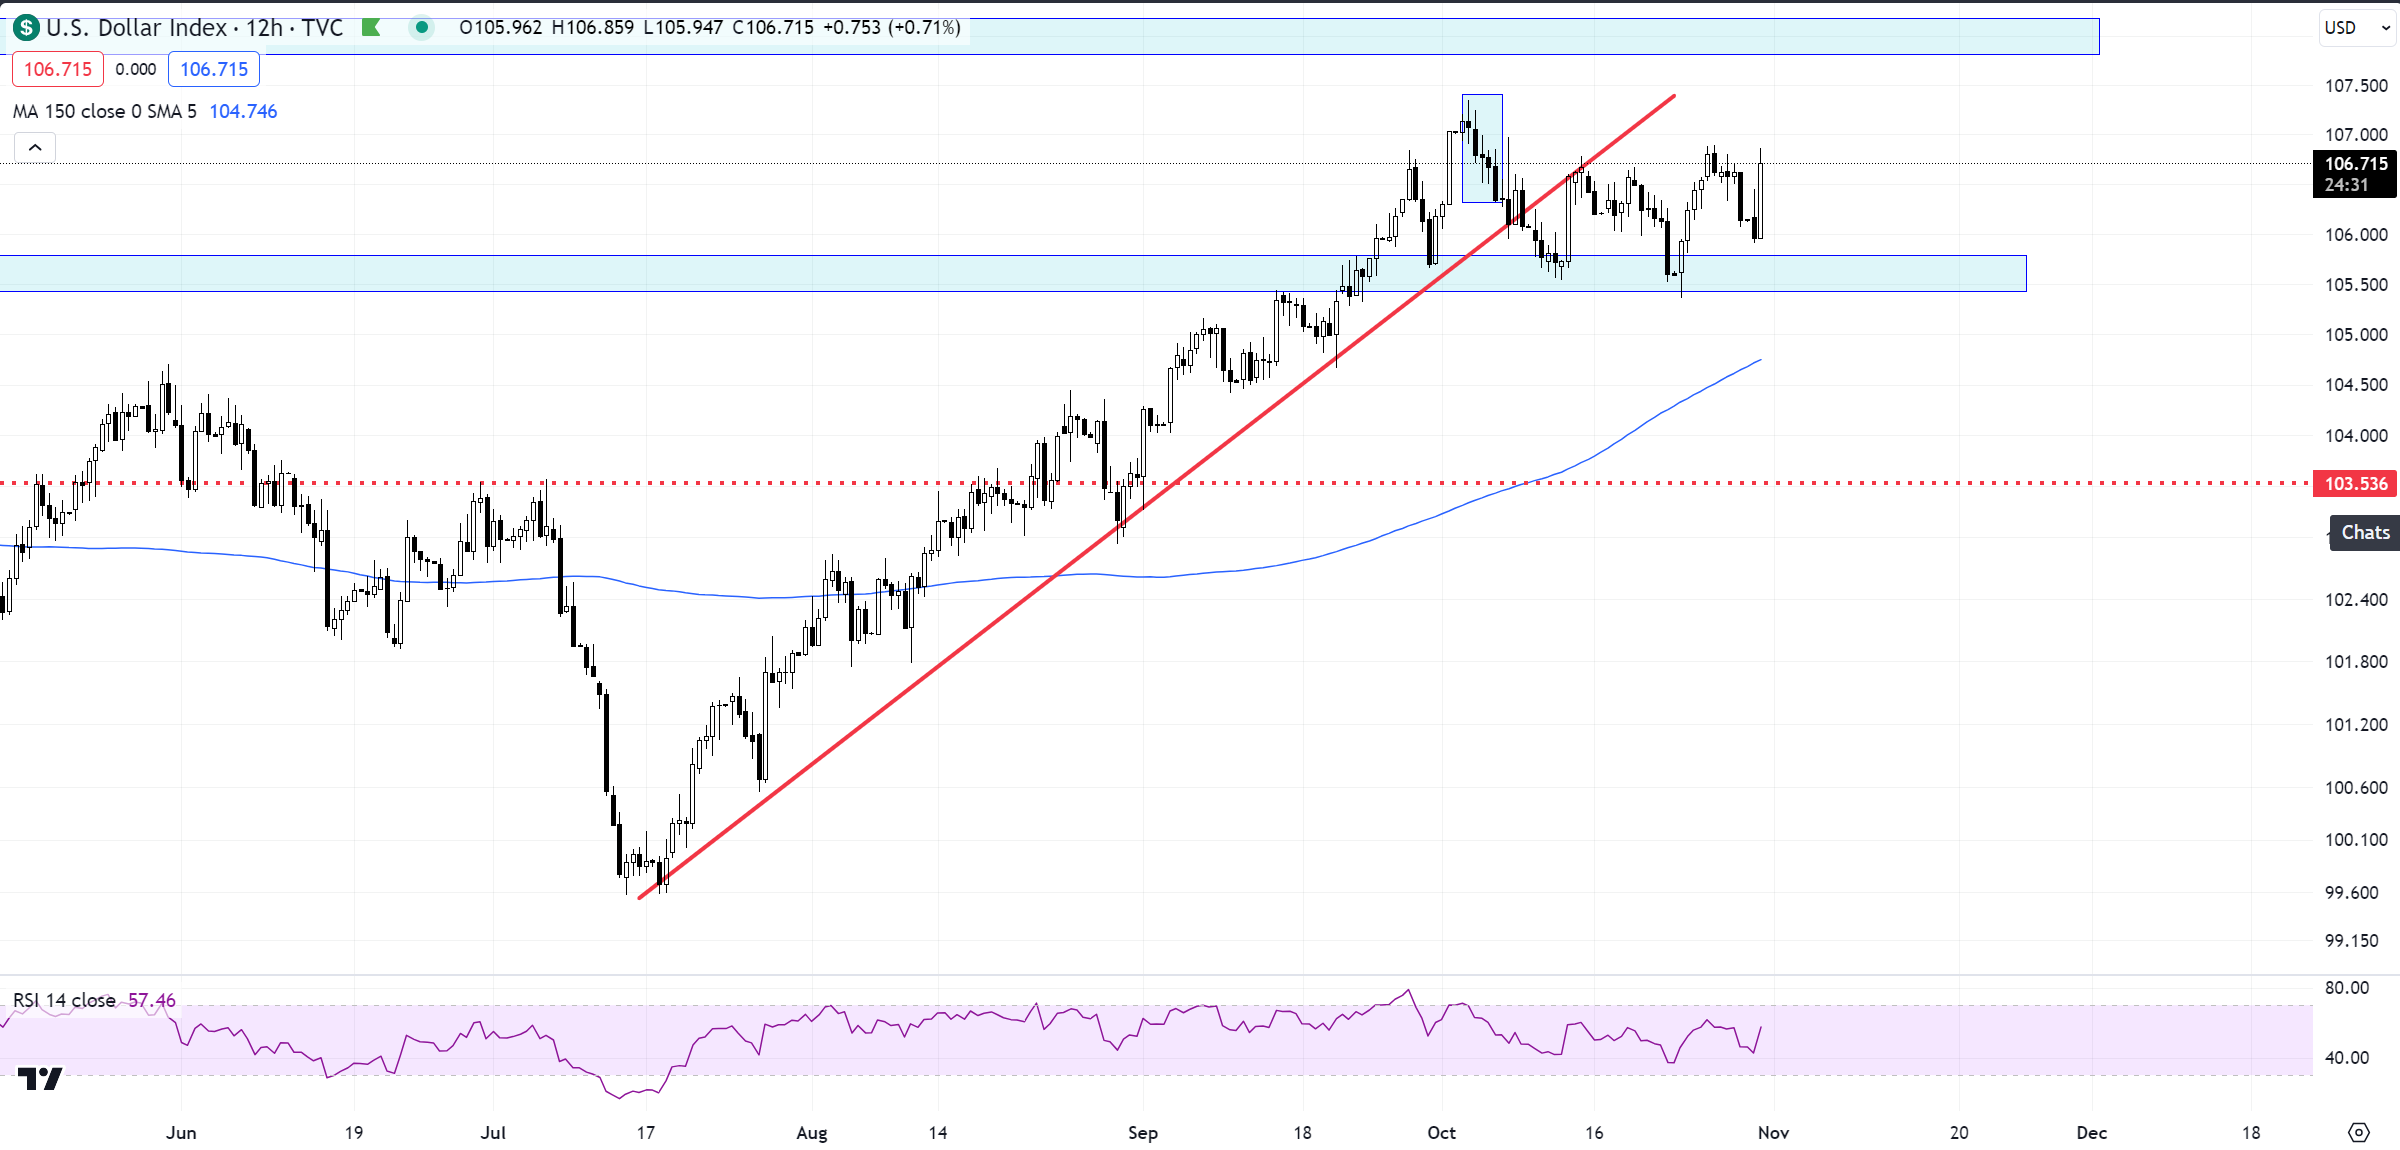
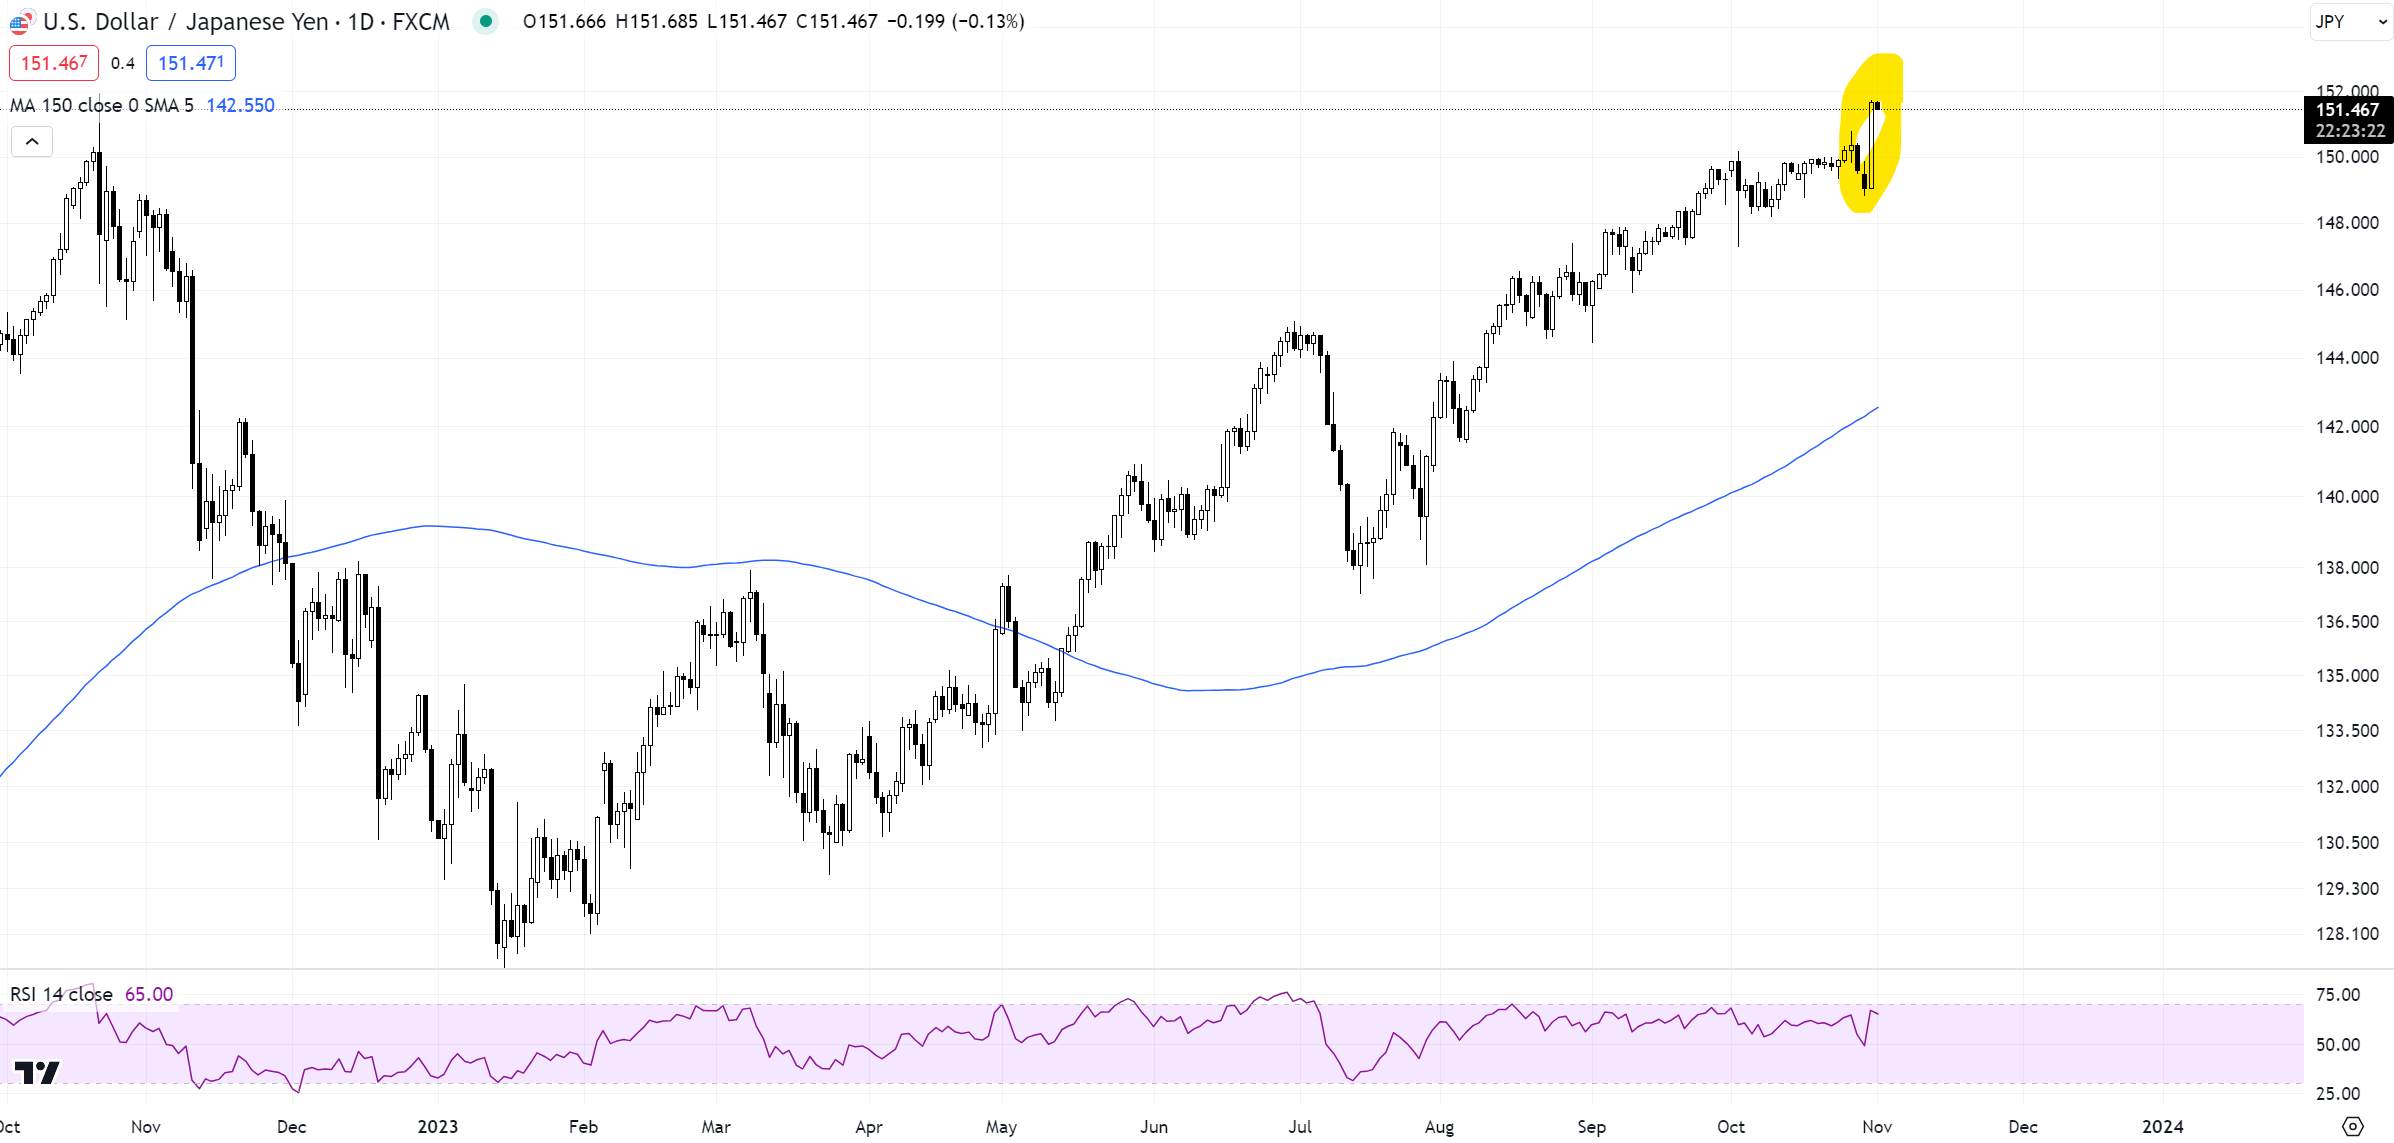
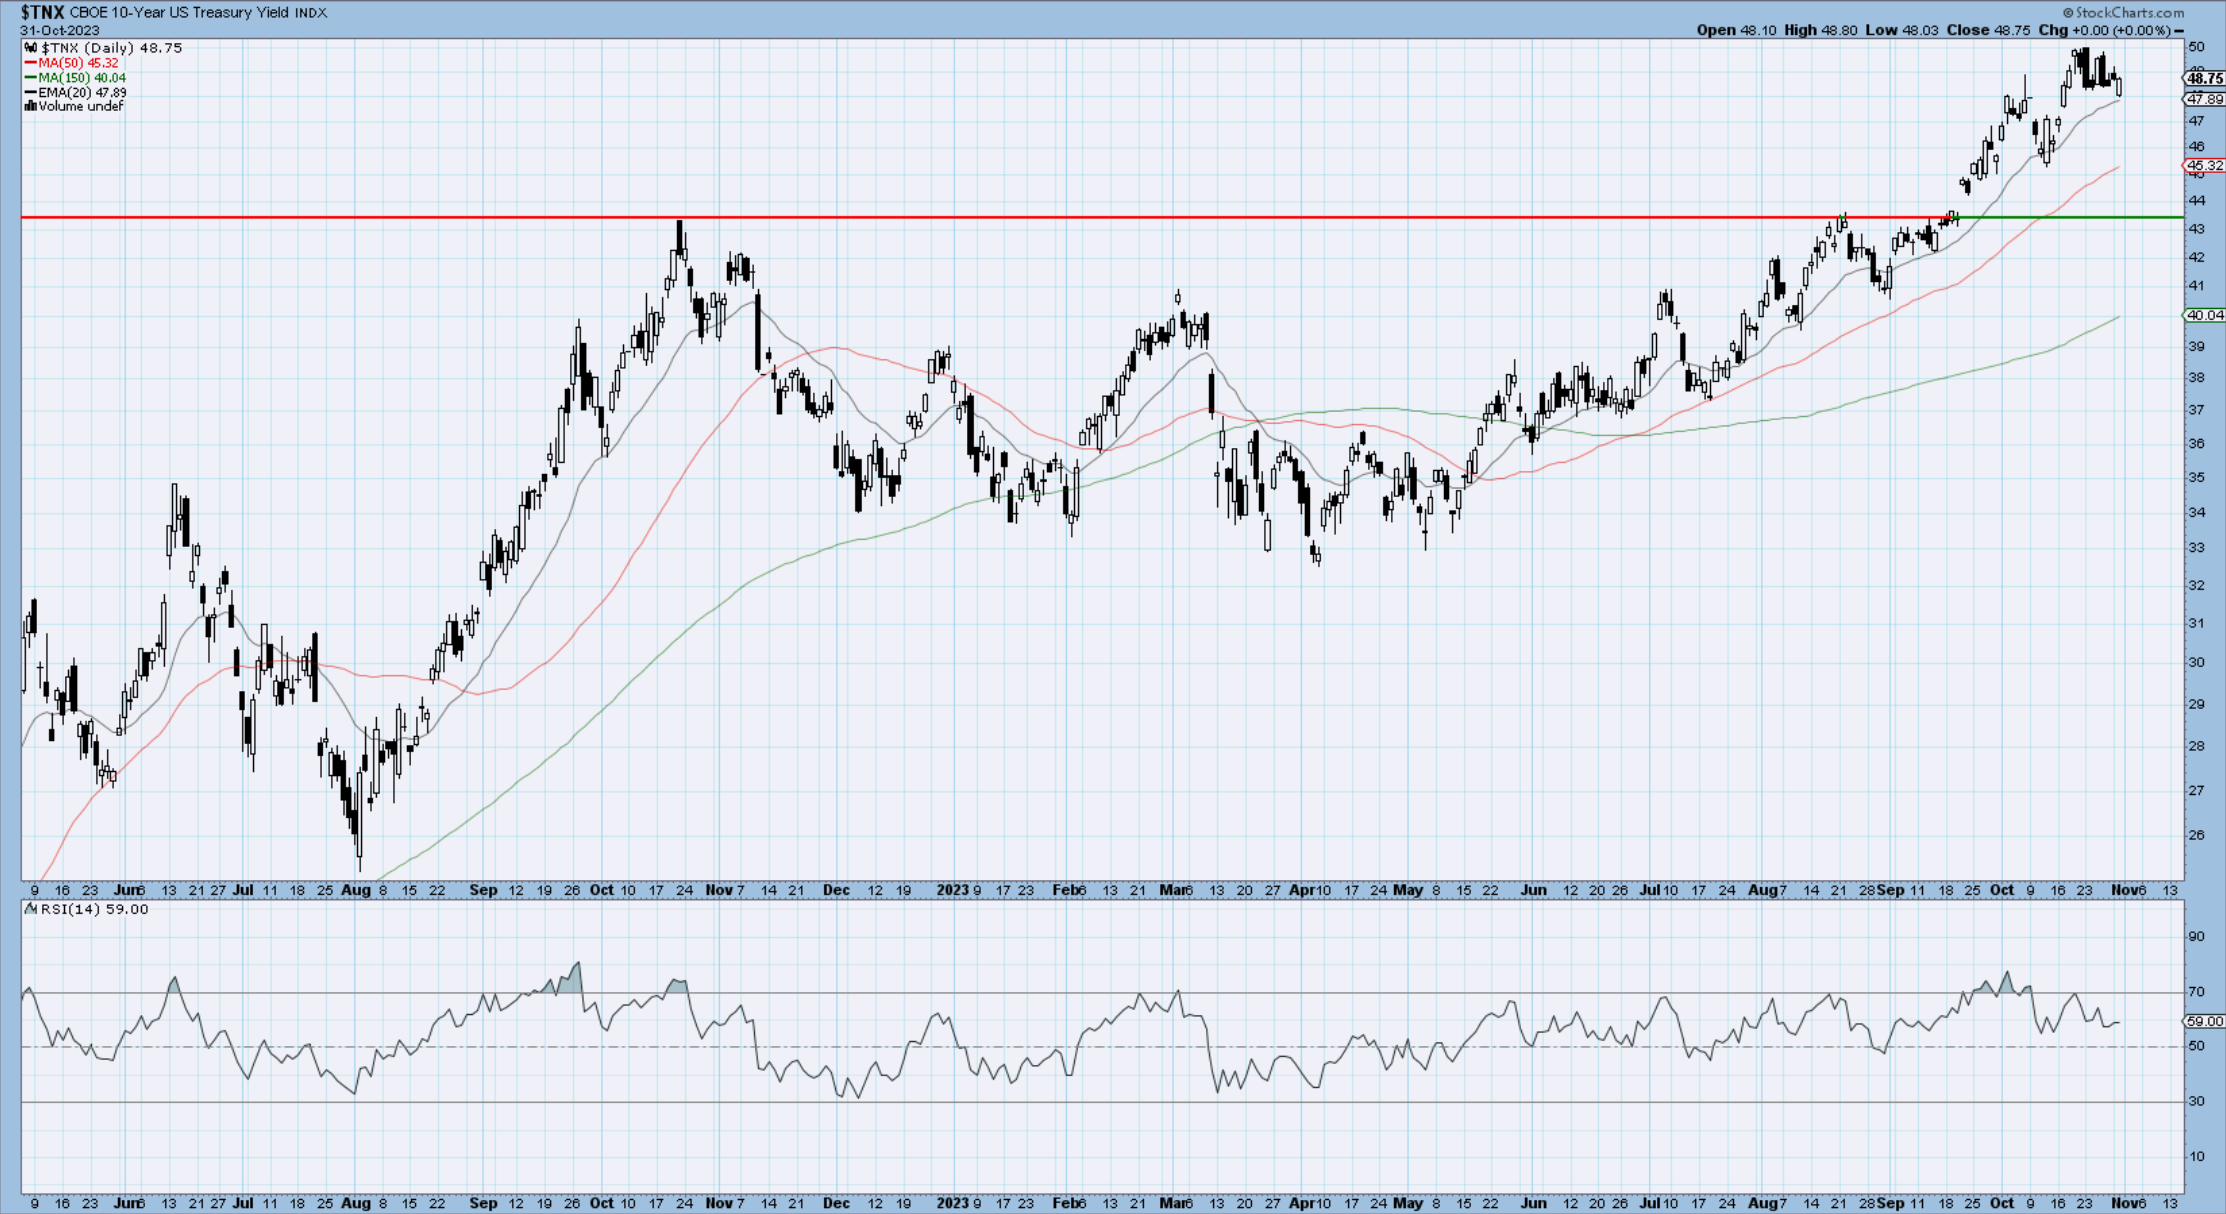
US Dollar and Yields
The dollar is not giving up here jumping today on a positive risk market. I think it has something to do with the jump in dollar/yen ( chart below). By the way, that usd/jpy train is running on fumes here and I am on high alert for reversals. Keep an eye on that one.
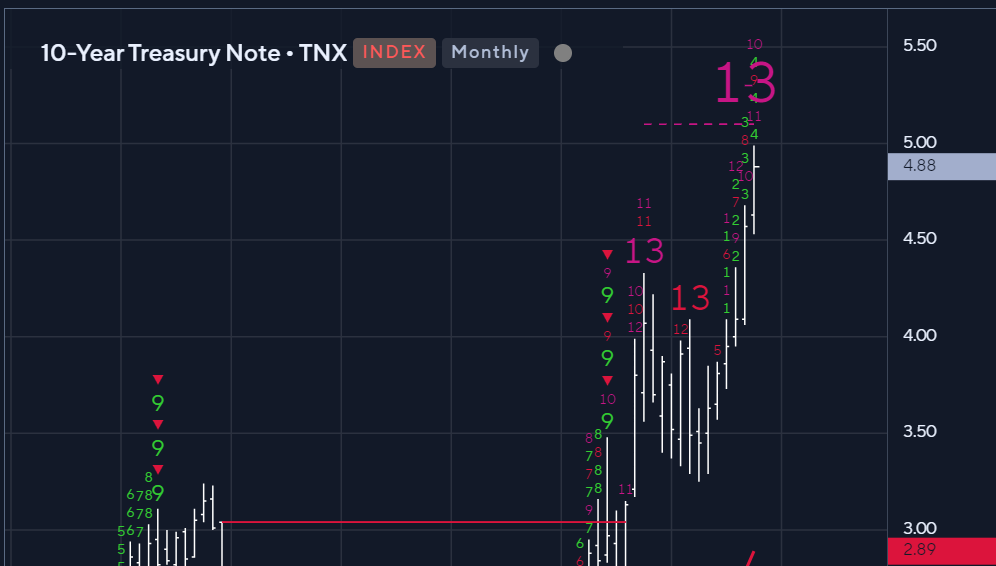
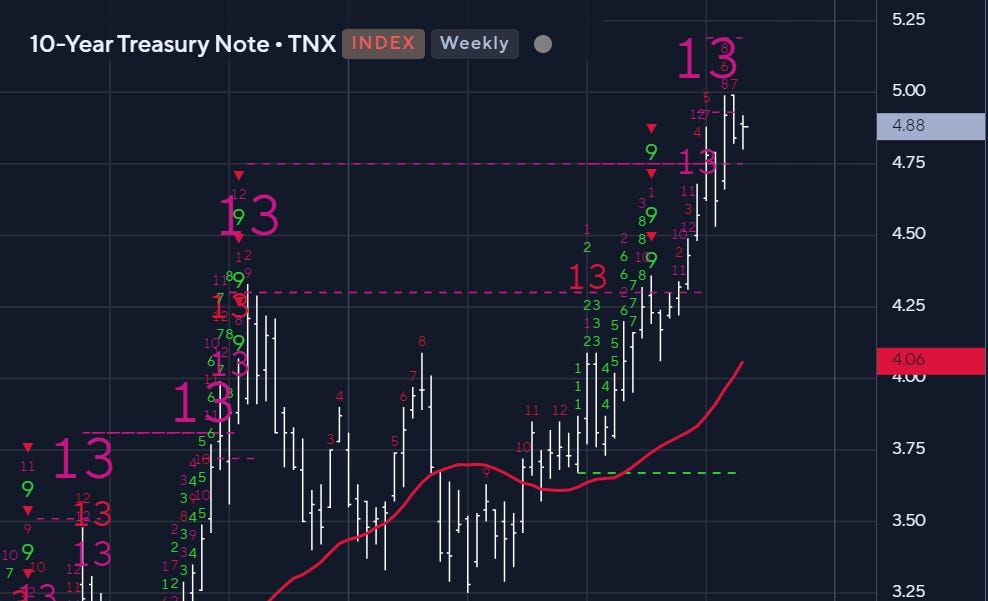
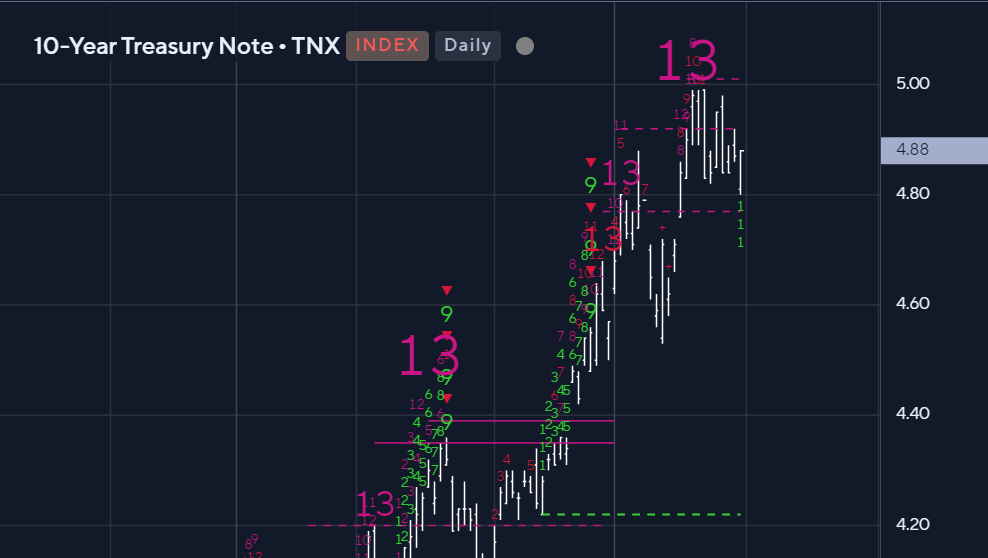
10yr yields are trying to hold the 20-day but this train is about to be derailed. Below you will see the Monthly, weekly, and daily 13 countdown sell setups.
Gold
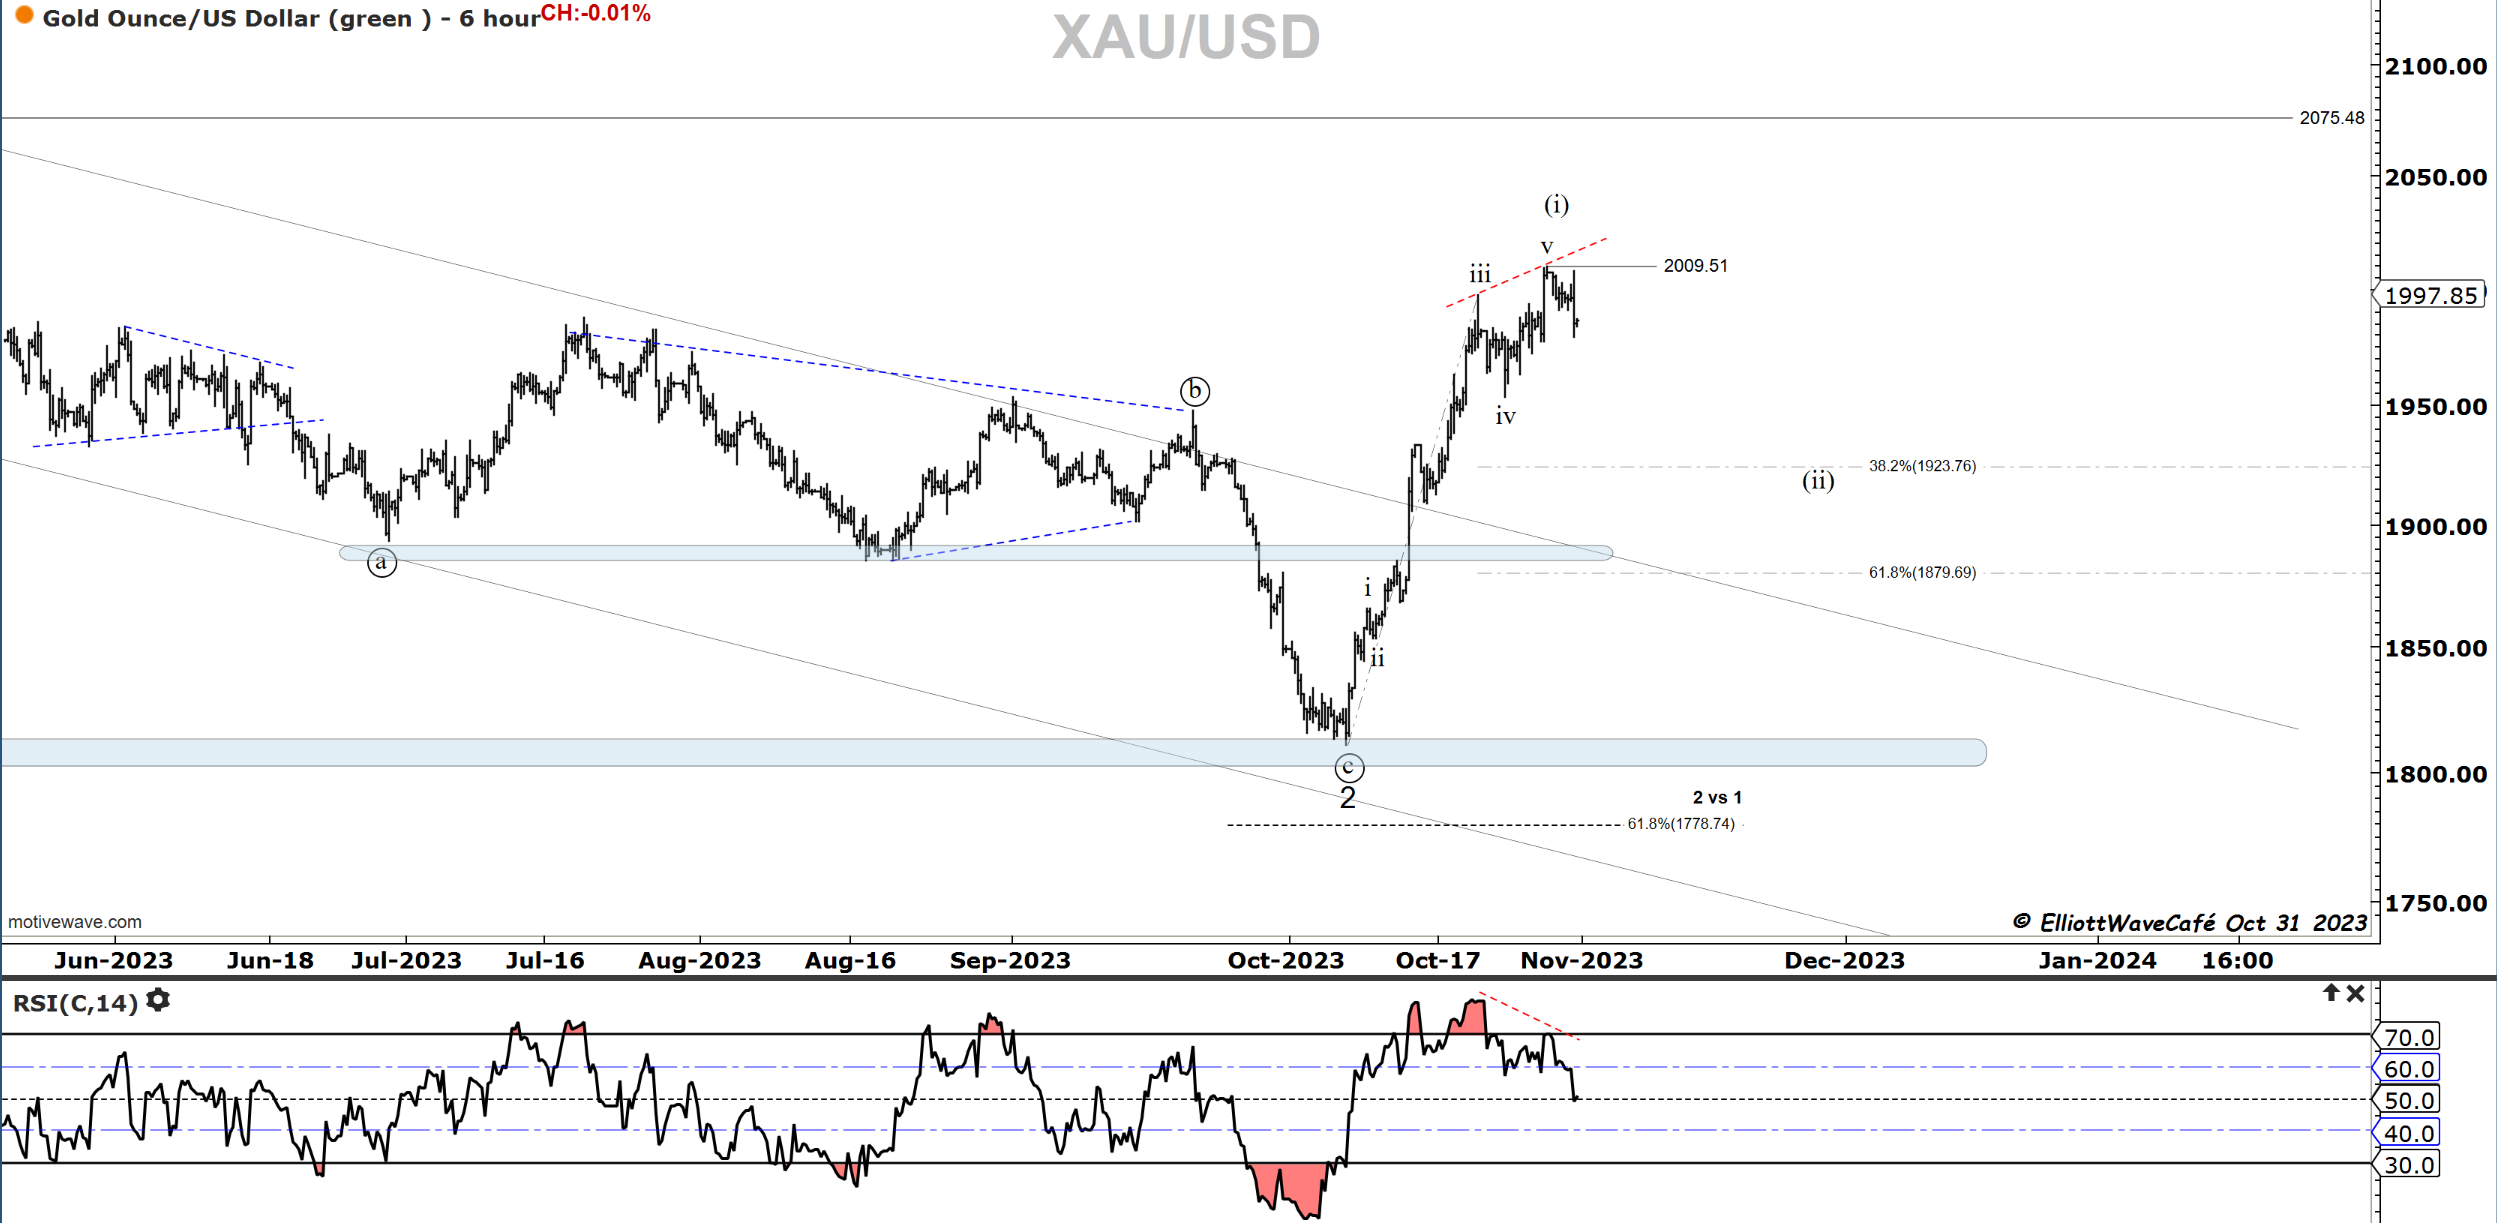
Prior comments on Gold remain - today we got a small hint of what’s coming.
Gold is trying to rally but the rate of ascent is slowing. I can see a possible 5-wave move with divergence in RSI. Let me just say that being long here is playing with a bit of fire. Once a wave (ii) pullback unfolds the odds will be back in bullish favor.
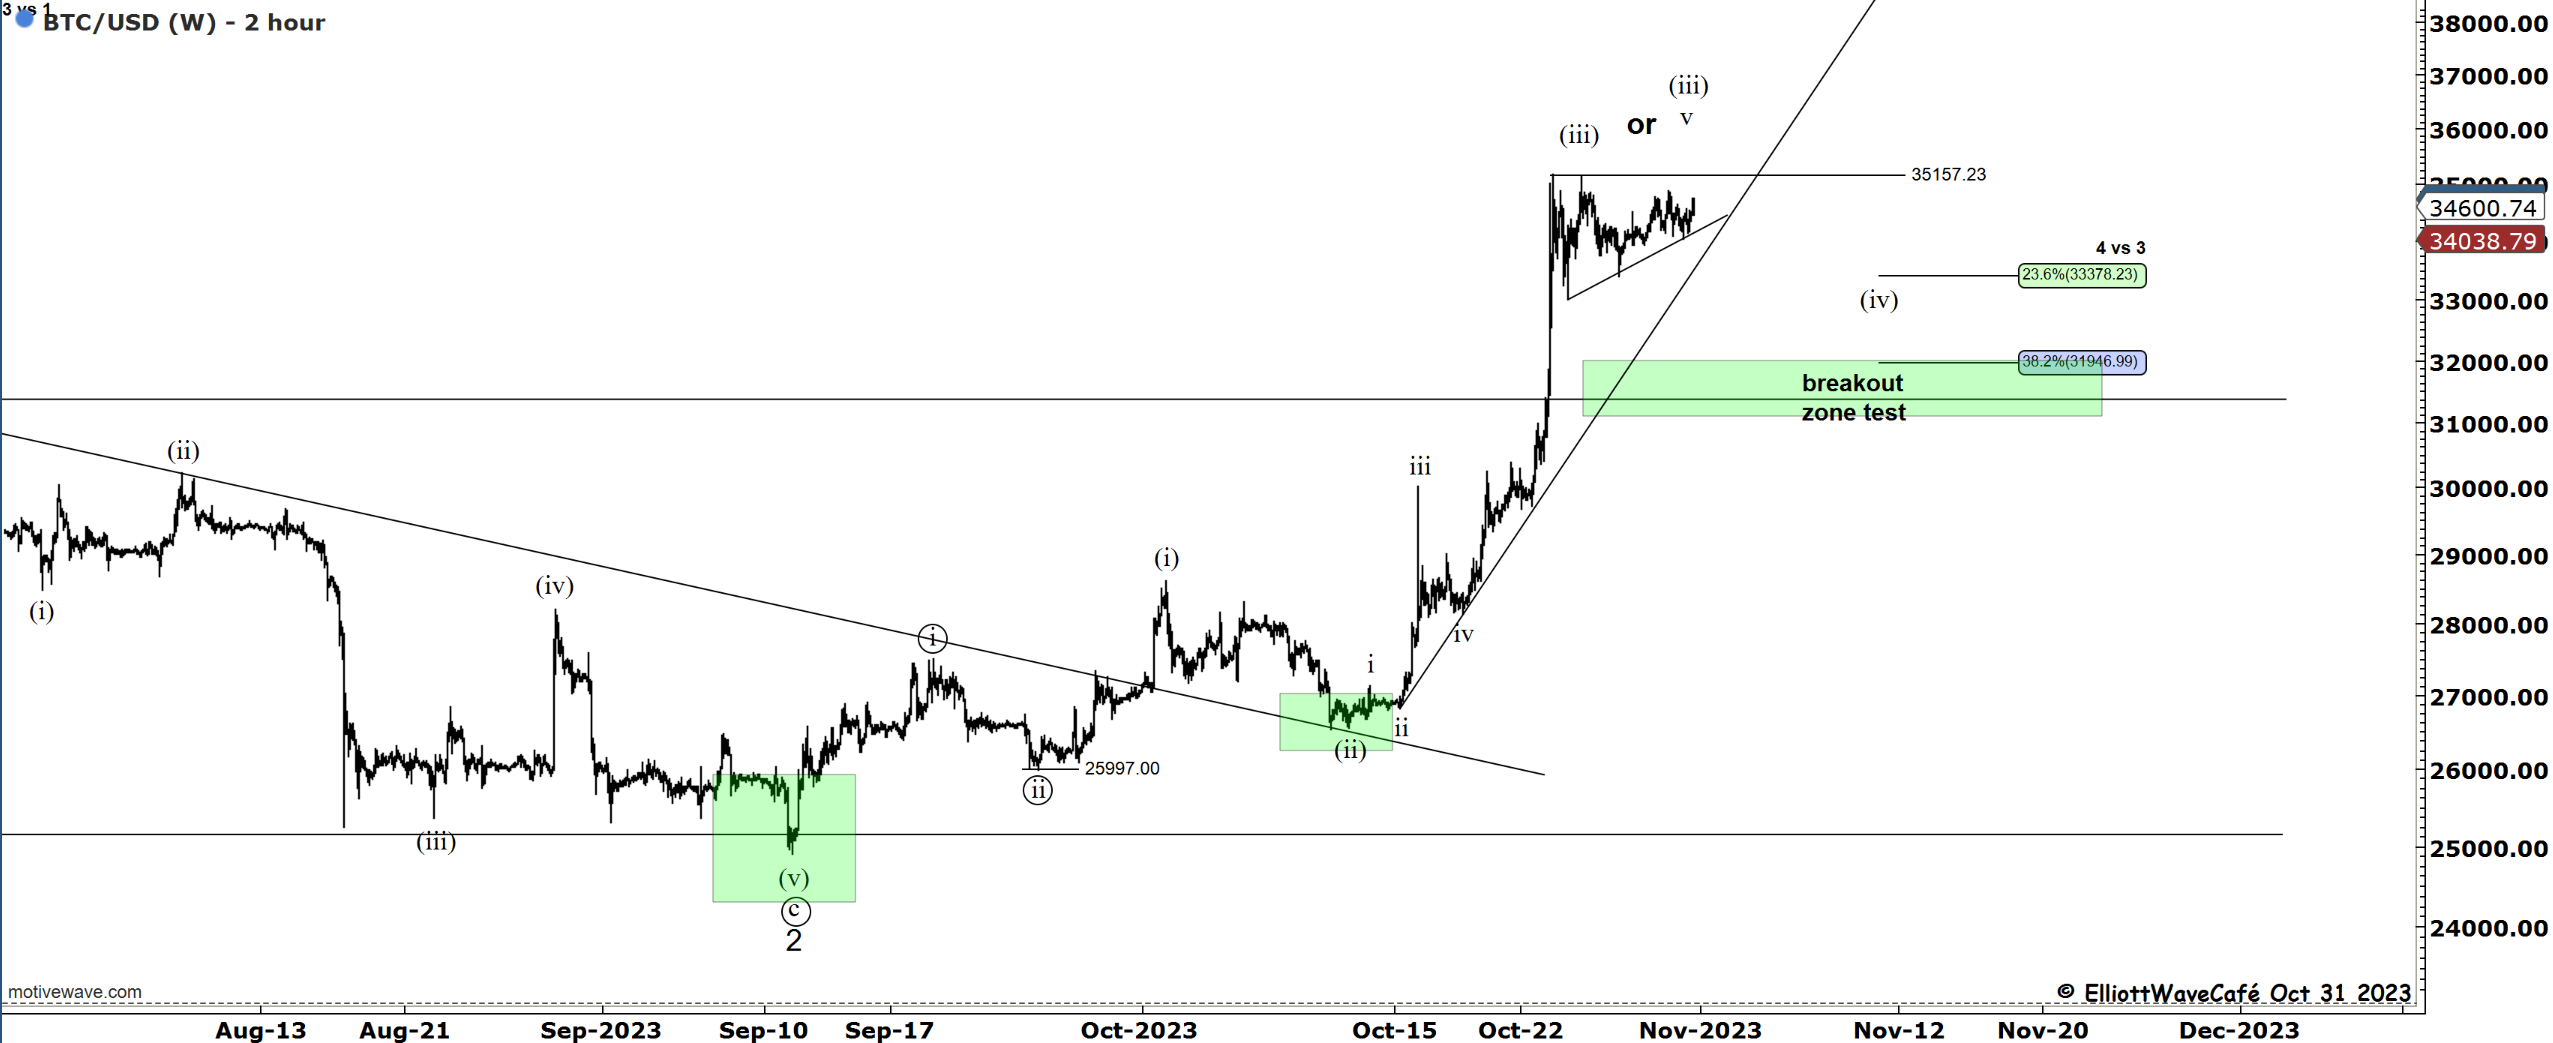
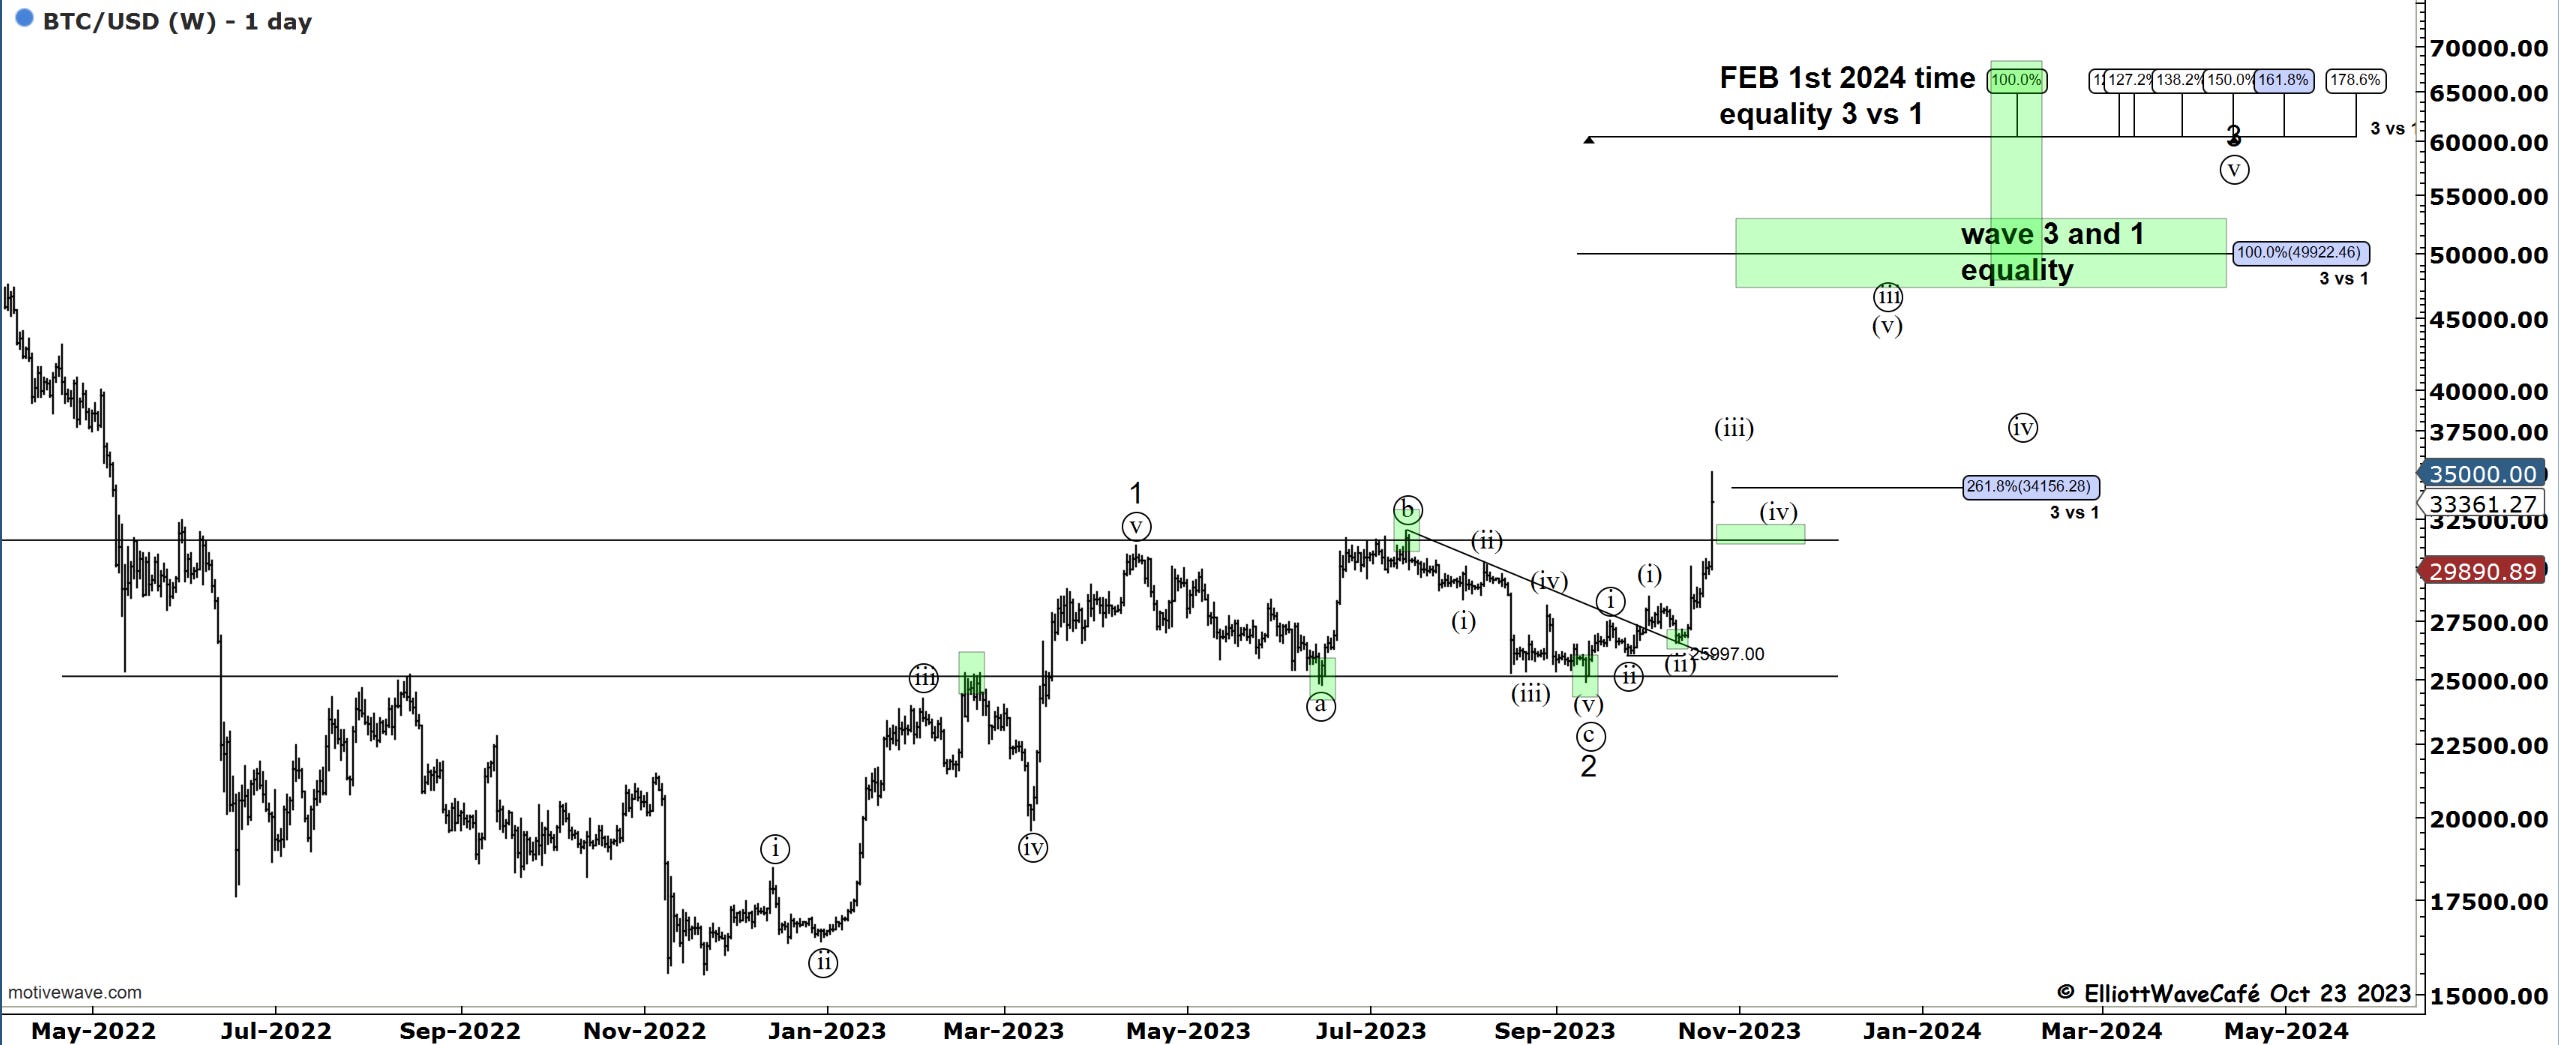
Bitcoin
Bitcoin is building an ascending triangle but a triangle nonetheless. In elliott wave, triangles are the formations that precede a final thrust in that particular direction. Once that move terminates, we usually get a reversal to at least the place where the triangle ended. What is hard to know is how far the breakout will travel. I continue to think that building a 4th wave continues to be the likely scenario either in progress or after the brief breakout higher. Let’s see if tomorrow’s Fed has any impact on this.
Daily video coming up next,
See you tomorrow - trade well,
Cris
email: ewcafe@pm.me