
The Daily Drip
Markets review, strategy and analysis
Note: The EW counts on the right edge are real-time, and they are prone to adjustments as price action develops. Elliott Wave has a fluid approach, is evidence-based, and requires constant monitoring of certain thresholds.
In the counts below, this (( )) = circle on chart
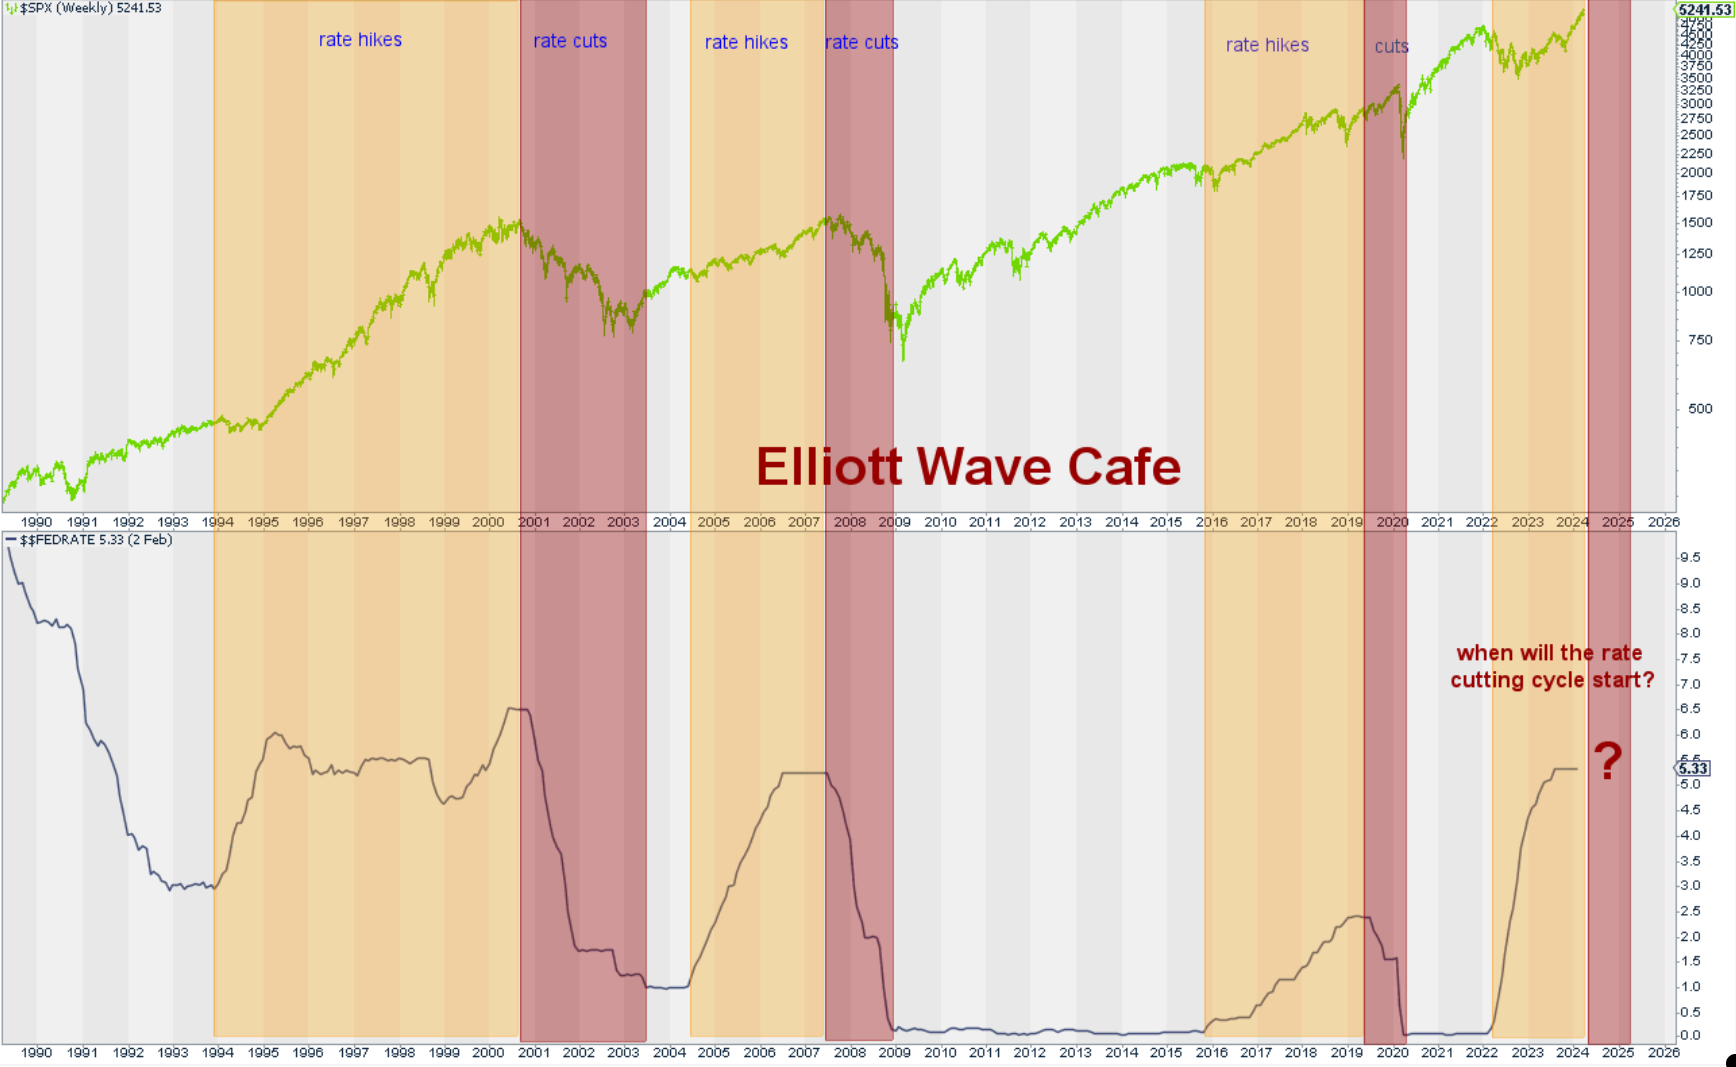
Chart of the Day: SPY vs. FED—a picture worth a thousand words! Here is what happens to stocks when the Fed starts to cut aggressively. This time could be different if they only cut slightly so as not to be that restrictive. But will they?
Yesterday’s chart response: COSTCO - COST.
There is no recap of yesterday’s note. It was an unlocked article, and you can find it here
In the Daily Video, we looked at elliott wave counts.
Let's dive into the charts below …
Today I want to show you some extreme moves in breadth indicators, something that suggests potential exhaustion and trouble in the near term…
