
The Daily Drip
Core markets charts updates and commentary
Note: The counts on the right edge are real-time, and they are prone to adjustments as price action develops. Elliott Wave has a fluid approach, is evidence-based, and requires constant monitoring of certain thresholds.
In the counts below, this (( )) = circle on chart
SP500
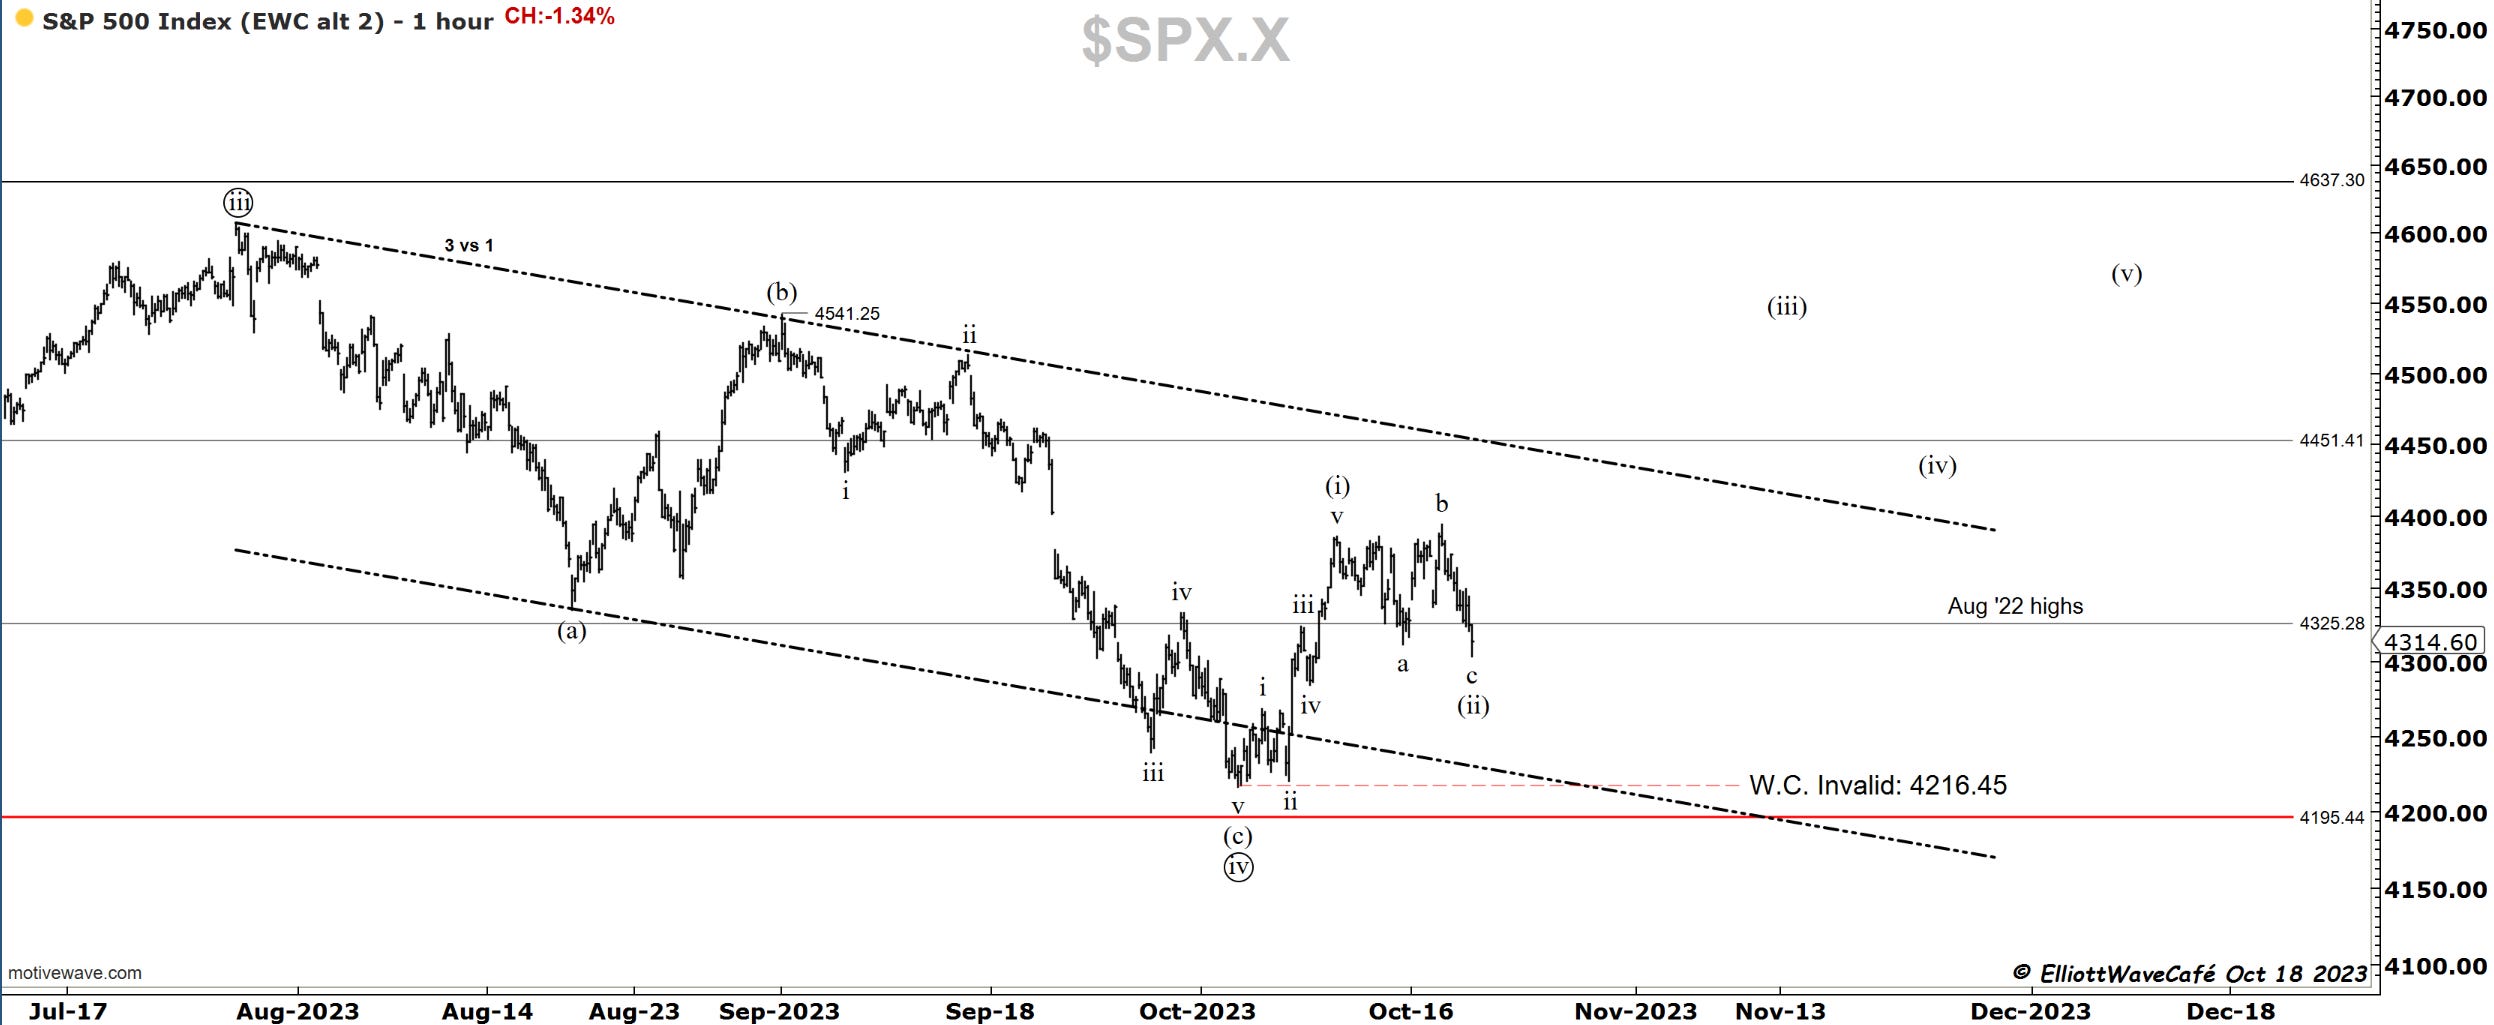
We lost -1.34% today in this index. There was a gap lower at the open, a brief attempt to close it, and an avalanche of selling throughout the rest of the day. There are plenty of reasons that the news media will give for this action, none of which matter in the slightest. The war, the debt, the earnings, the yields, October weakness, and many more. In the end, the market rejected higher for now, and that’s it.
If we look at the chart below we’re getting some proportion between the two selling legs in wave (ii). I was contemplating that wave iv, but the width of the correction makes it far less likely. I like it as a wave (ii) even tho we extended it with one more lower leg. A flat is the verdict here at the moment. At 4280 we have the 61.8% throwback. If we lose that level, the invalidation comes at 4216.
Even with this perceived equity pressure, I maintain the view that this is a corrective move against the impulse from Oct 3rd. That view will be challenged below the levels mentioned above.
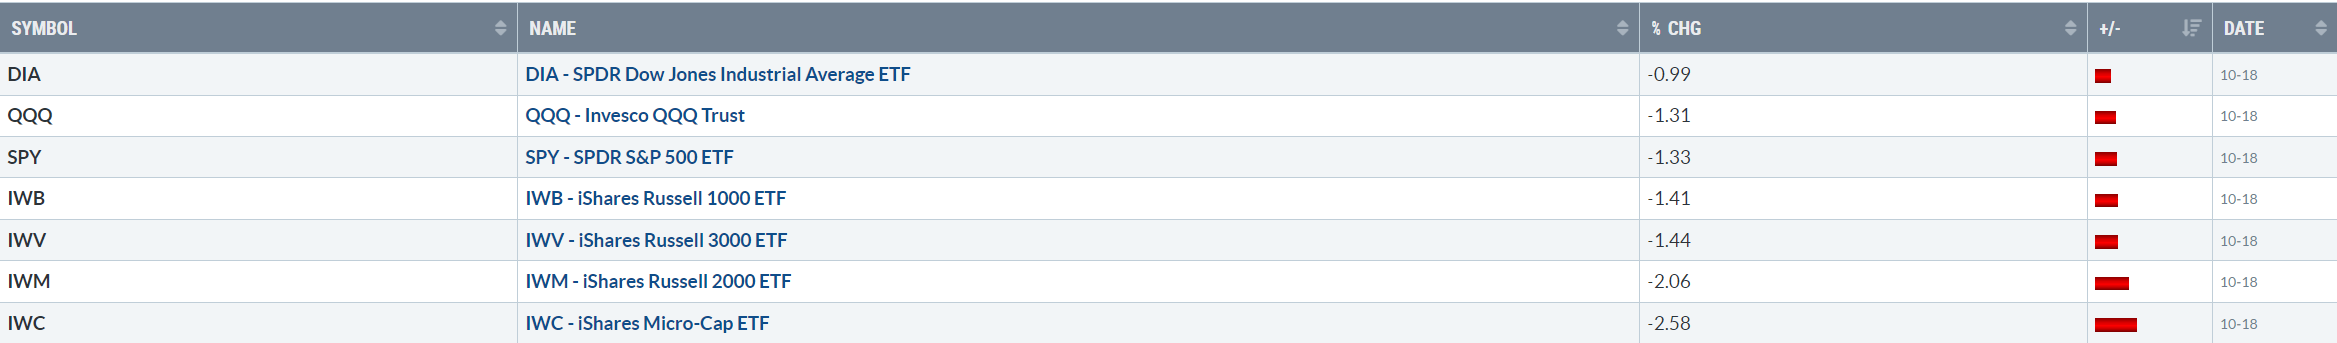
Yesterday’s gainers were today’s losers. IWC and IWM, both with over 2% losses. I guess the sharp jump in yields did them a number.
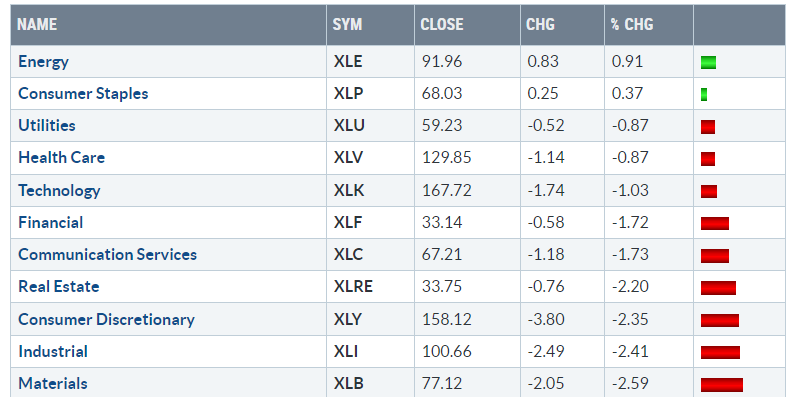
A day of running to safety was displayed in sector performance as well. The top 4 are mainly where you hide during storms historically.
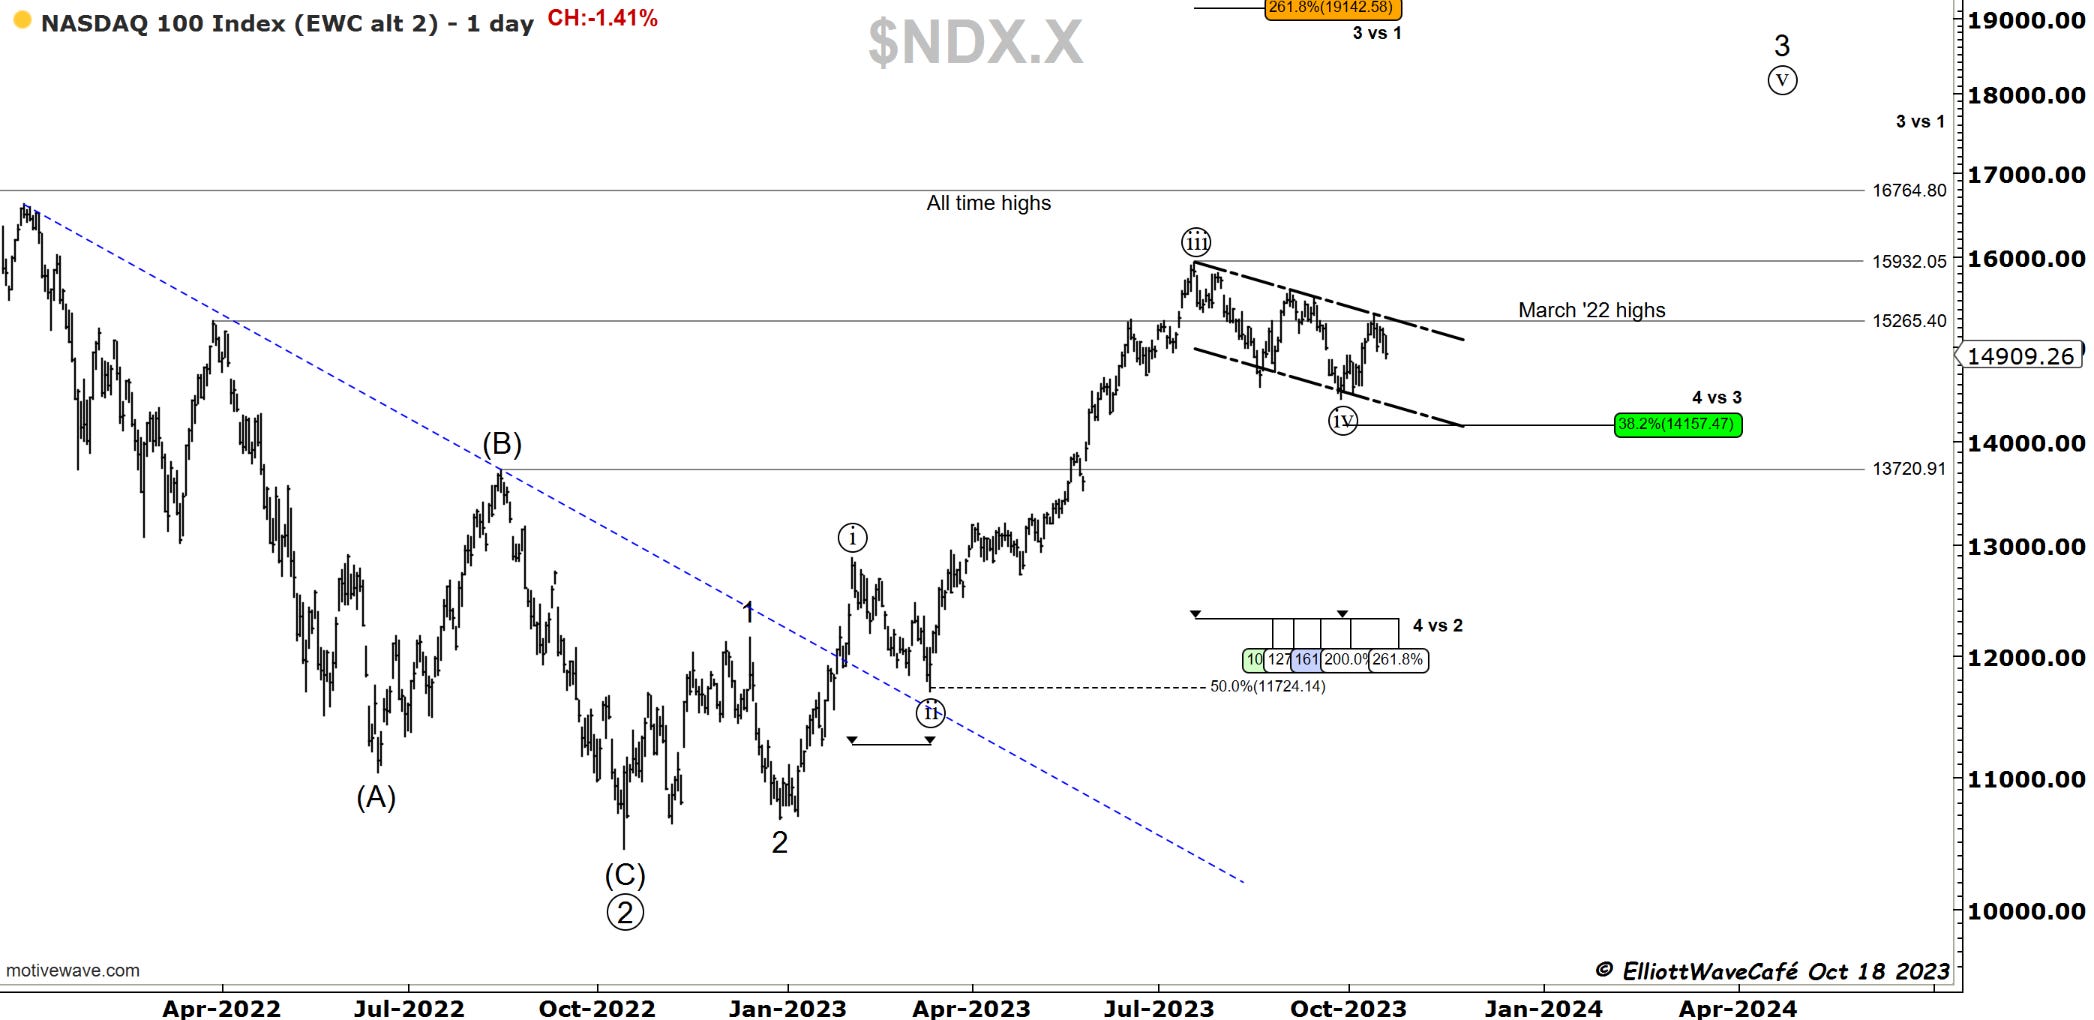
Nasdaq100
Today’s drop got below wave (i) top so a wave (iv) low is not suited here. As we know we cannot get overlap between those waves in a standard impulse. In rare wave 4 triangles occasions, wave a of that triangle can enter wave 1 area but it cannot close with wave e. The movement here still allows for wave iv to be correct since wave i top has not been violated. Anything lower than today’s lows will be problematic for the count since a wave (ii) similar to the Sp500 is hard to swallow as a count.
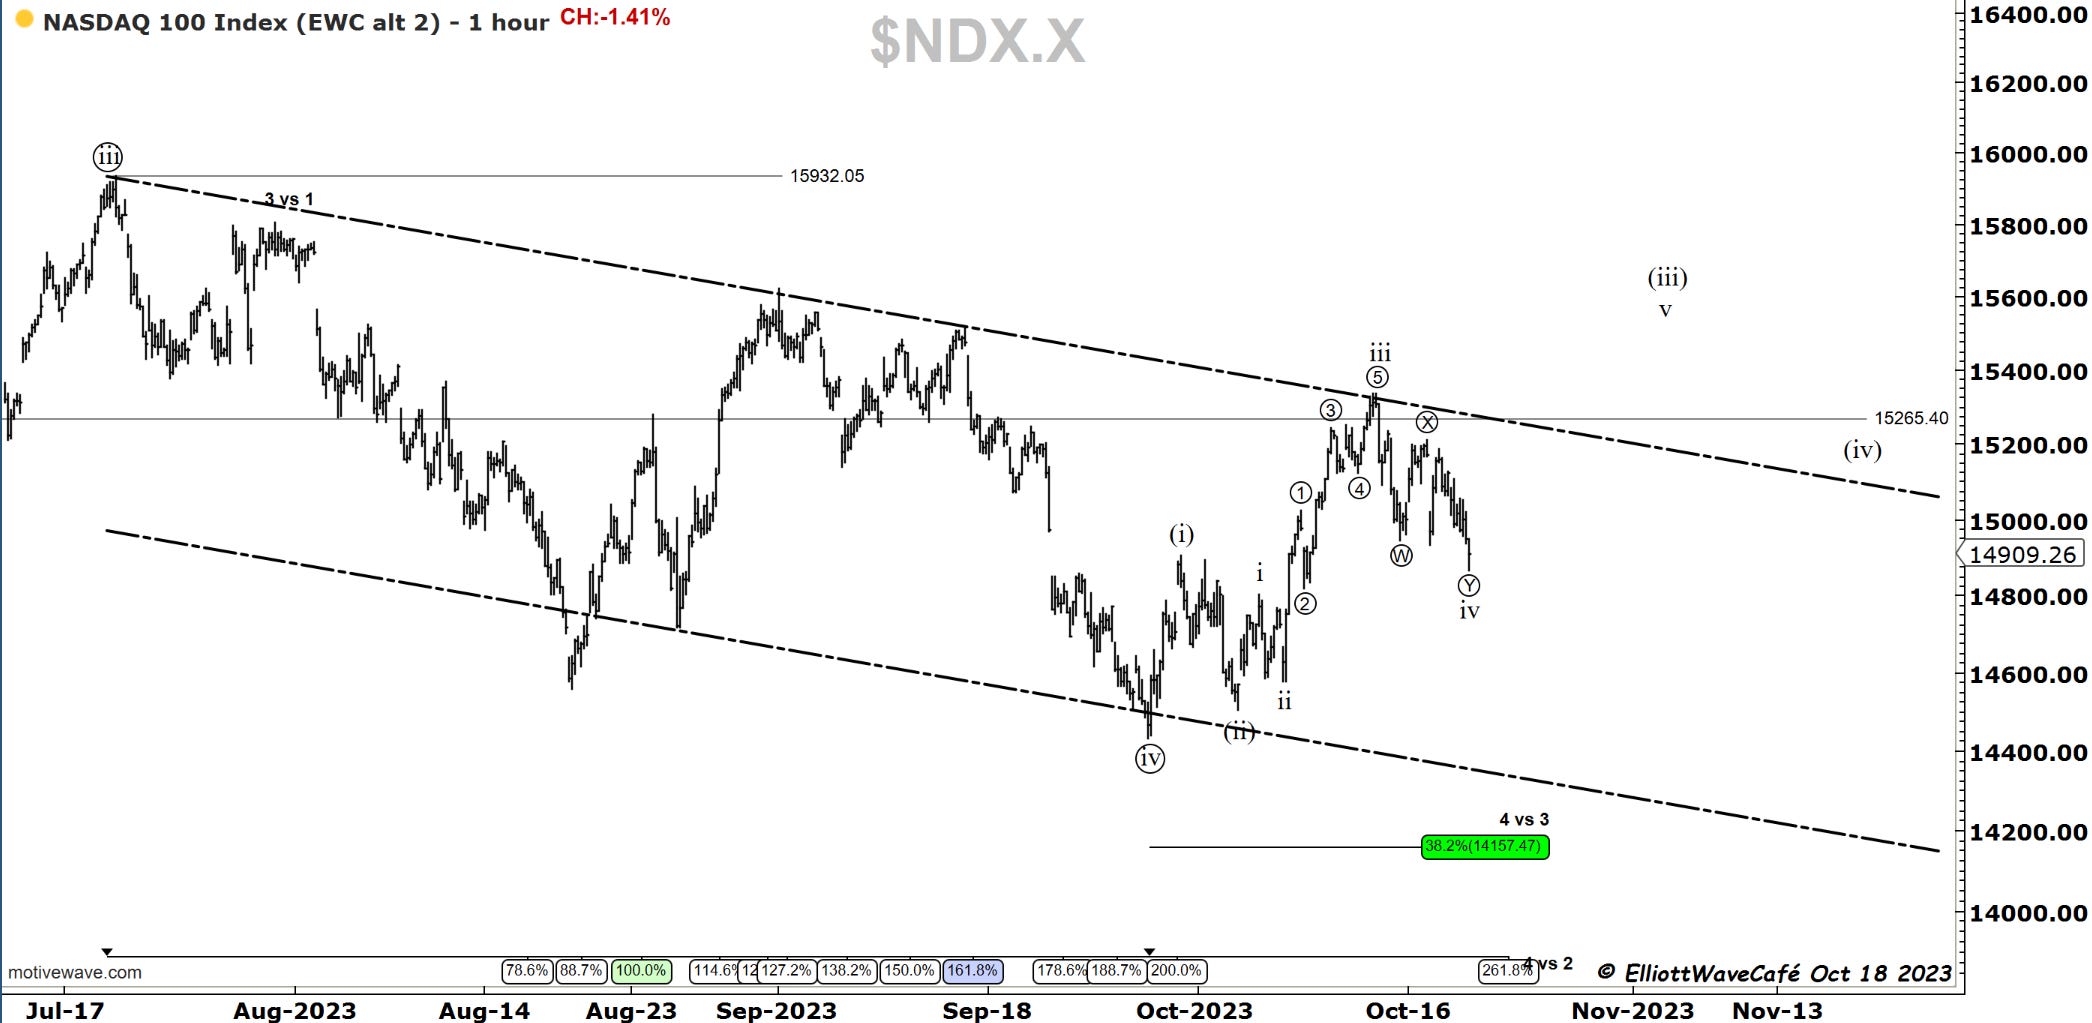
Let’s keep in mind the perspective from the Daily charts and the larger count and why I see this move as corrective against the larger impulse. There is always a chance that wave ((iv)) can grow more complex. I rather it would not since we’re about to enter a period of strong seasonality for equities.
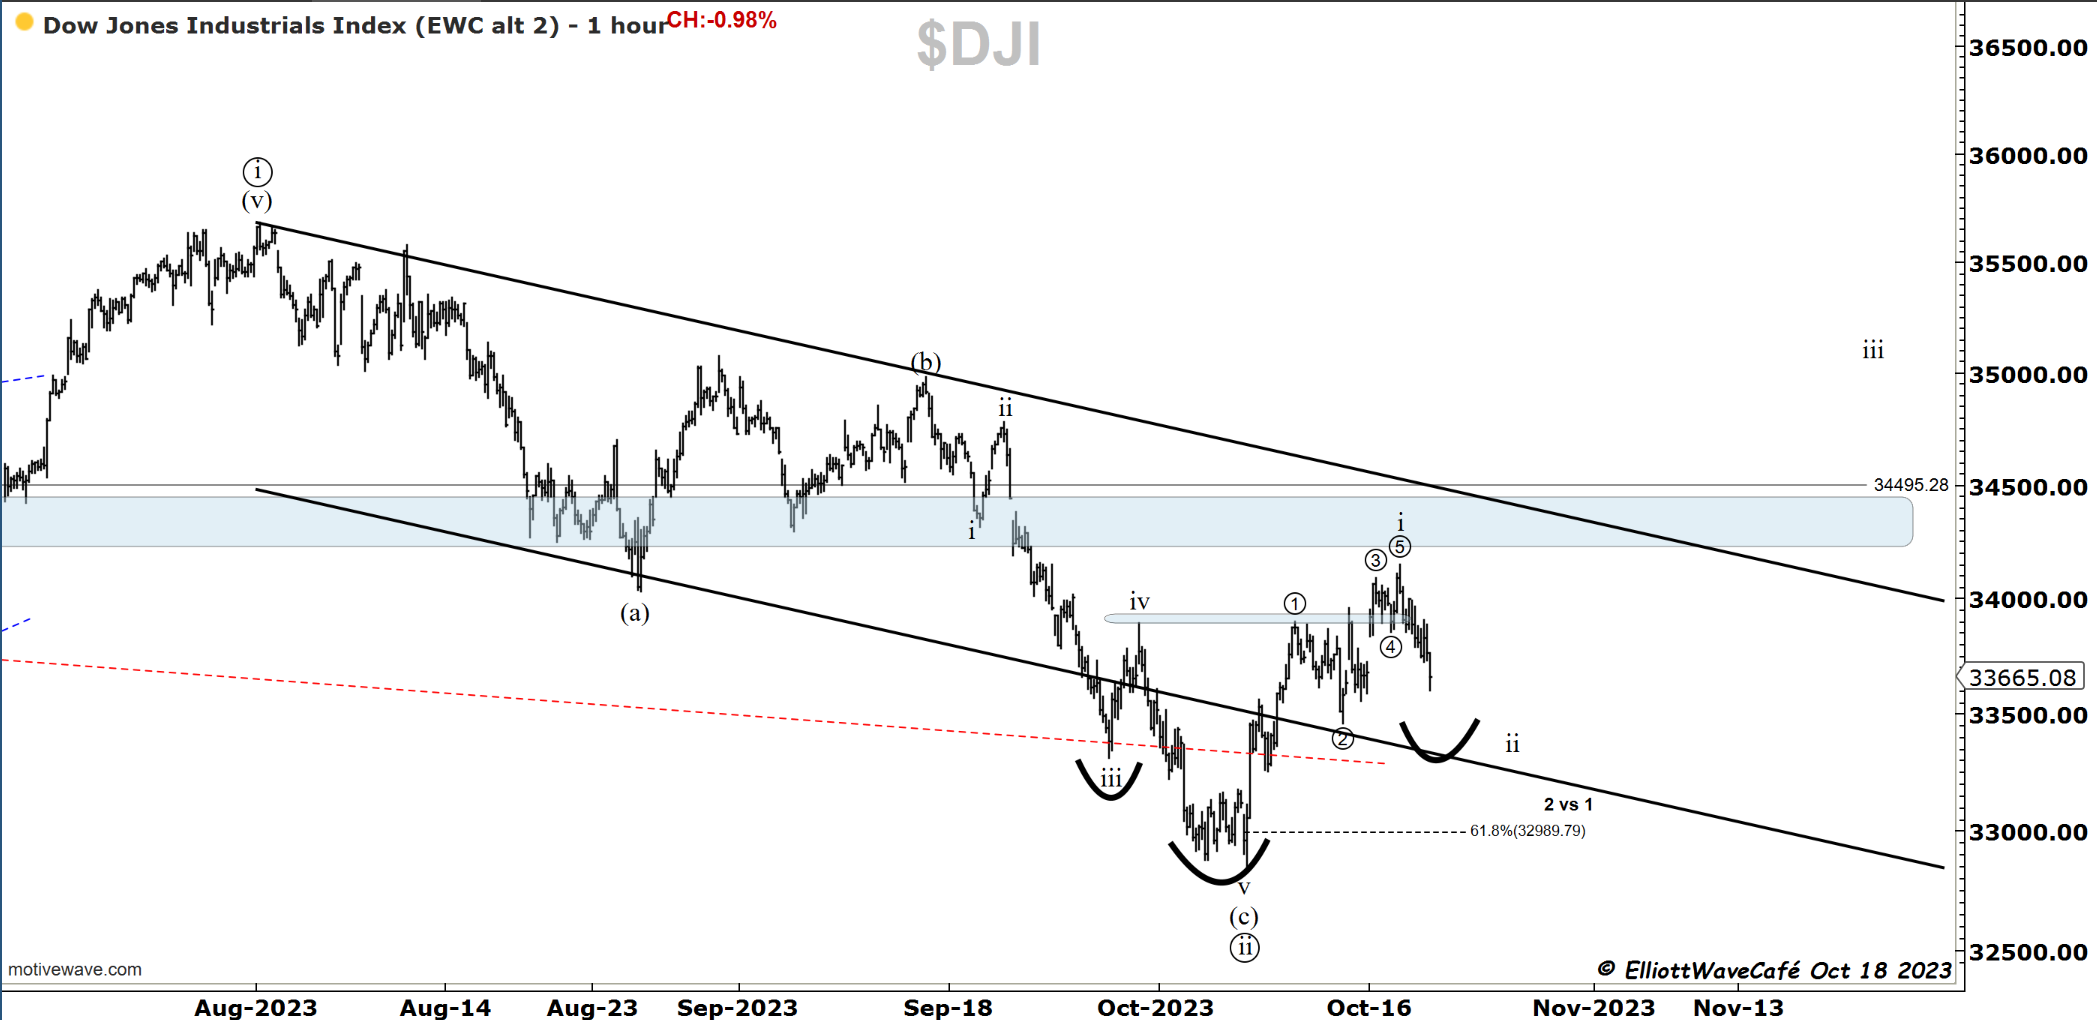
Dow30
We dumped this index as well although it was the “strongest” of them all. I am contemplating a leading diagonal here with wave ii in progress, but we can easily morph into a flat. As long as the 33k zone remains intact I can maintain the bullish posture.
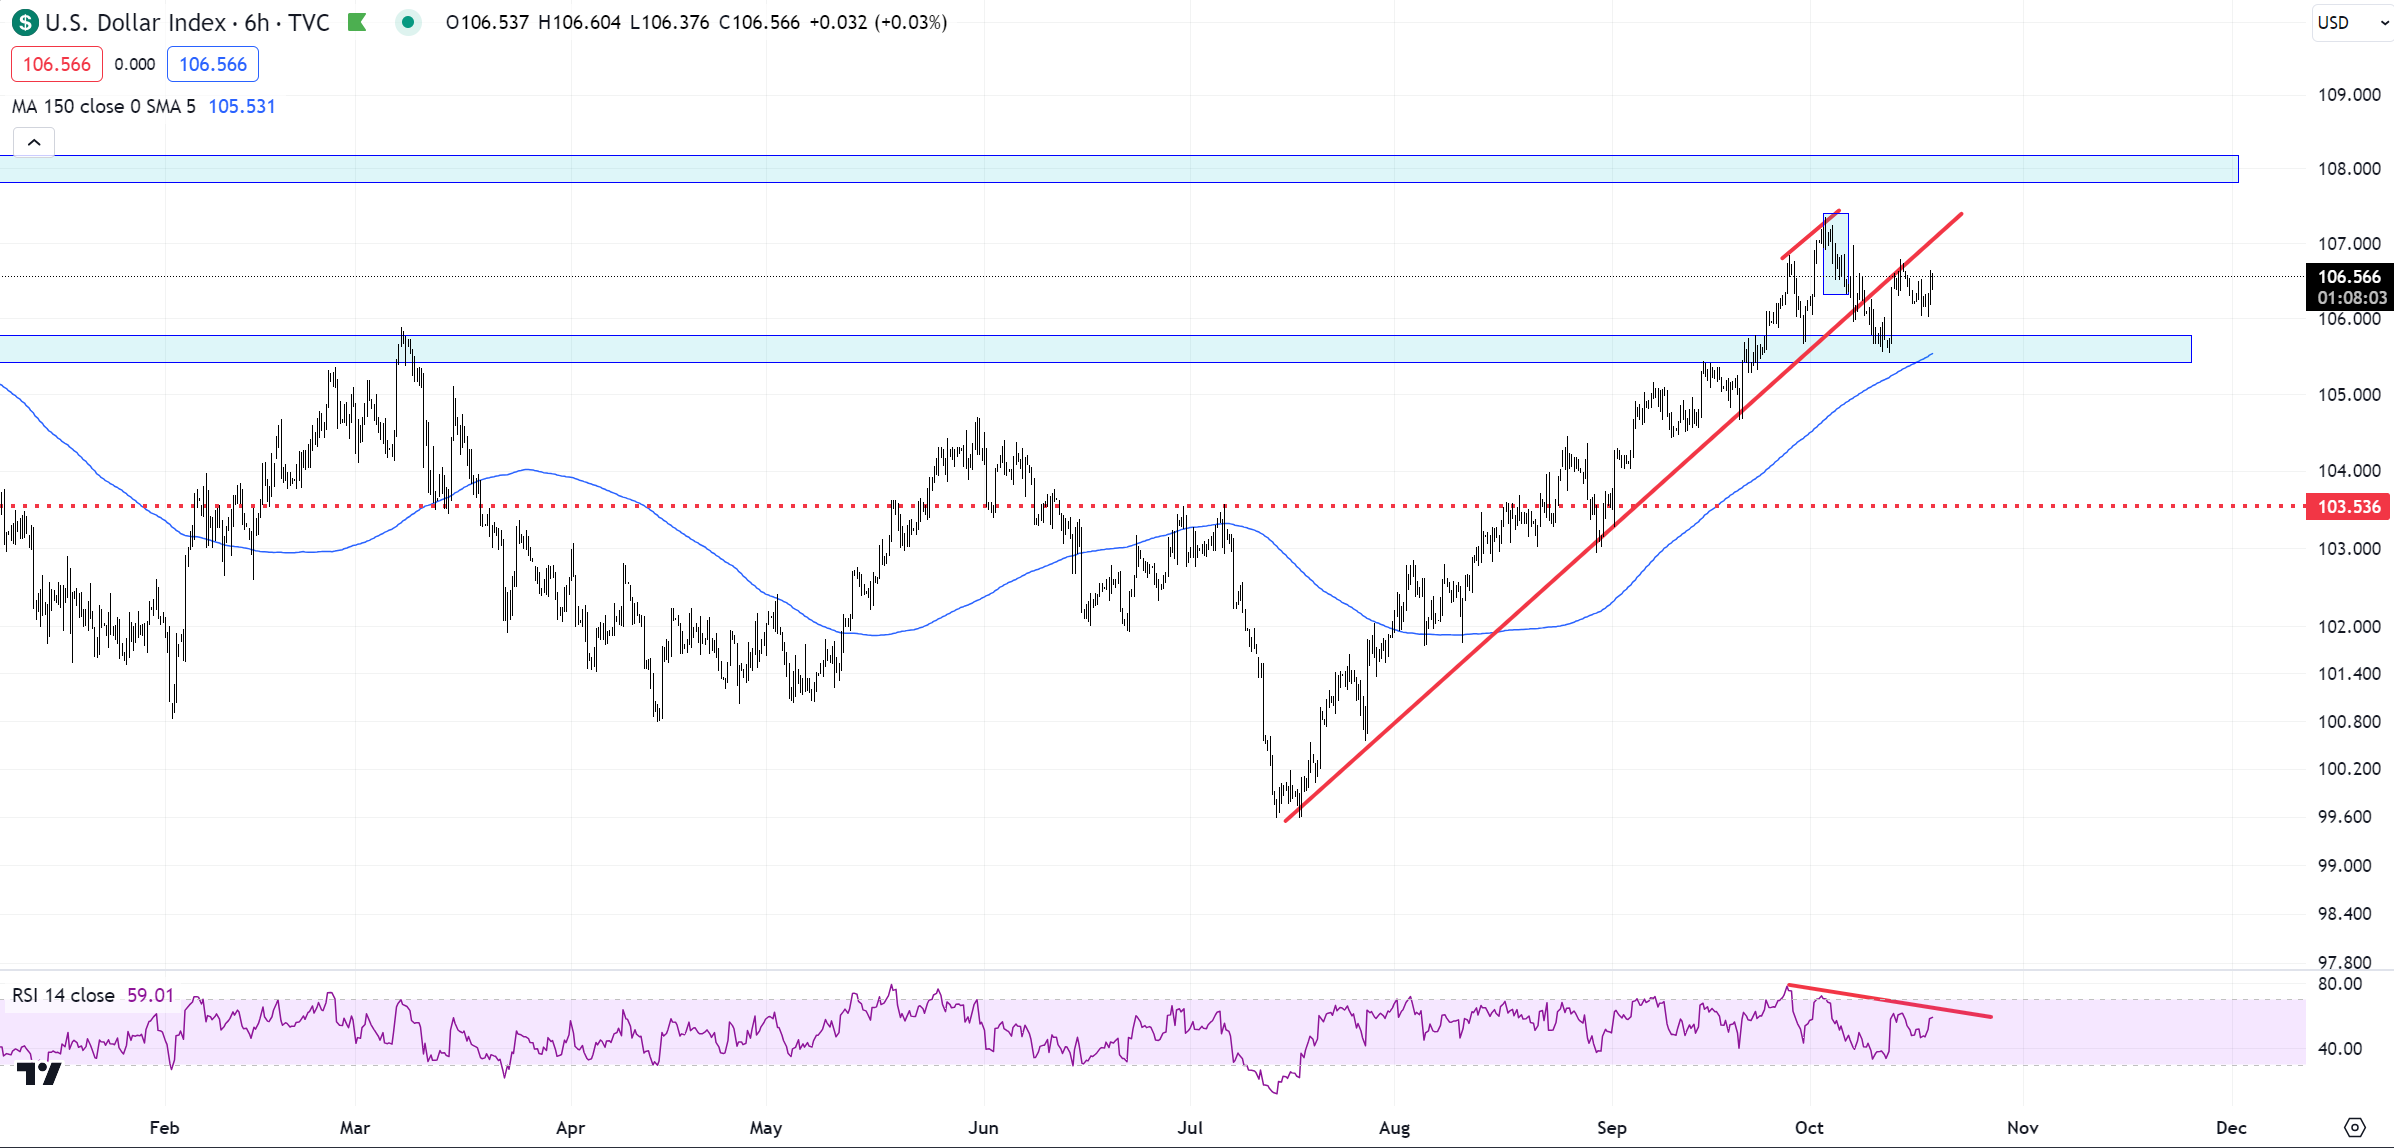
US Dollar and Yields
A beautiful overlay of the 10Y yields with the SPX.
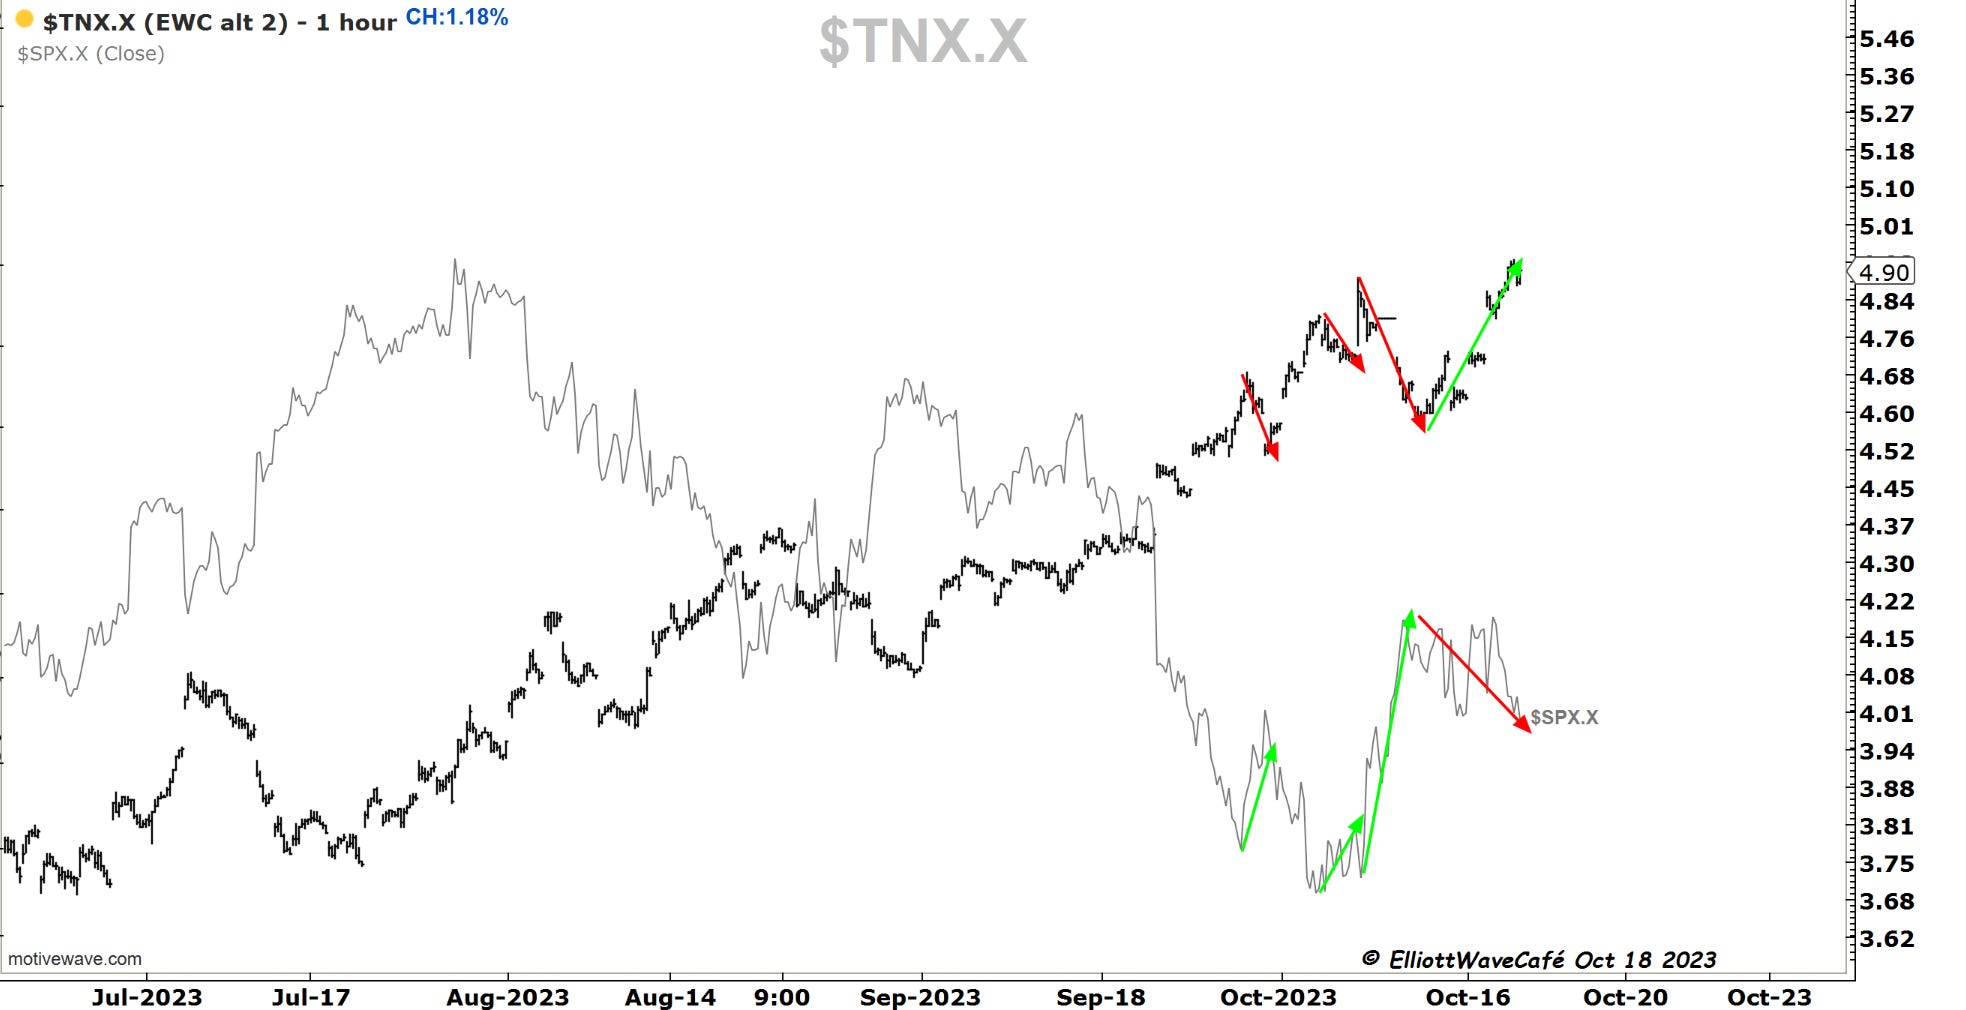
Then we add UUP etf in orange for the dollar proxy. Do I need say more?
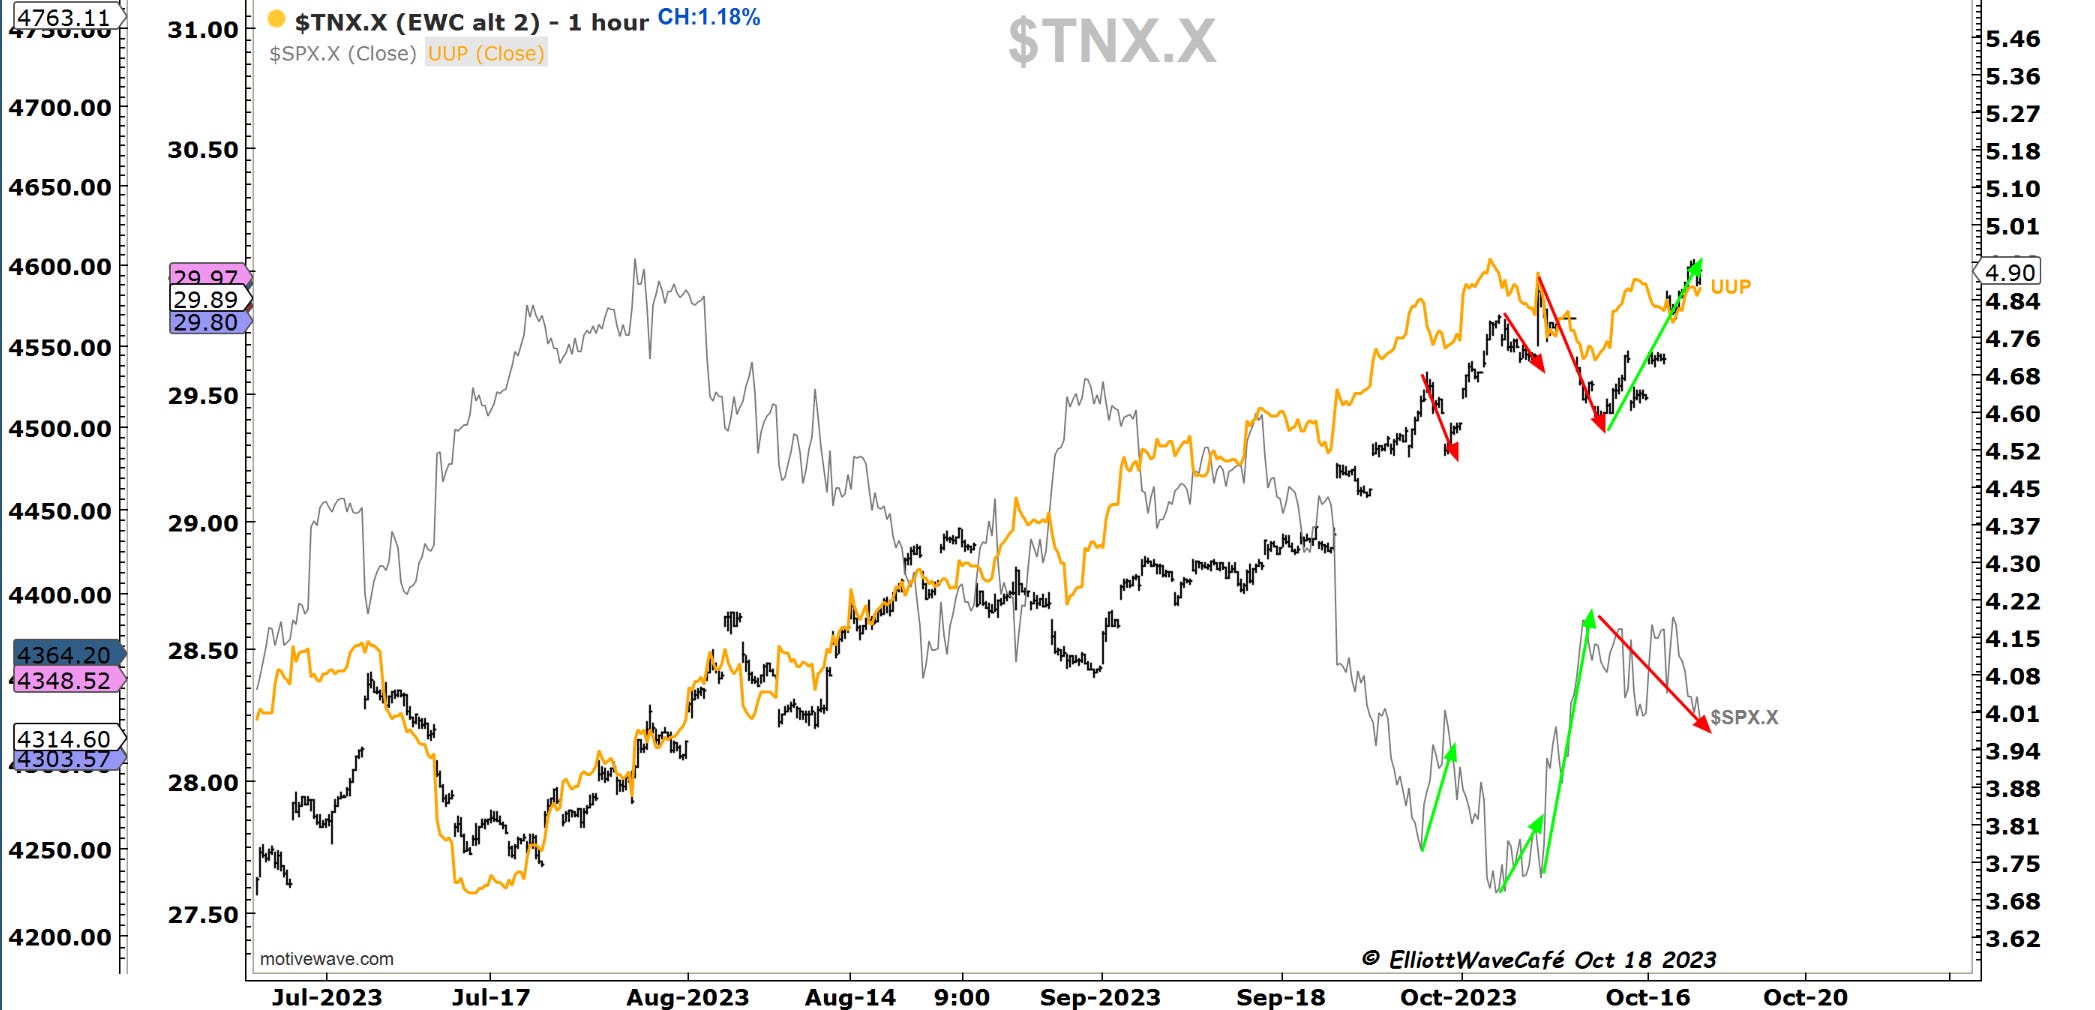
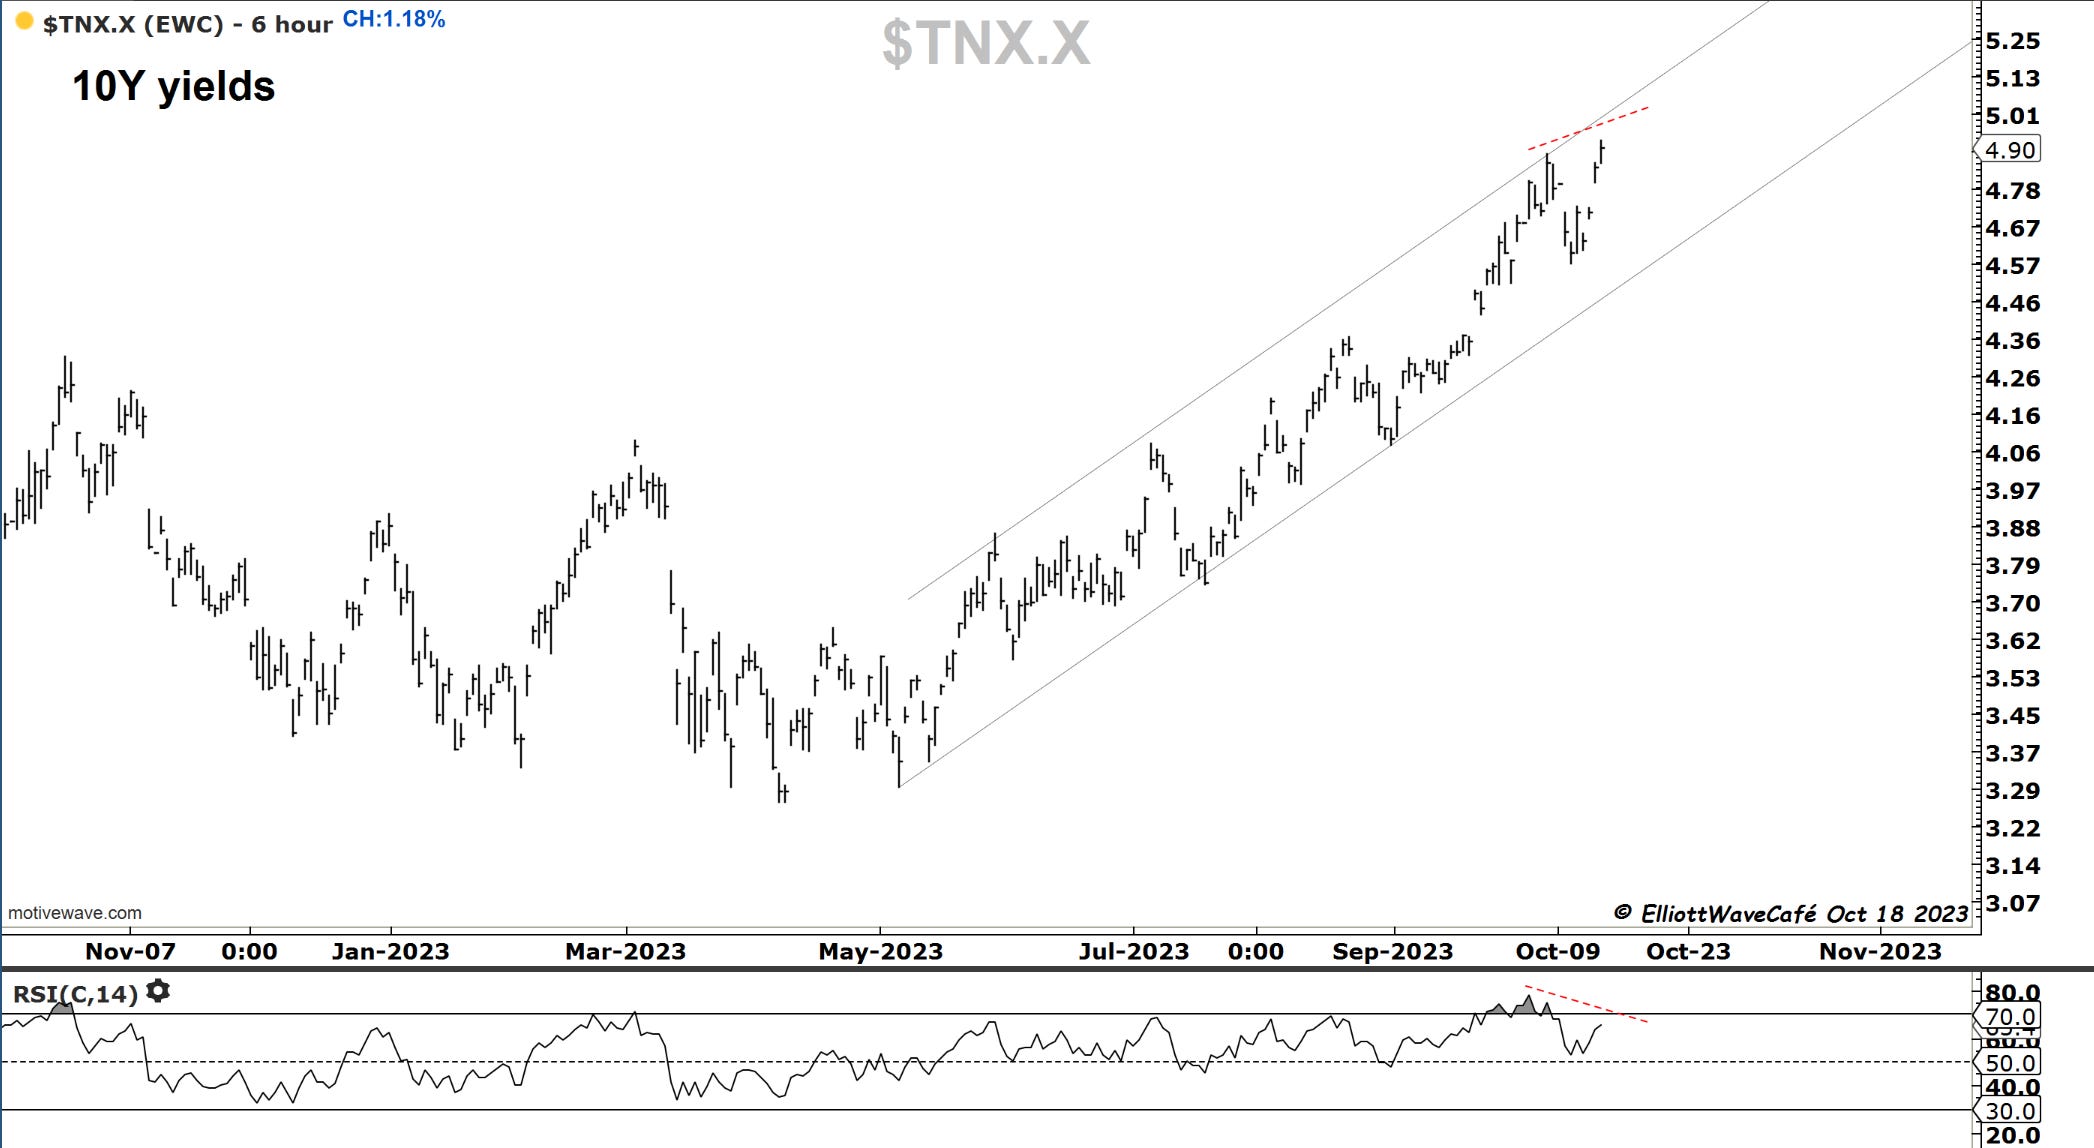
We seem to be losing the USD momentum higher, now we just need to see how yields behave near the 5% mark. The RSI and channel top might give it a pause. (2nd chart) These are early signs of topping but nothing quite concrete yet.
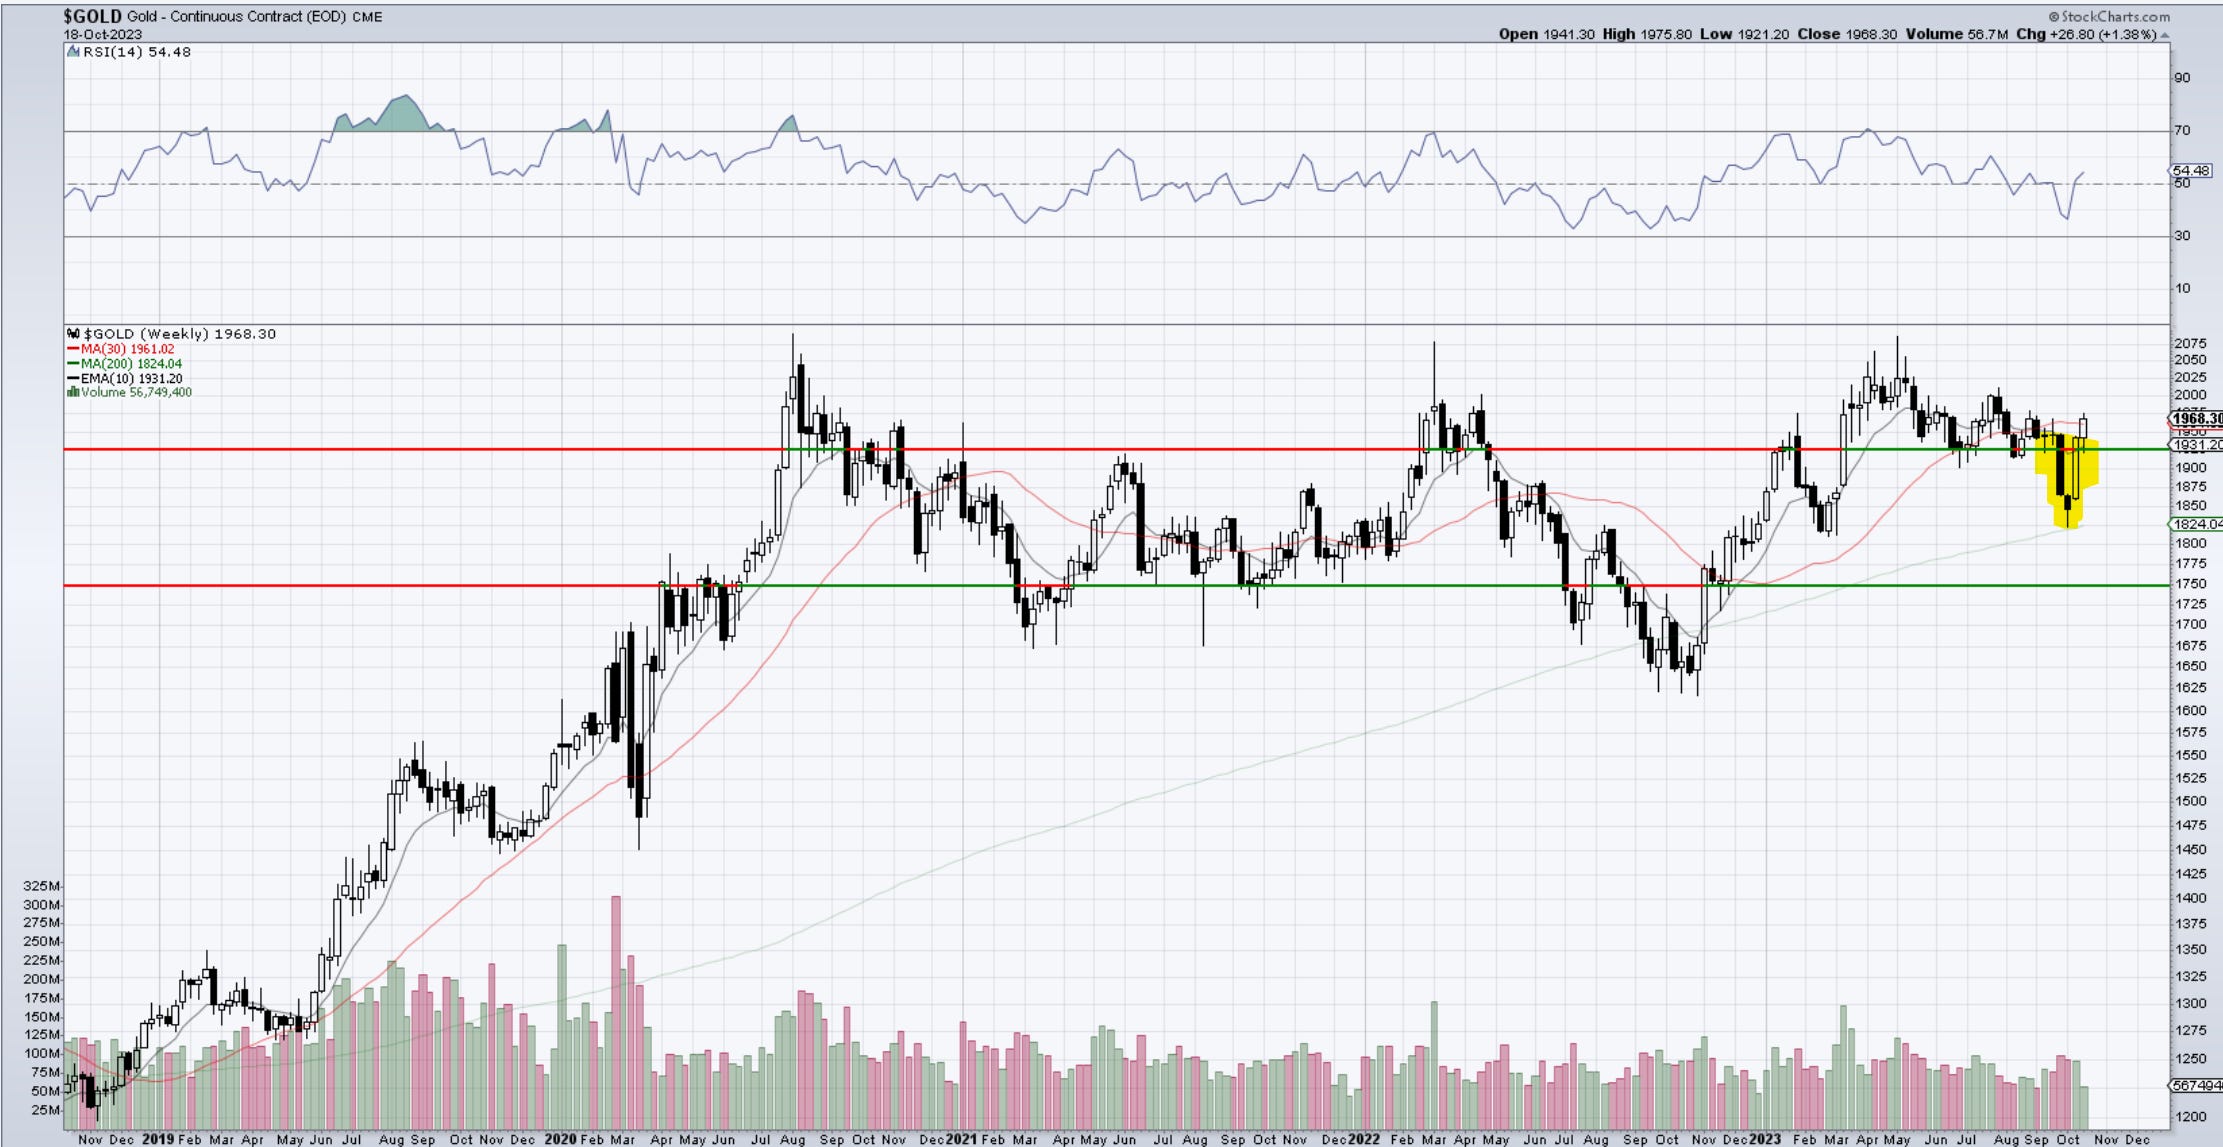
Gold
There’s got to be a message that Gold is sending here. The rally was extremely strong and pushed this wave (i) even higher. It’s ignoring yields and it’s ignoring the dollar. That weekly chart formation in the second chart is looking scary bullish.
Bitcoin
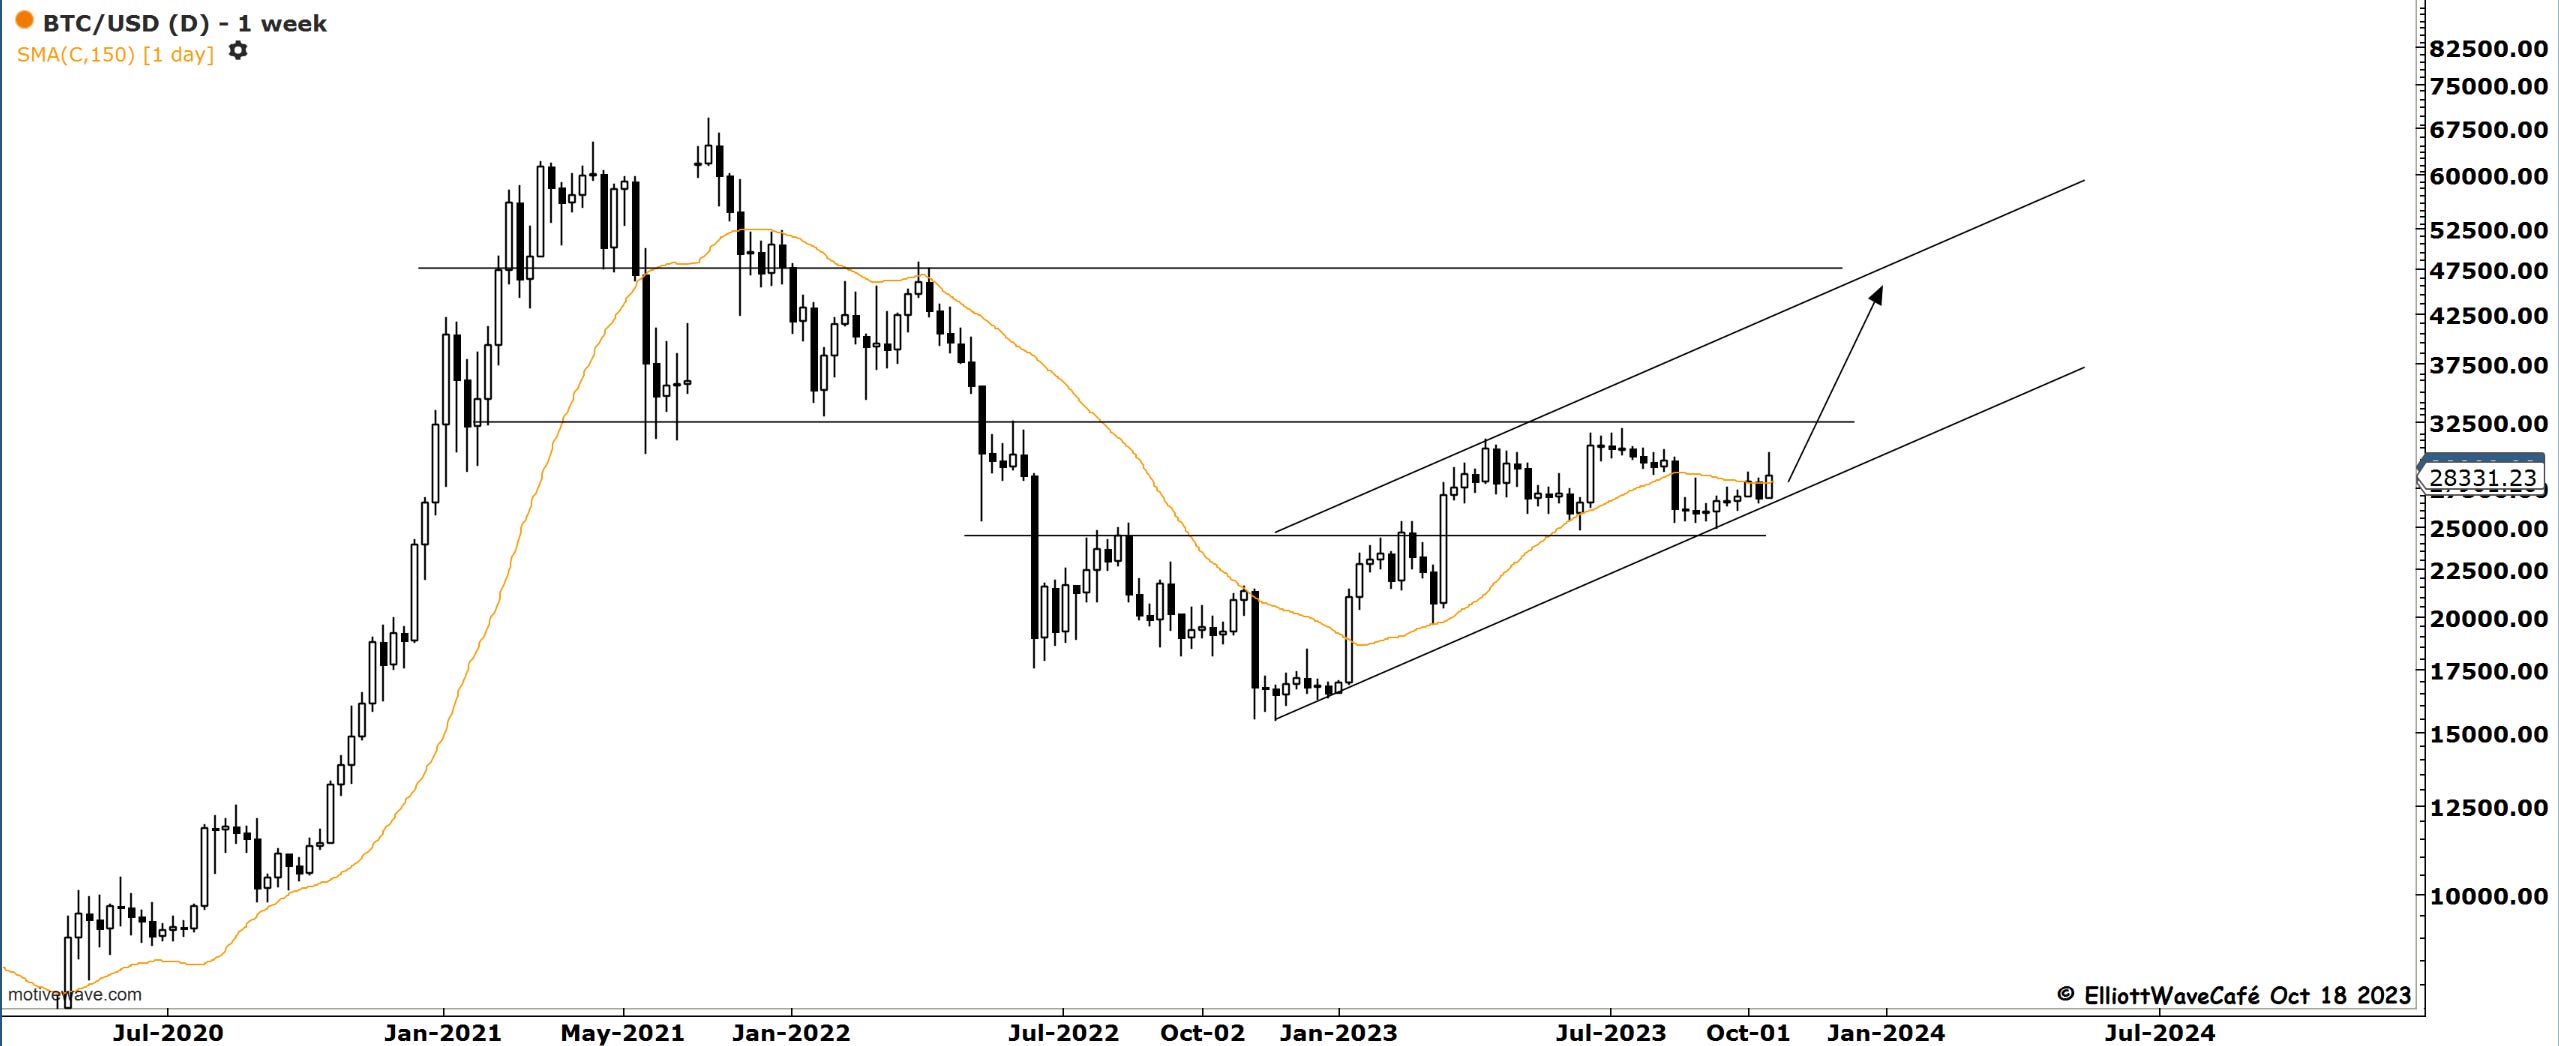
Bitcoin remains in a decent uptrending channel and if we switch to a line chart to eliminate the news spike, things look a bit cleaner. Again it’s been quite resilient on a day when equities were lower. As long as we stay above that lower boundary line, one has good reasons to remain bullish. It’s a tough tradable market right here and now, but overall we behave fairly well and we’re above all key moving averages.
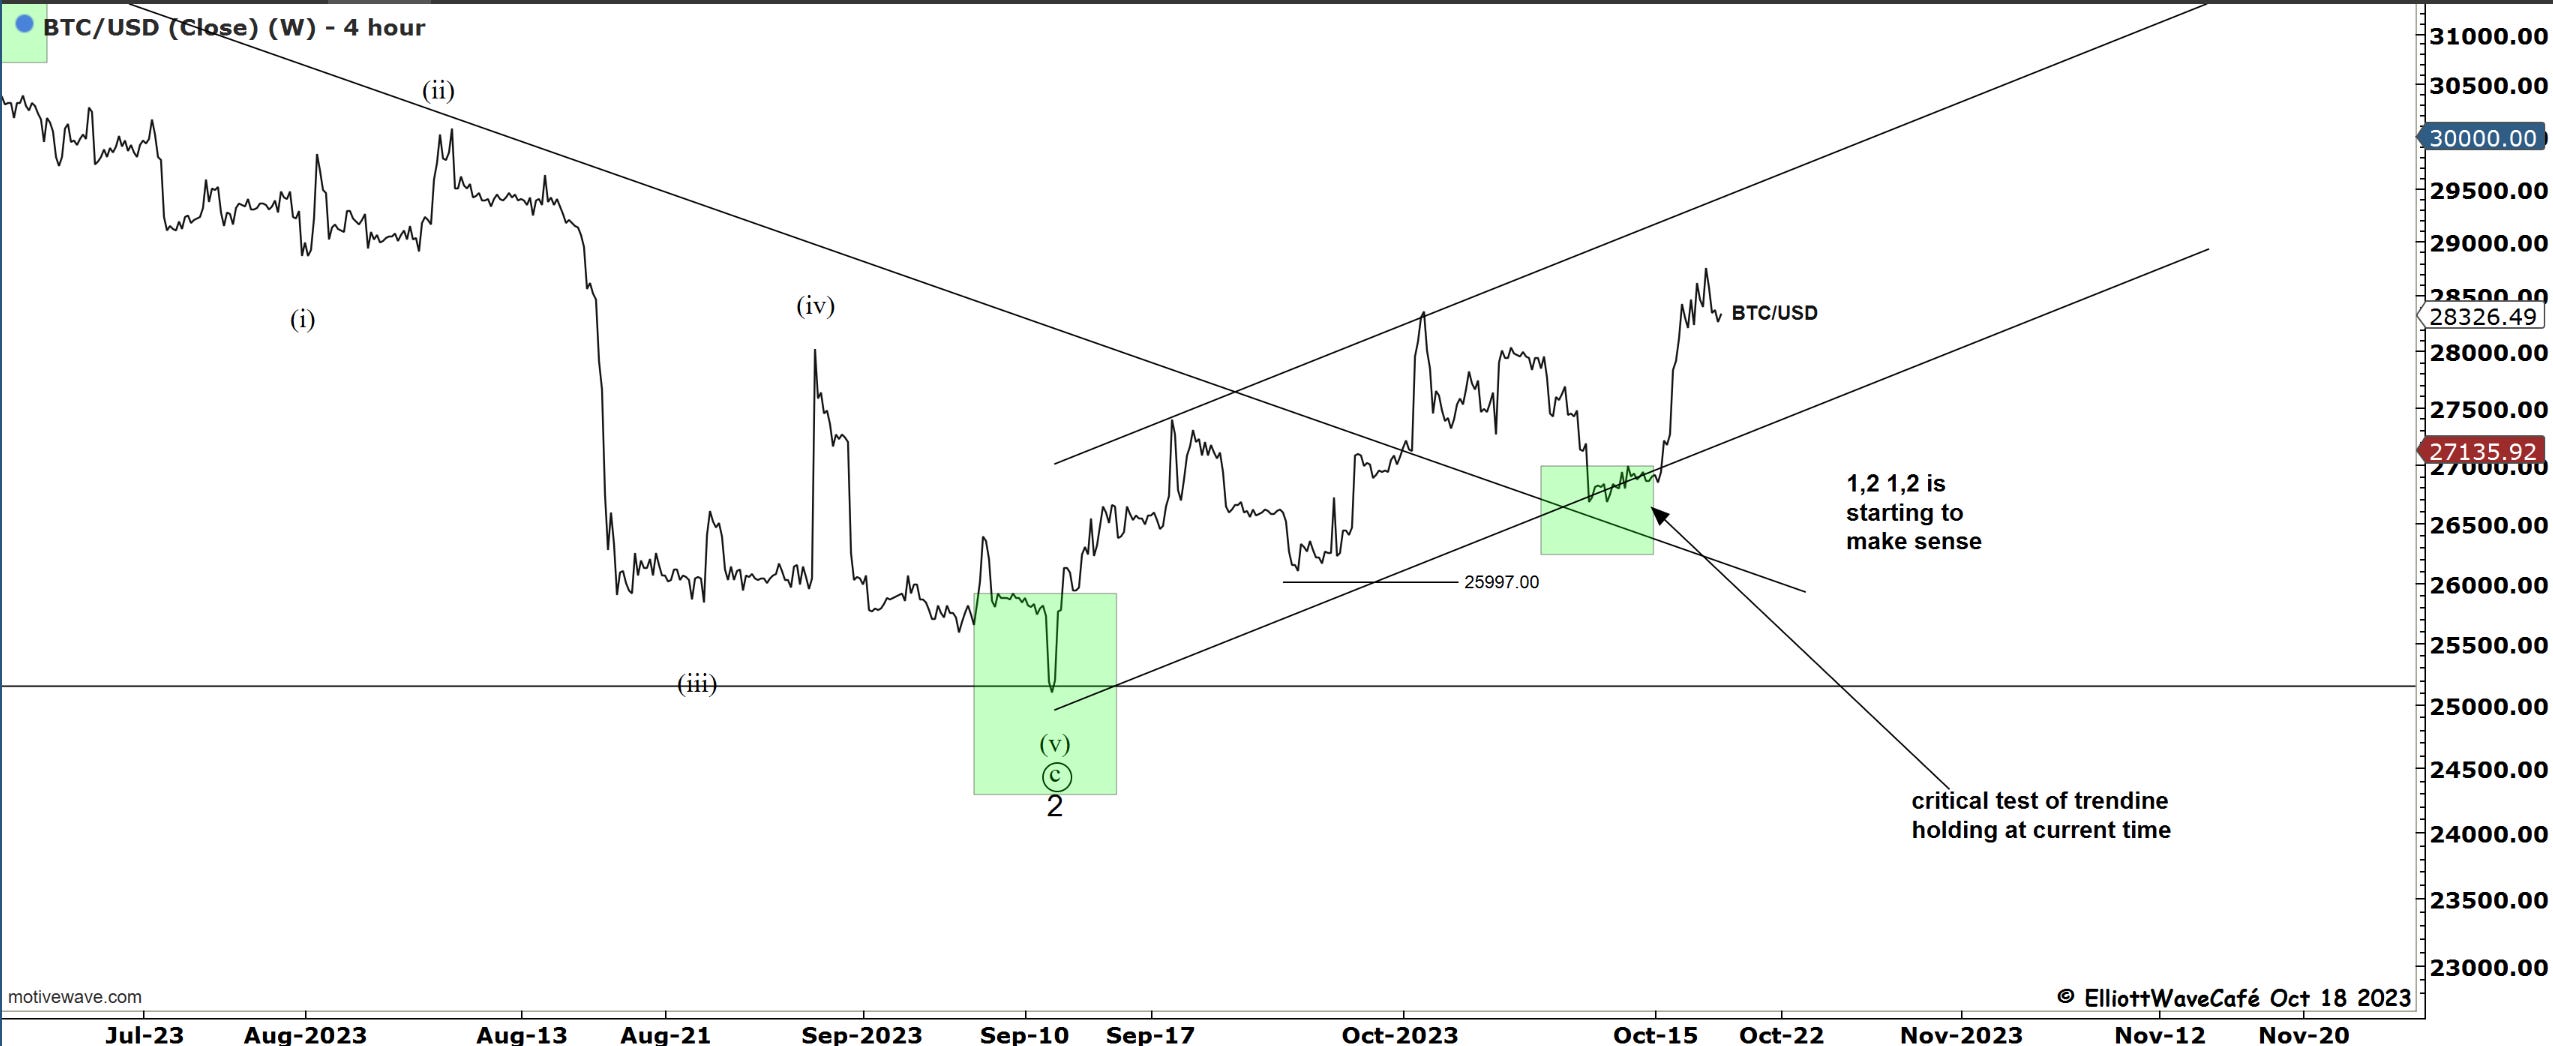
A basic upward channel can target 47,500 by mid-next year. If Gold breaks out why wouldn’t Bitcoin? If we close above 31k on a weekly basis, I think its Game On.
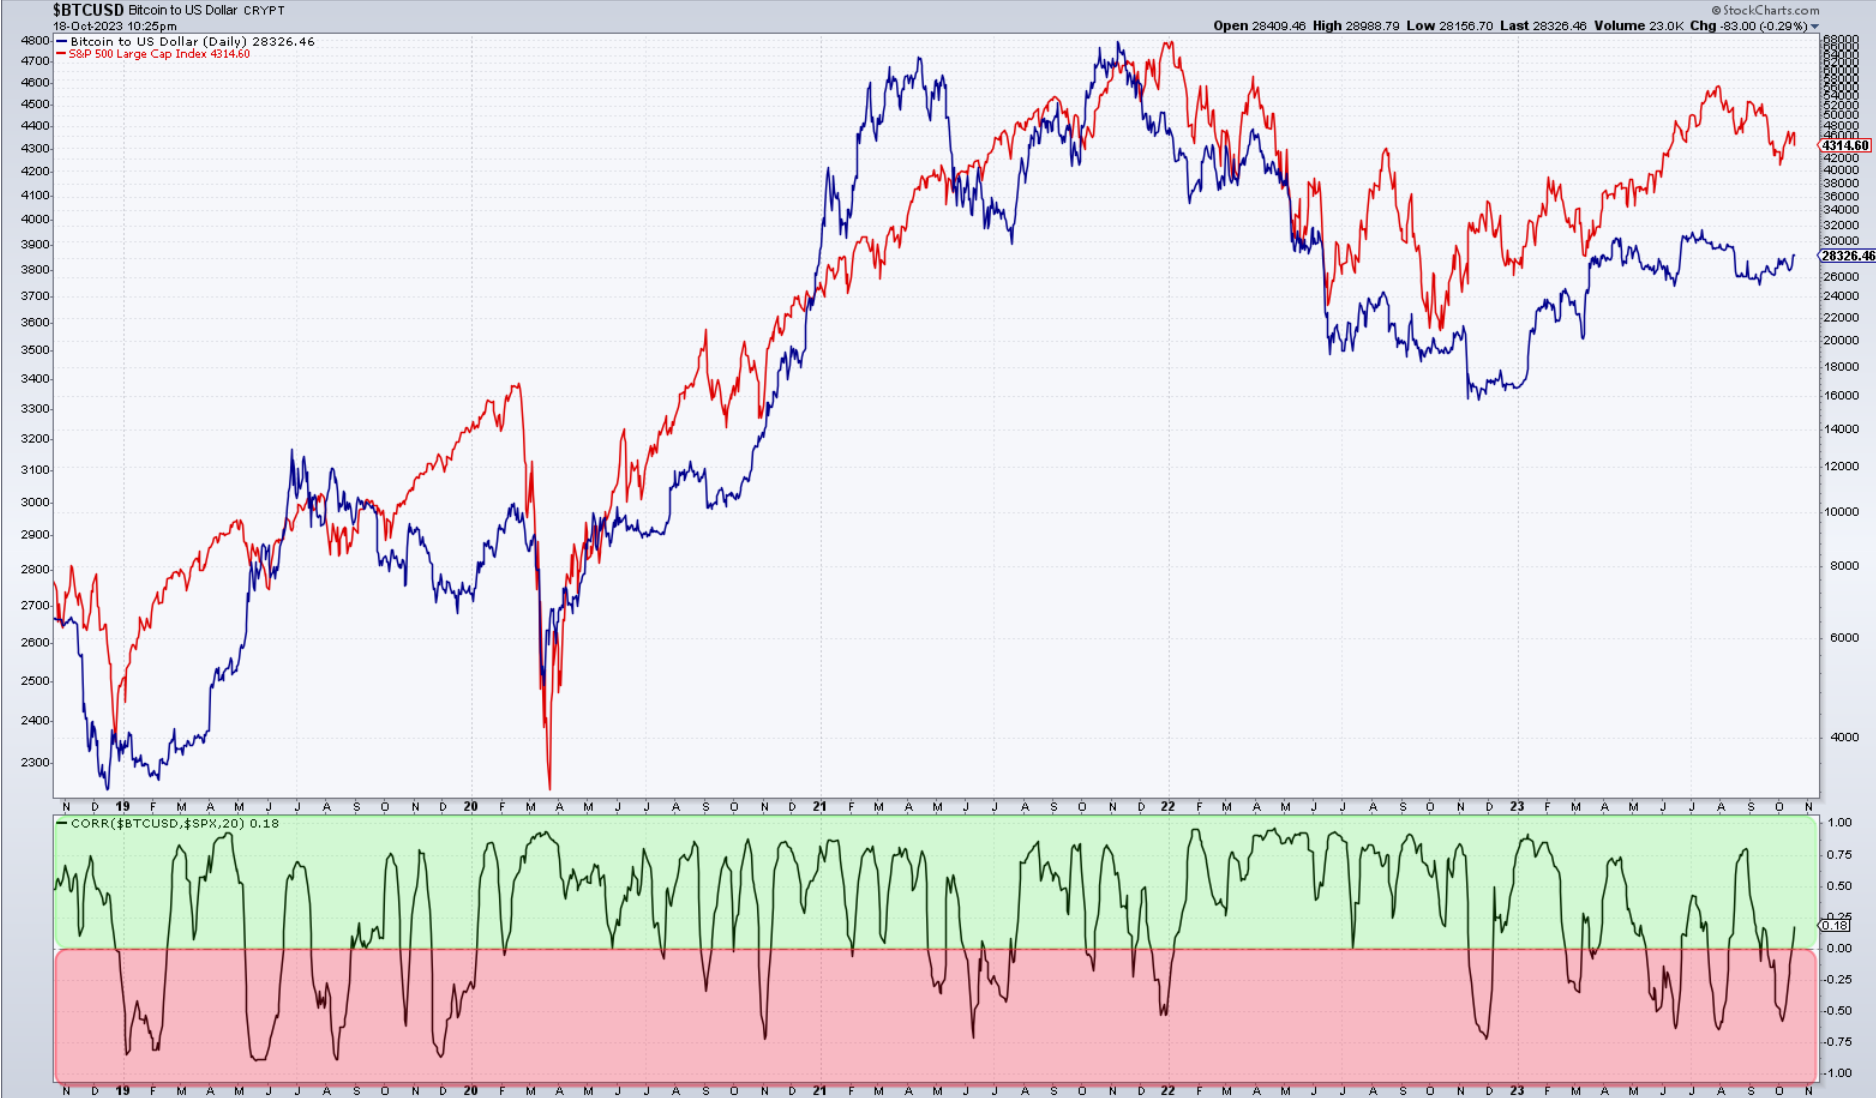
Here is the correlation with the SP500 as a risk proxy. Mostly in the green with slight areas of inverse correlation.
Daily video coming up next,
See you tomorrow- trade well,
Cris
email: ewcafe@pm.me