
The Daily Drip
Core markets charts updates and commentary
Note: The counts on the right edge are real-time, and they are prone to adjustments as price action develops. Elliott Wave has a fluid approach, is evidence-based, and requires constant monitoring of certain thresholds.
In the counts below, this (( )) = circle on chart
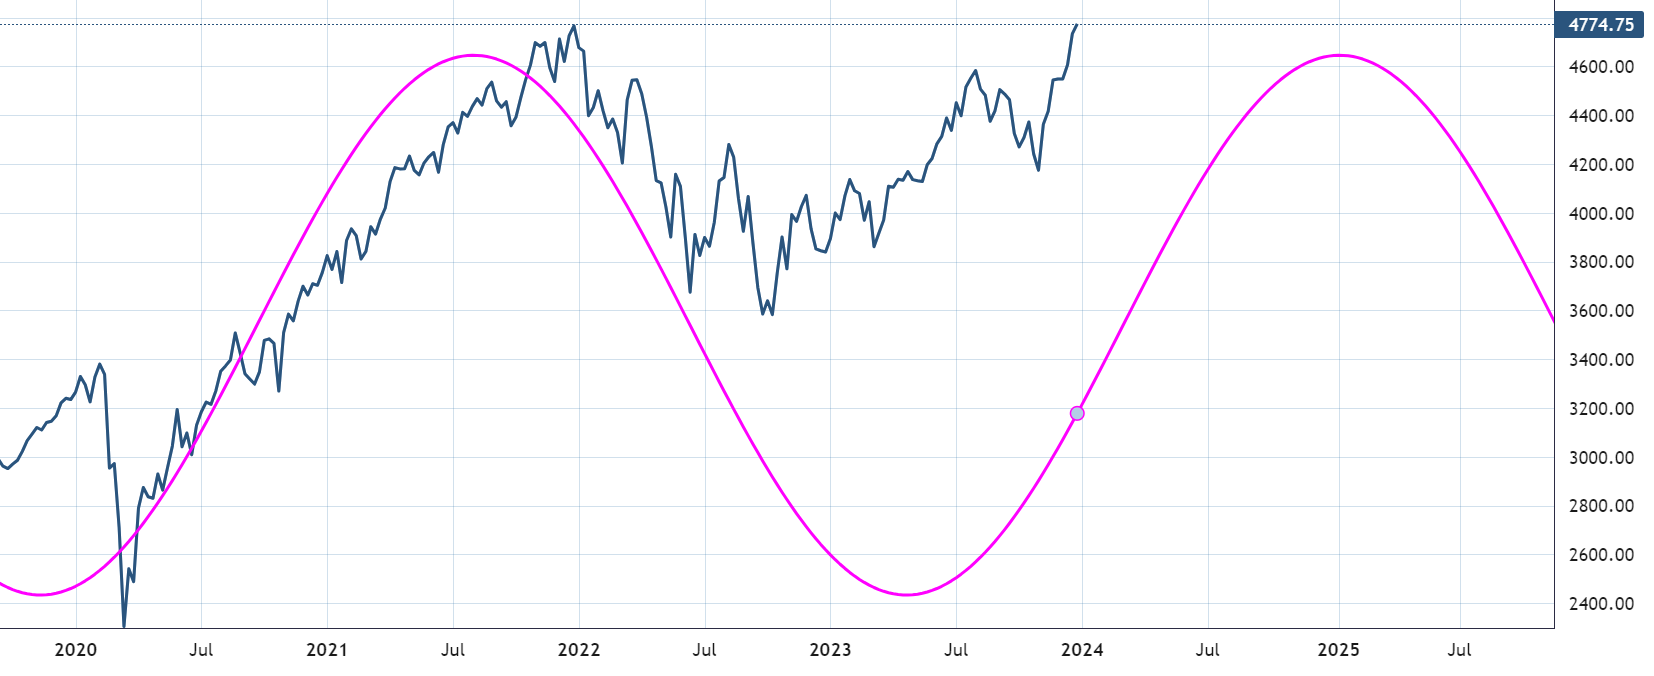
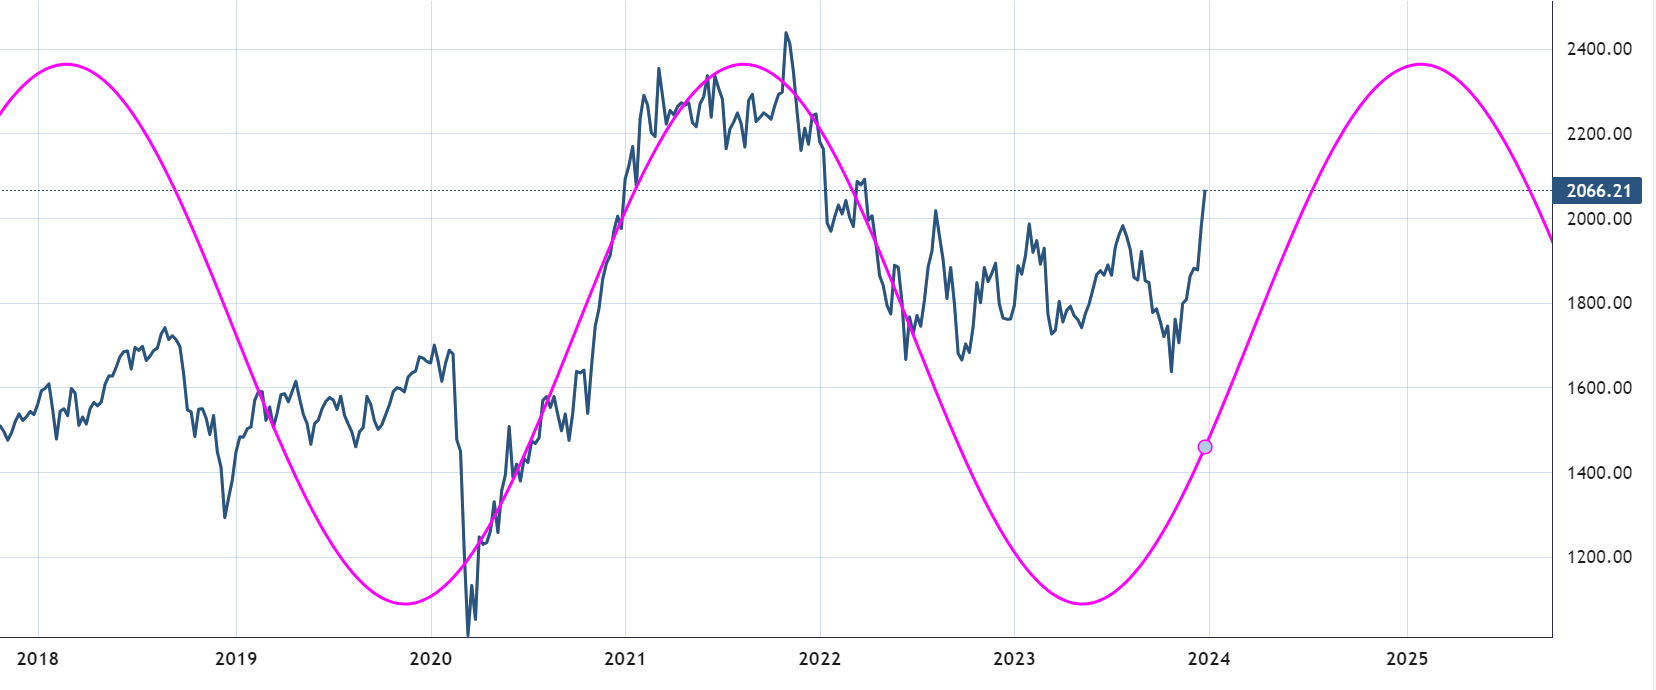
SP500
Since we’re in the final days of the year, let’s take a look at a few longer-term charts and cycles. I will provide commentary in tonight’s video.
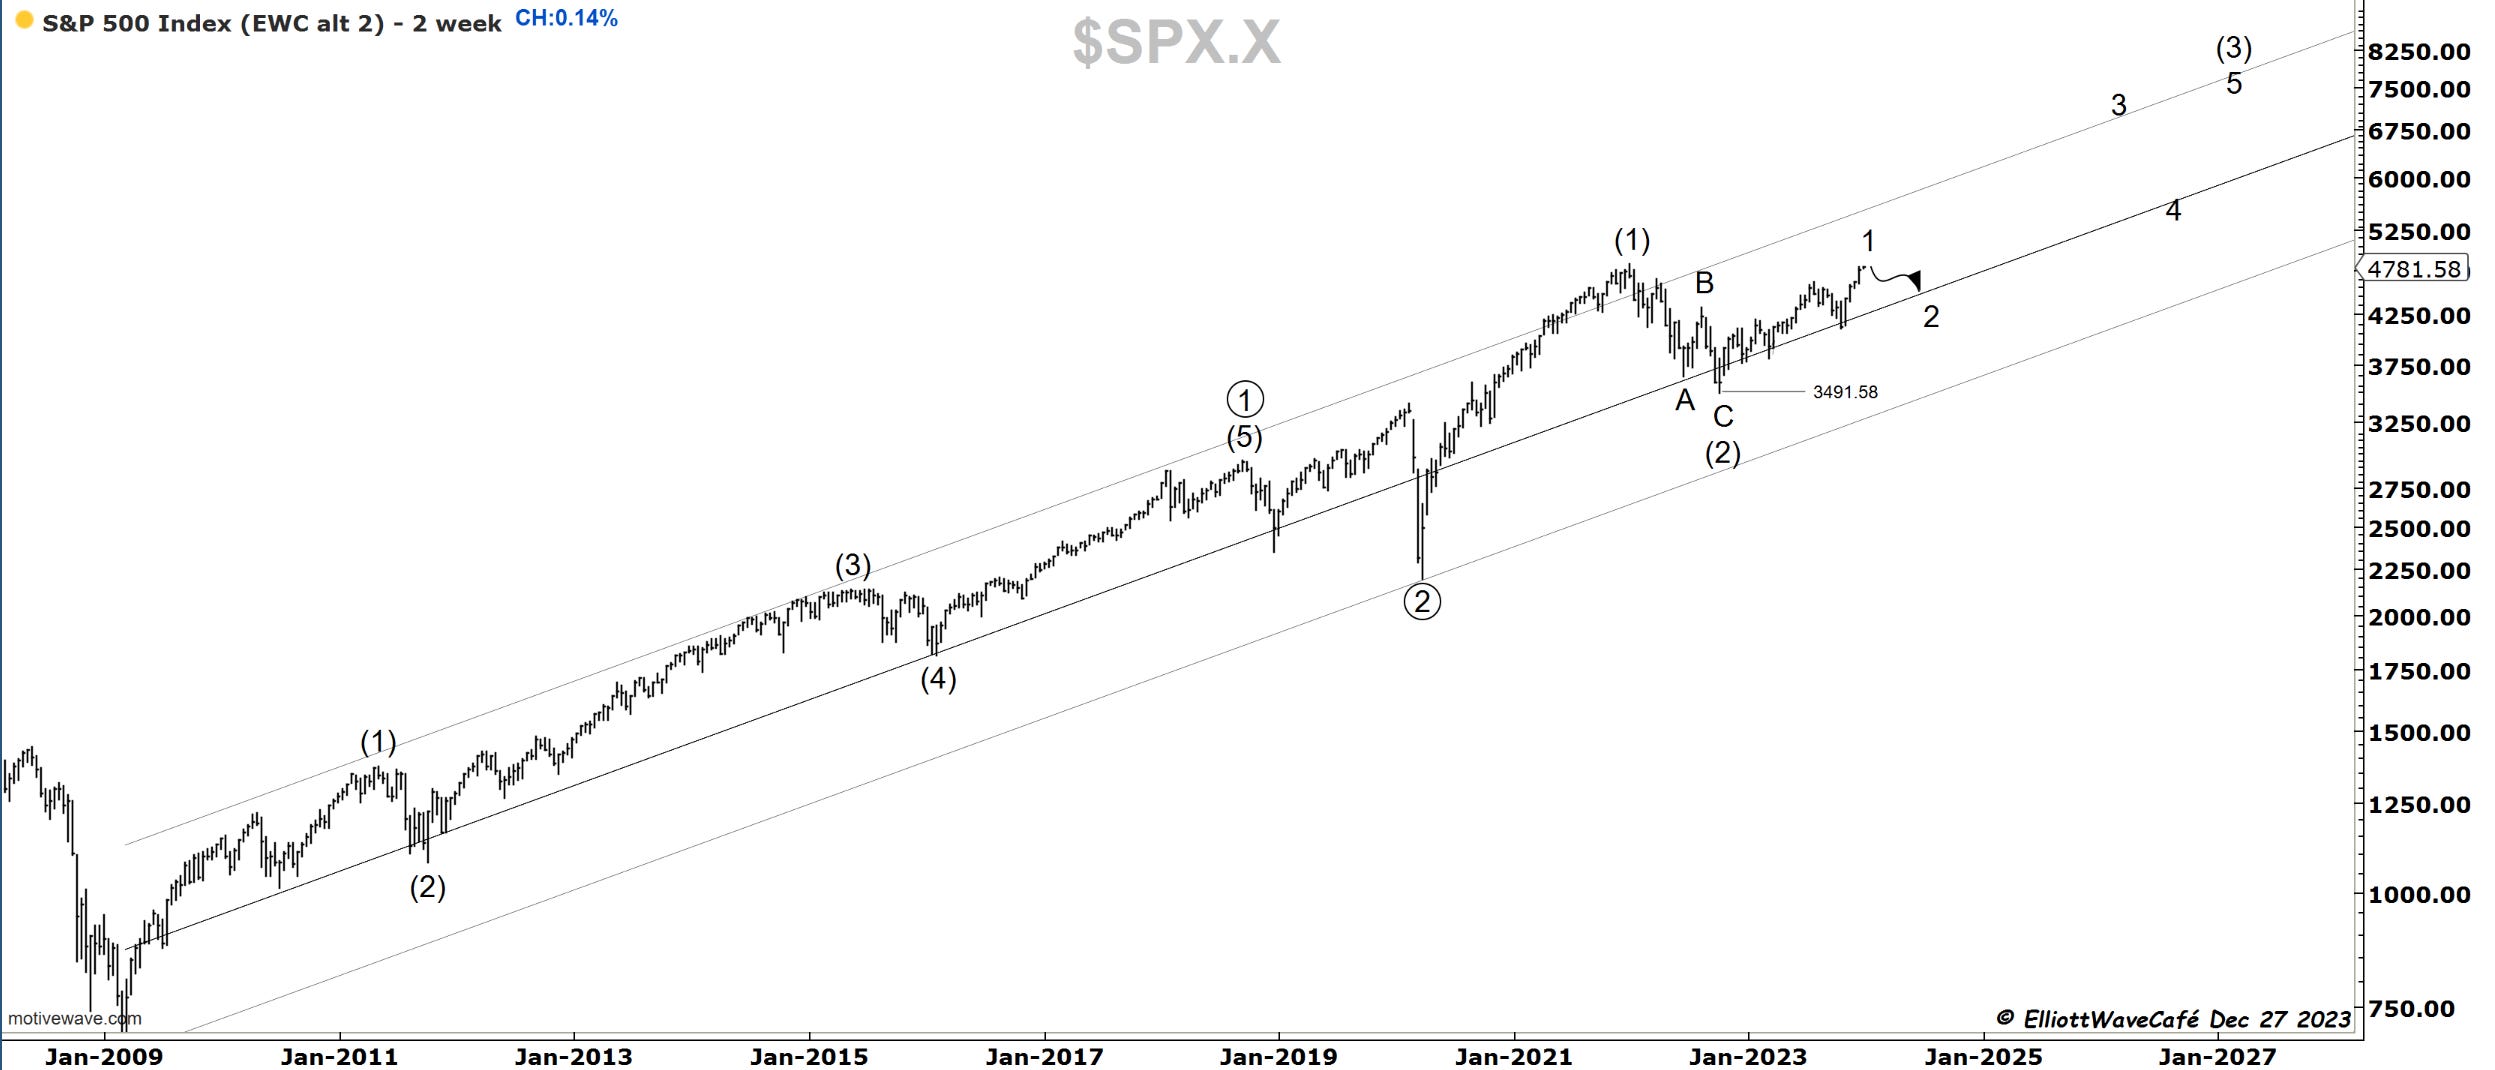
The bullish dominant 180-week cycle should continue until 2025.
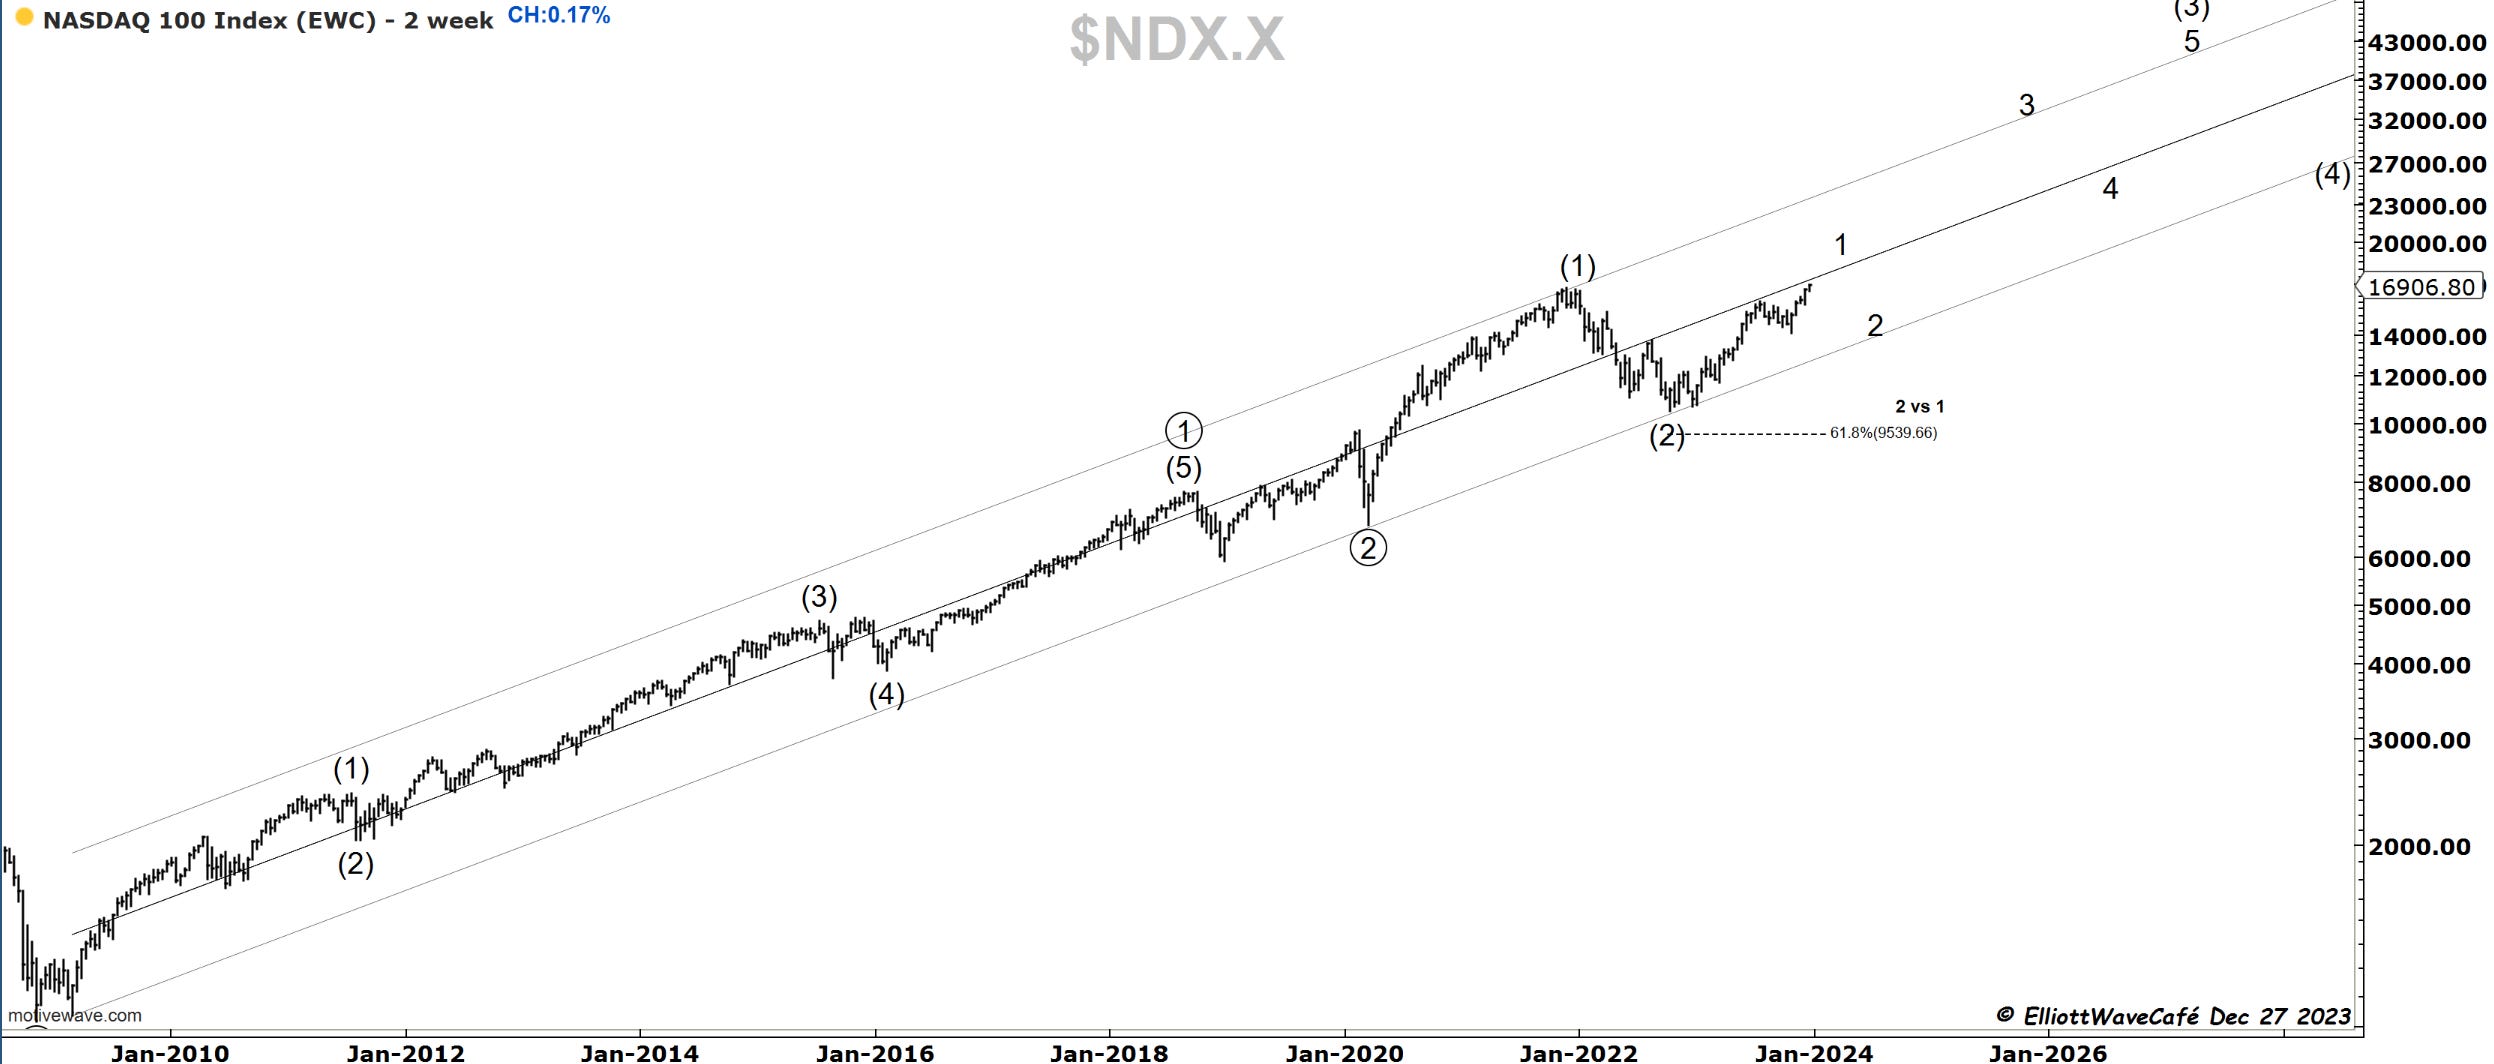
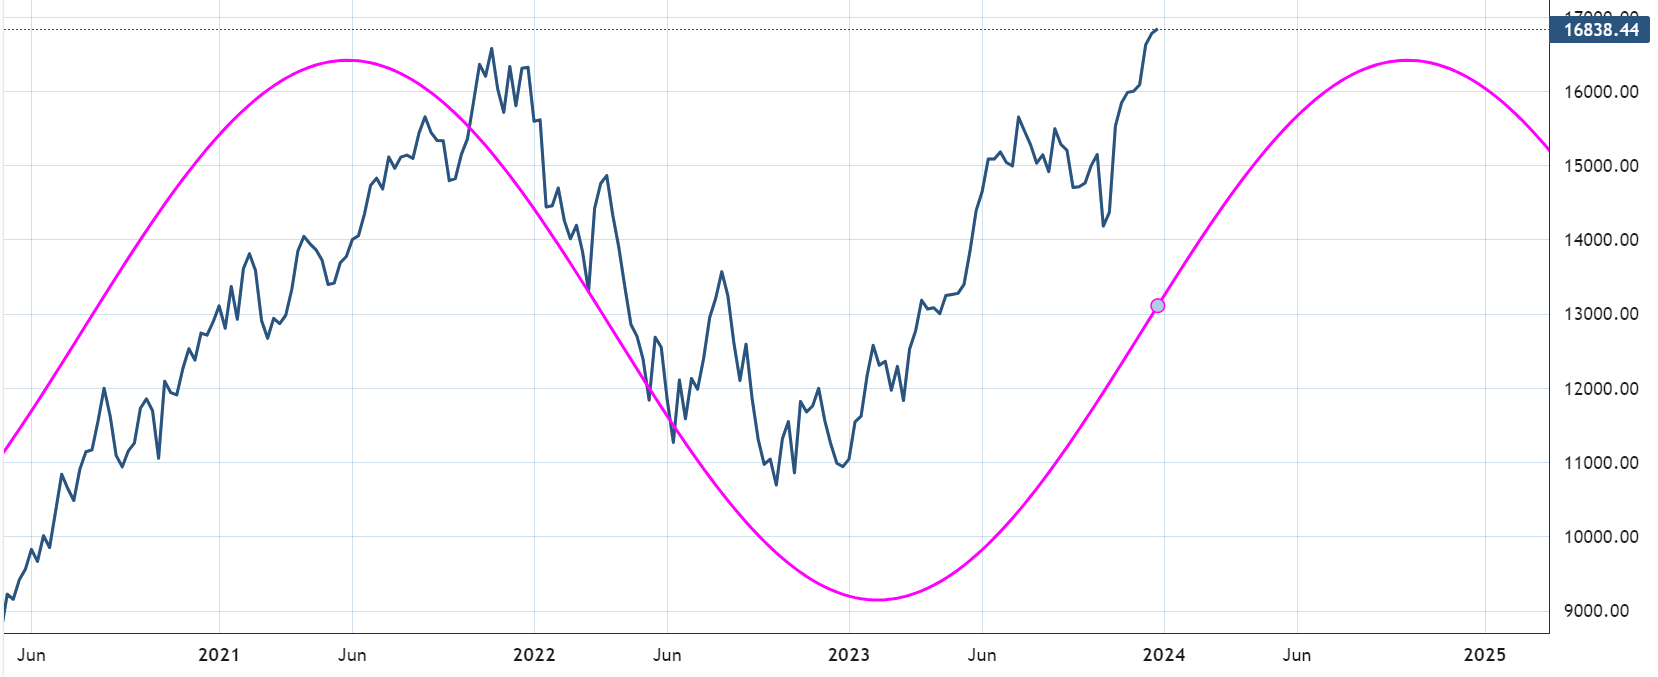
Nasdaq100
RUSSELL 2000

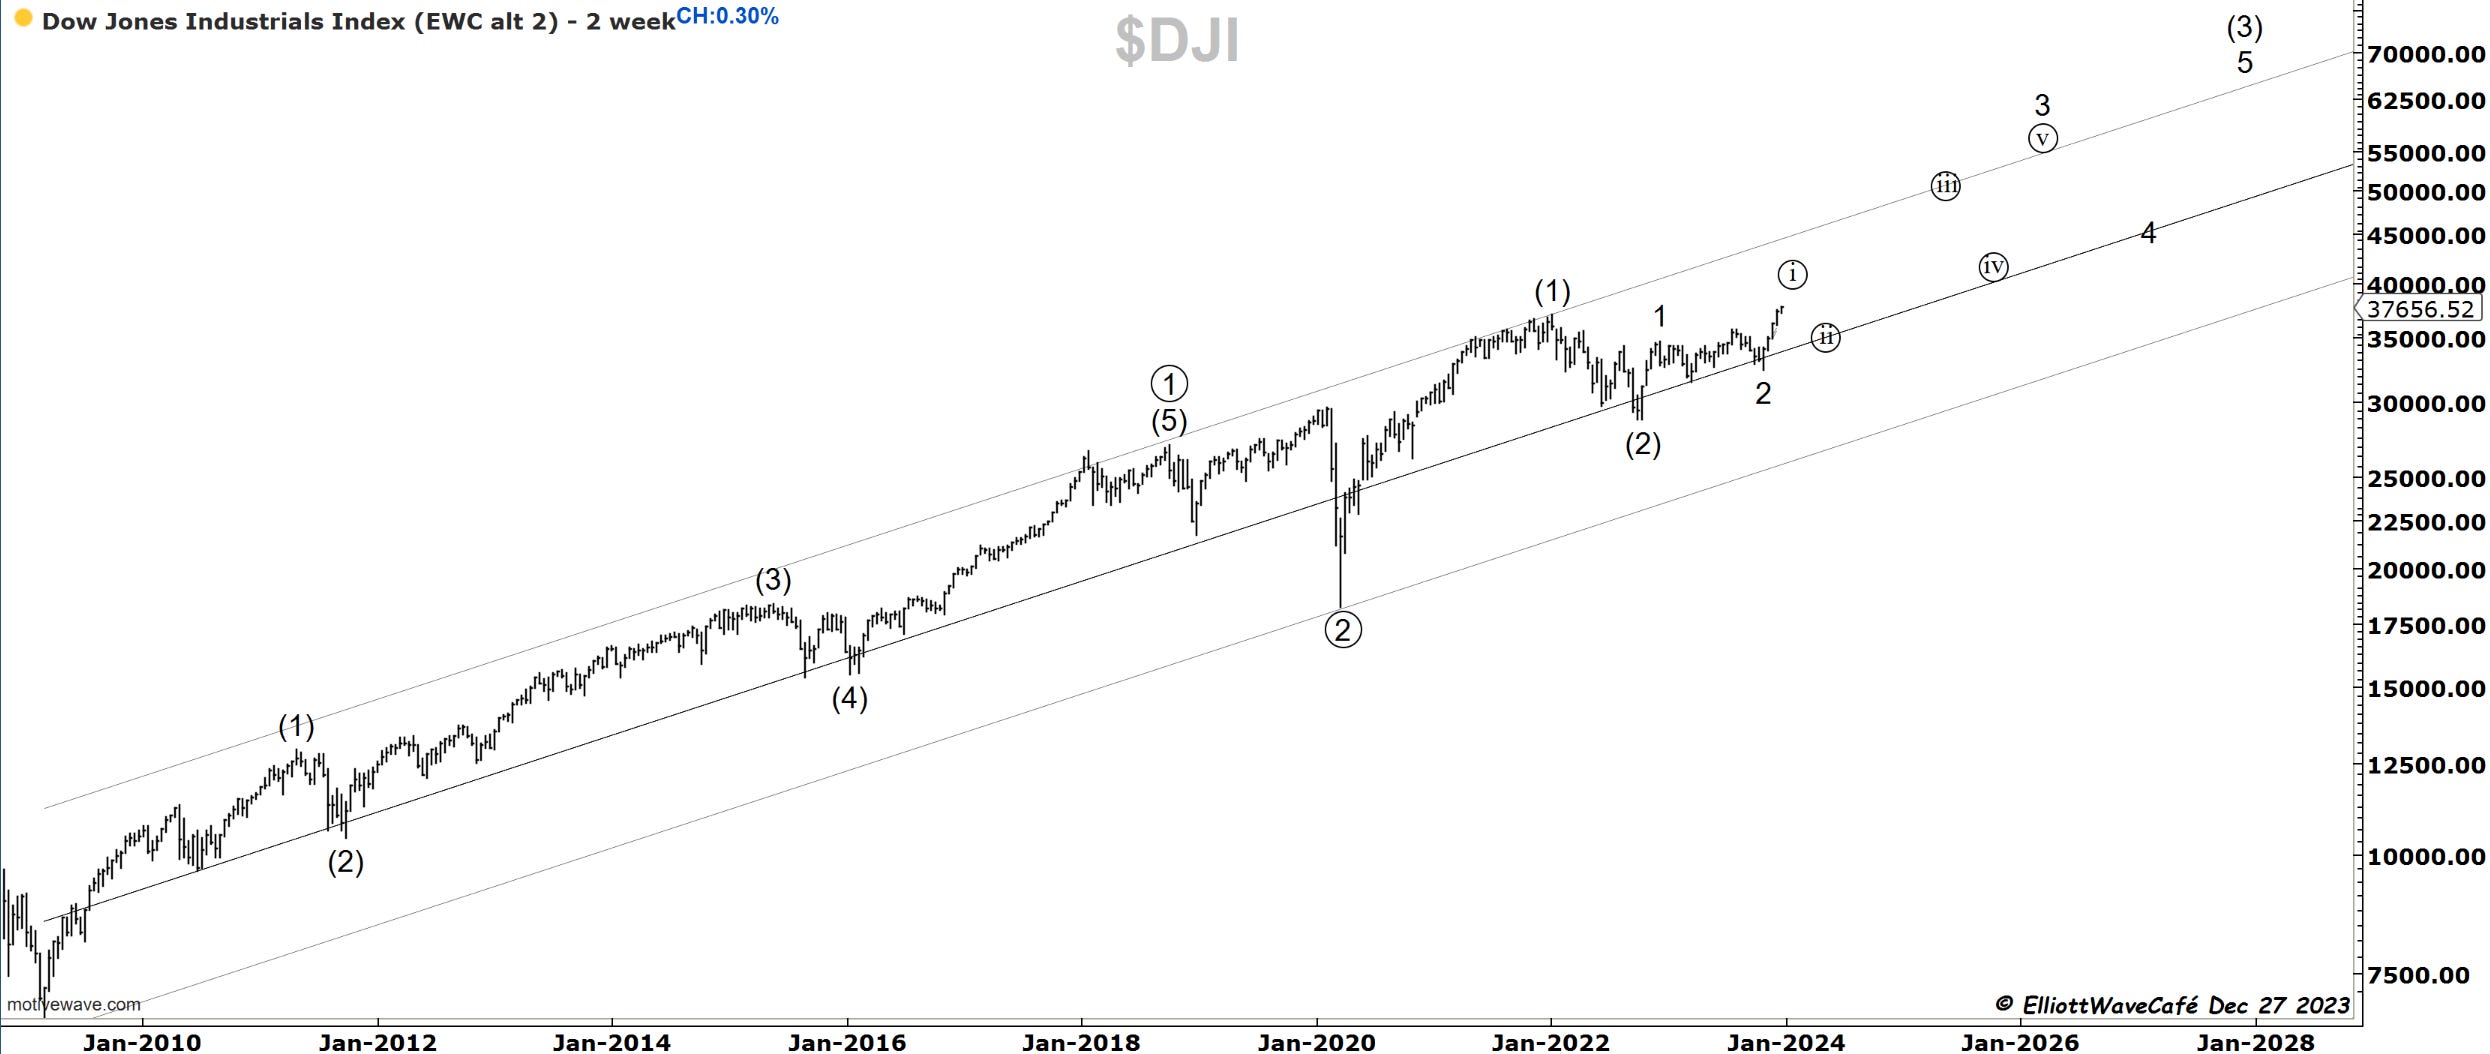
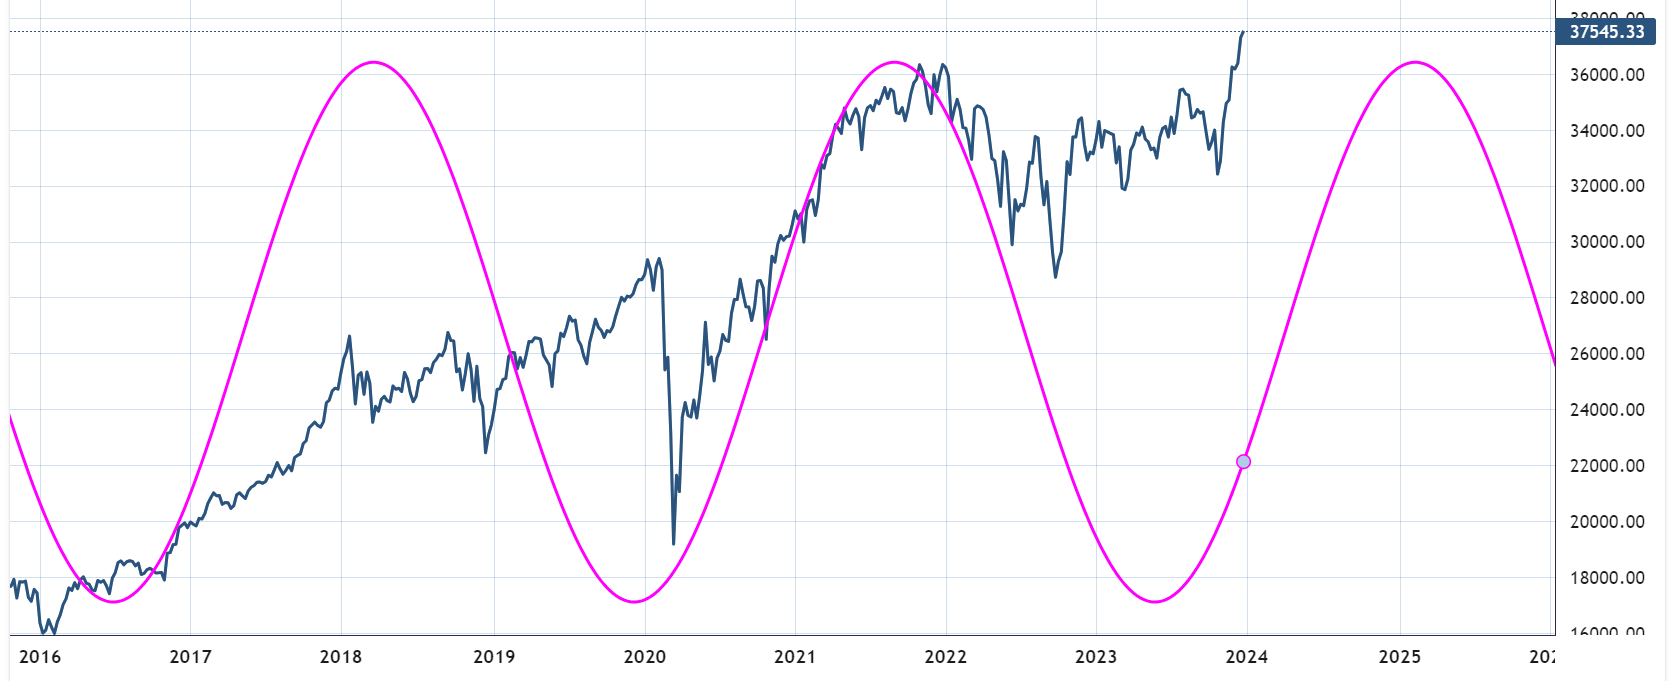
Dow30
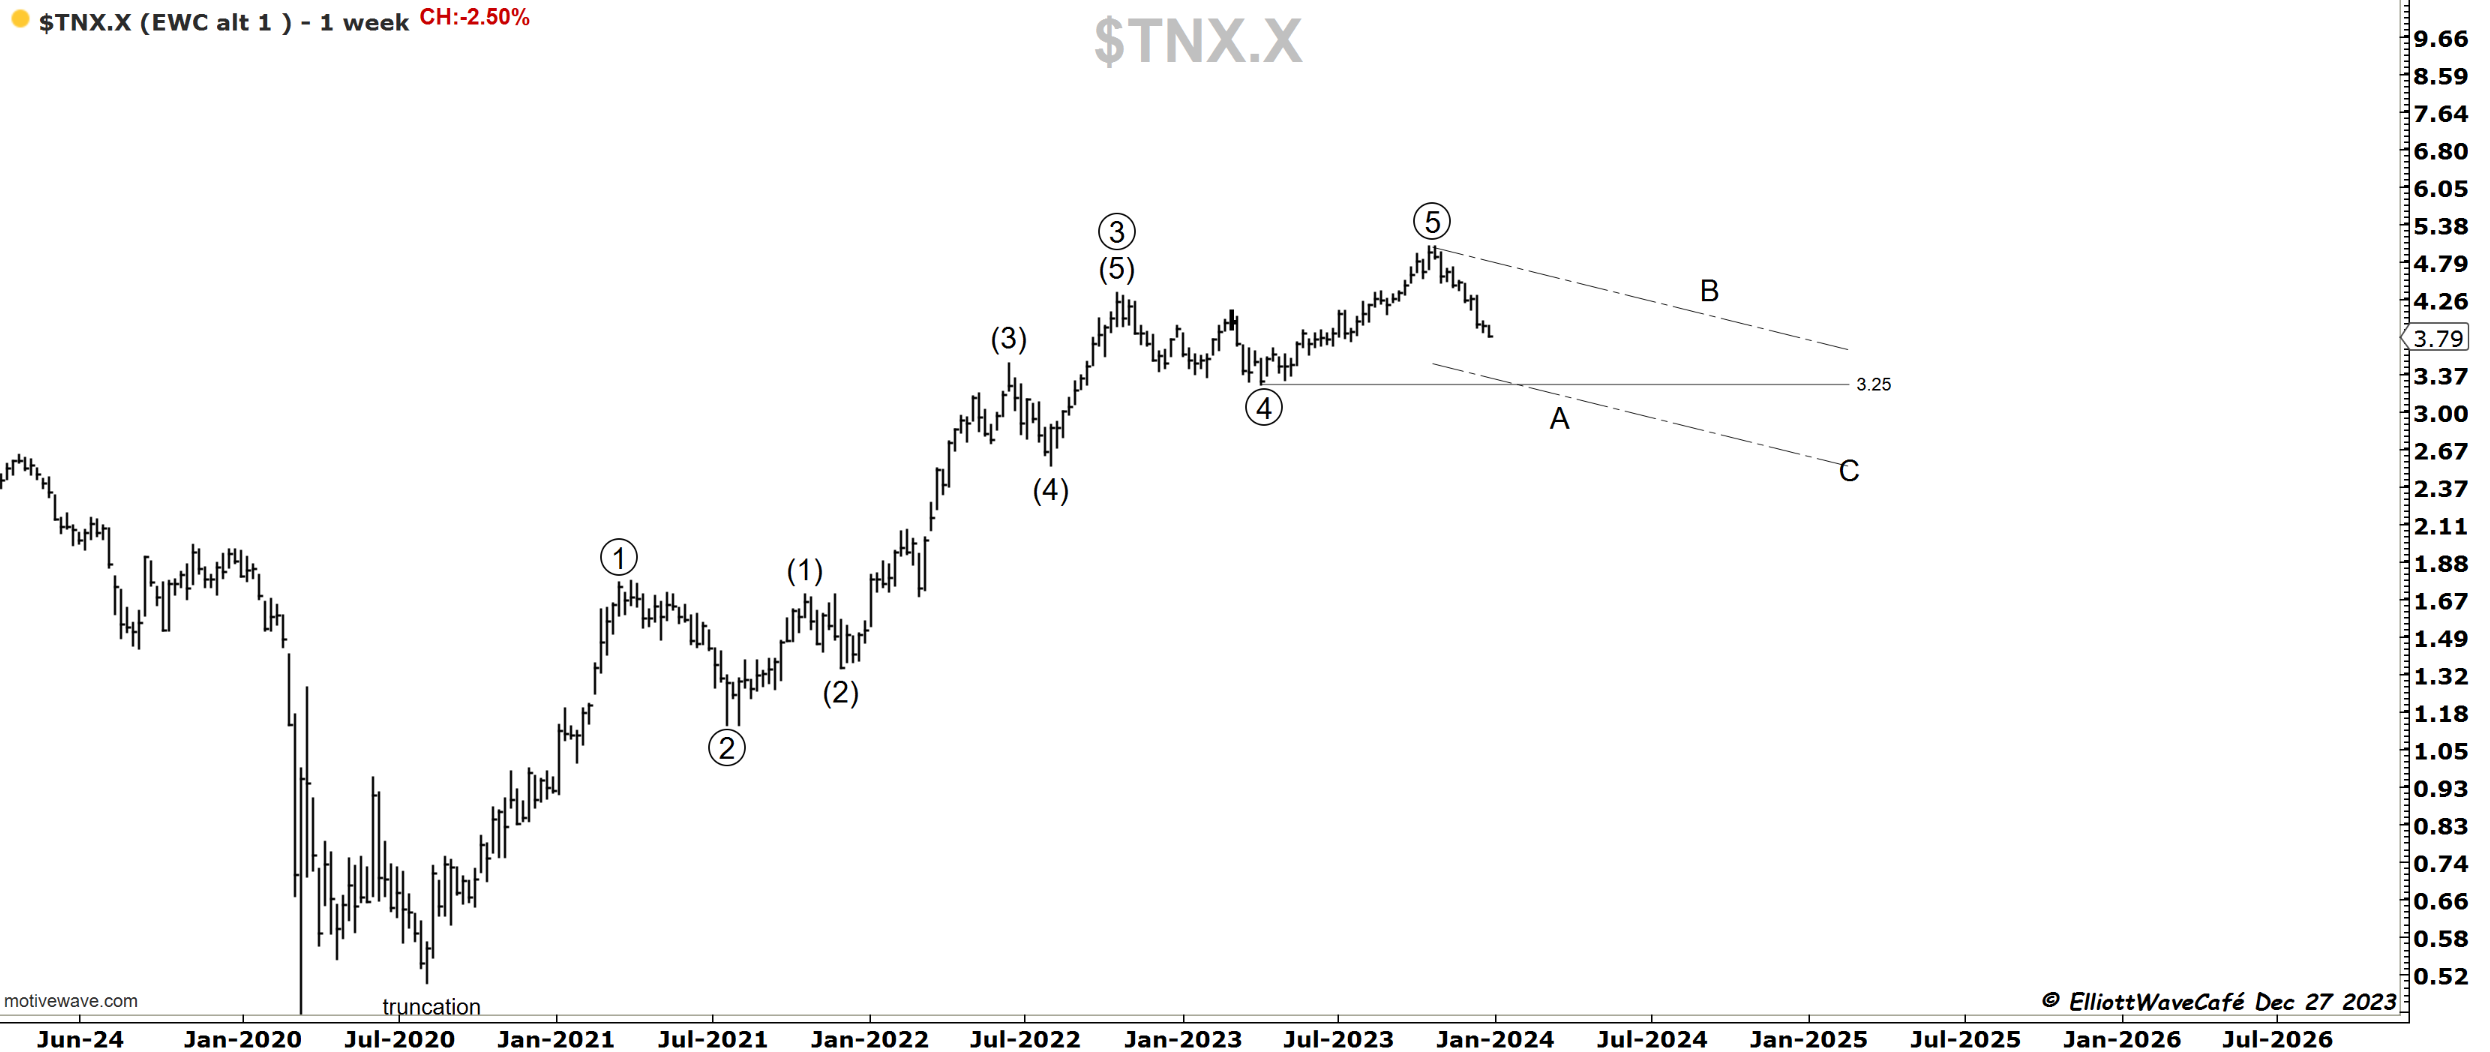
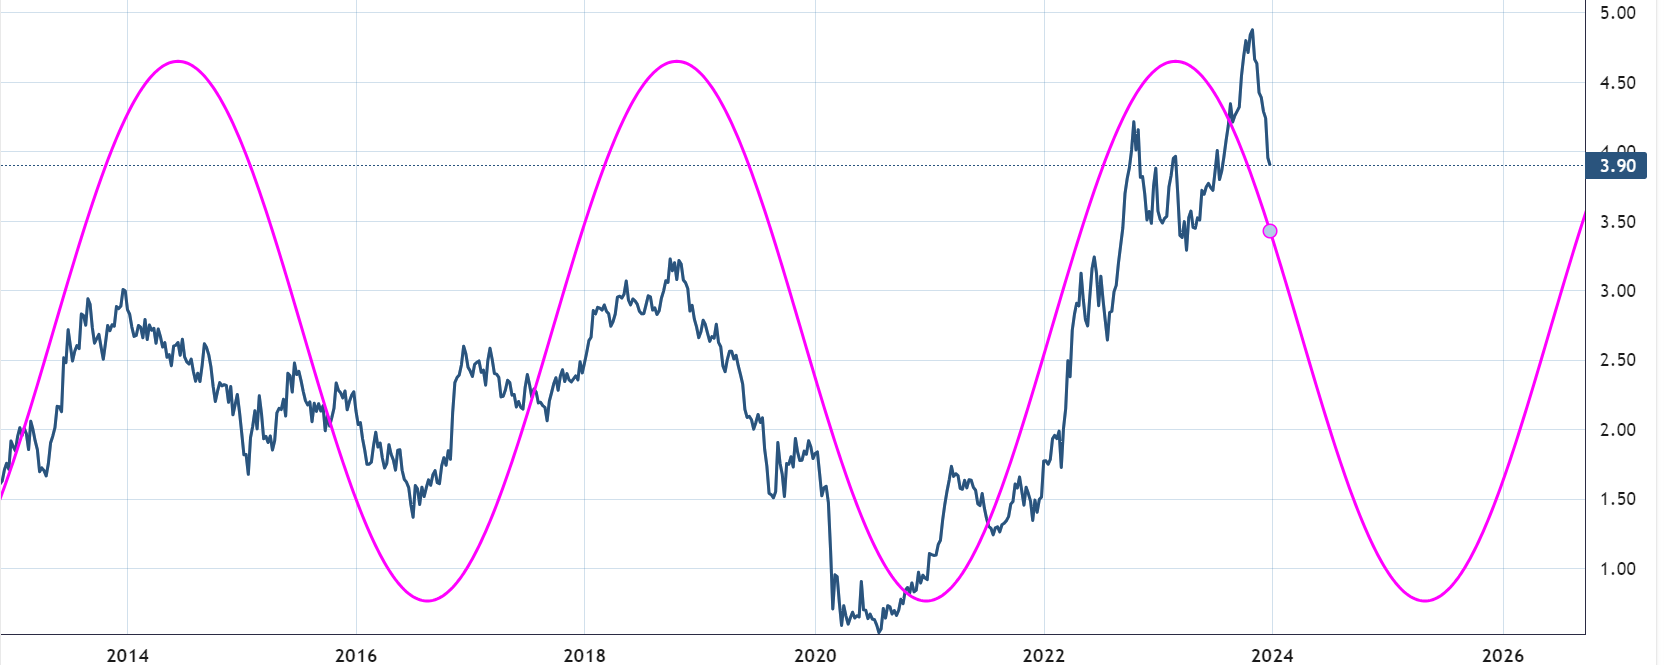
US Dollar and Yields
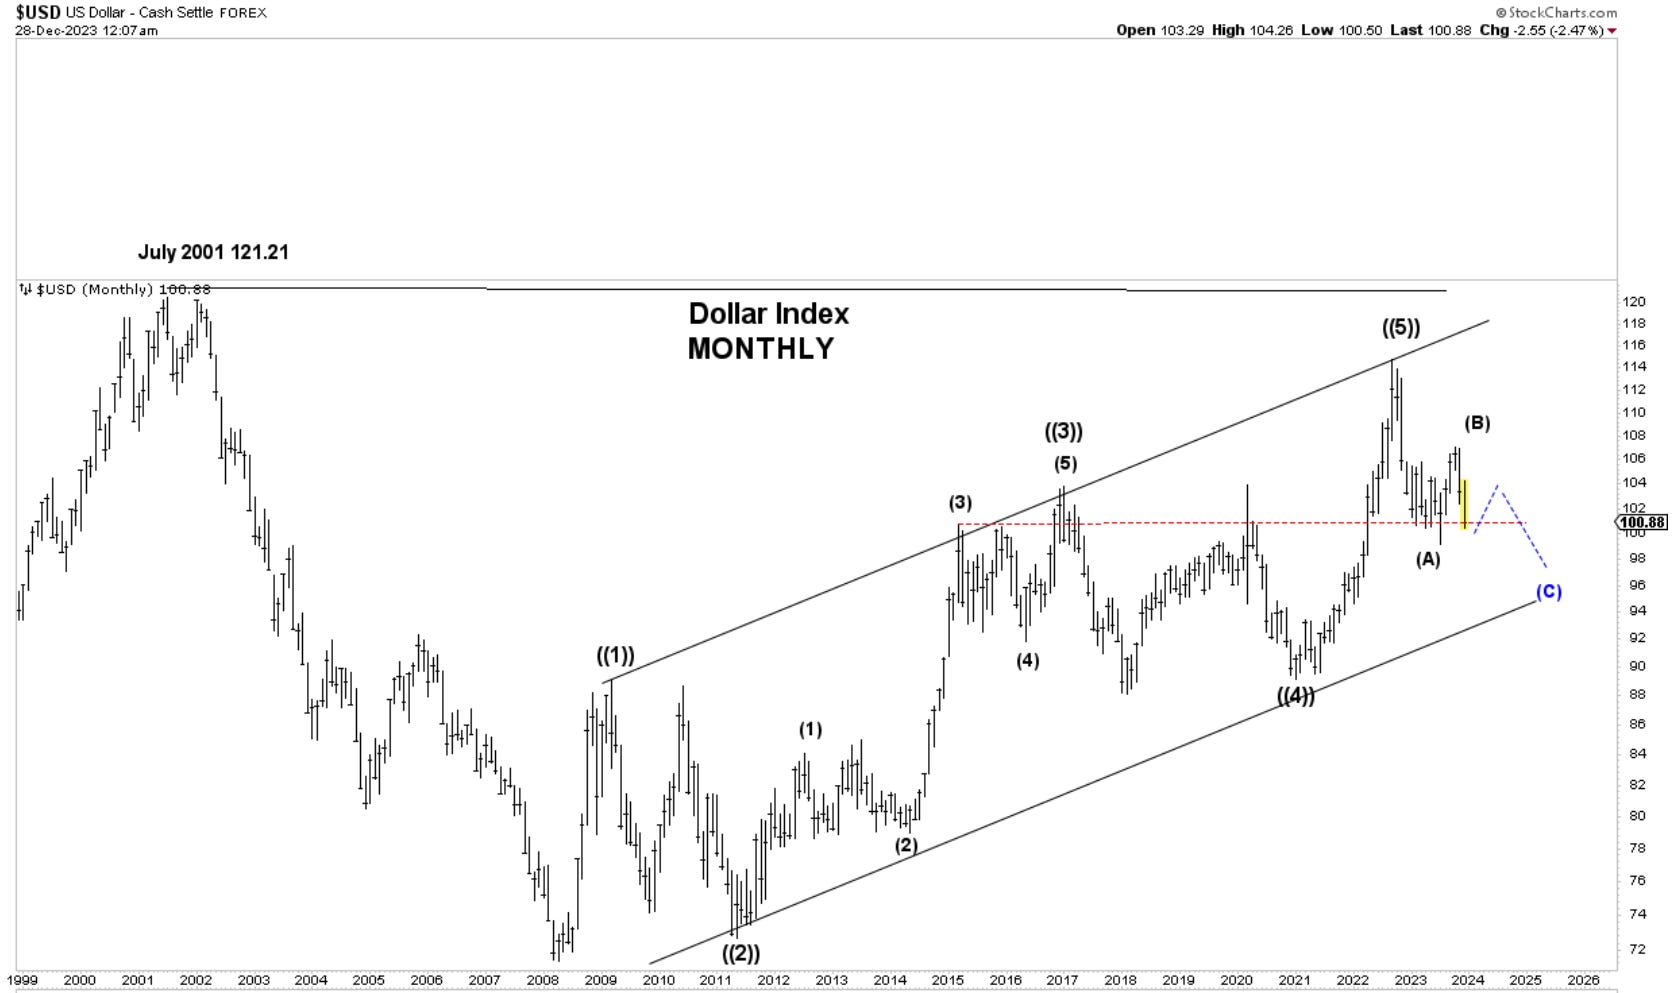
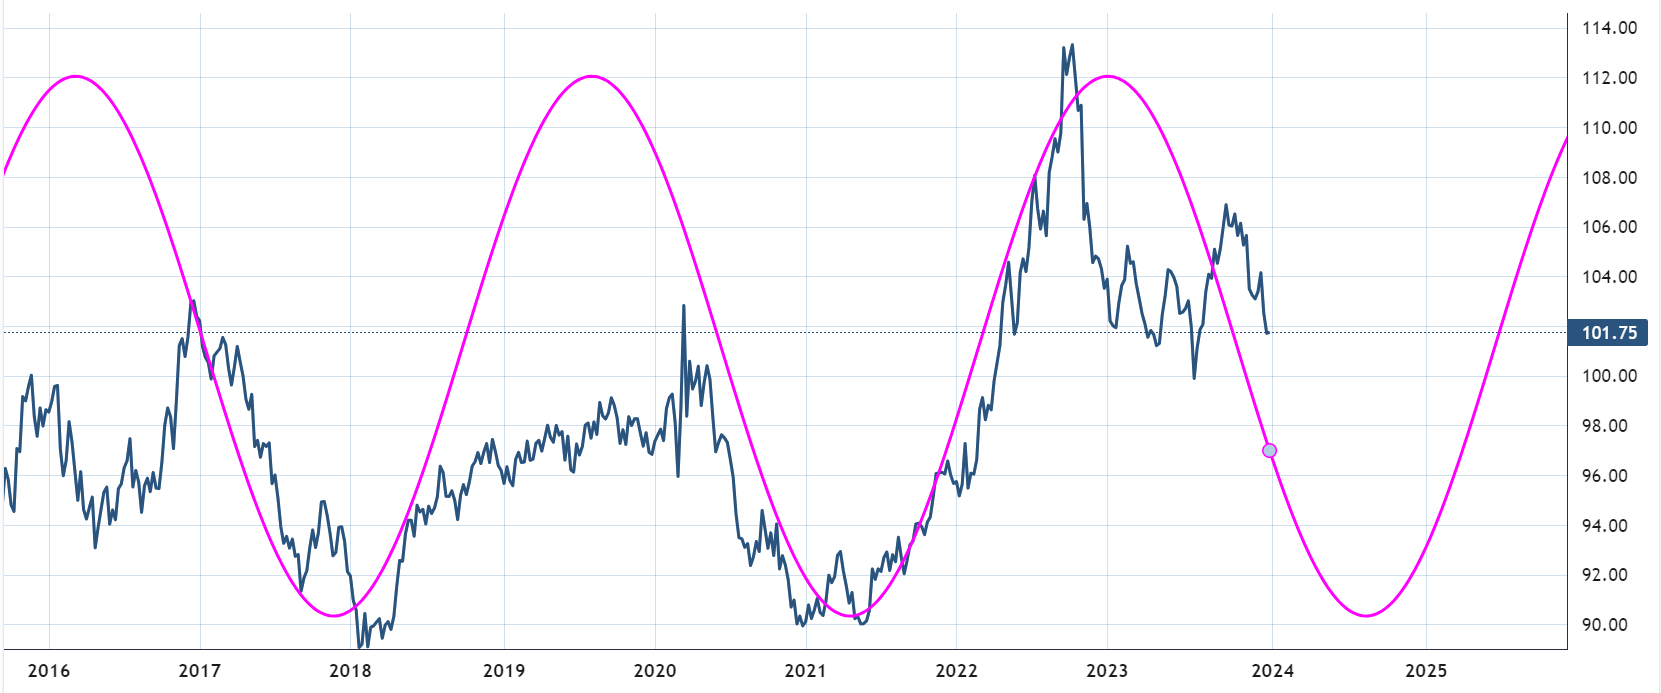
Here is the 10-year yield until roughly mid-2025.
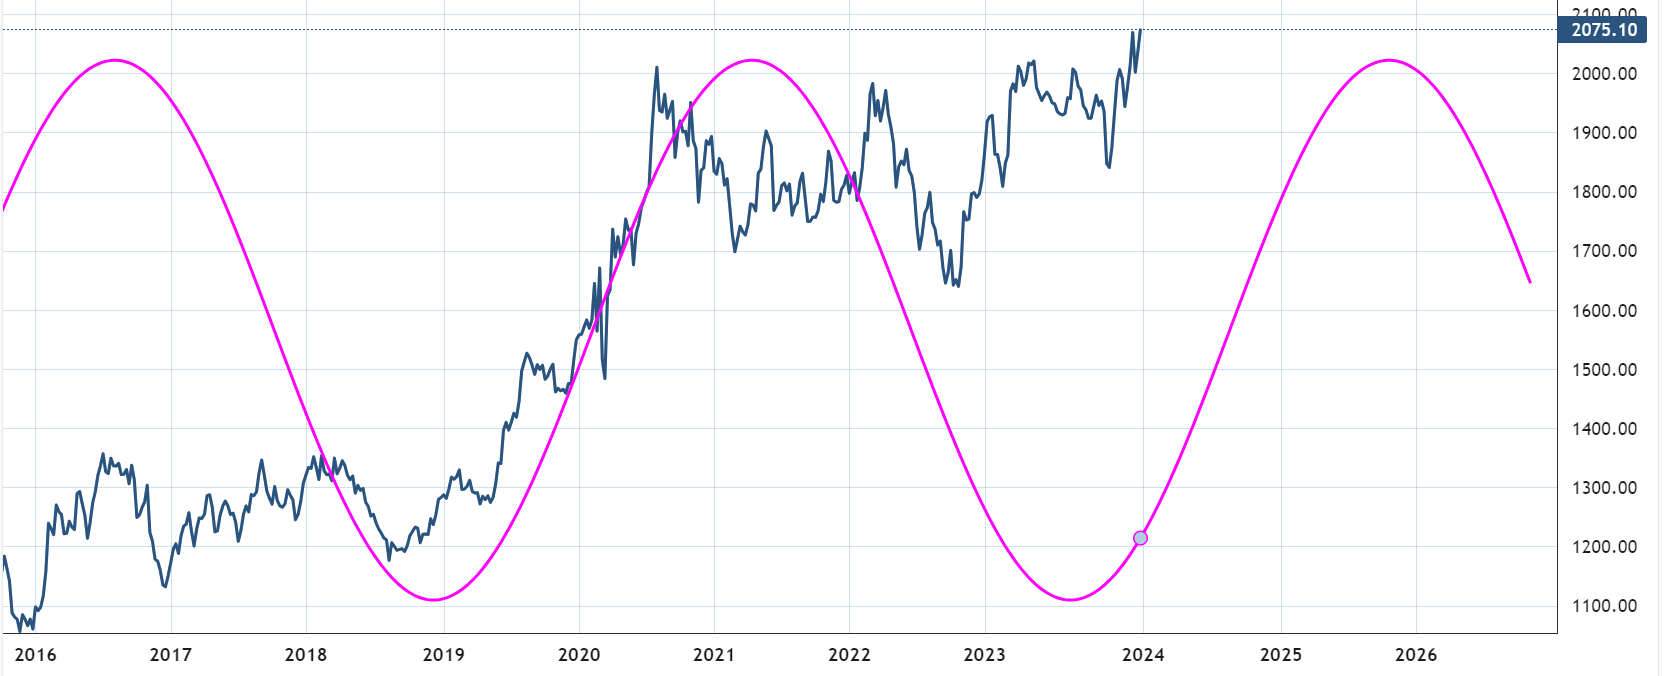
Gold
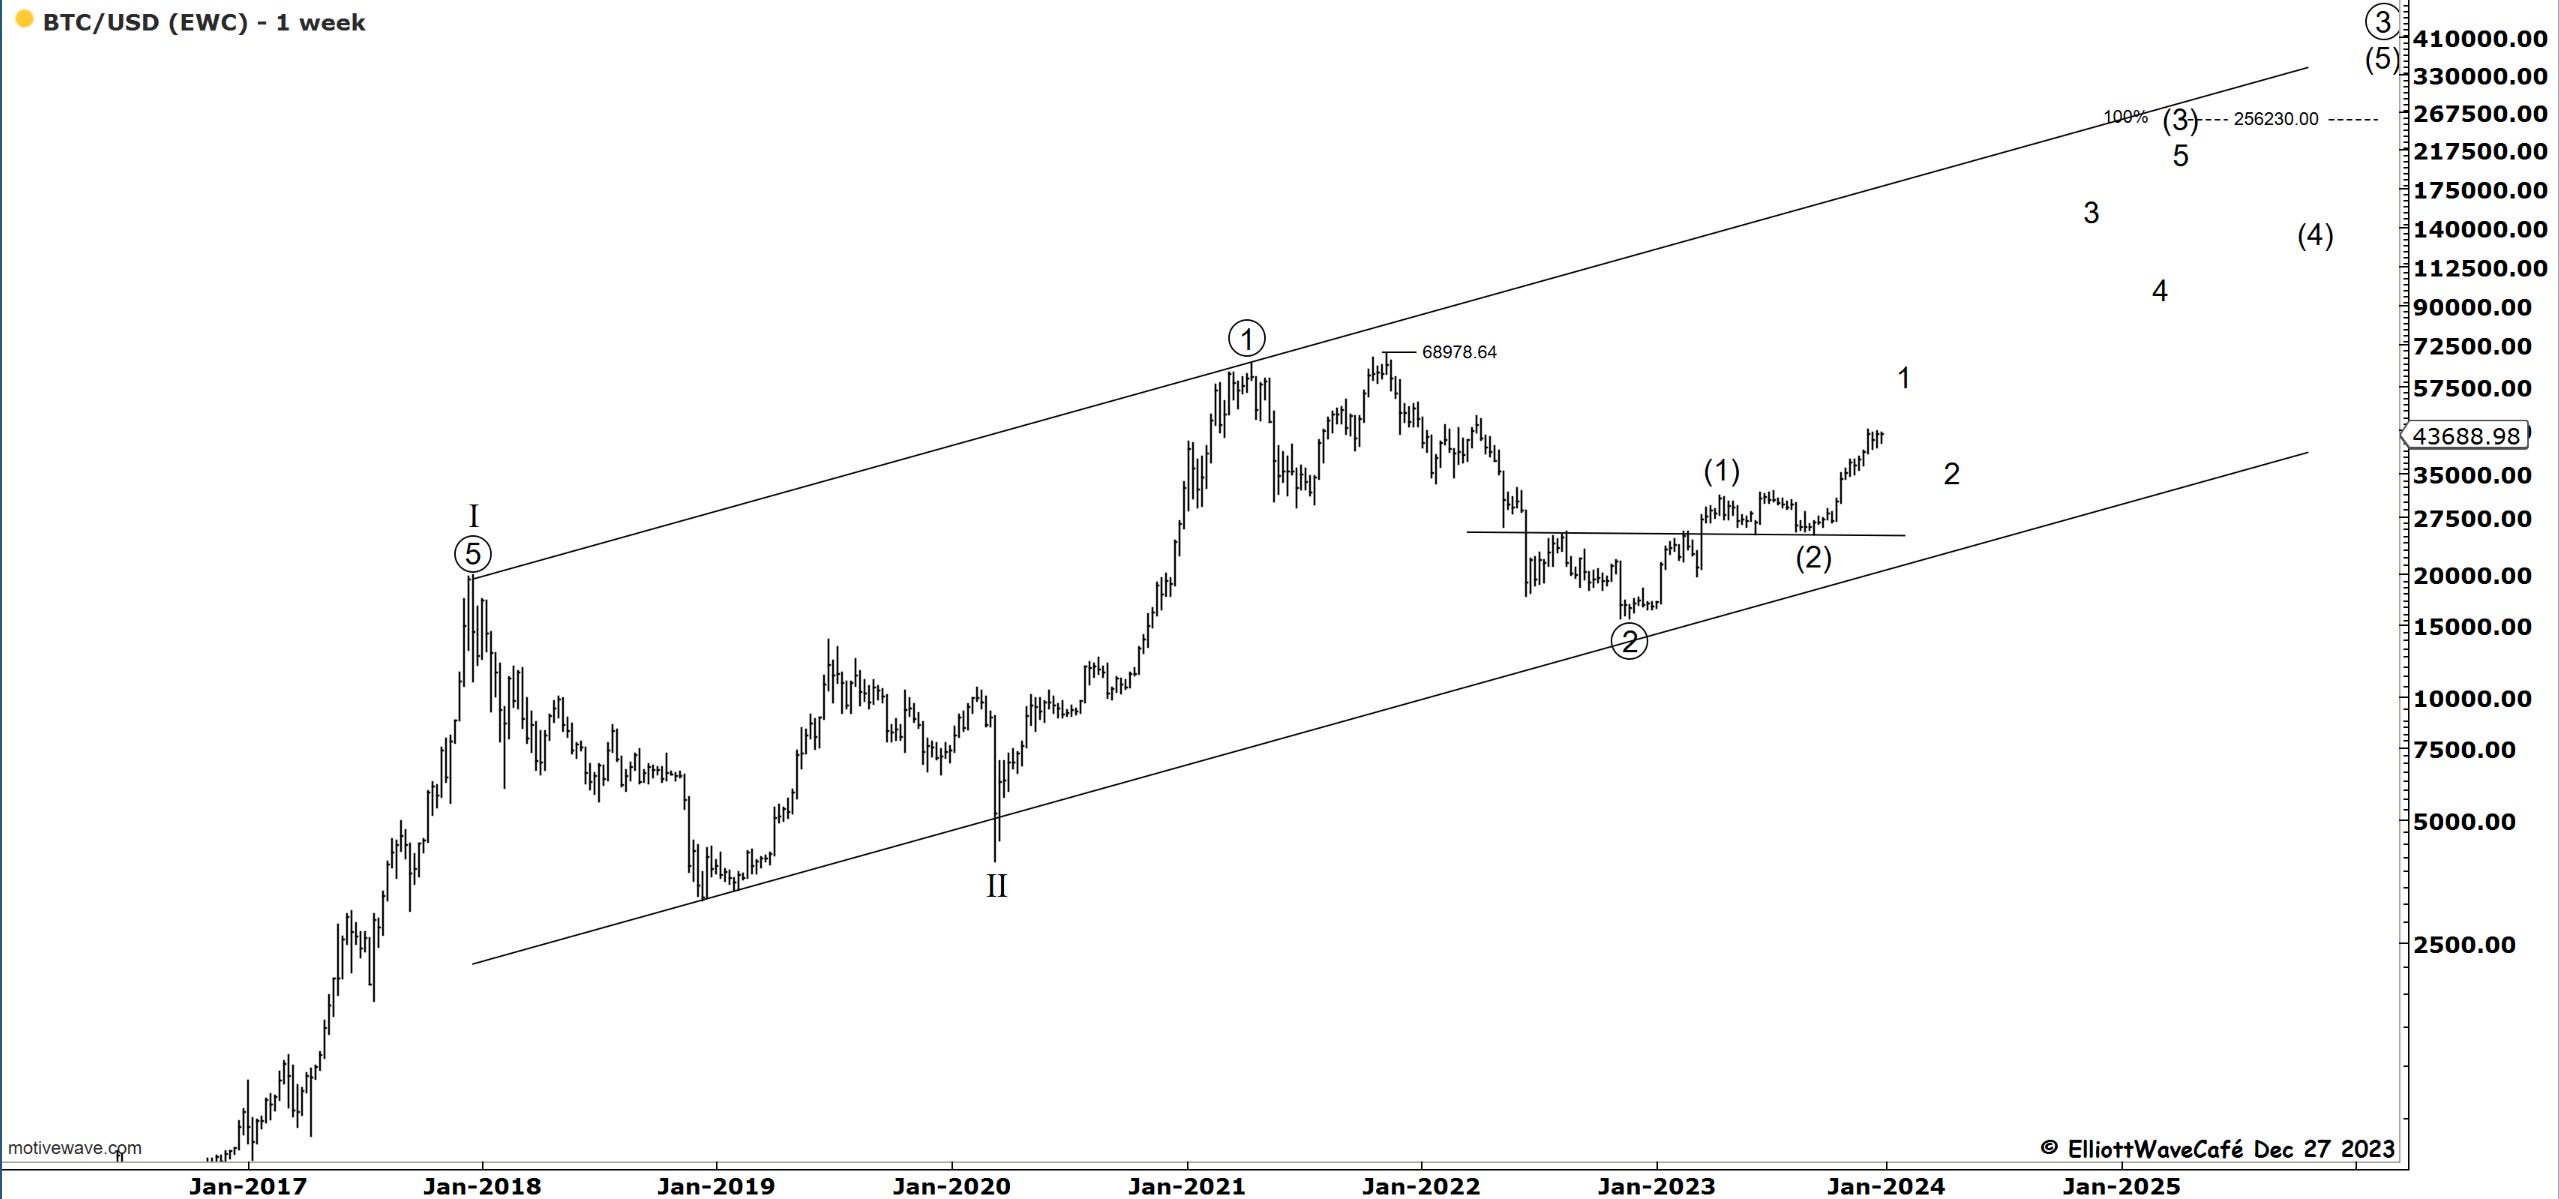
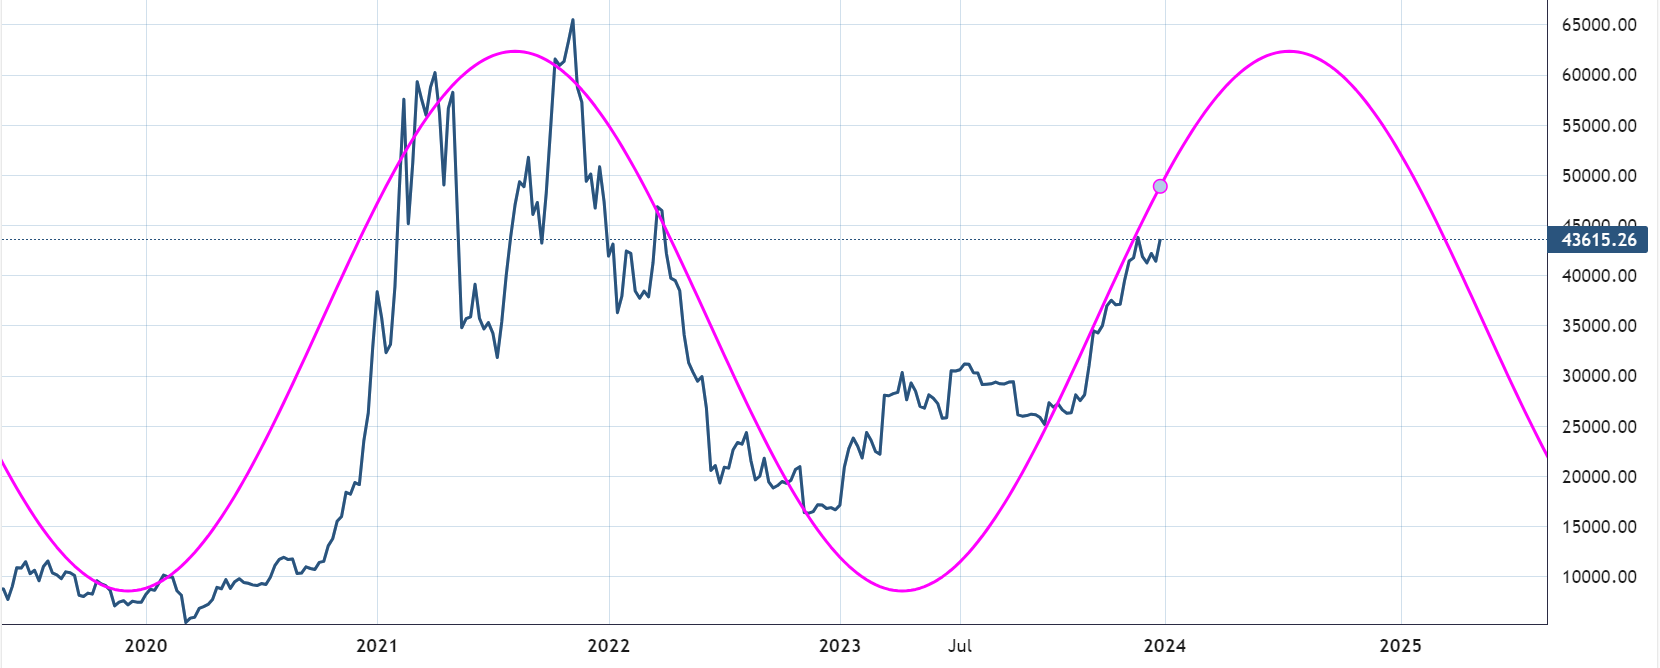
Bitcoin
“Double shot” Daily member video coming up next,
If you’re new to Elliott Wave or need to refresh, there is a 7-hour video course with downloadable slides under The Coarse tab on the website.
Have a great day wherever you are! - trade well, and don’t forget to subscribe and drop a like if this letter helps you in any way.
Cris
email: ewcafe@pm.me