
The Daily Drip
Core markets charts updates and commentary
Note: The counts on the right edge are real-time, and they are prone to adjustments as price action develops. Elliott Wave has a fluid approach, is evidence-based, and requires constant monitoring of certain thresholds.
In the counts below, this (( )) = circle on chart
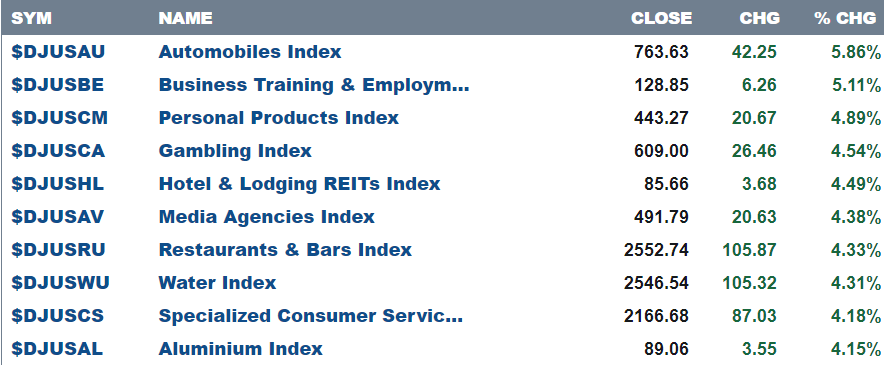
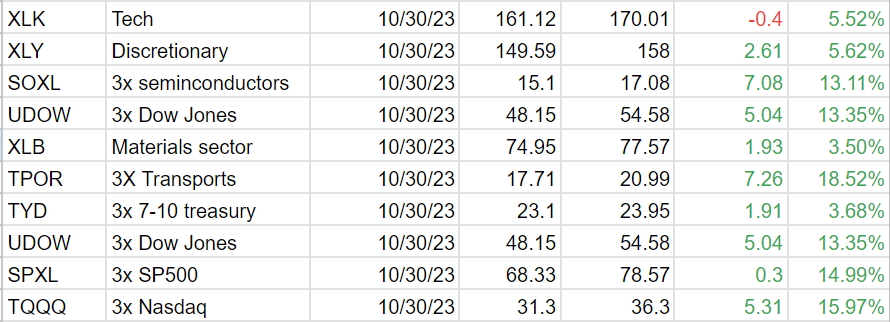
Here are today’s top 10 best performers out of 104 industries.
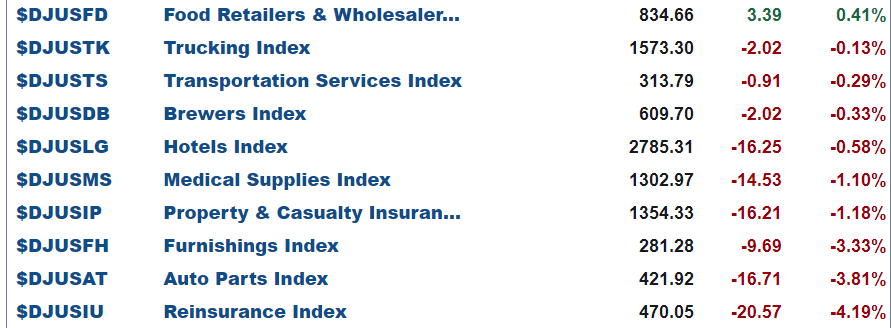
and bottom 10 …
SP500
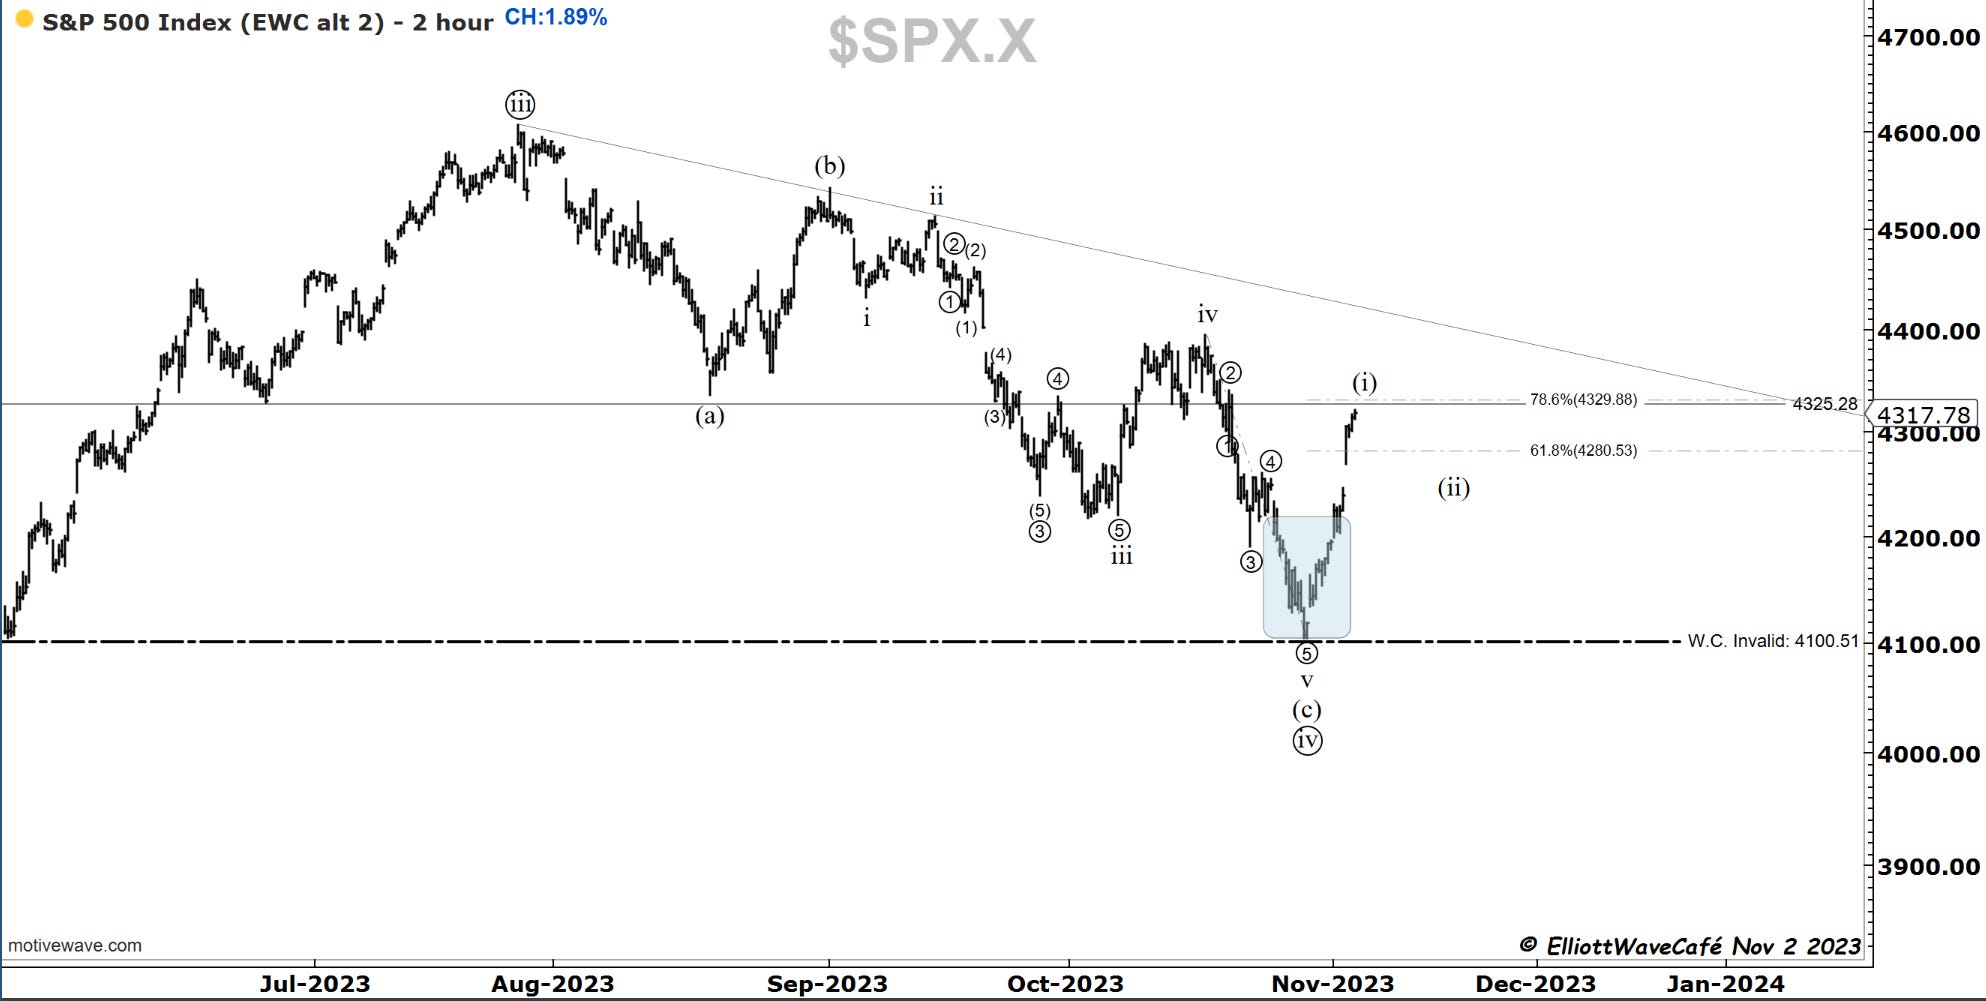
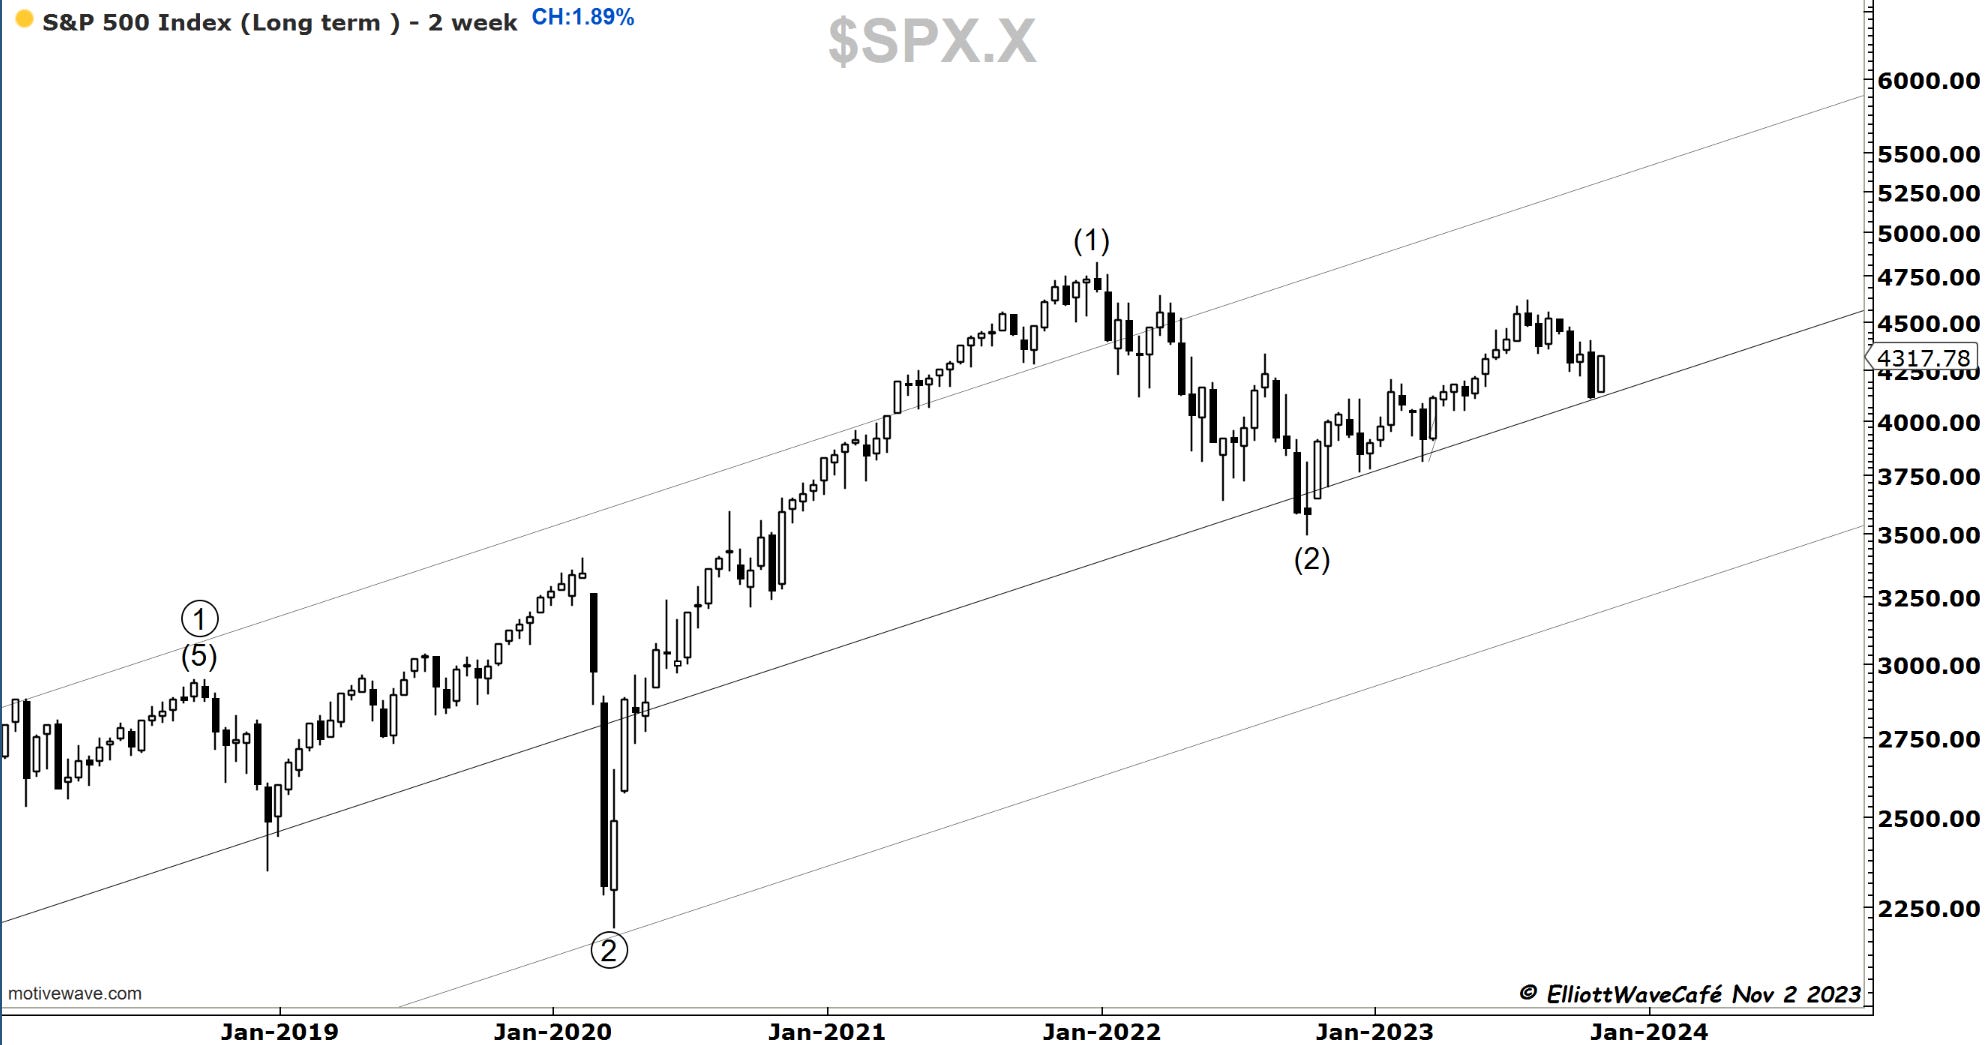
After a +1.89% rally, the SP500 finds itself back to just below the old 4325 level. This acted as S/R numerous times so one has to pay attention to it. It also happens to coincide with a 78.6% retracement level of the decline from mid-October.
The bearish hope was that the count from July down was a 1,2 1,2 and the water would break lower in a large 3rd of a 3rd. The price action from the last 4 days breaks that narrative and forces them to count the decline as a leading diagonal with wave 2 in progress. It’s very tough to subscribe to that view due to the lack of the “right look” and wave proportions missing.
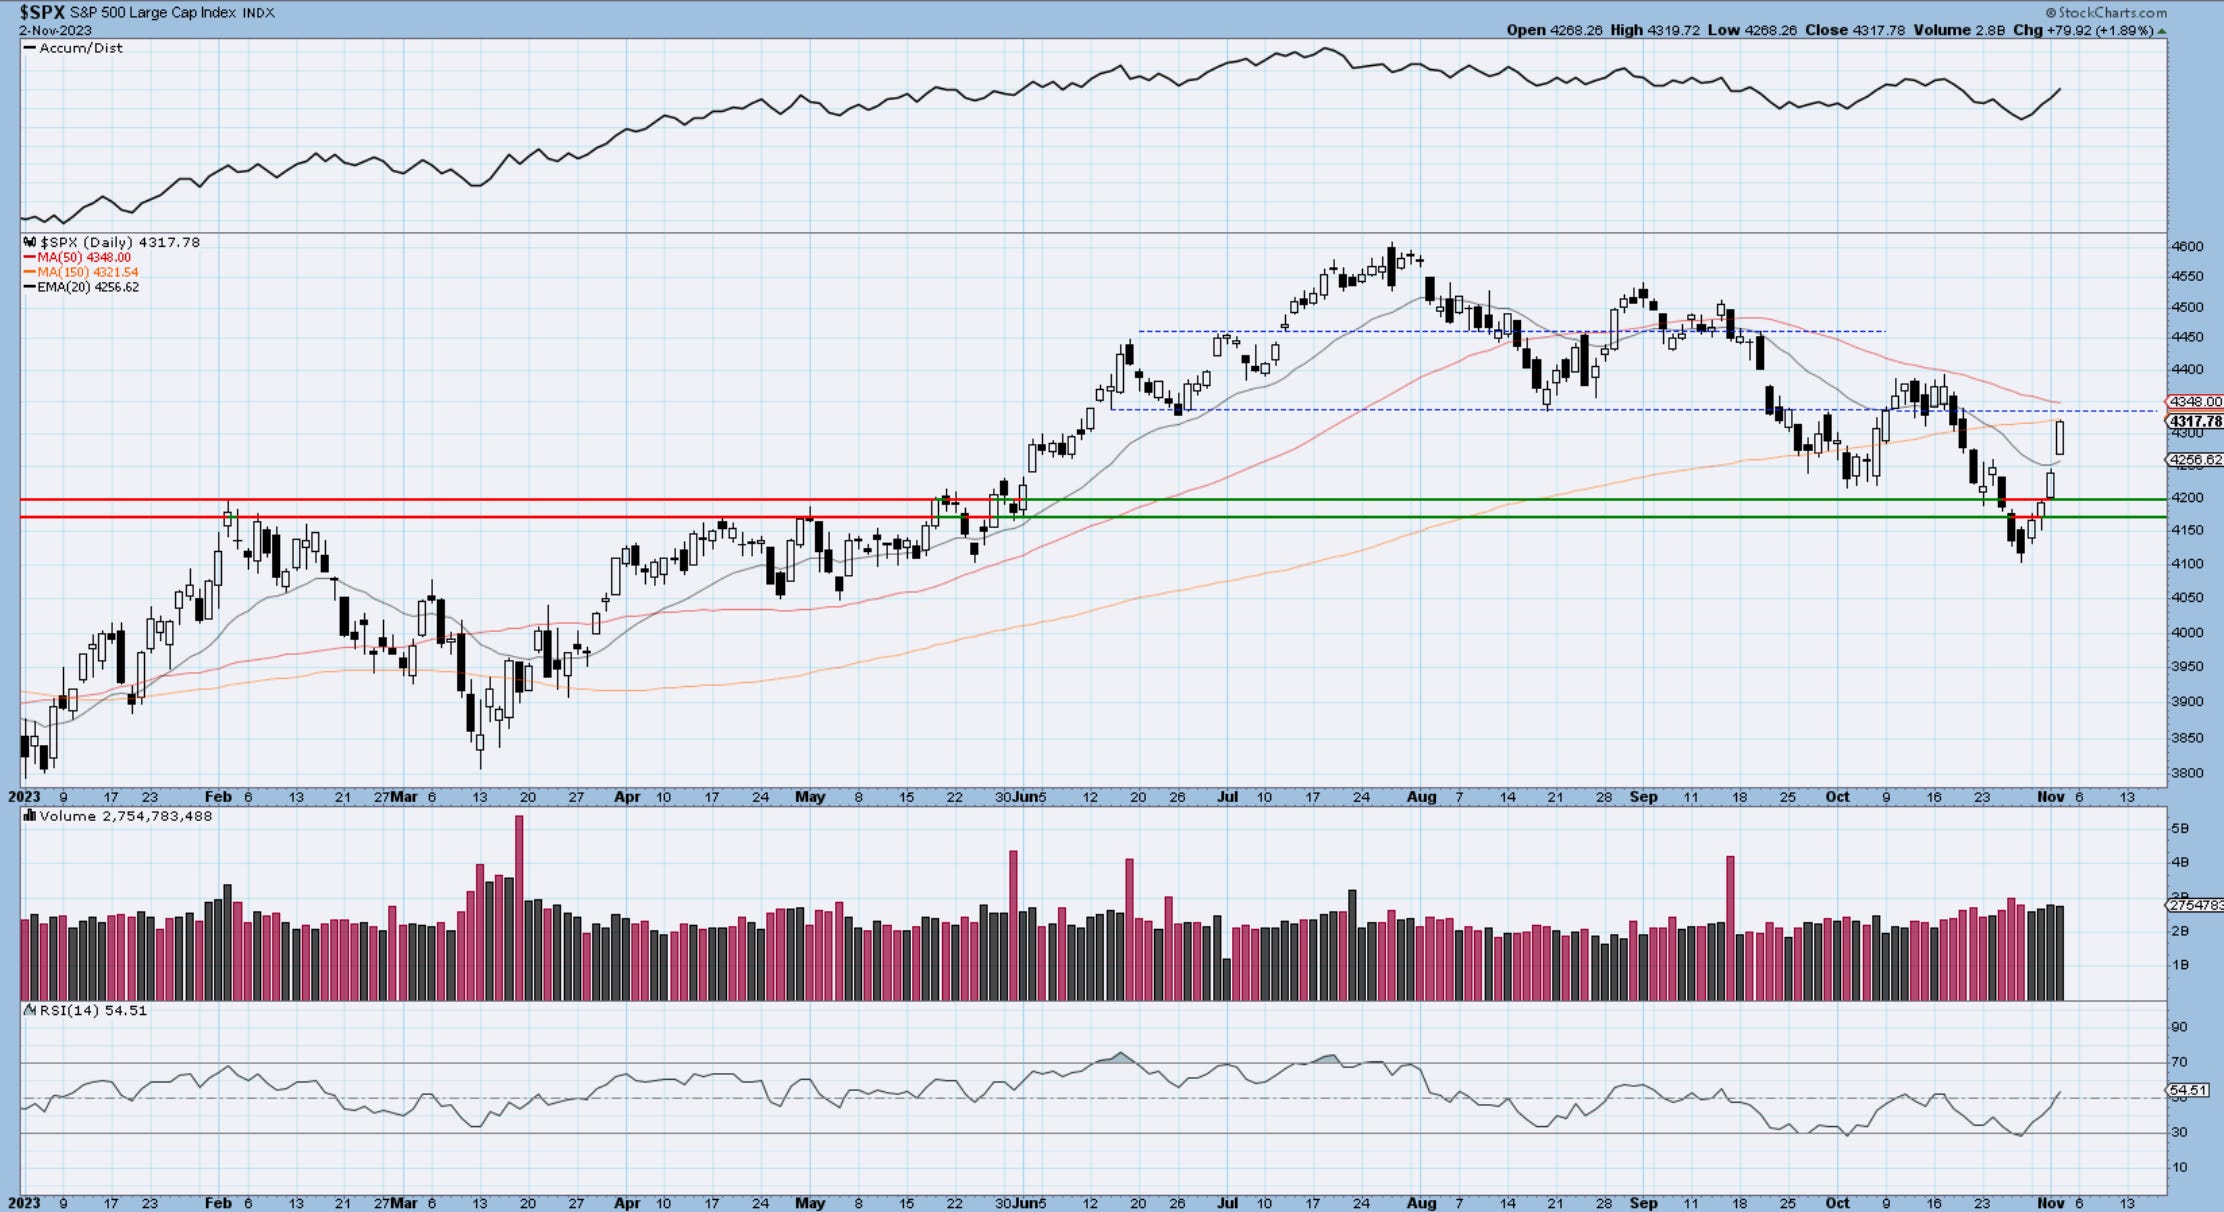
The buying comes with decent volume but it still has to clear some upside hurdles to inspire additional confidence in a larger reversal. We are still below wave iv high and below a declining trendline. Once wave (i) is complete, the assumption would be that a wave (ii) would lead us higher and break the mentioned levels. The 150day also acts as an adaptable trendline and needs to be taken out.
The third chart shows the larger channel in the Sp500, with the middle line continuing to offer support on selloffs.
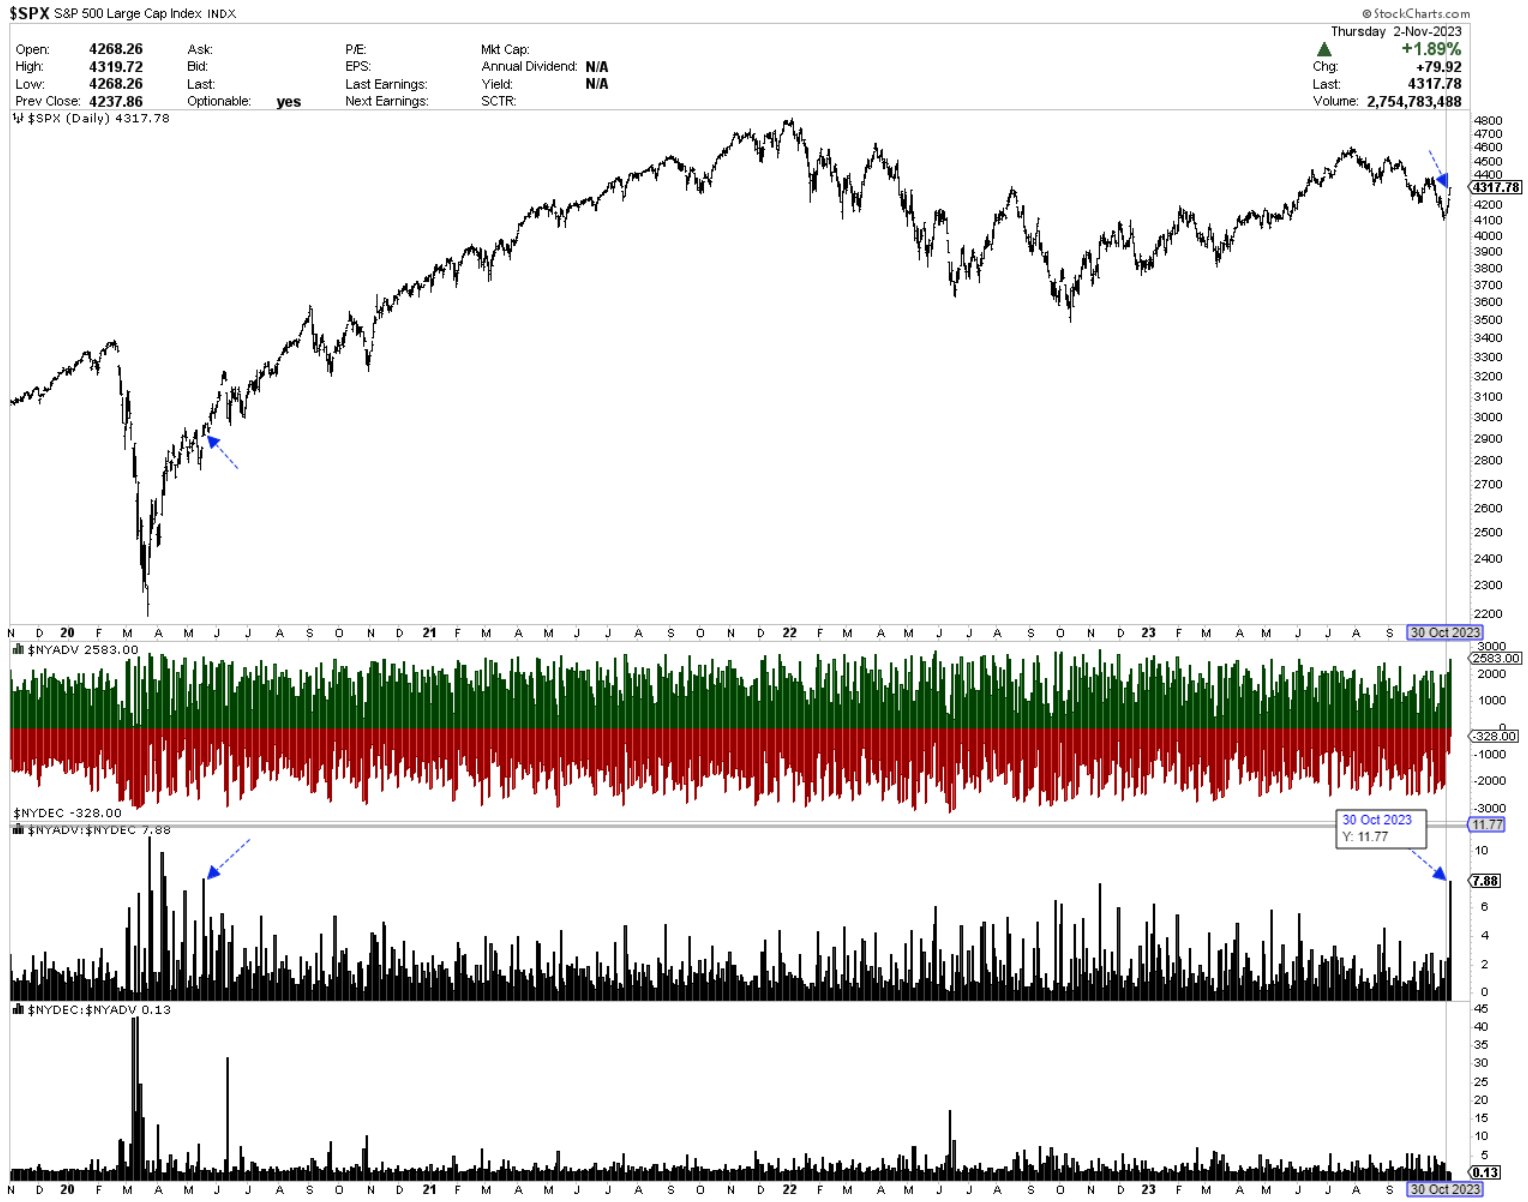
The last time the Sp500 saw such an expansion in advancing stocks vs declining stocks was on May 18, 2020. 8 times more advancing issues than declining. If this is not broad-breadth participation, I don’t know what is.
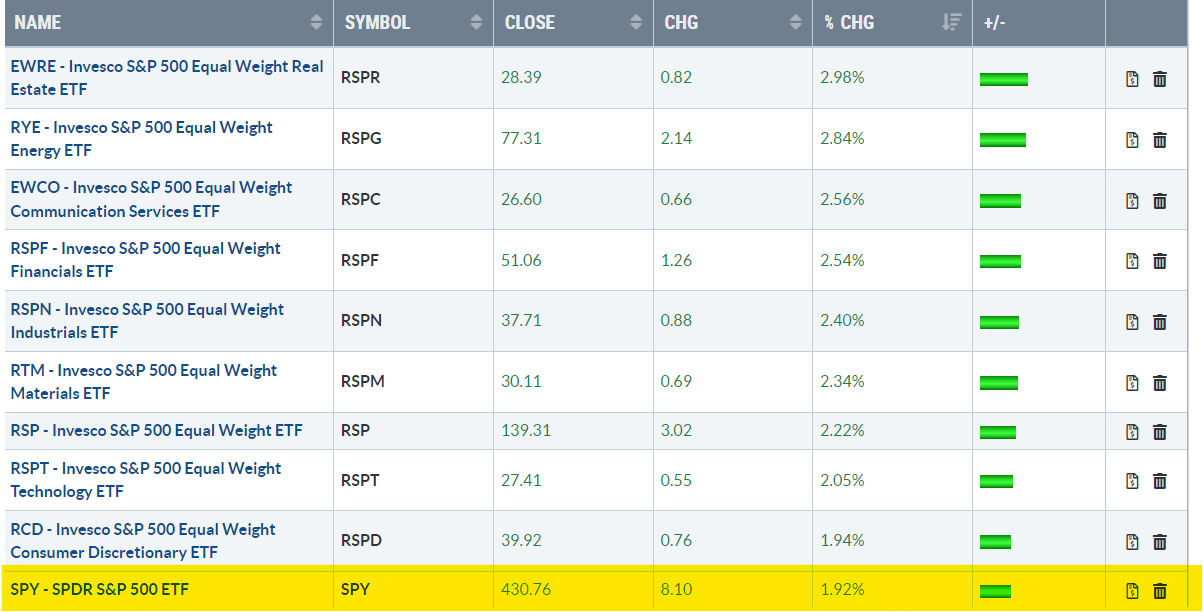
Here are the Equal-weight sectors beating SPY today by a large margin.
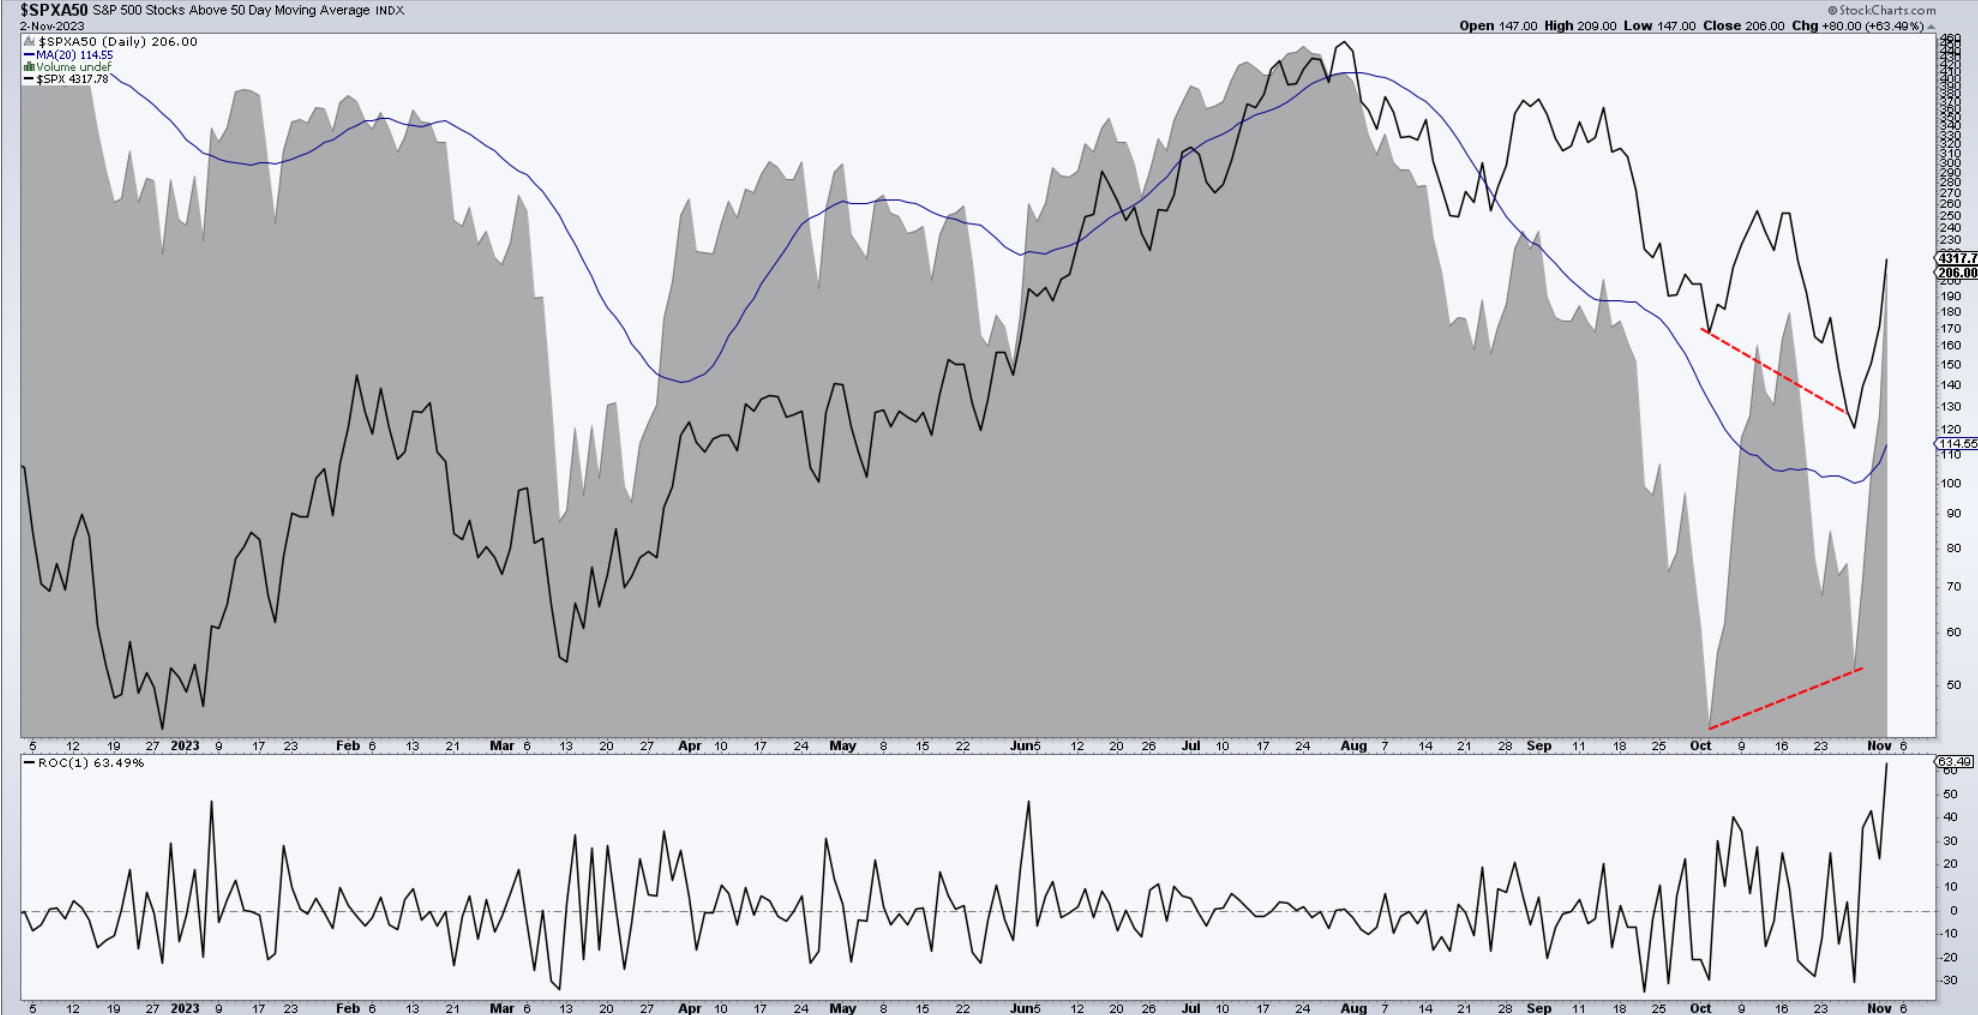
It is also one of the largest jumps in stocks above their 50-day MA. +63.49%.
The EWCafe ETF portfolio came with aggressive leverage into this week and we are being rewarded for the stance.
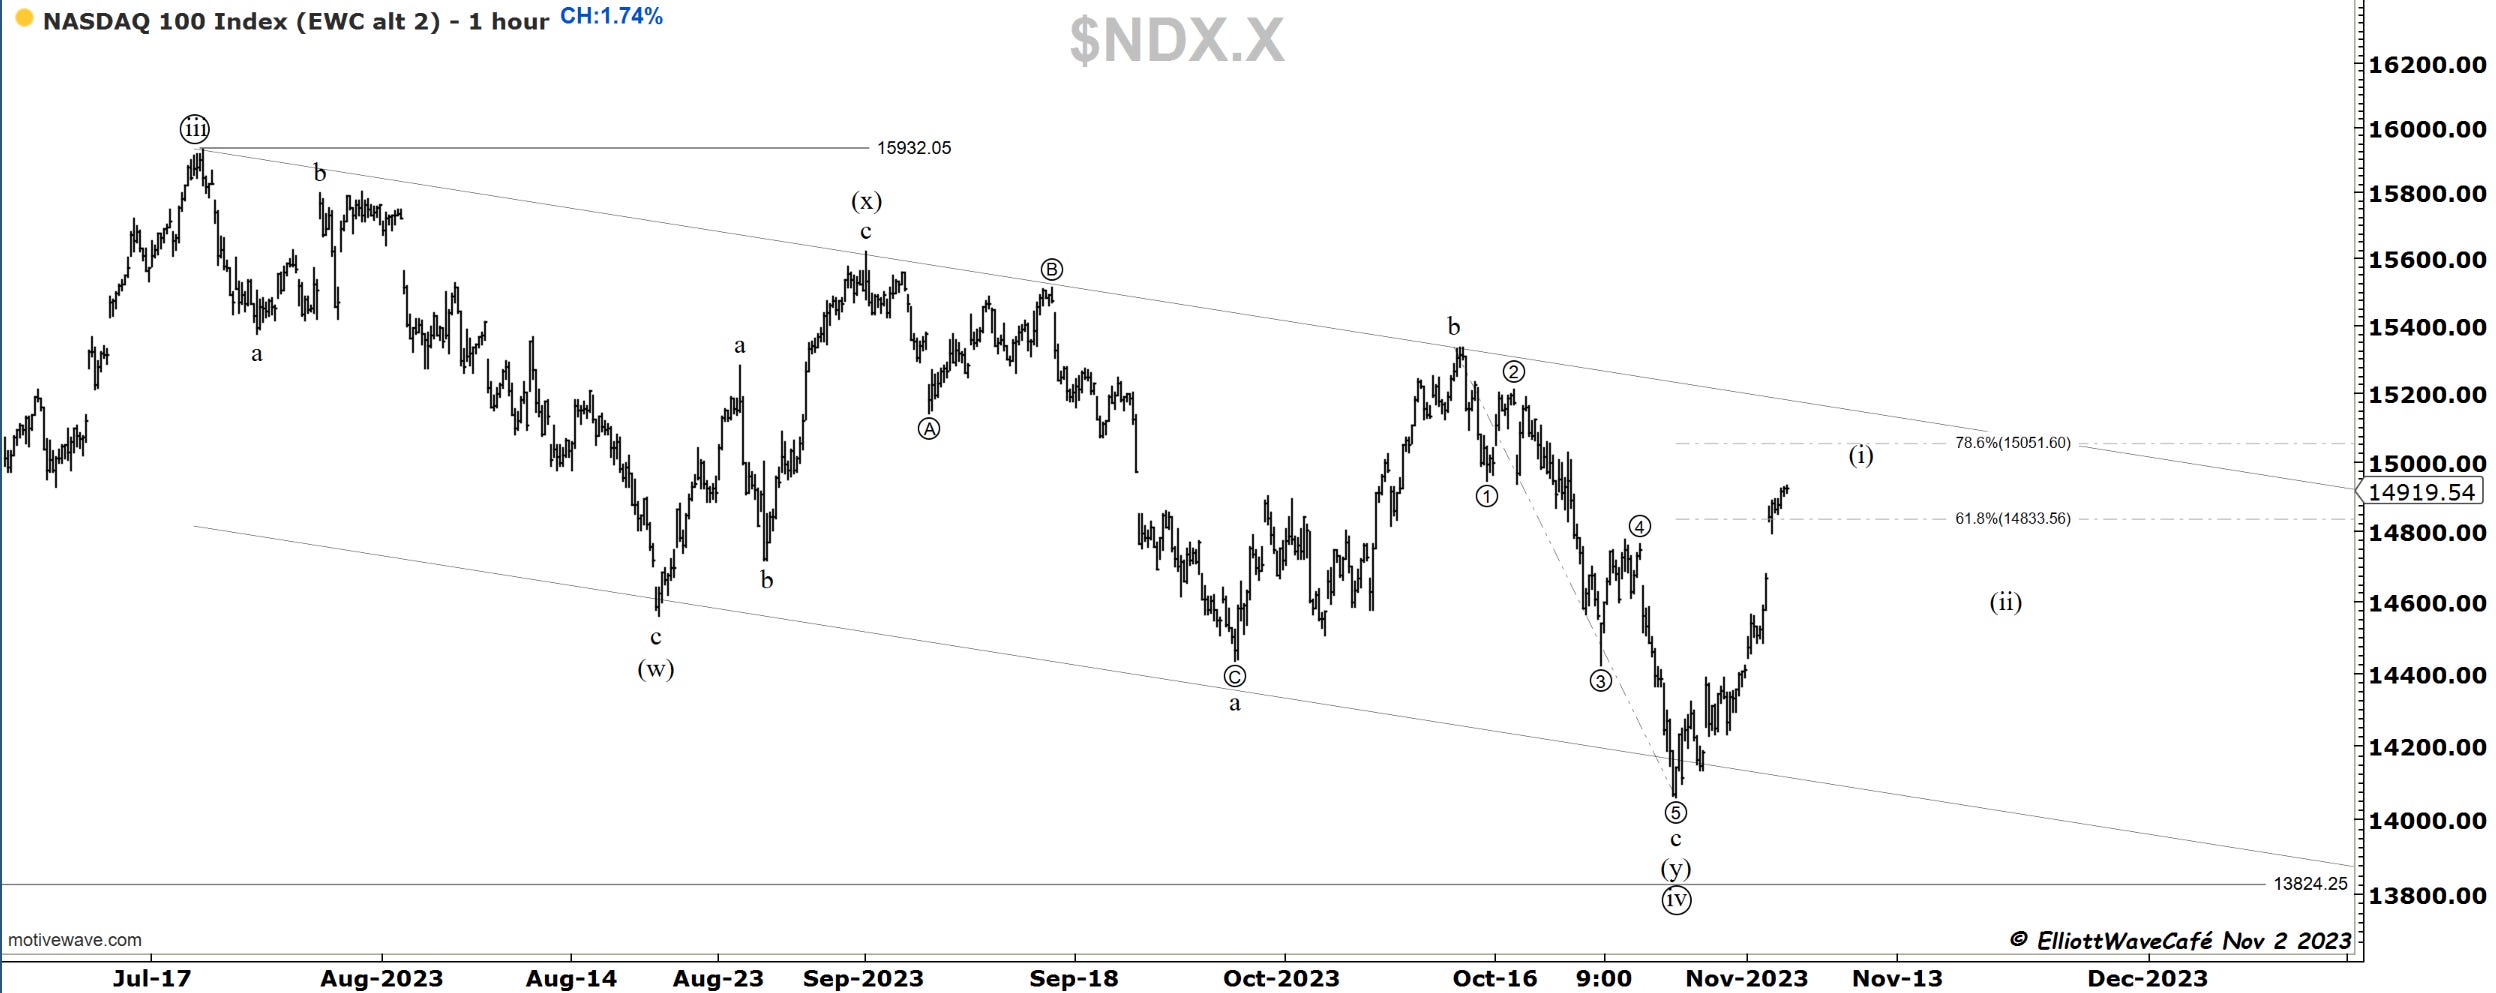
Nasdaq100
An almost exact replica of yesterday in terms of gains with another +1.74% increase. This is wave three of the ongoing wave (i). Once it completes at some point below the trendline we should get a wave (ii) pullback. I would use that as a means to get back into the wave (iii) expansion. Volume is also larger than average on these buy days.
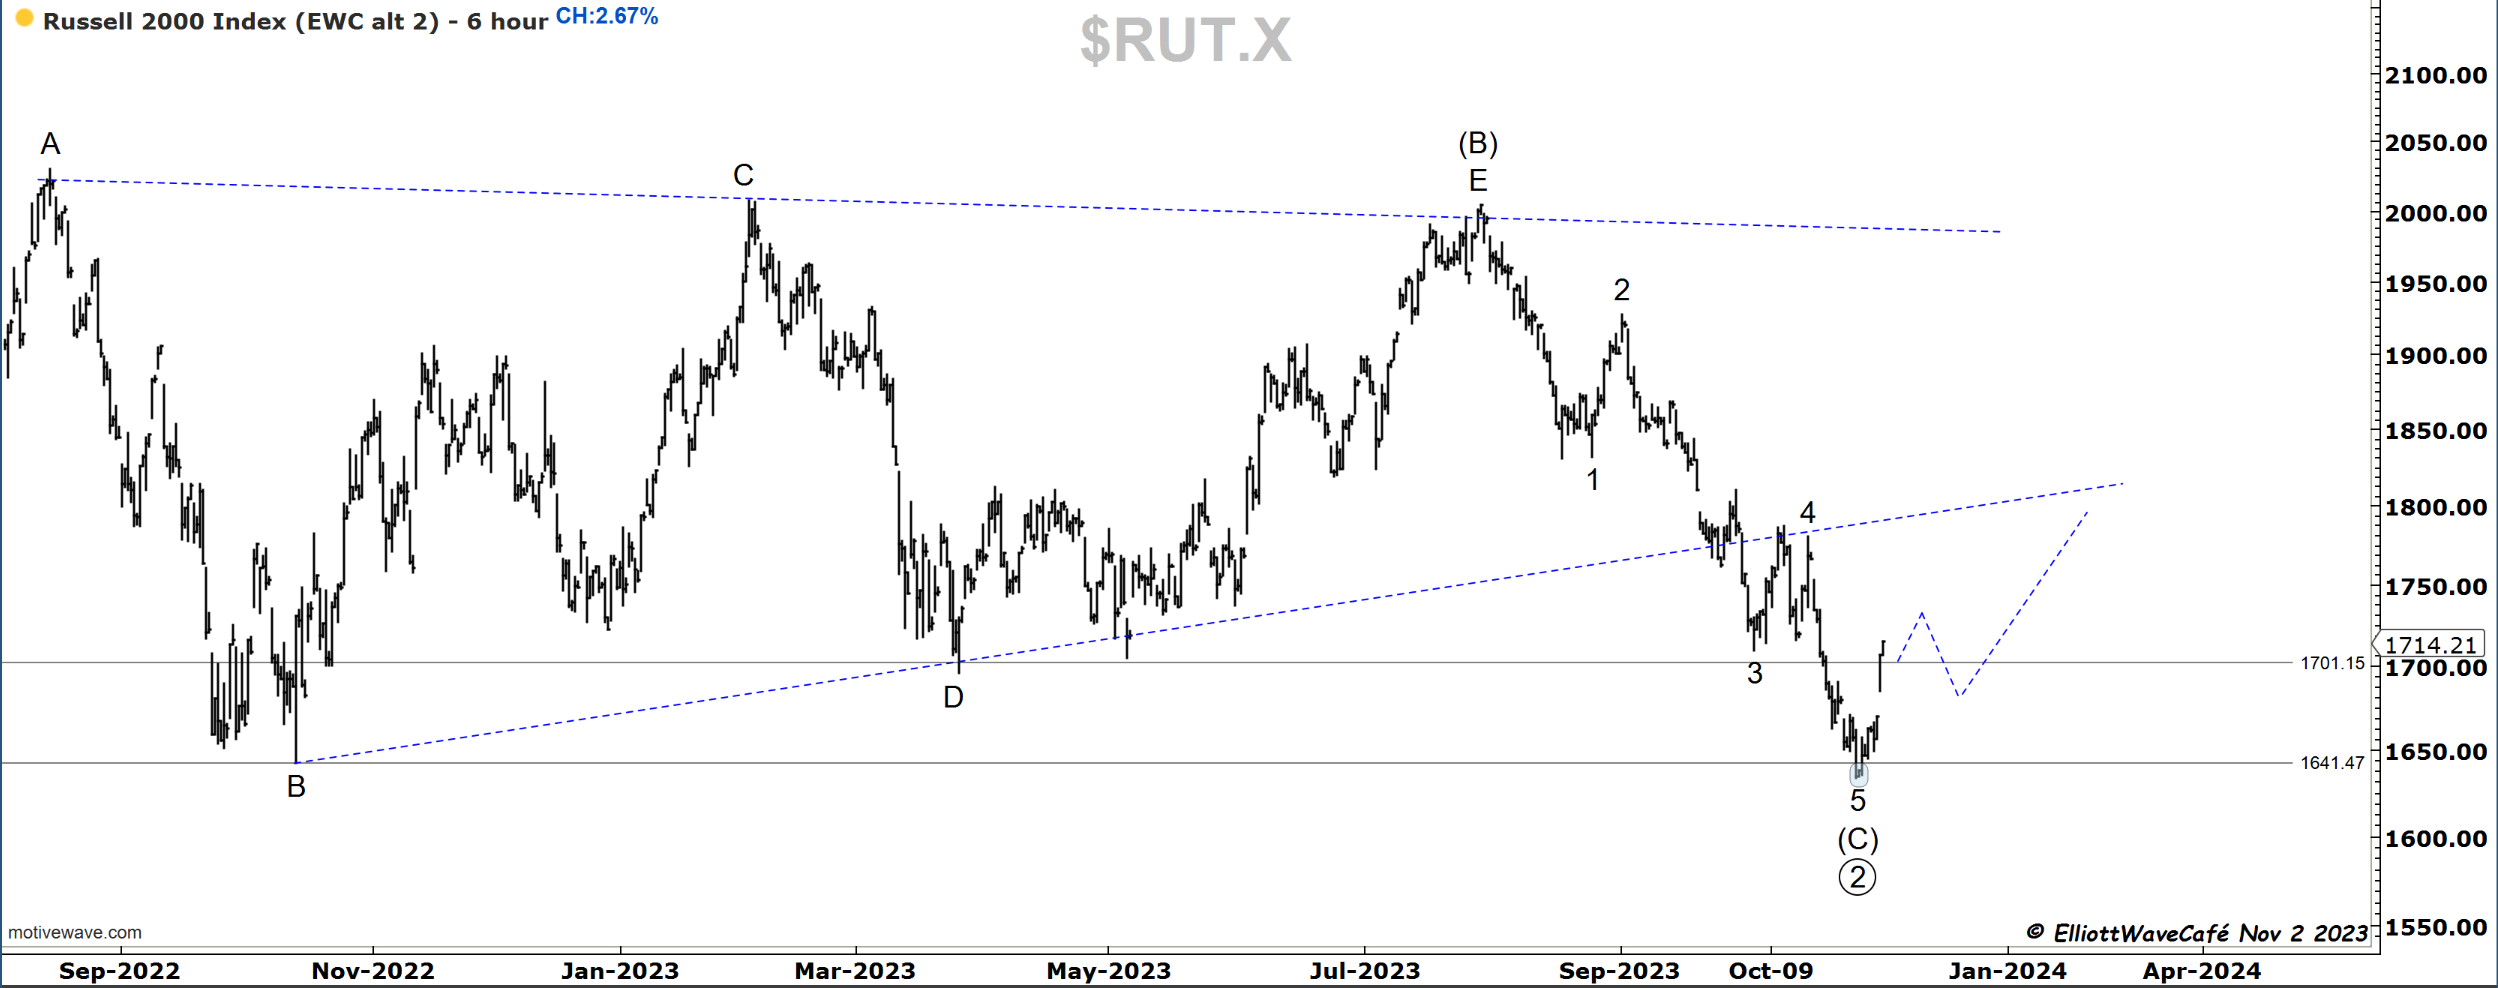
RUSSELL 2000
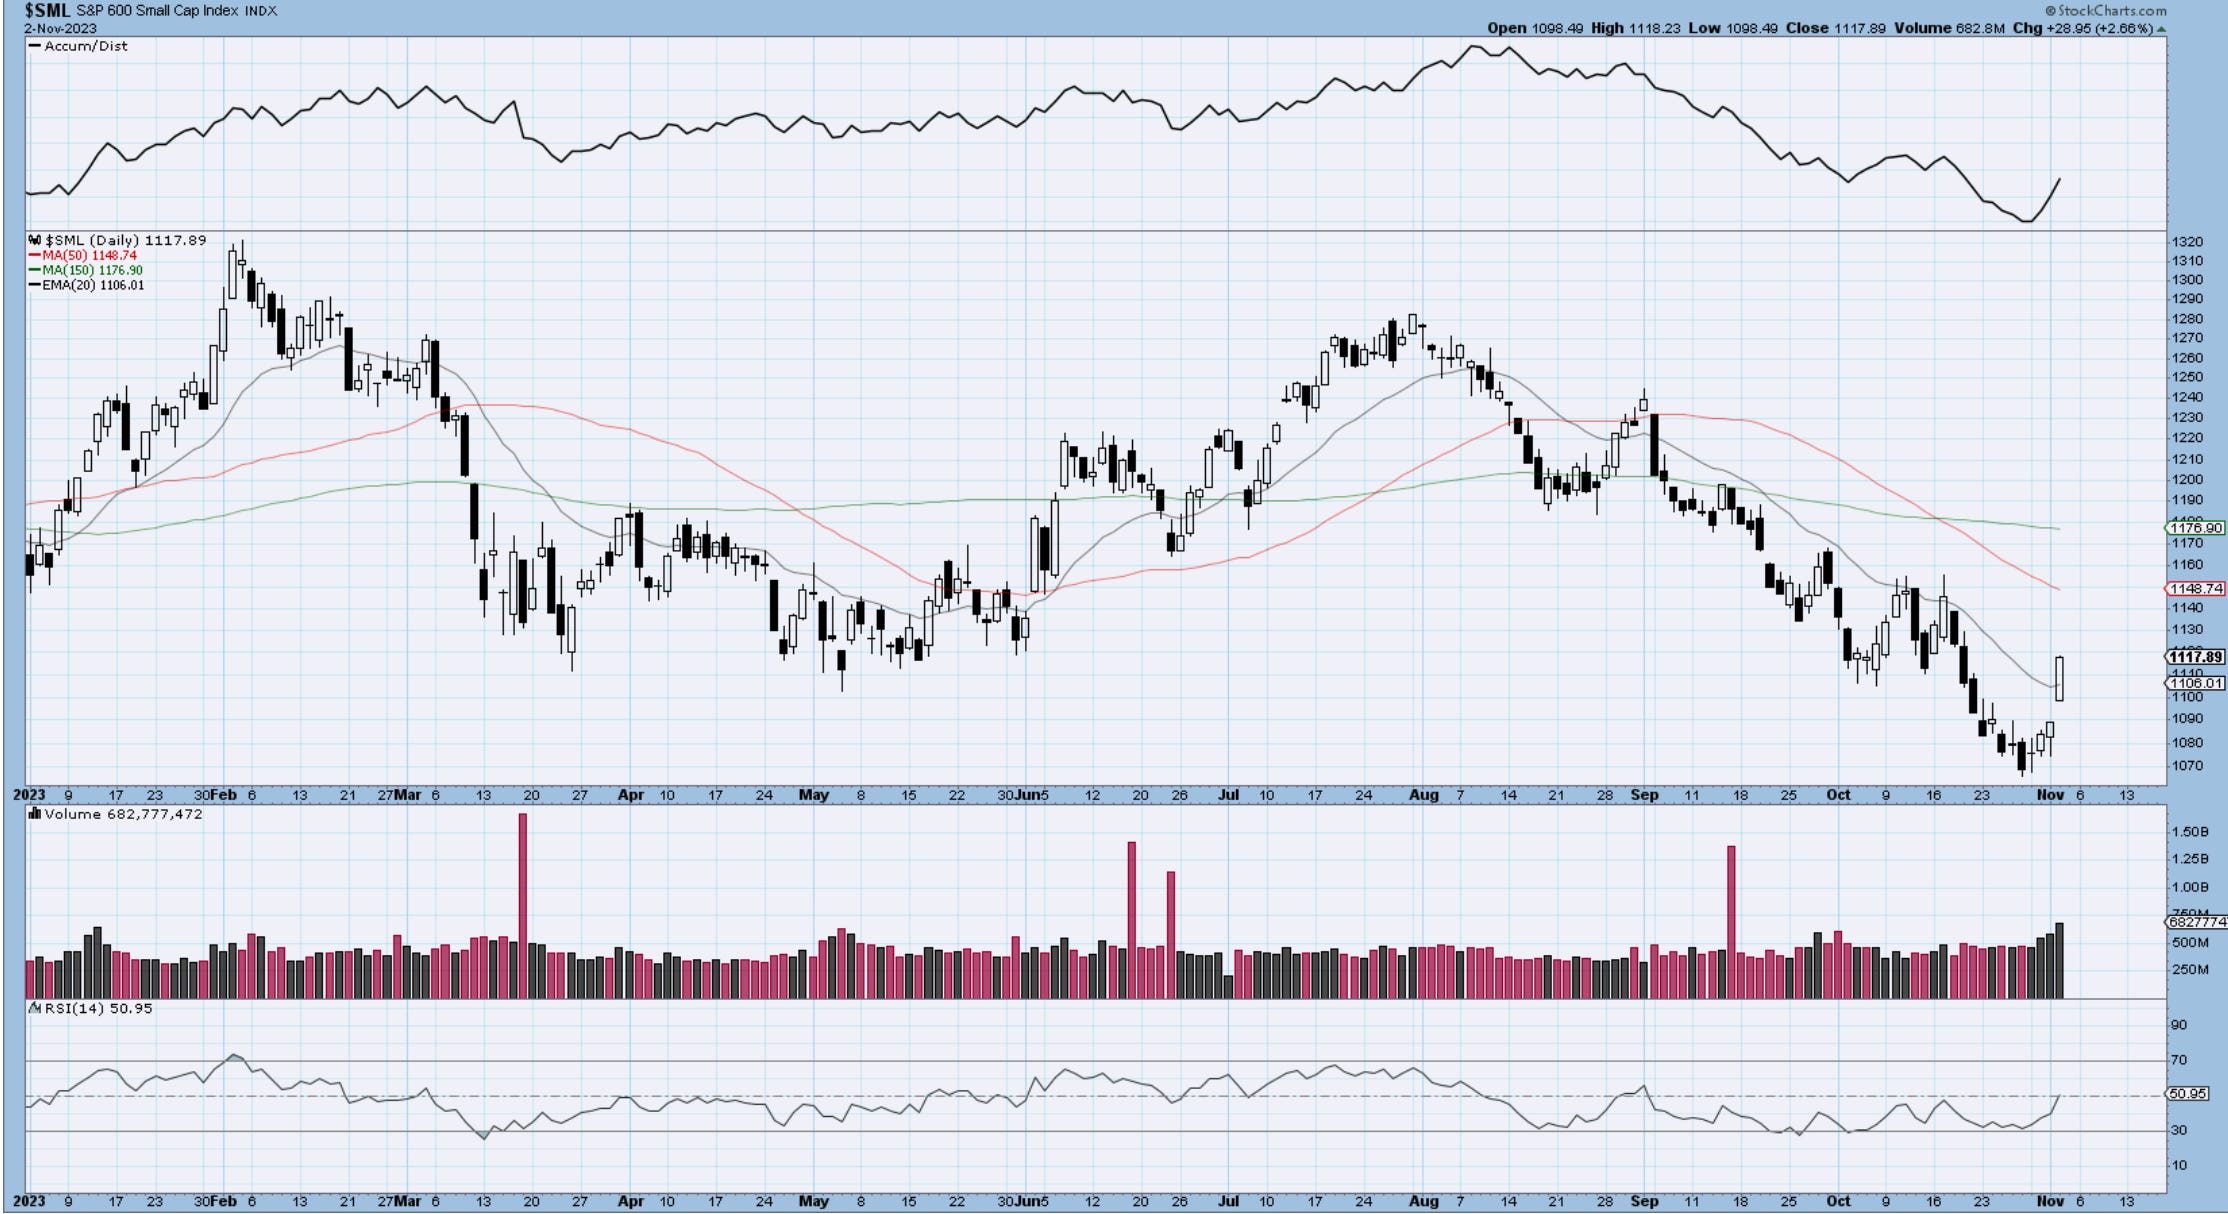
Small caps have taken a serious beating over the past 3 months. It went as much as setting a bear trap just below last year's Oct lows. The move should have just a bit more to go to complete an initial impulse up before a retreat will set the stage for the next higher leg. A move above the prior wave 4 highs would secure the odds of a completed decline.
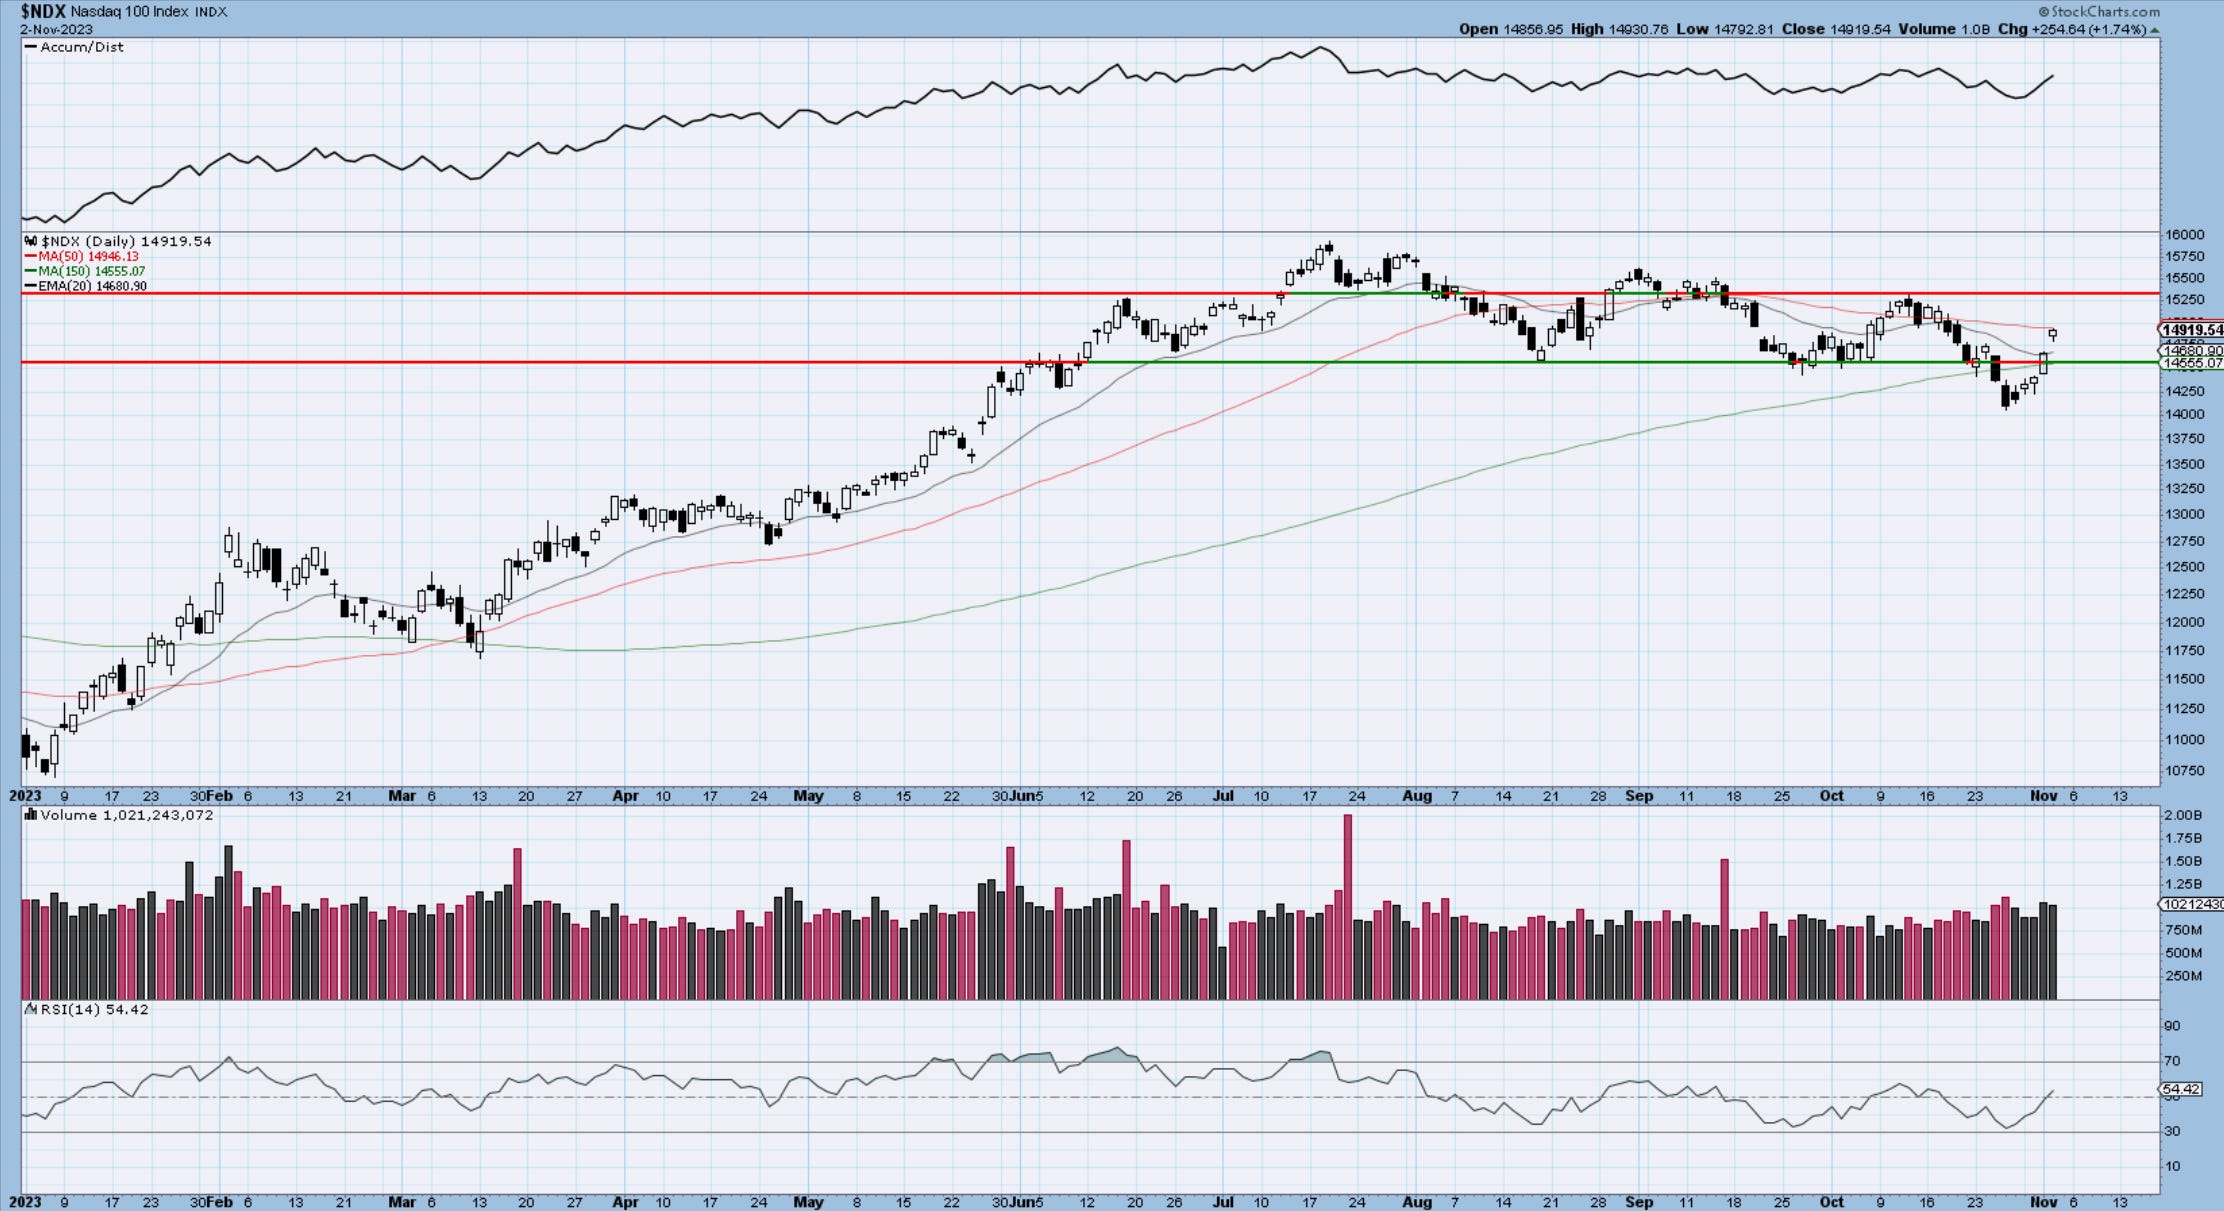
Check out the volume bars on daily. A declining 50-day is not in favor of the bulls, so there is plenty of work to do in this area of the market.

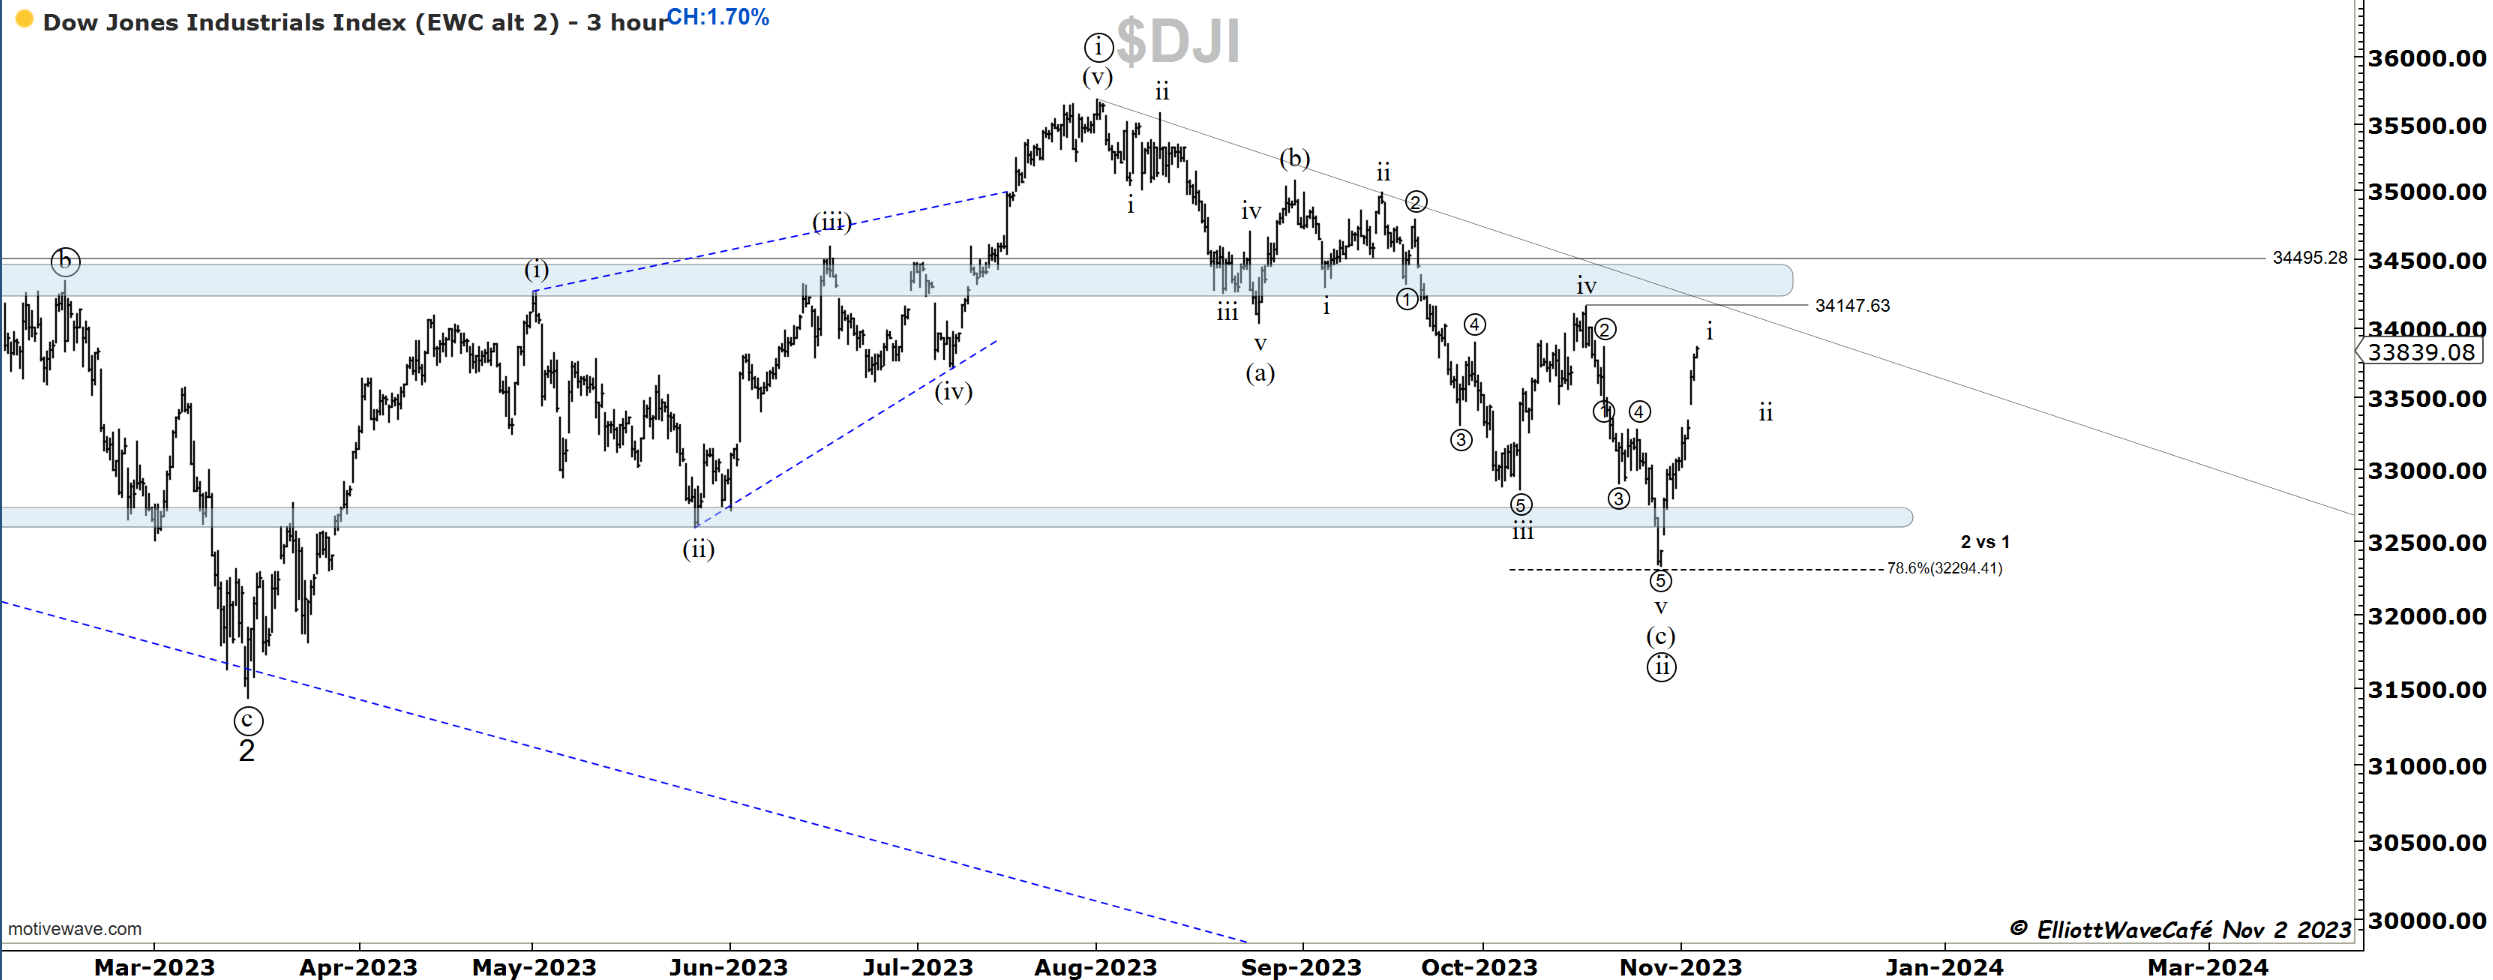
Dow30
So-called Industrials have managed to extend their gains and getting closer to that prior wave iv highs. Rest assured there will be profit-taking, call-selling, and adjustments to be made into these levels. The 50-day stays ready to defend while the 150 is just above.
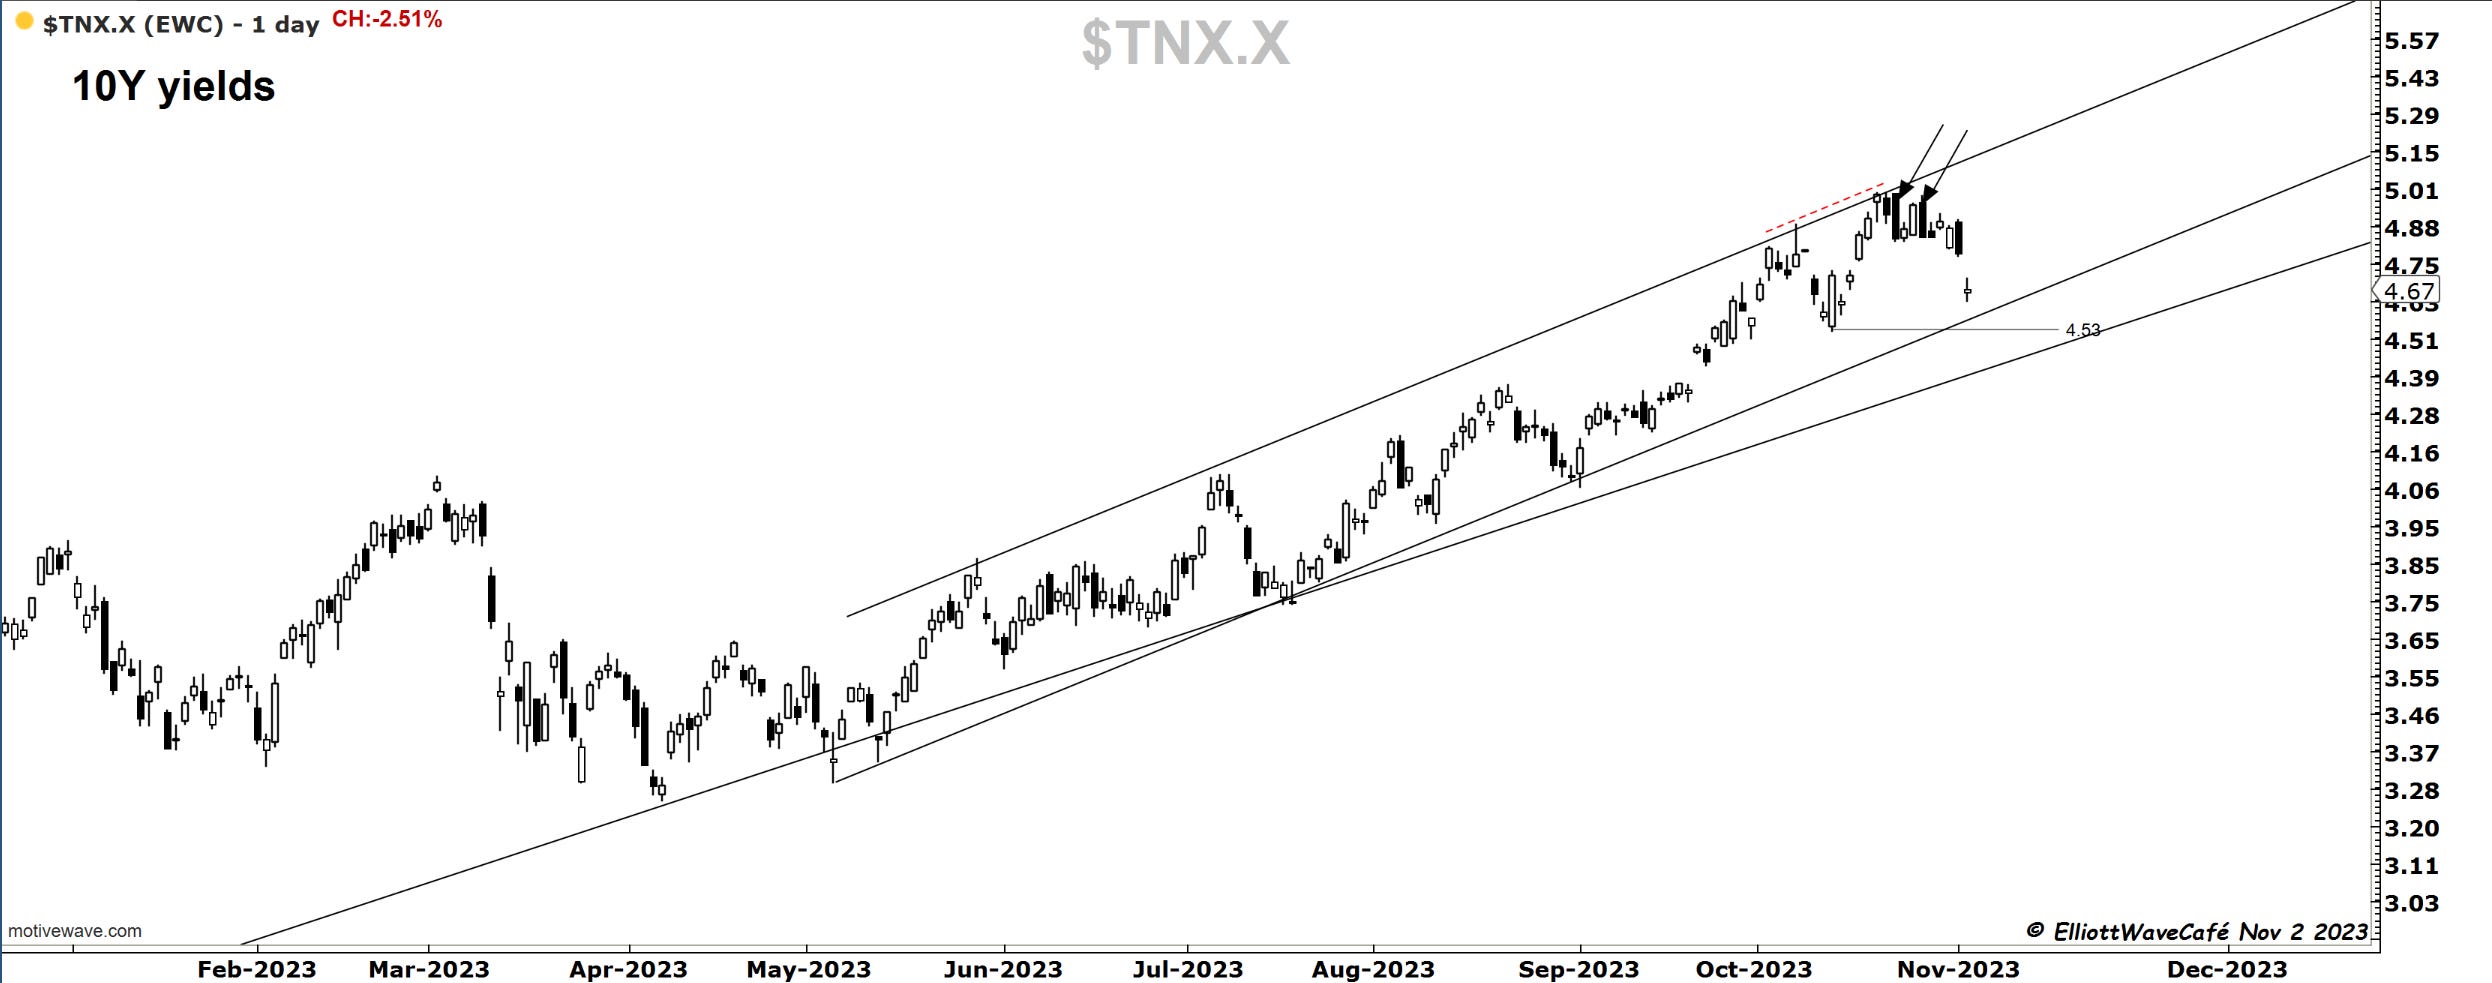
US Dollar and Yields
The dollar dropped throughout most of the day before stabilizing above 105.80. The yields on the other hand have taken to the chute nd are approaching the 4.50% level. The short break above 5% really spooked investors, just in time for a retreat. I still think there is more work to do here to create a larger top, but with the Fed narrative changing, there are increased chances of lower yields at least for a good part of 2024.
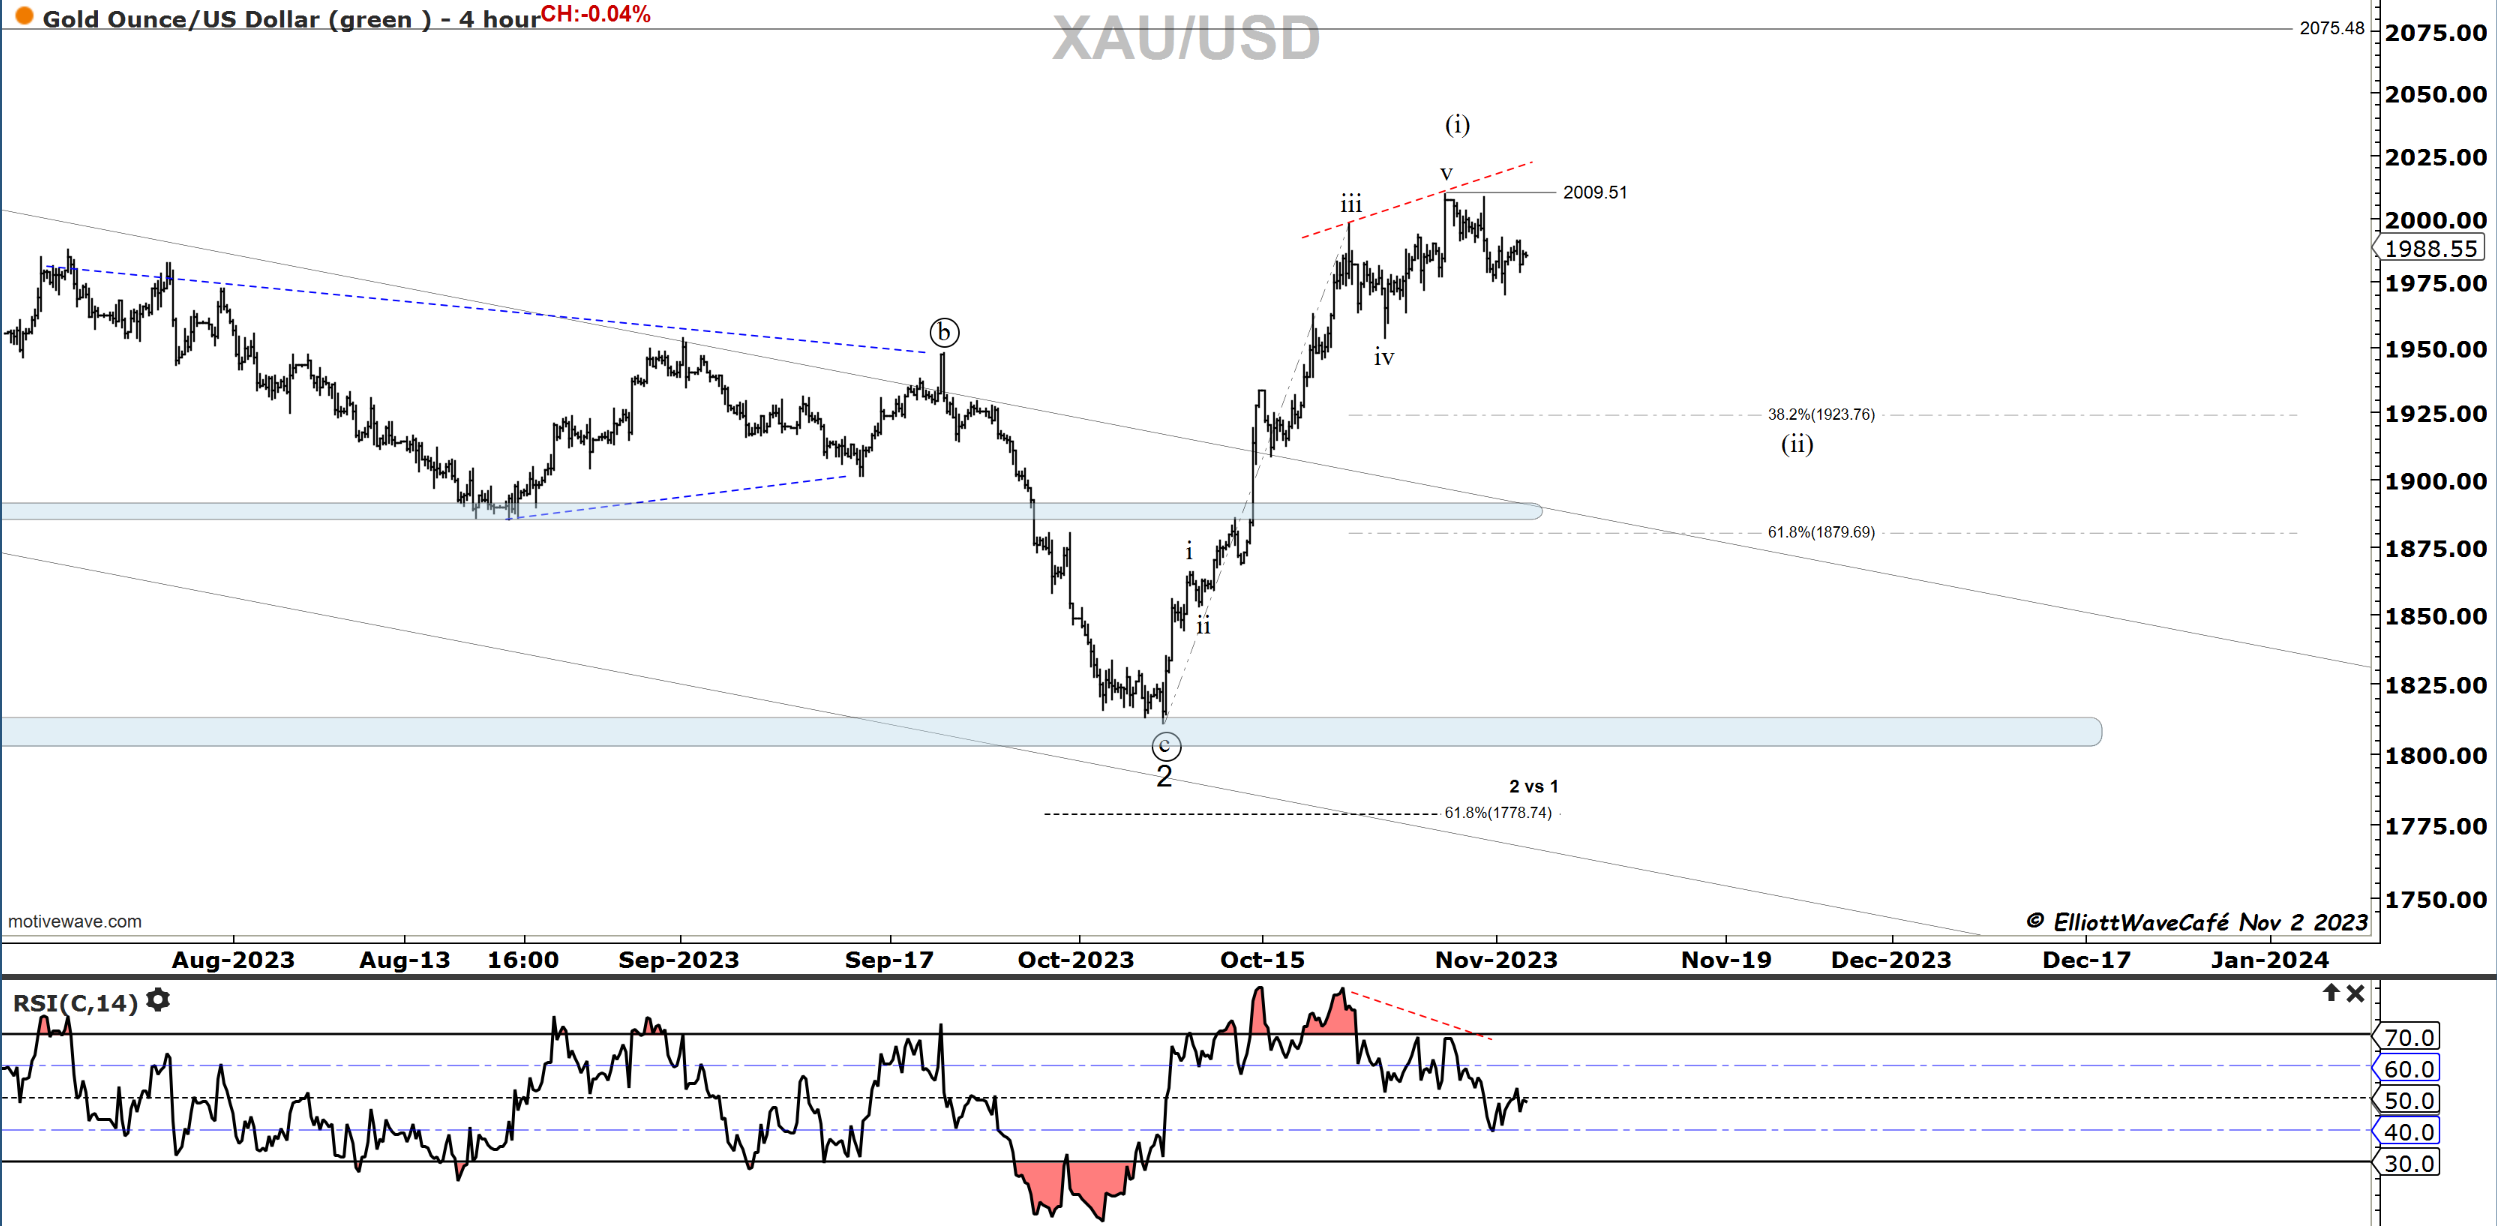
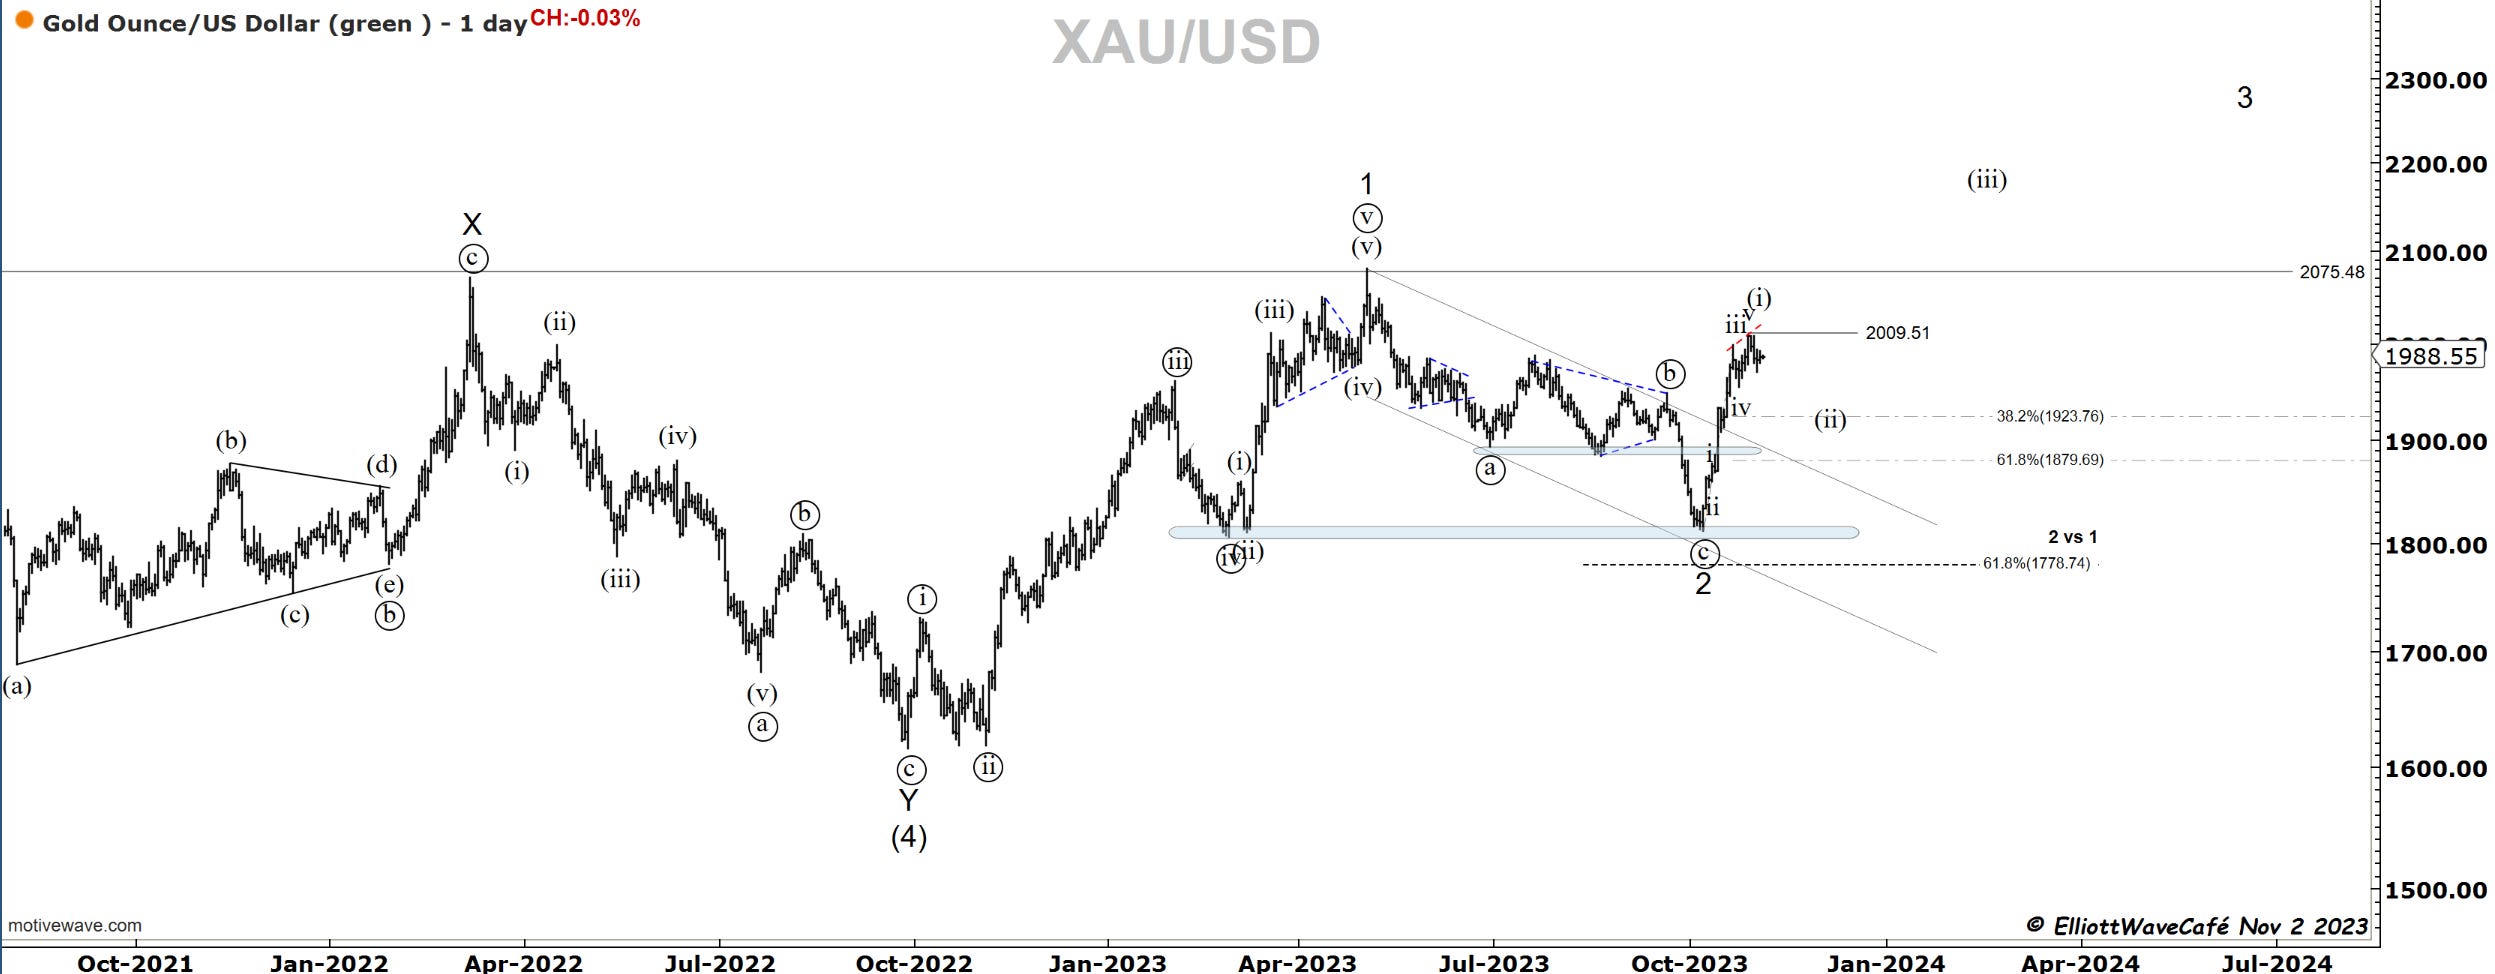
Gold
Gold is out of the picture for a while as it continues to correct the initial advance. Once wave (ii) shapes up a bit more, we can start thinking about the long side once again.
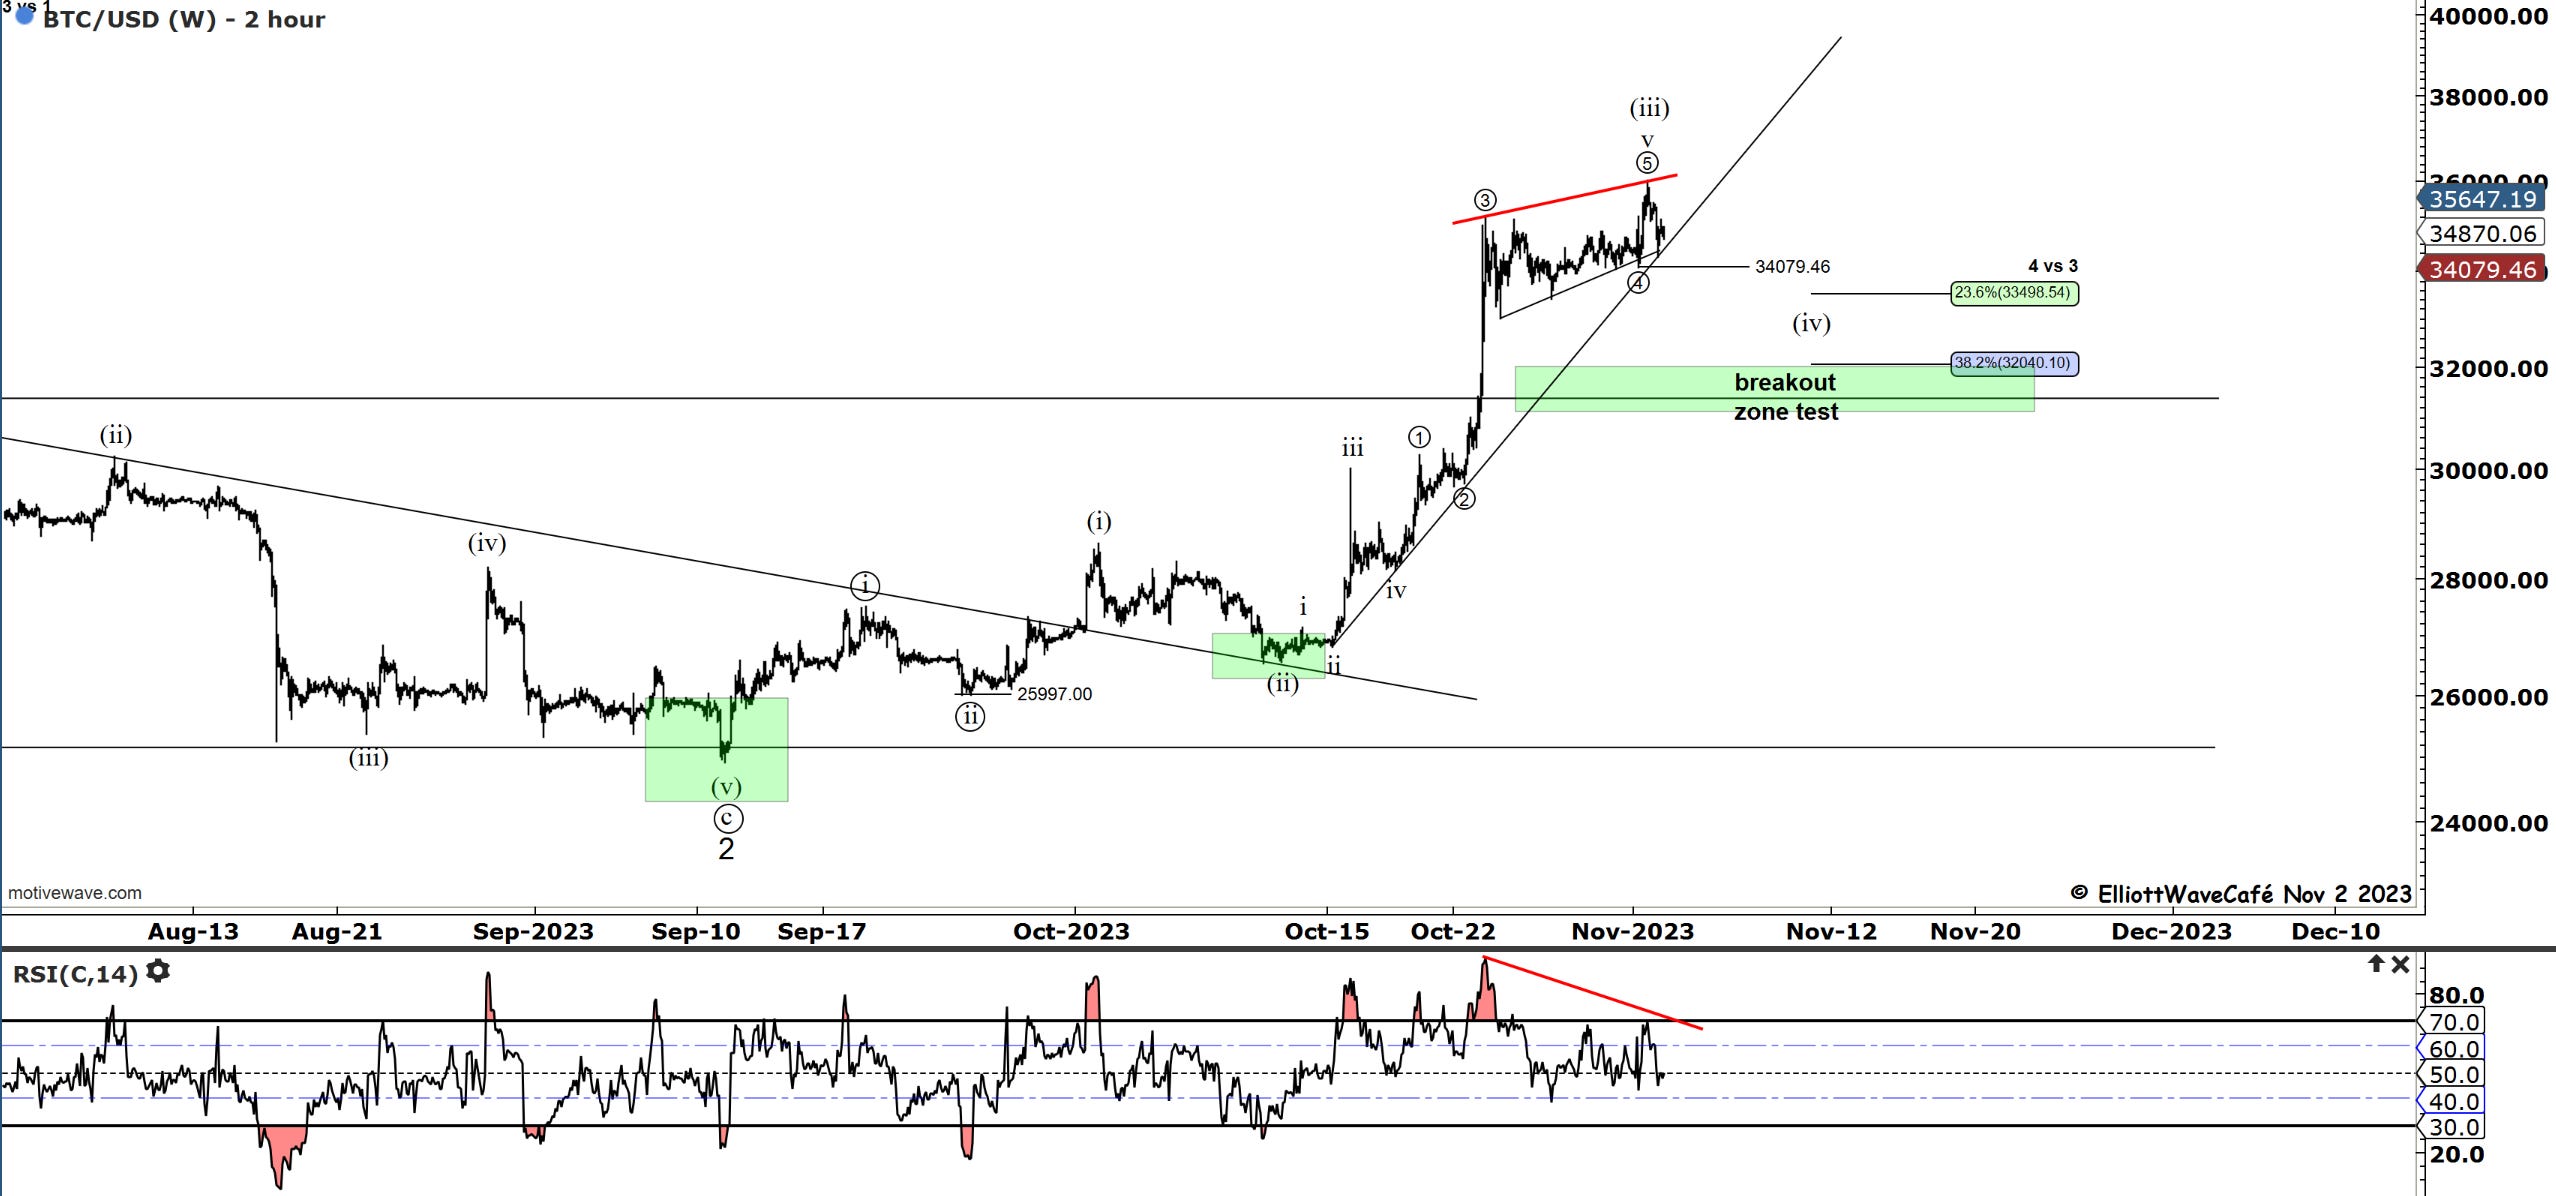
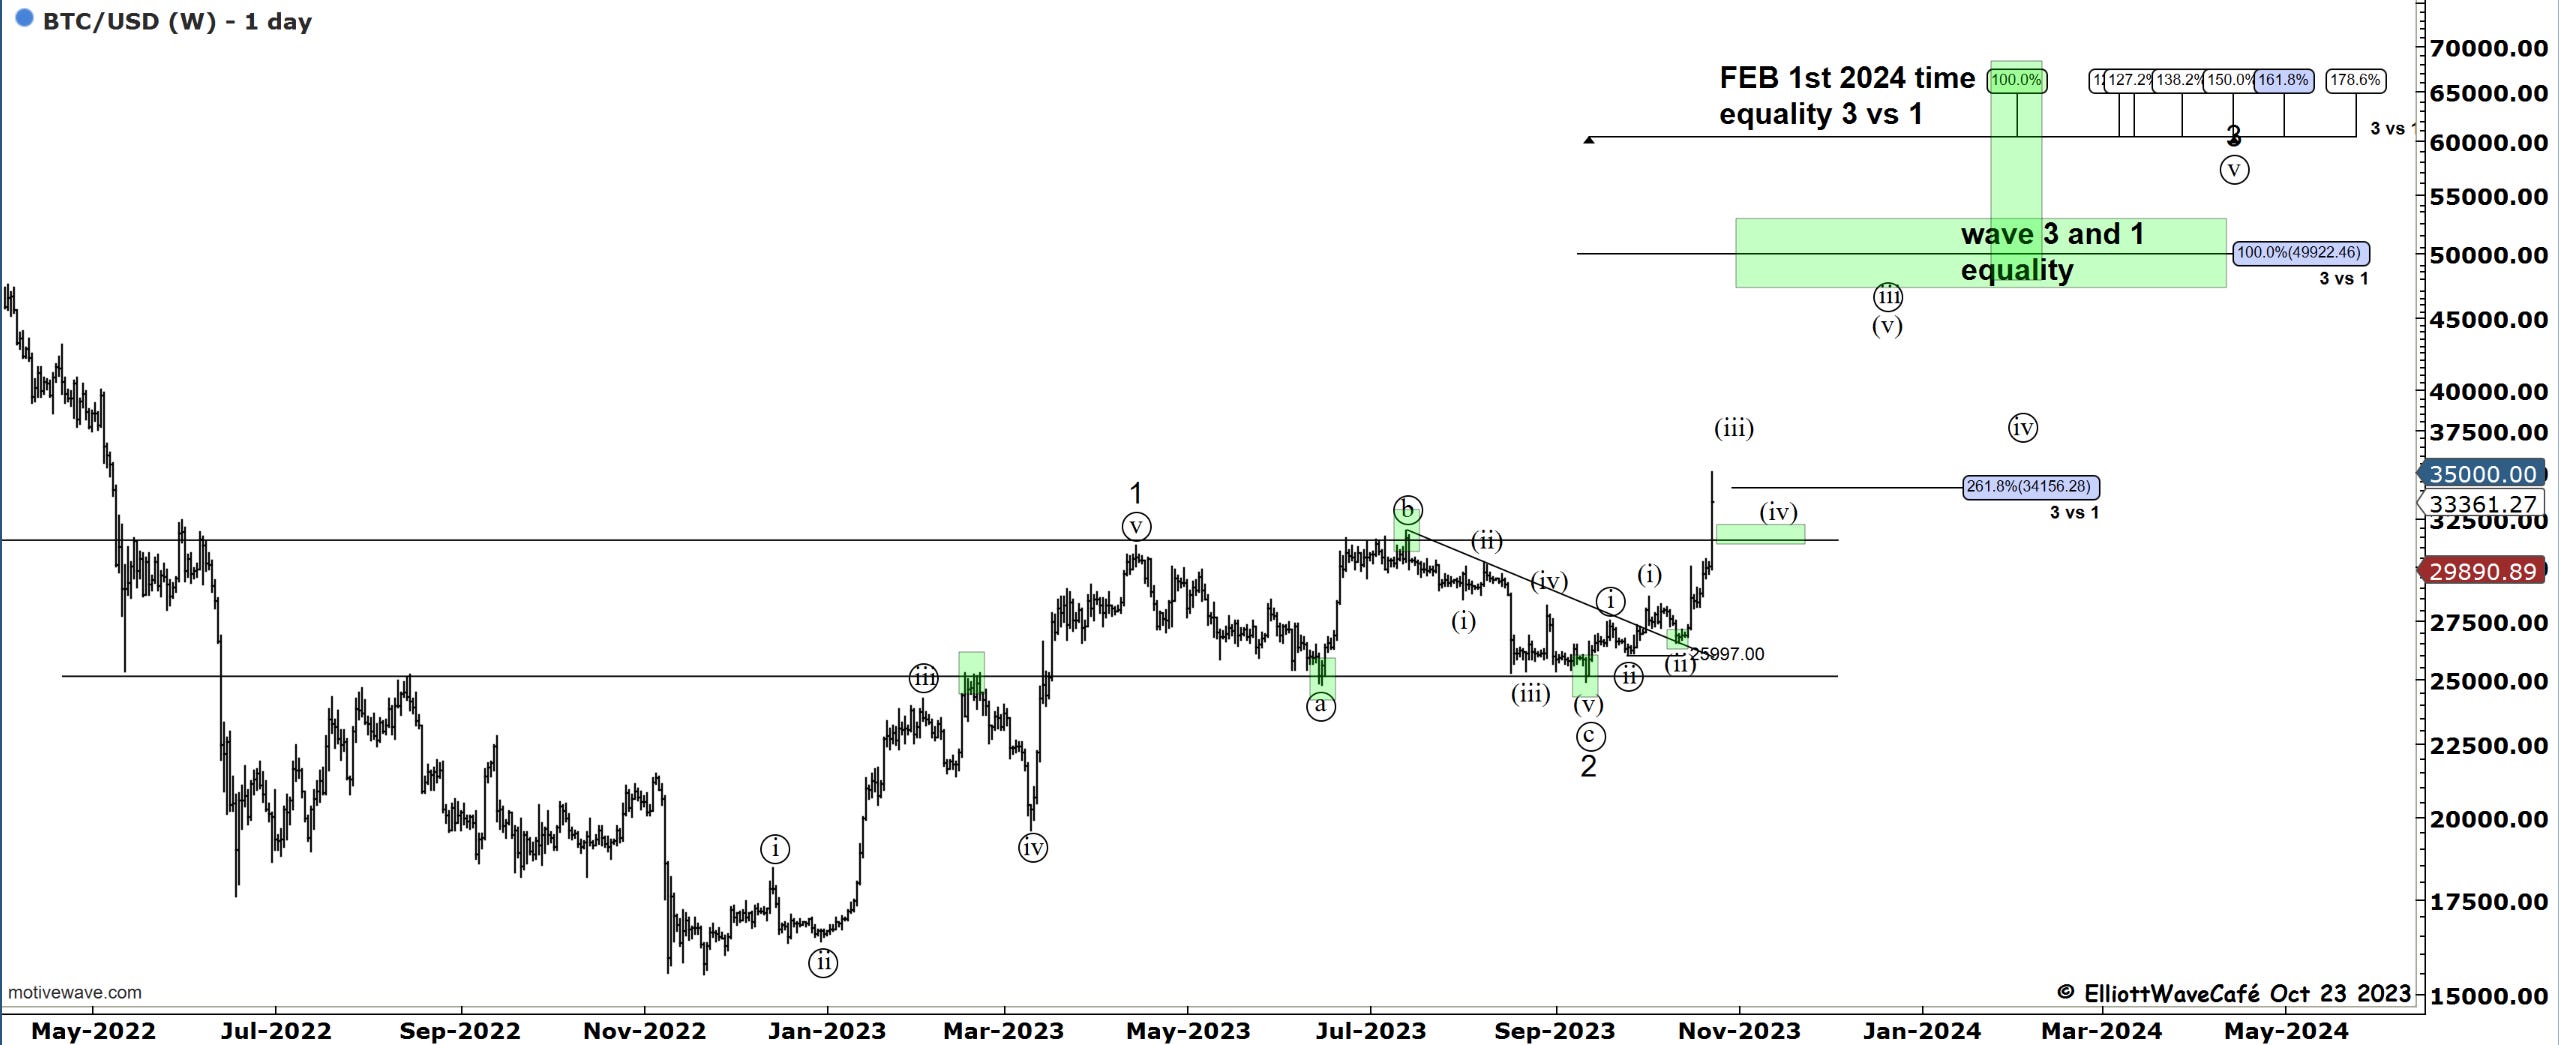
Bitcoin
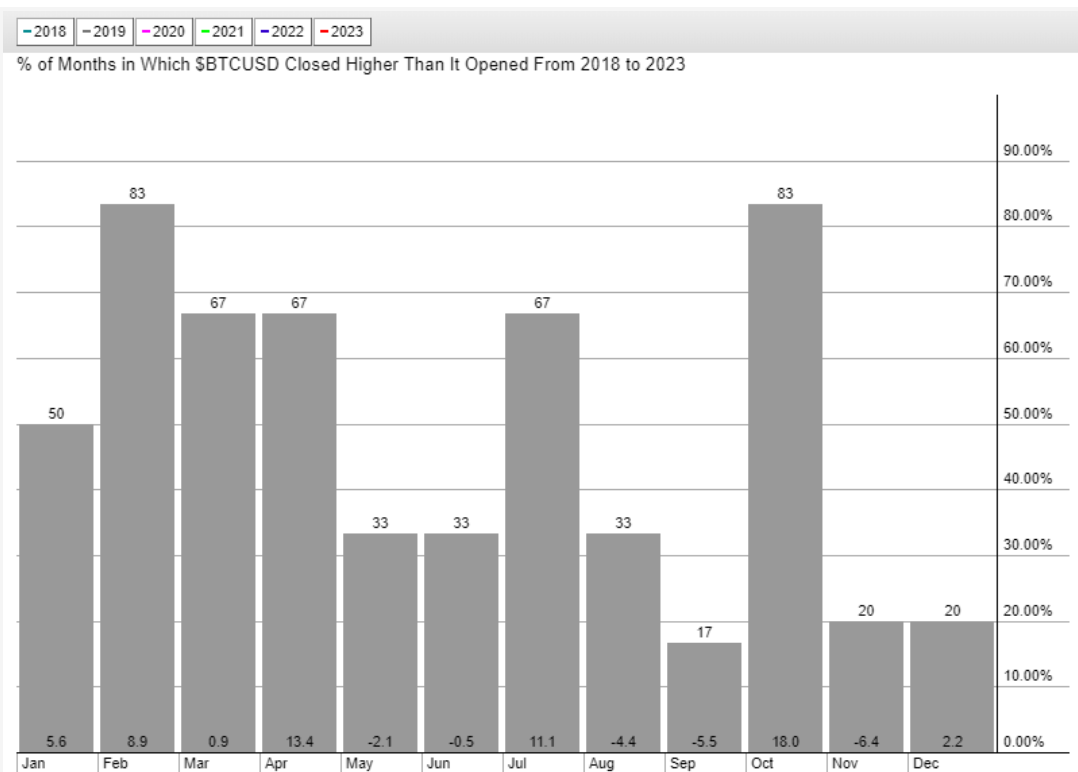
Prior comments on BTC remain valid. It appears that we had a quick break out of the triangle and a selloff. The divergence in RSI combined with a higher high in wave ((5)) suggests we should be entering into a period of correction in wave (iv) for BTC. Cycles analysis and seasonality would support such a view as well.
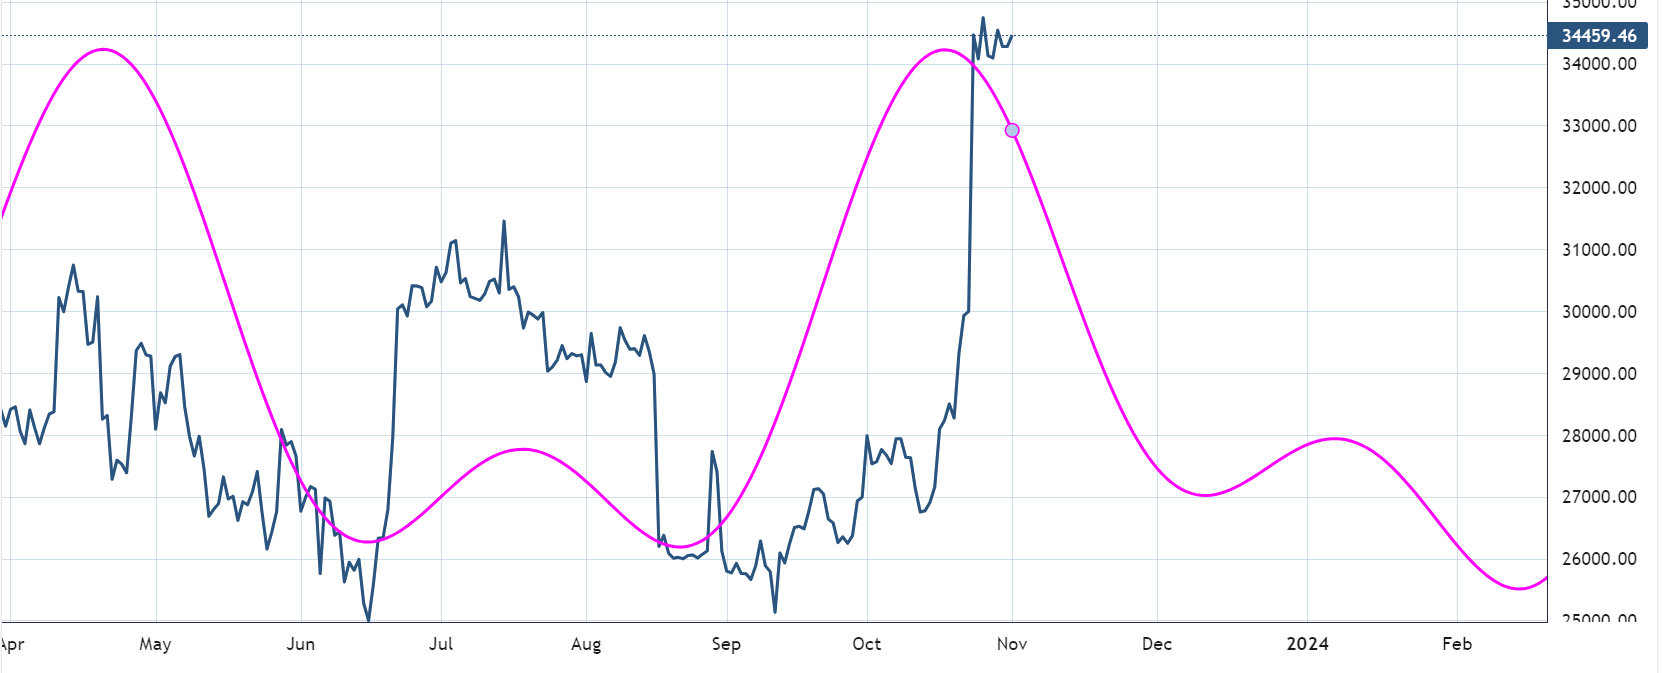
As discussed in yesterday’s piece, ascending triangles, as they call them in traditional TA, have a tendency to break upwards. The common expectation in EW after the triangle completes and breaks is for a reversal of prices into the next larger degree count. In our case, it is wave (iv). Even if this travels much higher, and I am wrong on the count, my suggestion is to keep trailing stops close and bail below 34k. Sometimes, these triangles appear in the middle of the move, which means there is the possibility of BTC running fast to 42k. It’s a tough bet to make after it already rallied over 7,000 points. Also, I have taken a quick glimpse at seasonality in BTC and it shows me quite a bit of underperformance from roughly Nov 9th to Dec 12th. I remain bullish on the larger structure, pending the usual corrections slowdowns.
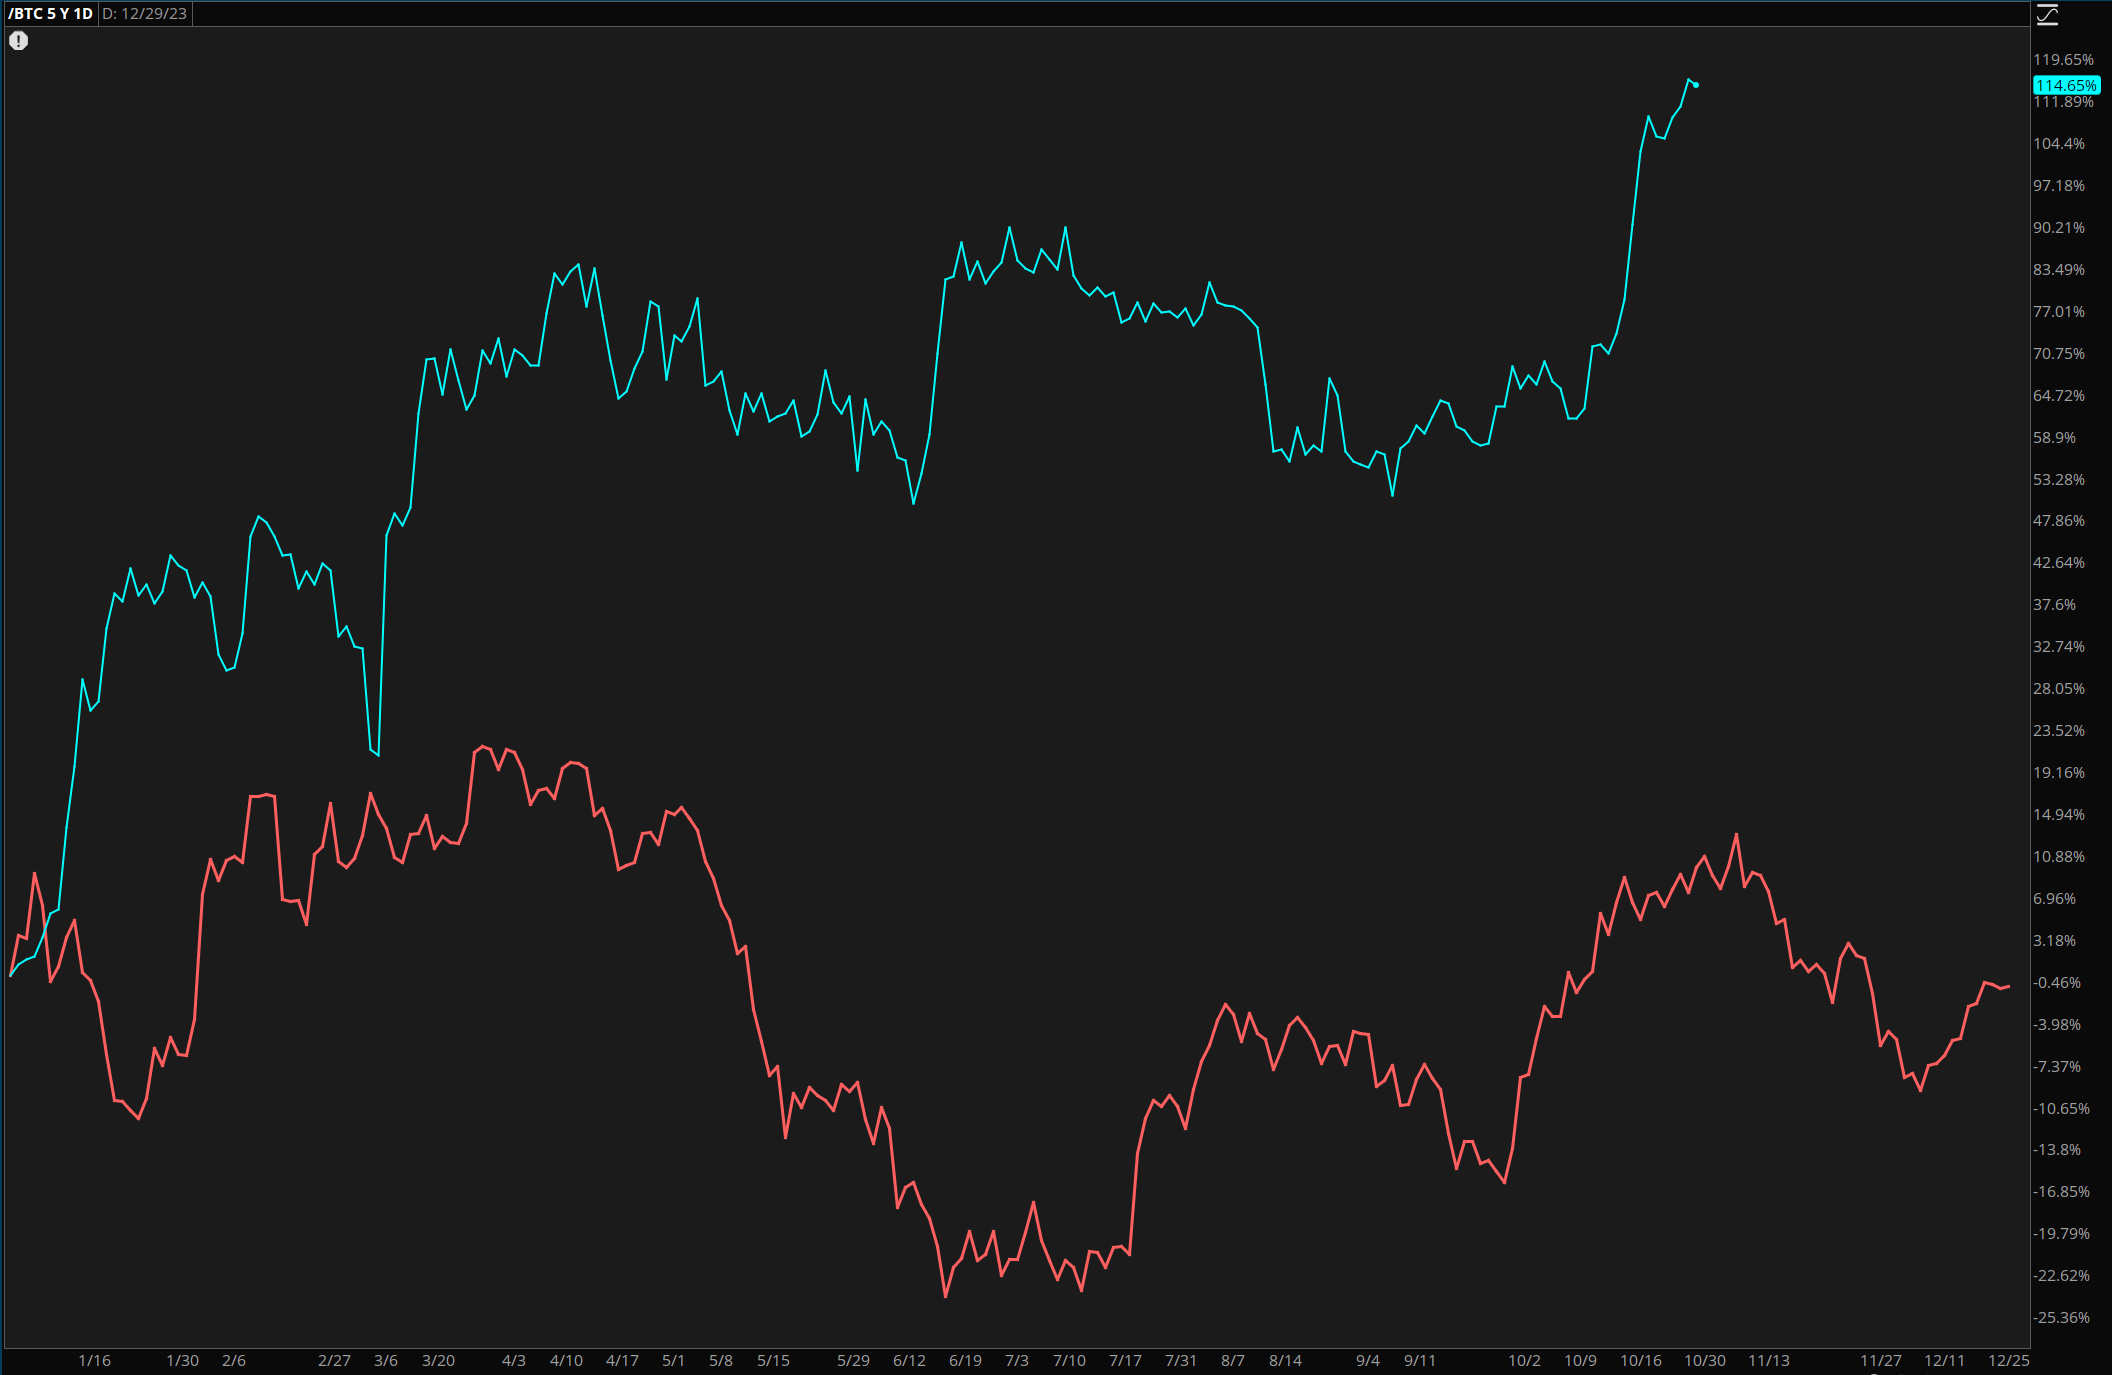
My cycle composite work suggests a period of upcoming weakness as well. Do not look at the price levels shown by the magenta line, but rather the time aspect of it.
Daily video coming up next,
See you all next week - trade well,
Cris
email: ewcafe@pm.me