
The Daily Drip
Core markets charts updates and commentary
Note: The counts on the right edge are real-time, and they are prone to adjustments as price action develops. Elliott Wave has a fluid approach, is evidence-based, and requires constant monitoring of certain thresholds.
In the counts below, this (( )) = circle on chart
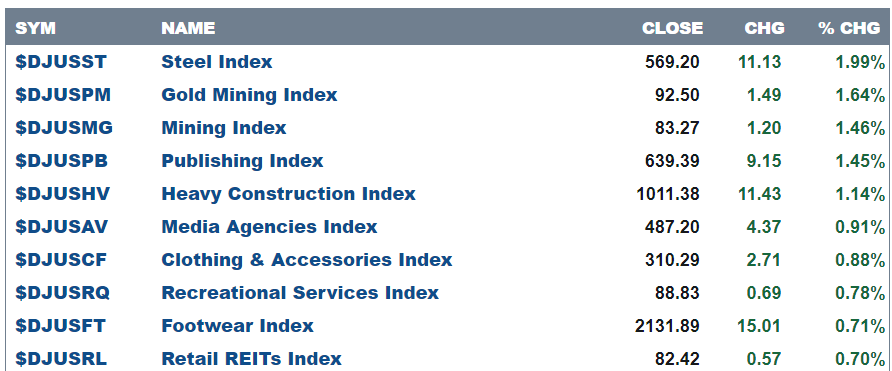
Here are today’s top 10 best performers out of 104 industries.
36 positive closes and 64 negative.
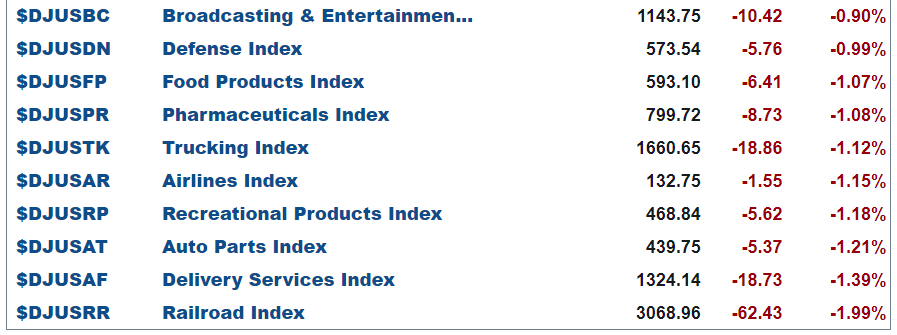
and bottom 10 …
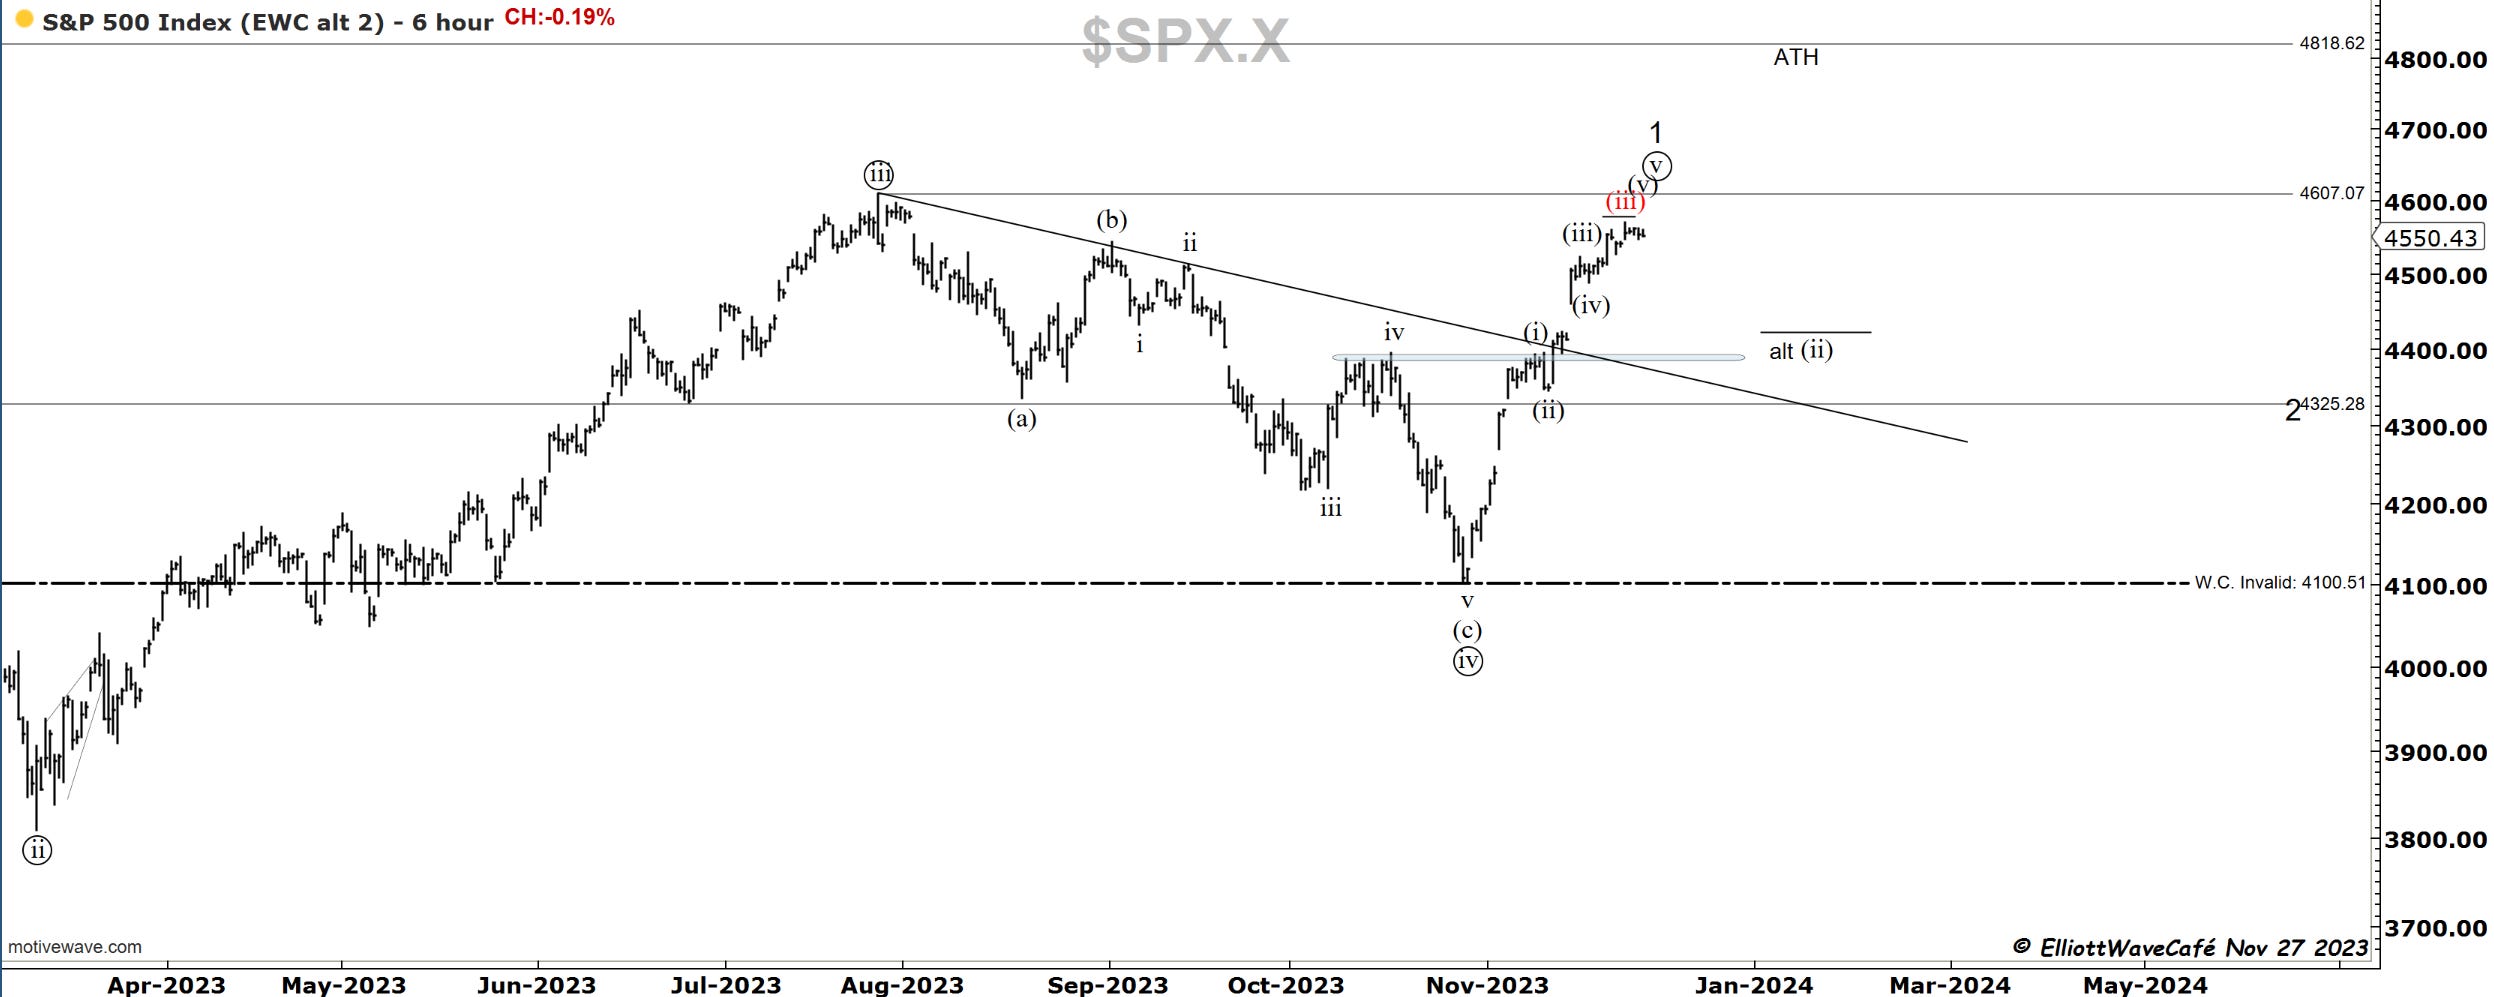
SP500
There wasn’t much action today to elicit a change in counts or perspective. This rally will soon enter a period of correction, be it a wave (ii) or a wave 2. The 4400 zone is what the market would target initially.
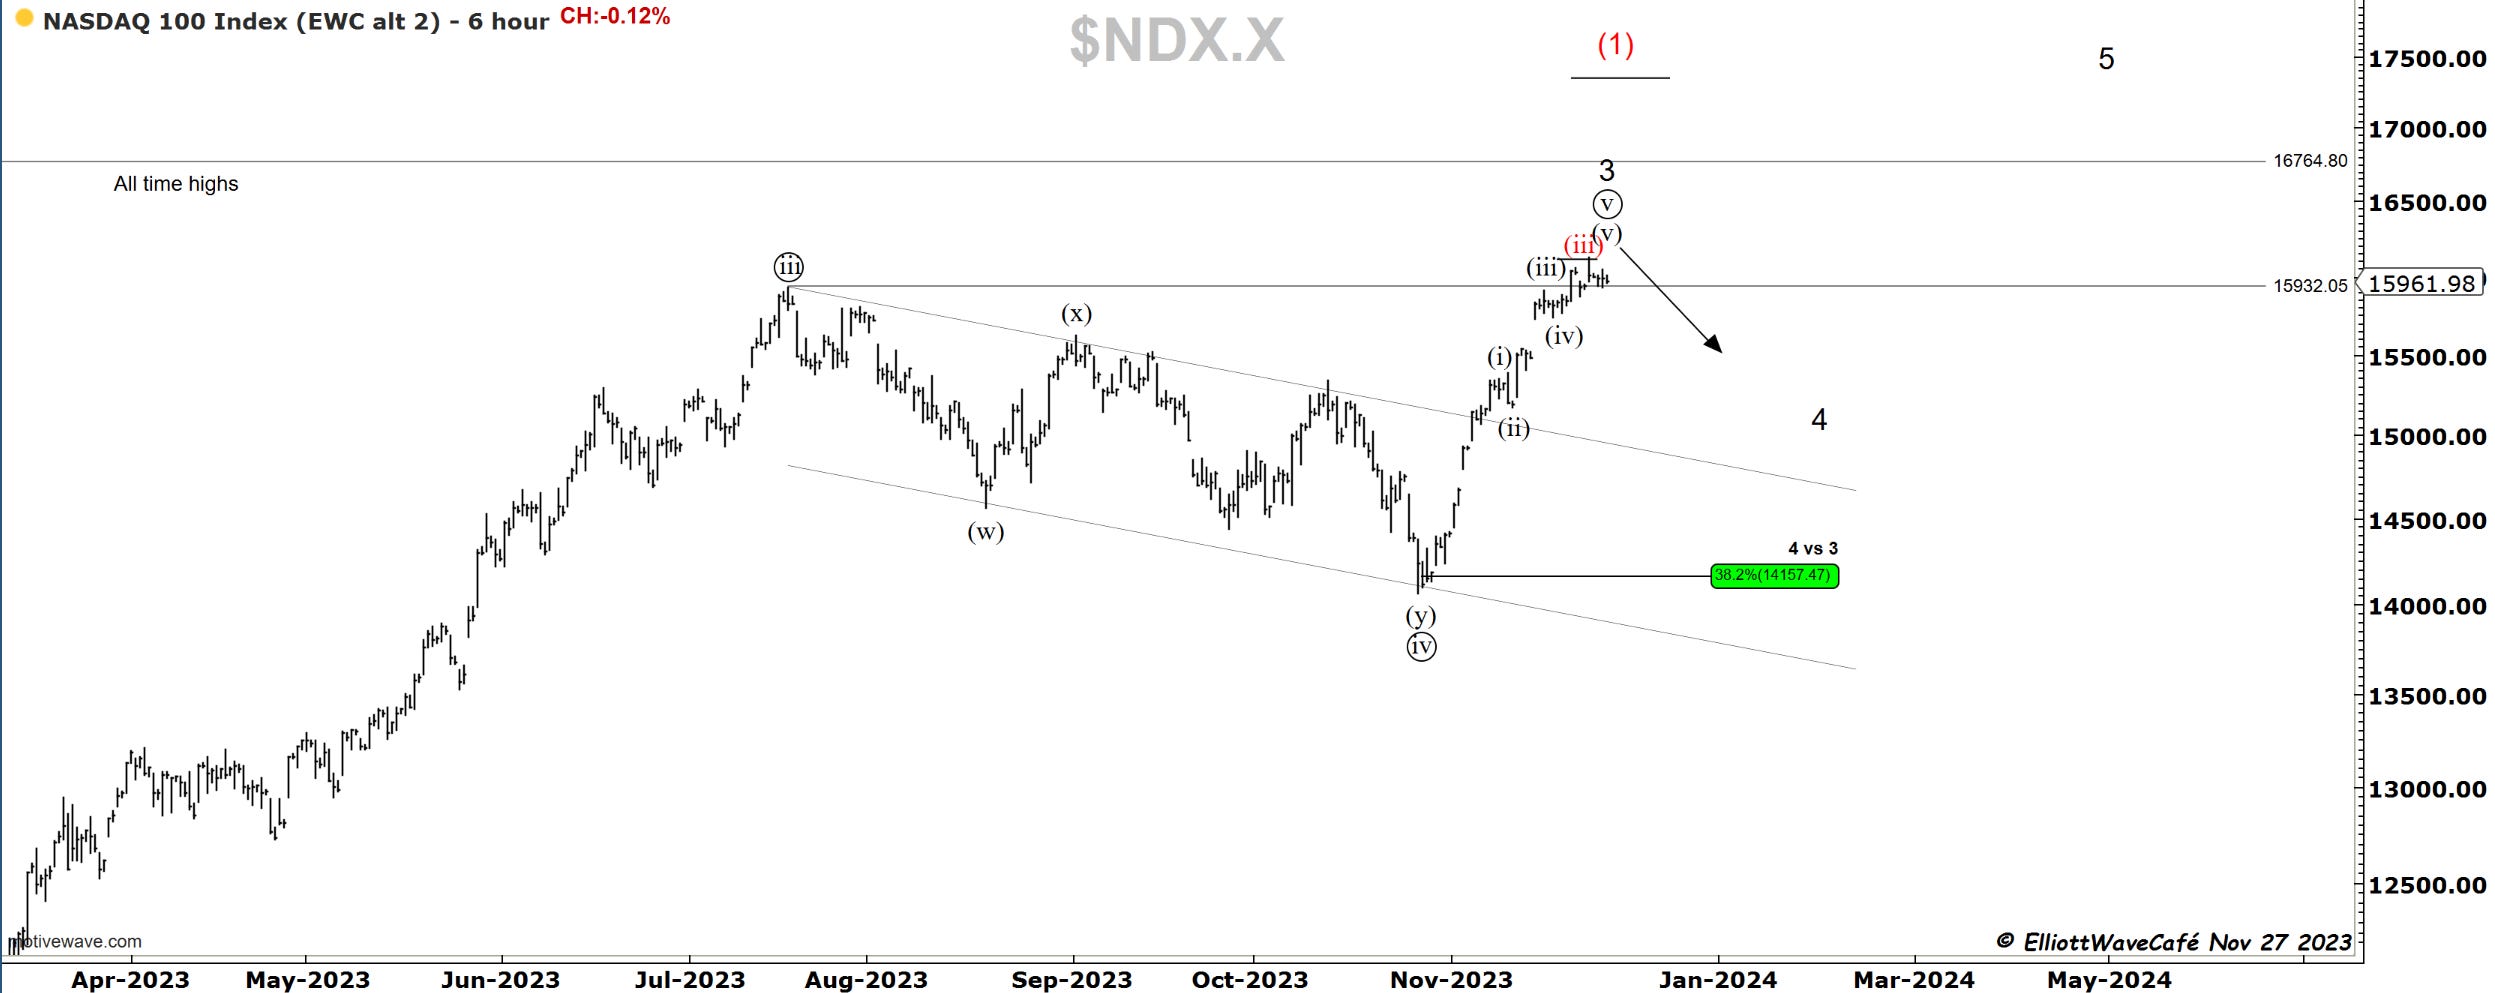
Nasdaq100
A sideways grind in the Nasdaq as well. Even though we did not make a lot of progress upwards over the past week or so, there is still no evidence of price reversal on the charts just yet. My thinking remains that’s around the corner, sooner rather than later. 15,500 is the first support.
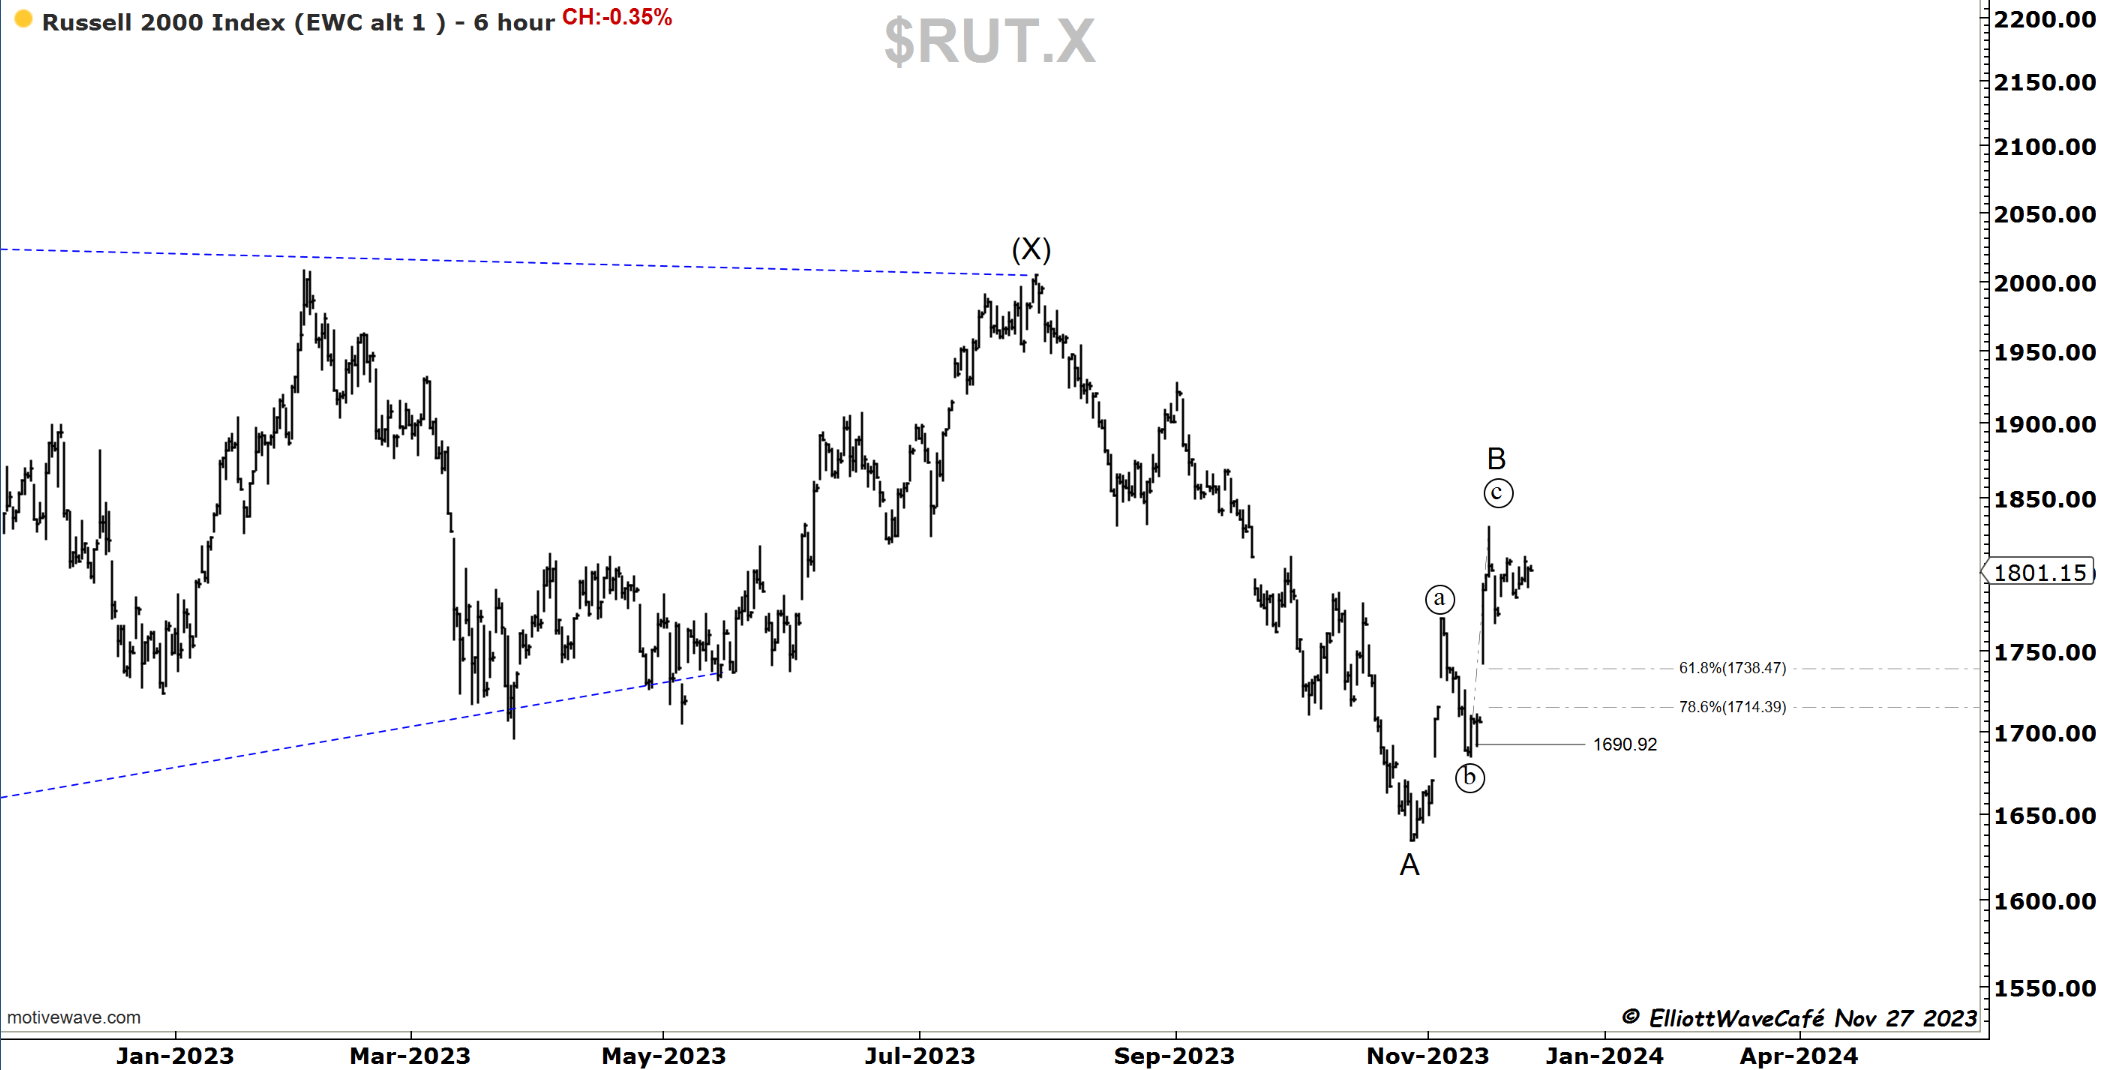
RUSSELL 2000
That price action in the small caps smells like a triangle. If we’re not closing below wave ((i)) high, it could actually be 5 waves from the lows with a triangle wave ((iv)). I will explain more in the video tonight.
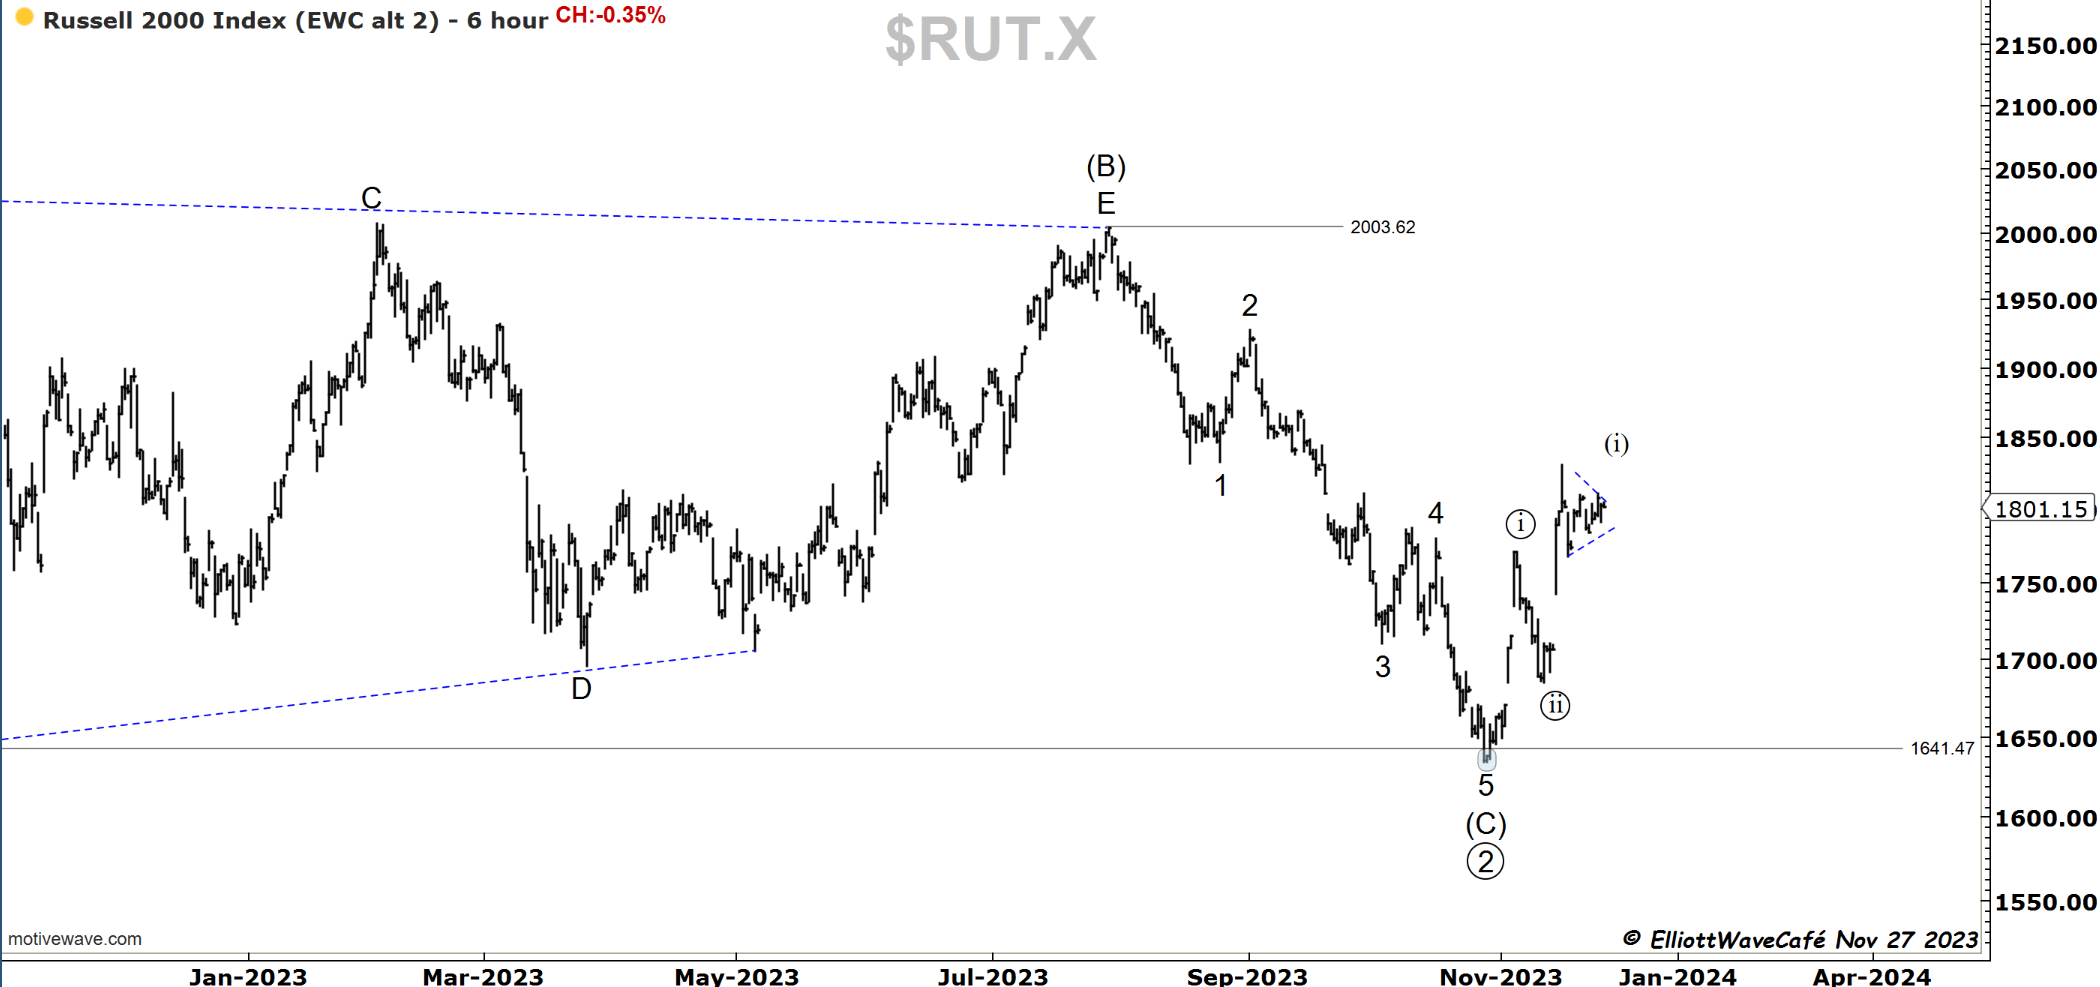
The three-wave setup still lingers on this count but has yet to gain any traction. Small caps sold off initially today, then recovered later in the day.

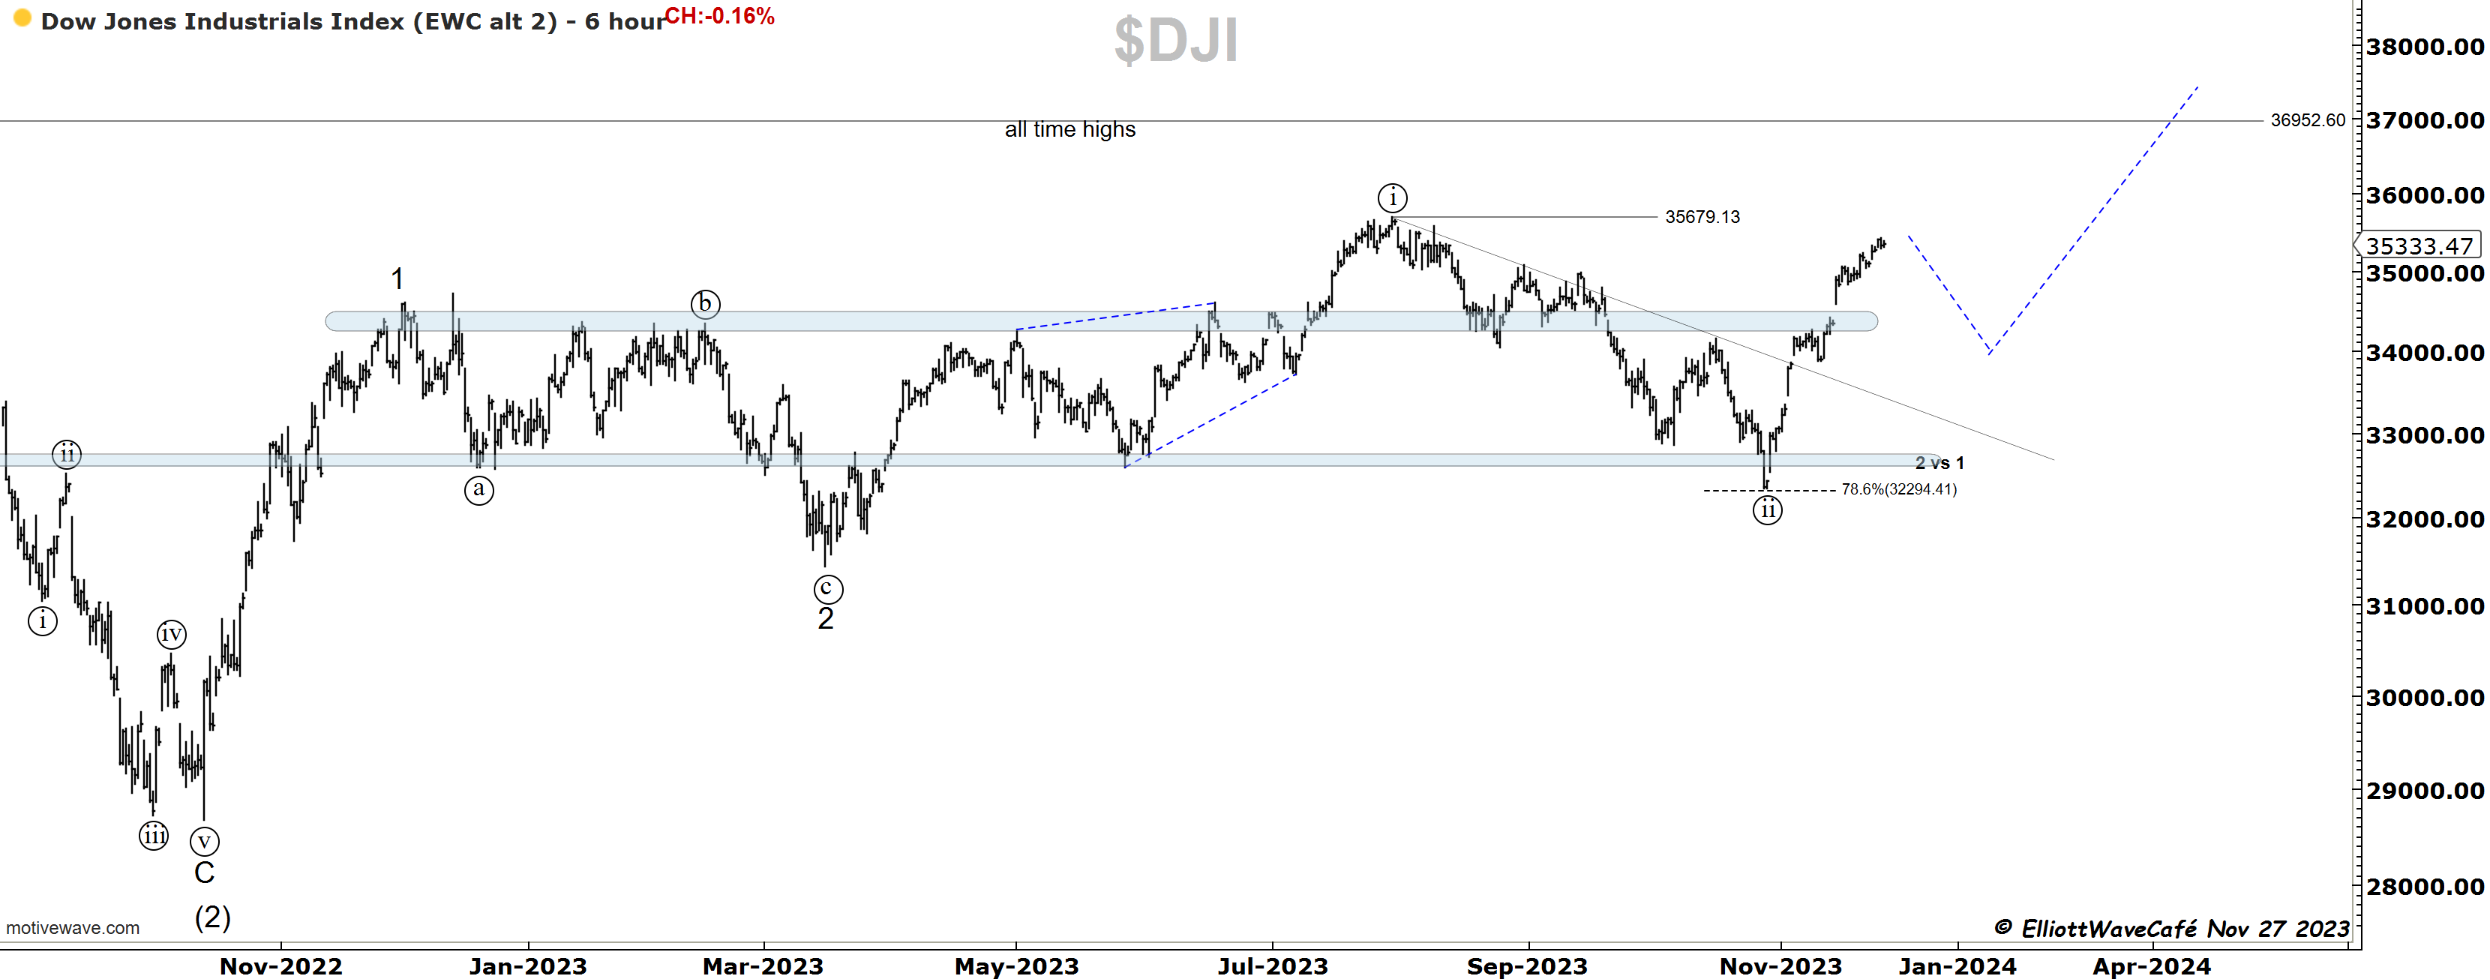
Dow30
The lack of a pullback makes it difficult to identify corrections, which are needed for wave labeling. In this rally since Oct lows, we’ve only had the one on Nov 9th that was more meaningful, everything else was very short and quickly bought. If this is the type of market that’s not letting people join, it sure acts like it. I guess when traders who can’t take missing another tick higher get in, that’s when we can begin correcting.
US Dollar and Yields
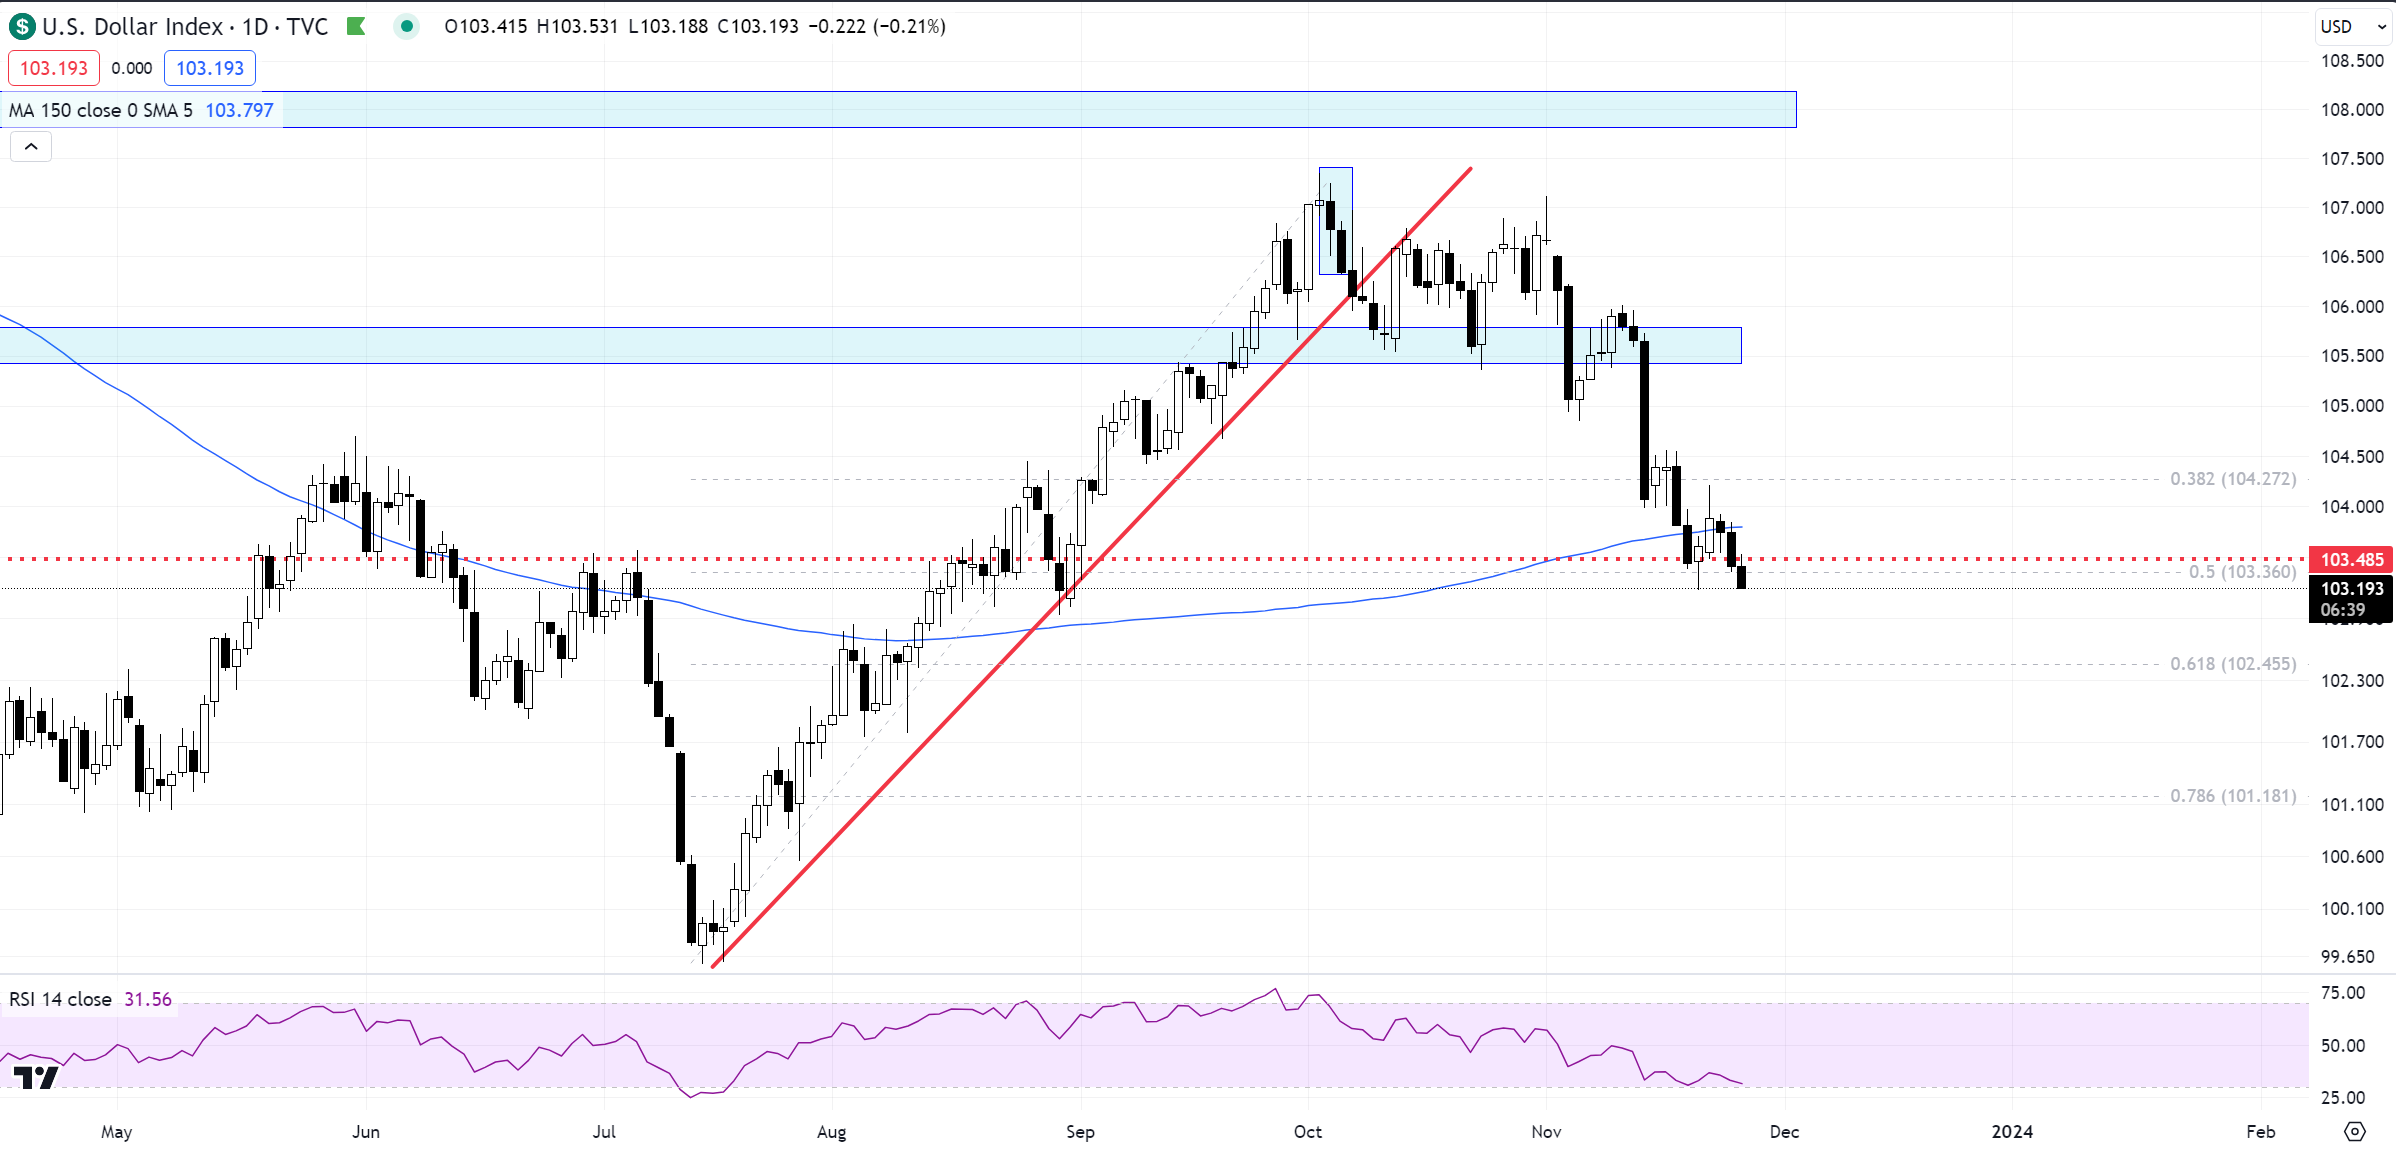
Two days of upside action it’s all we got from the dollar. It’s testing the lows once again in what seems to be an impulsive decline from the highs. The next level will be 61.8% near 102.50. Current zones are not appropriate for one to be initiating short USD positions. I for one, remain cautious and on alert for dollar bids. Yields are also near key zones, so bounces there will transfer to the greenback.
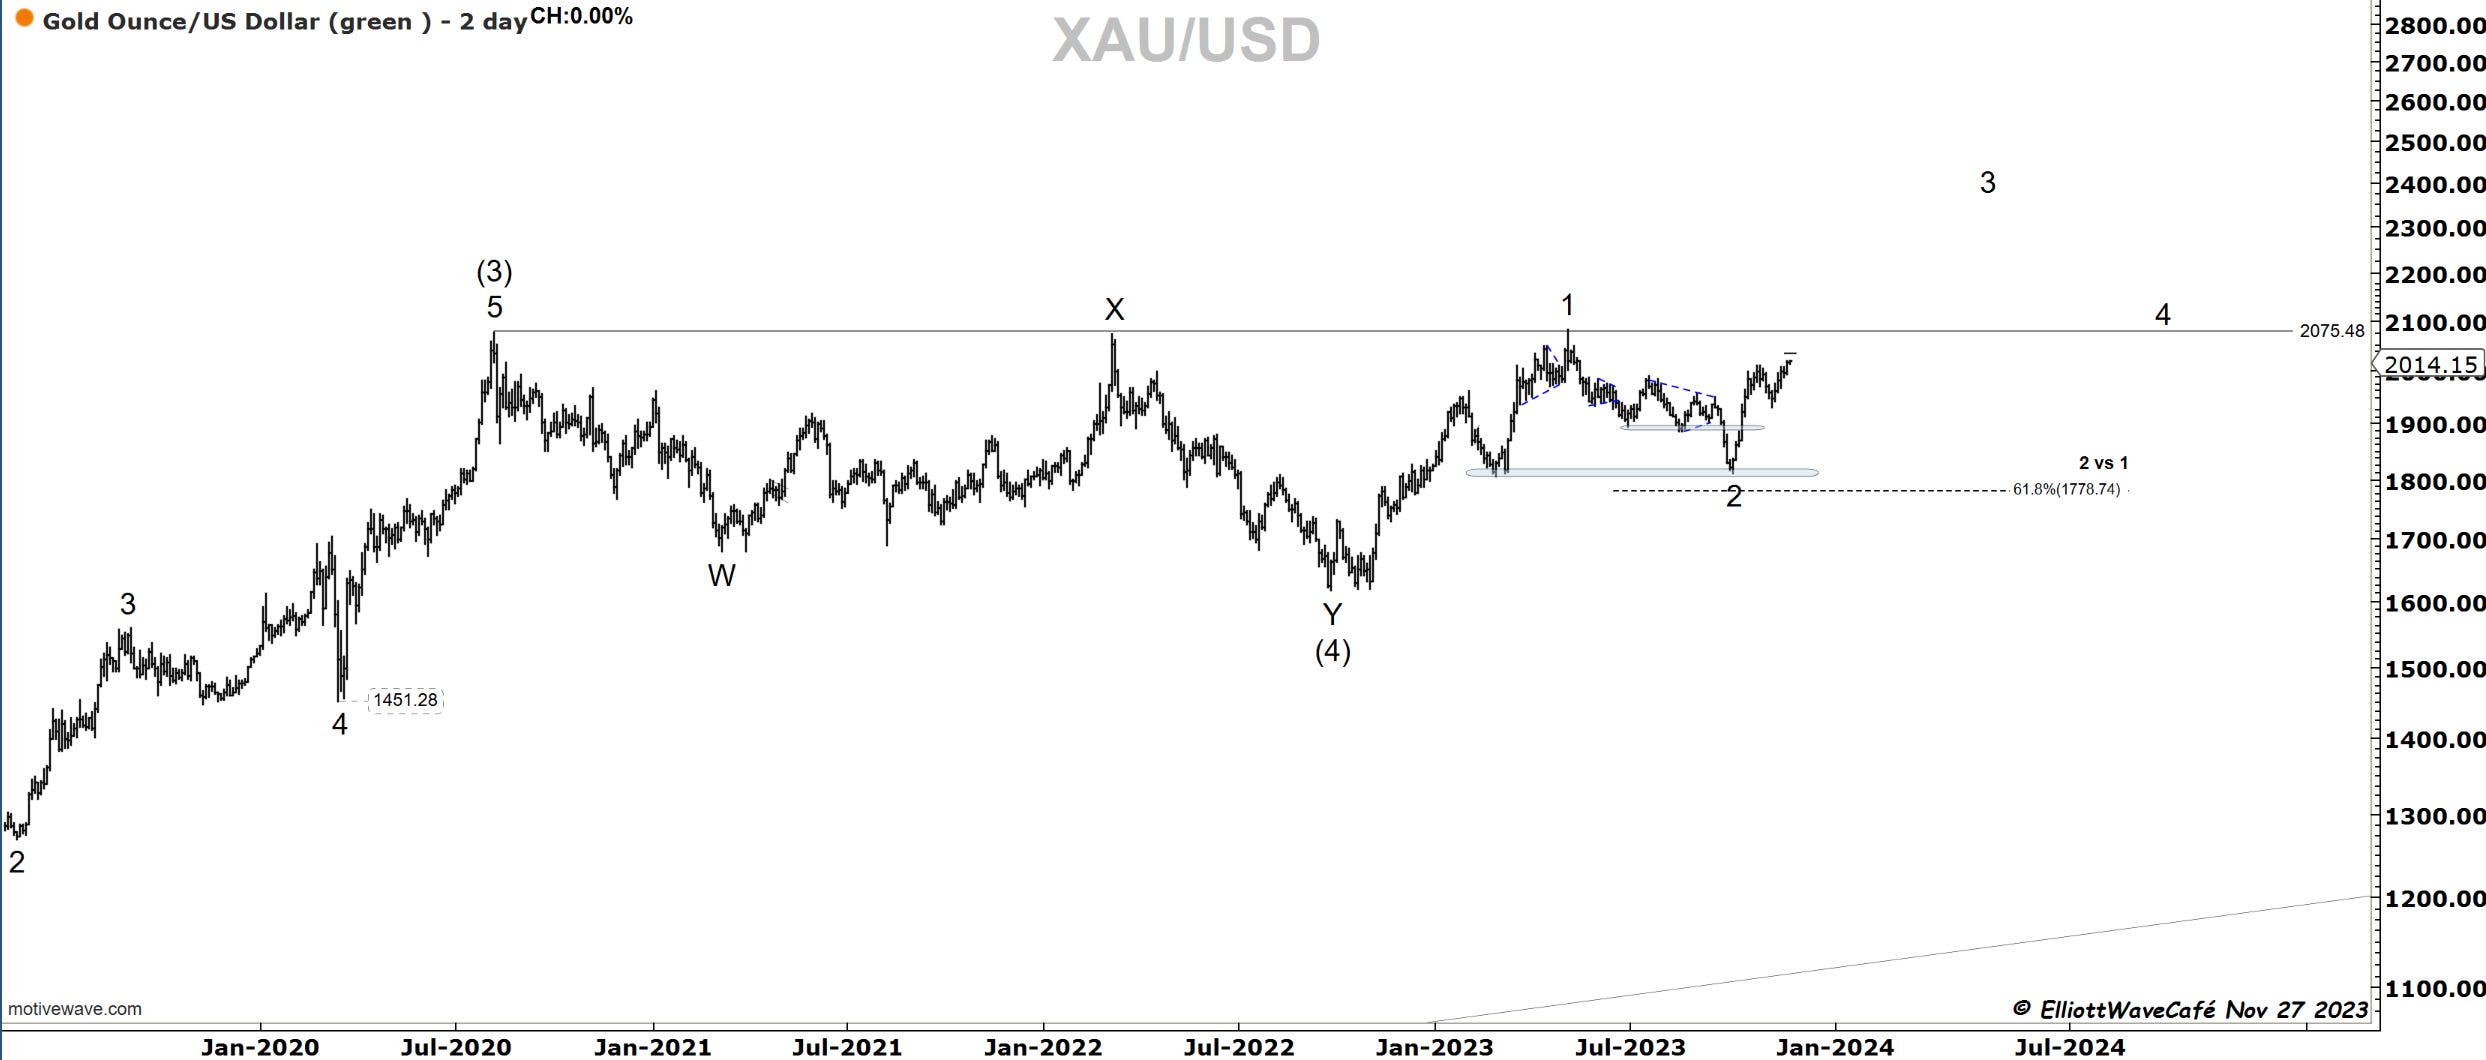
Gold
Gold has surpassed Oct 27th highs and the question now becomes, has a wave (iii) rally started? From a counting perspective there is a risk for a b wave of (ii) still in play. From a trading perspective, I would be careful with anything below 1965 if you initiated longs on this breakout.
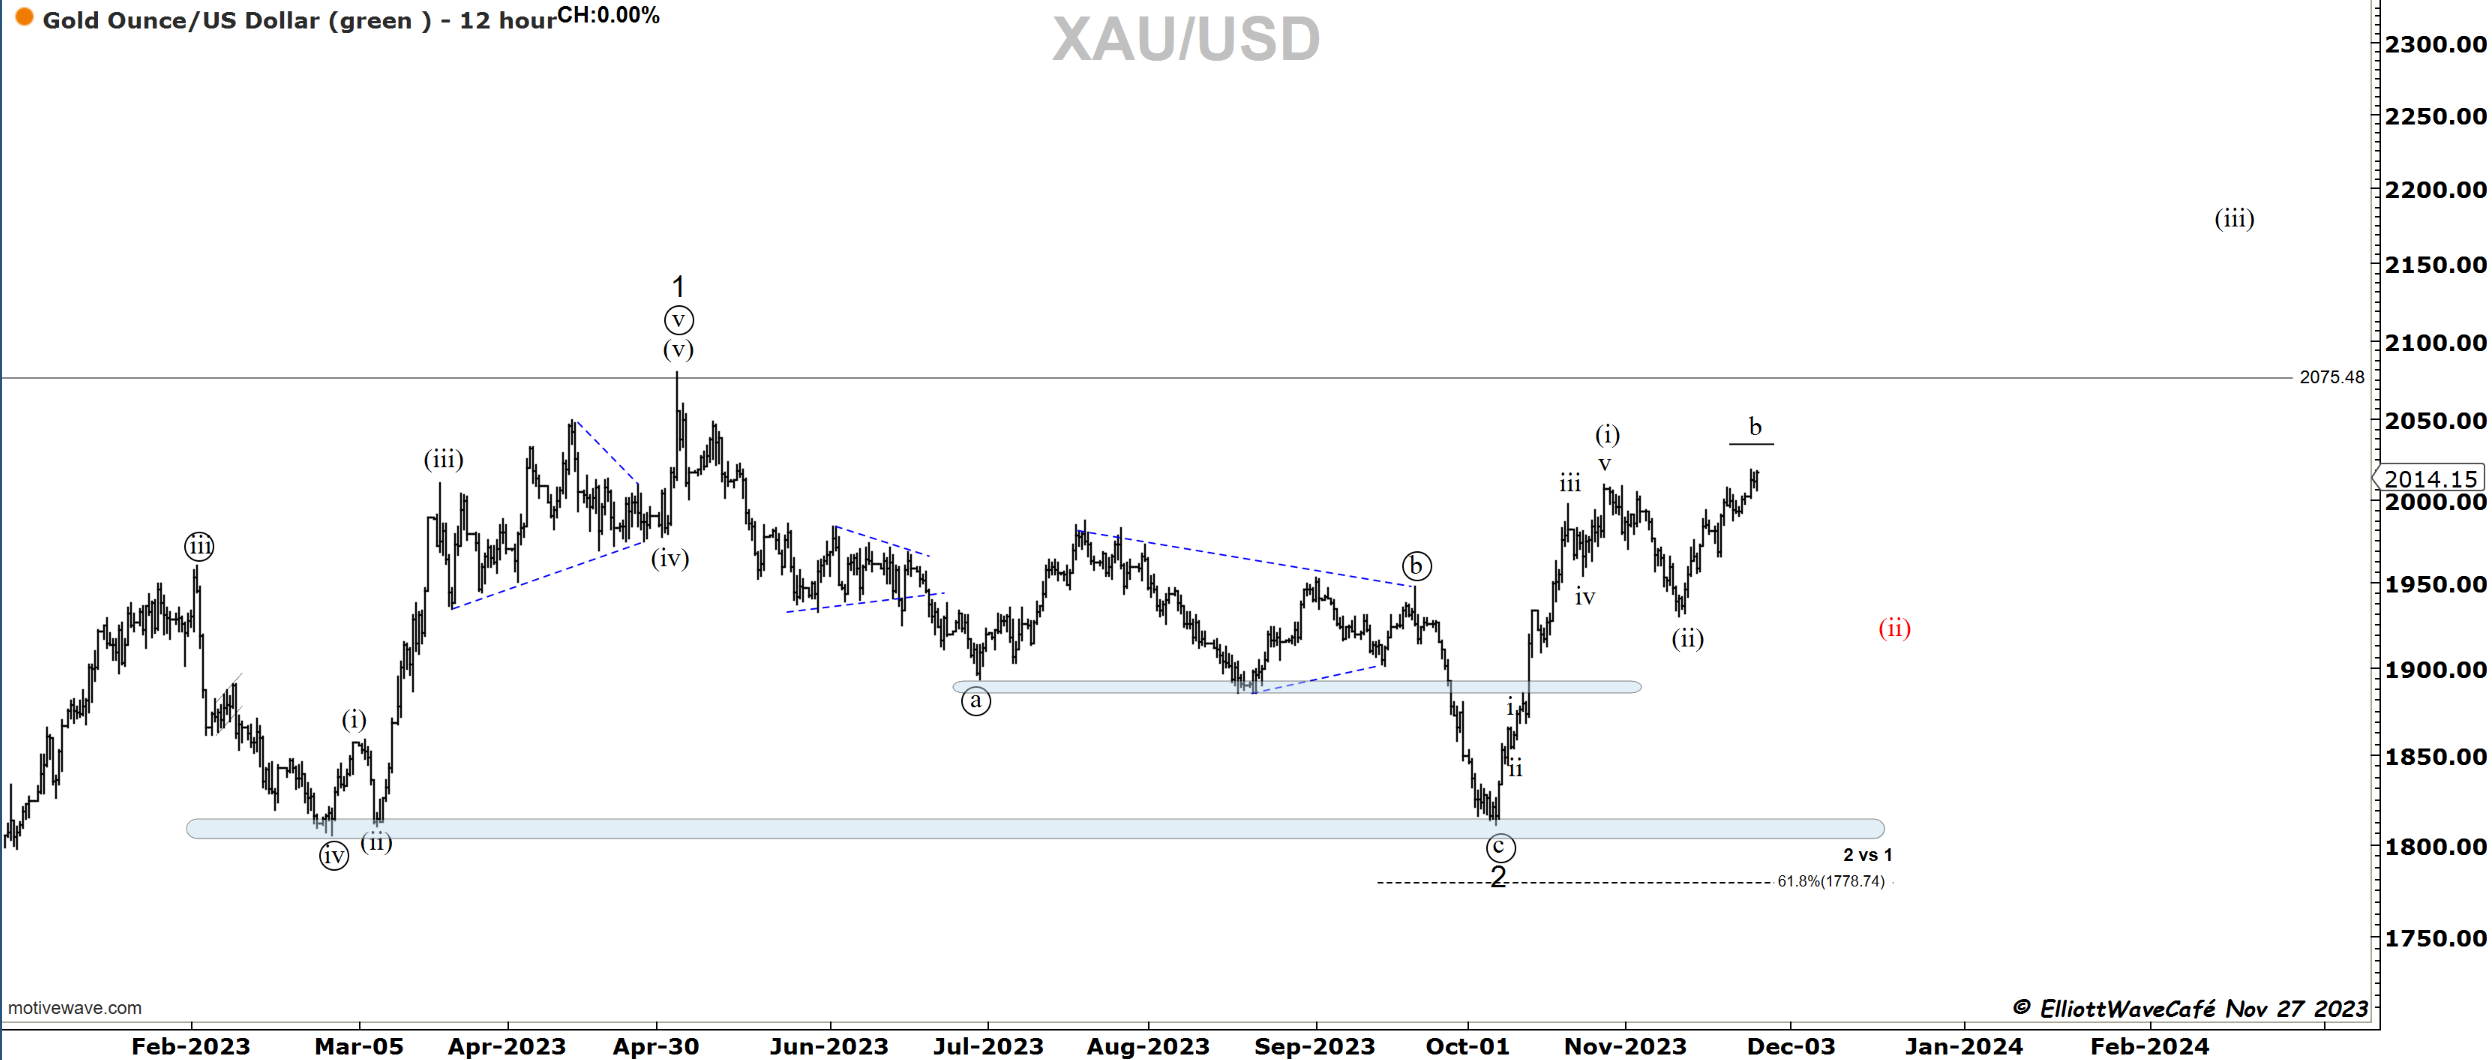
Will this be the time that Gold finally vindicates all the Gold bugs out there? It certainly has the looks of it. If this happens, what happens to the dollar? Based on my observations above on dxy, if it rallies then this gold spike is nothing but a b wave. A temporary setback however, before a larger breakout occurs.
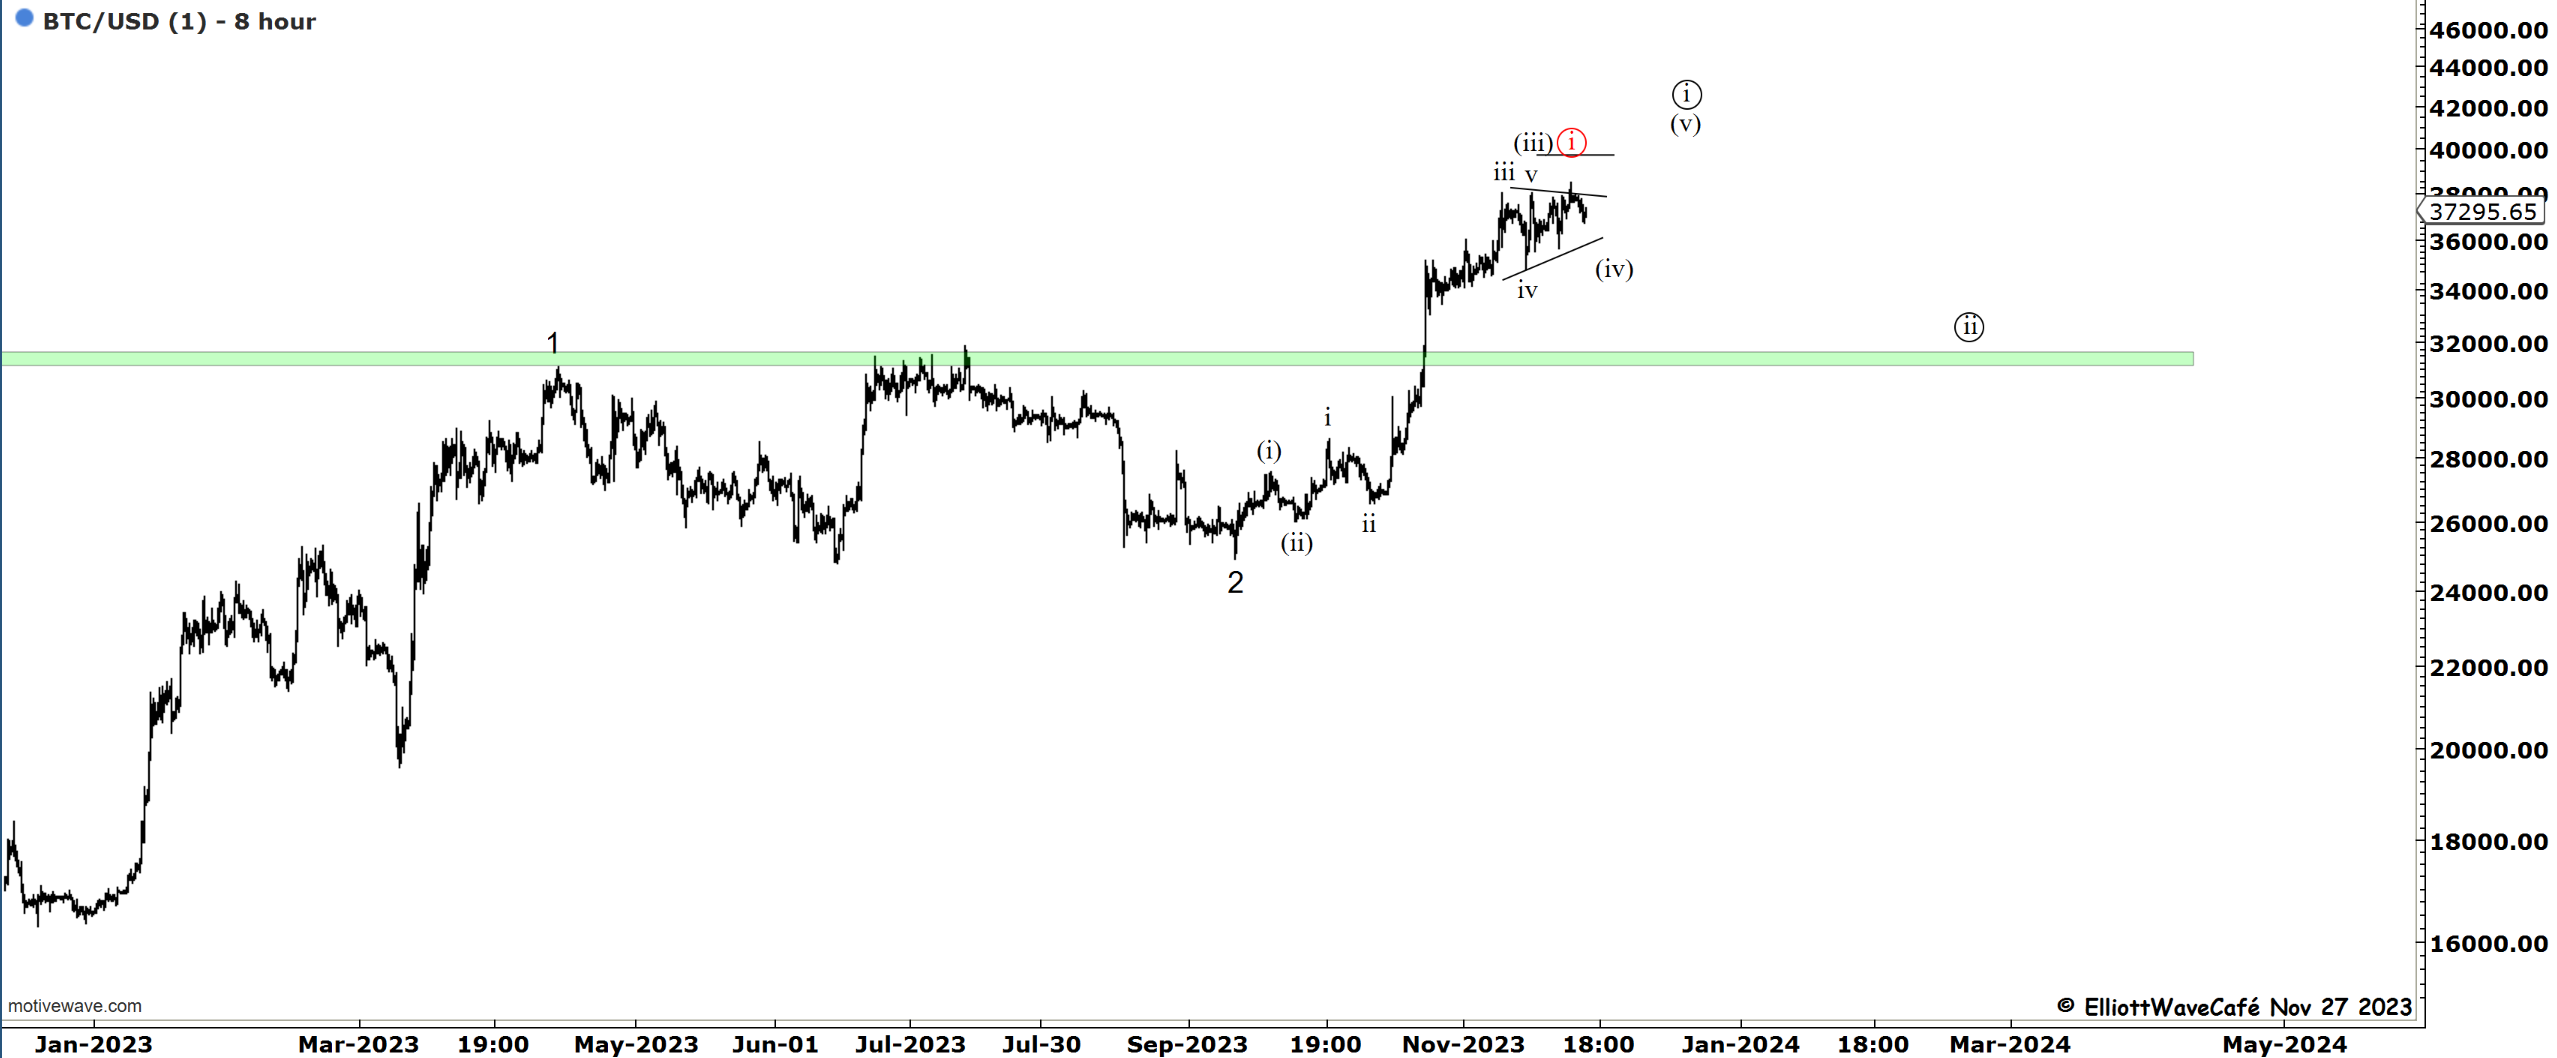
Bitcoin
There was another small high in BTC on Friday the 24th. We continue to develop in a very choppy yet up-ticking manner. Since there wasn’t much pullback, it could build explosive from here at any time. That would really mean a very short wave ((ii)) already established. It’s not something that I can fully get behind based on the price action up here and the structure of the waves. My expectations continue to be that a proper wave ((ii)) should unfold before we really take off in the next larger leg higher.
Daily video coming up next,
Have a great day wherever you are! - trade well, and don’t forget to subscribe and drop a like if this letter helps you in any way.
Cris
email: ewcafe@pm.me