
The Daily Drip
Core markets charts updates and commentary
Note: The counts on the right edge are real-time, and they are prone to adjustments as price action develops. Elliott Wave has a fluid approach, is evidence-based, and requires constant monitoring of certain thresholds.
In the counts below, this (( )) = circle on chart
SP500
Whatever was sold this morning got bought back by the time the session ended. The closes in the markets are always more important than the opens. That’s why there are bar charts available only with HLC. ( high, low, close).
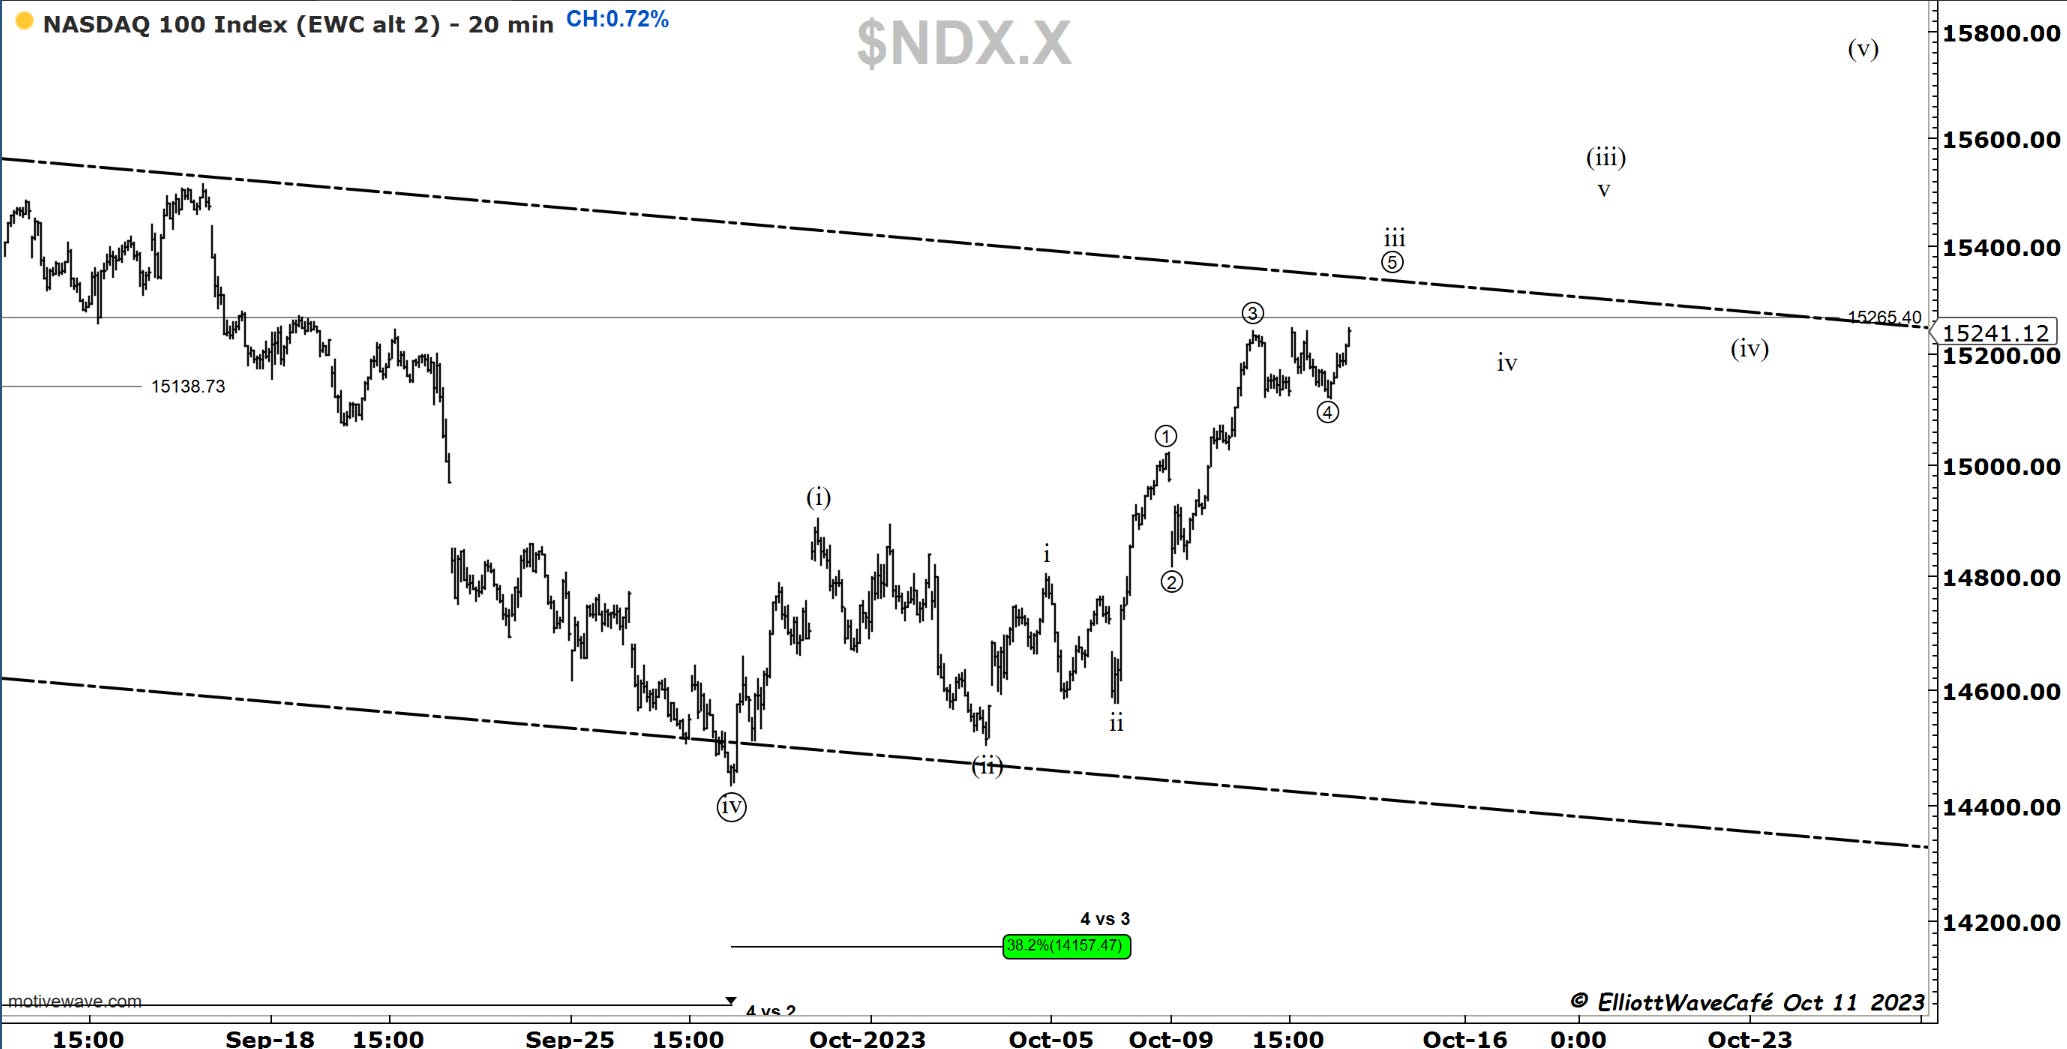
Wave ((iv)) was completed on OCT 3rd, and bulls have been in control since. No earth-shattering news is expected from the CPI tomorrow, and if they were, the market would have already priced that in. We should get some volatility, but as per counts, we will be resuming higher even after a potential selloff. Wave (i) seems to continue to work itself out in real-time, but we know that wave (ii), which no one knows what form it will take, will lead to wave (iii).
The market got washed out into the 150day MA, along with a number of stocks above the other key moving averages. What followed from an ultra bearish sentiment was a move in the opposite direction to correct that sentiment. What will follow next should be at least a bounce towards 60,70% levels in stocks above averages.
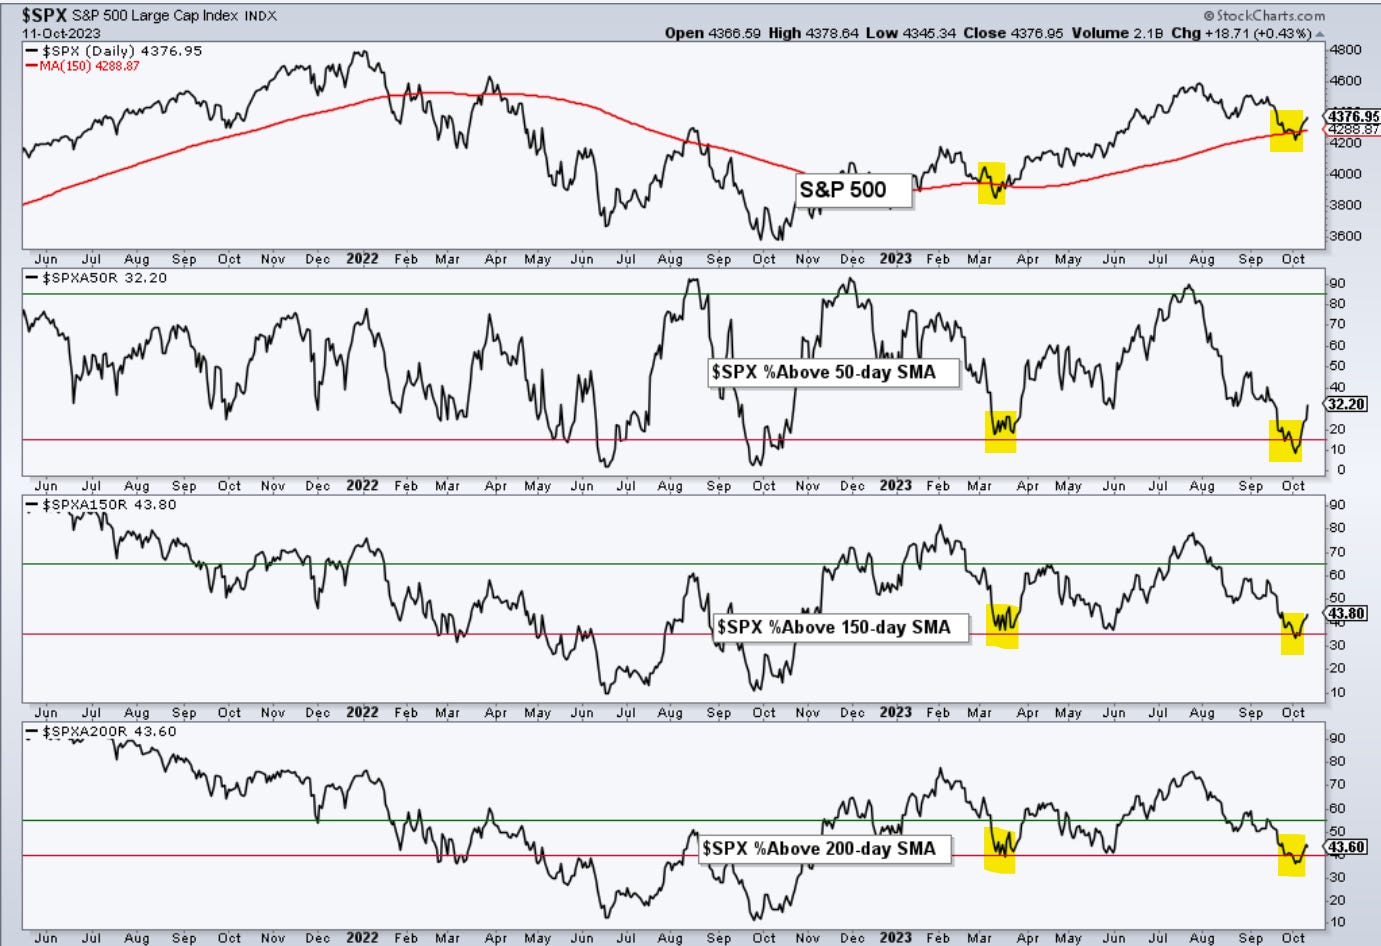
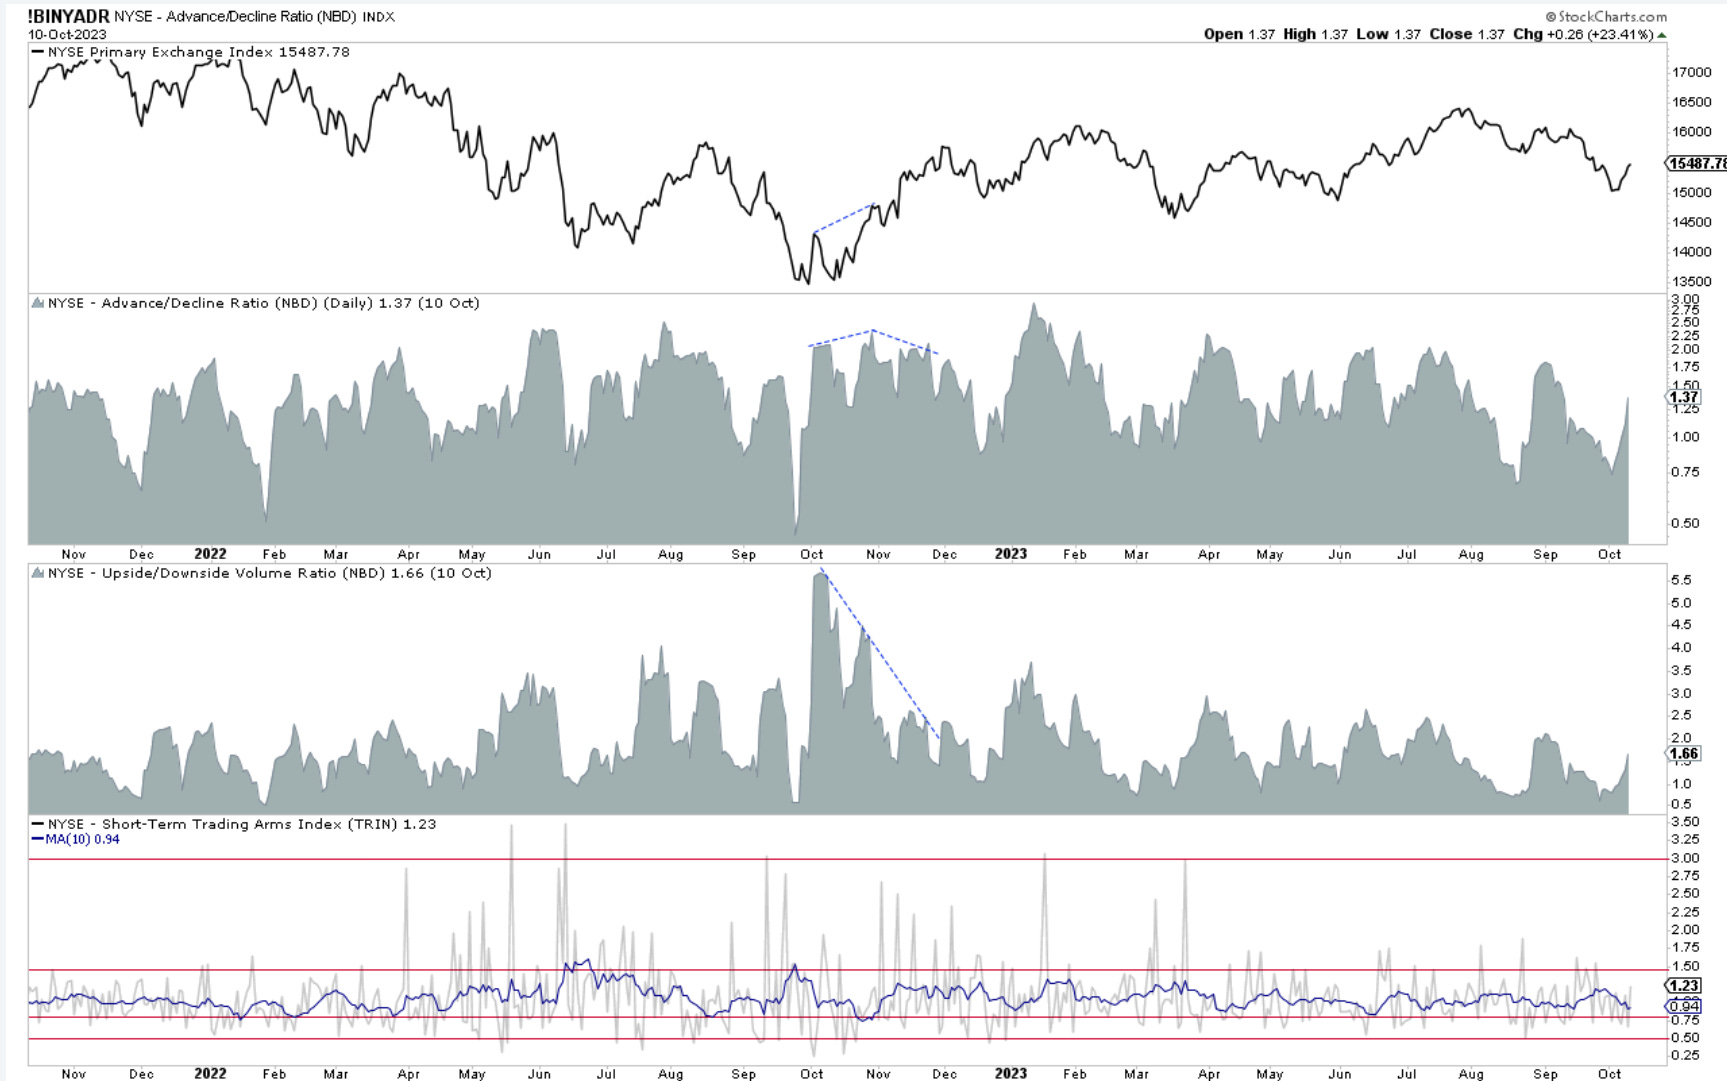
It’s not only that we bounced, but the volume of advances supersedes the one for declines. That’s a healthy sign of bullish buying. Looking under the hood to see if there is any rust or oil leaks, is always recommended.
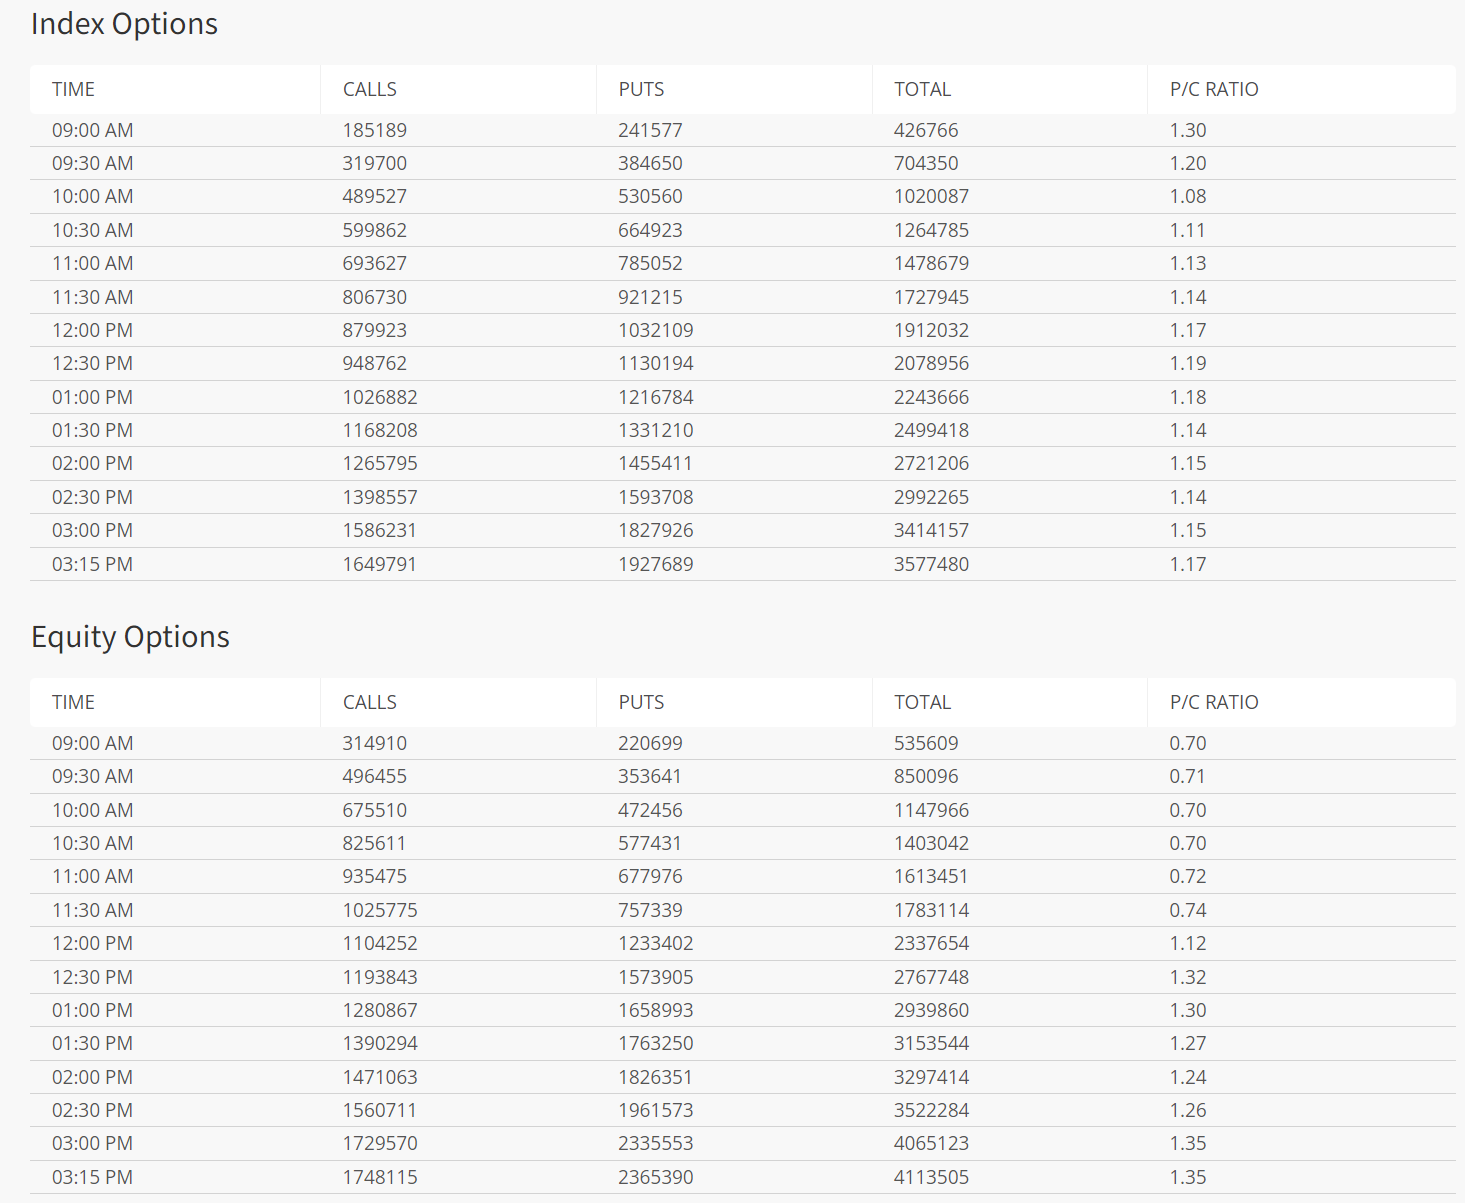
Now as the day progresses the put buying intensities once again. Because what is cooler than buying puts thru the nose in hopes of a bad CPI report and getting rich in one trade?
Nasdaq100
20 min chart of the Nasdaq, it’s an elliott wave beauty. If the beauty continues we should see higher prices to complete the larger pattern. Recognize 3 waves against a trend and a big part of the EW puzzle can be resolved.
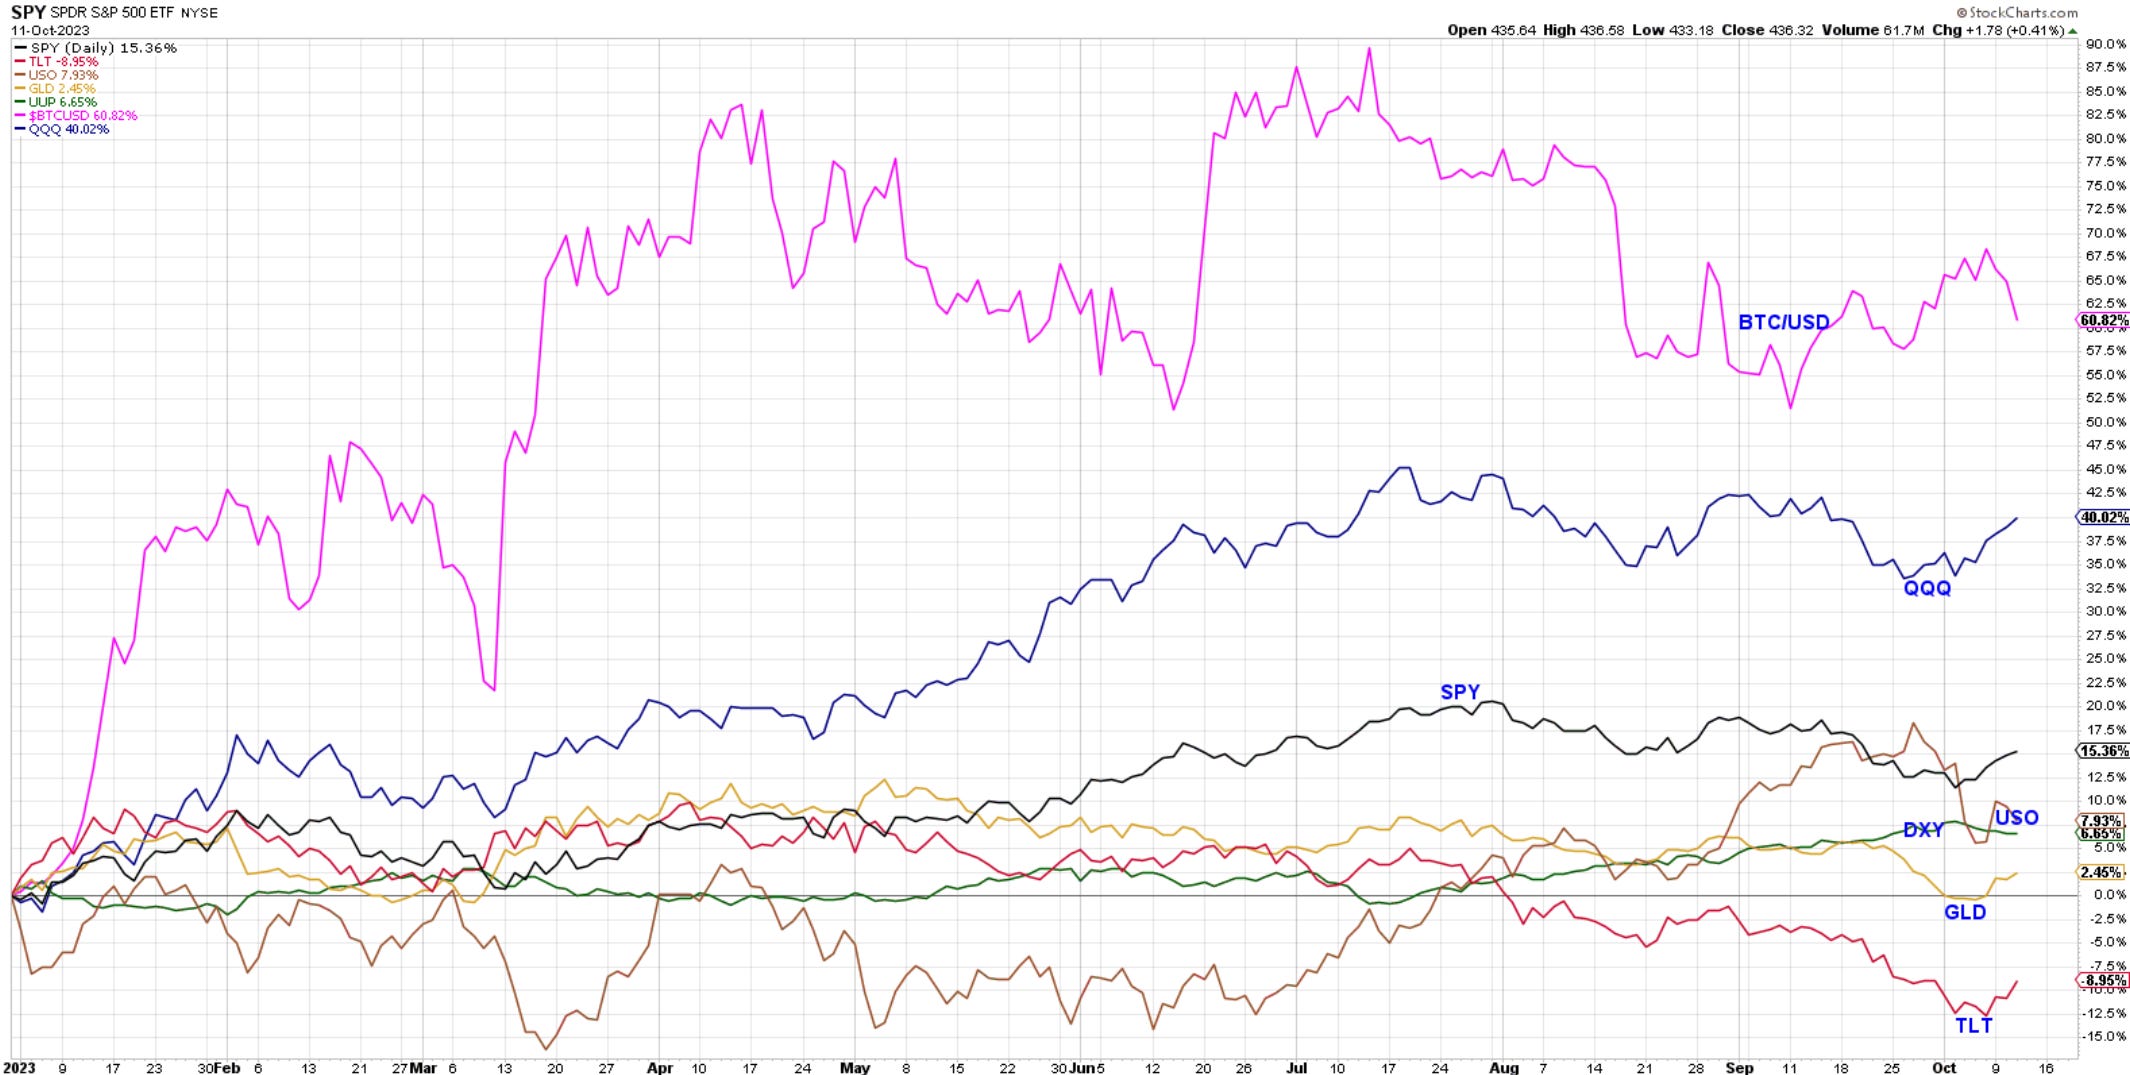
YTD performance of main markets and you can see why QQQ is such a darling. Winners win. What’s up with BTC here heading in the wrong direction? Returning 60% from 90% earlier in the year. QQQ is a close second.
Dow30
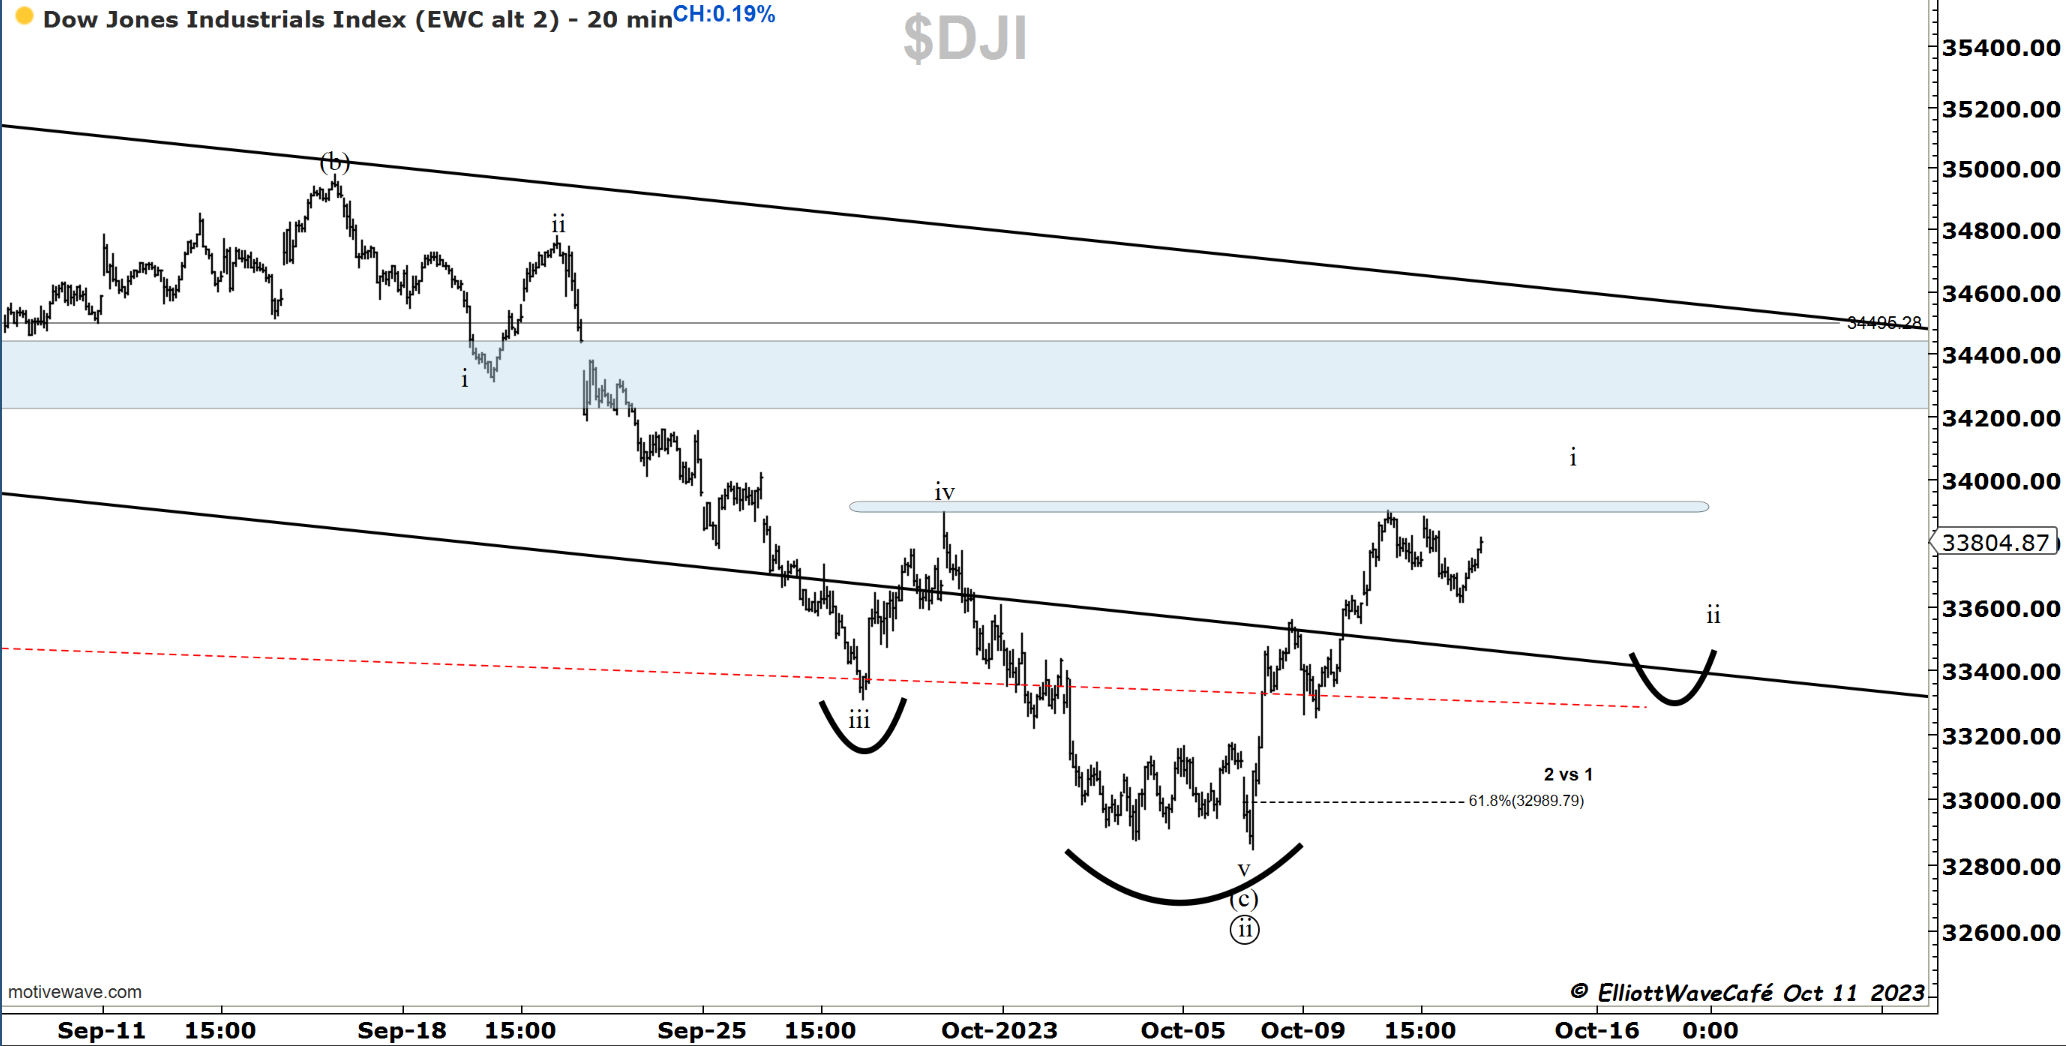
Do you see the inverted HS that Dow is trying to build? It might not pan out exactly like that, but if it’s in the ballpark I’ll take it. A visible 3wave decline should lead to a high above that horizontal blue line and just when everyone gets a bit too bullish a pullback in ii should be expected. Would be the right shoulder. Then the real move begins higher and an attack of 35k.
Now this. If we lose 33k, all bets are off and risk should be taken off the table. It’s not about being right or wrong but what actions you take when faced with that information. Do you freeze in the headlights or cut it and go for a walk in the forest?
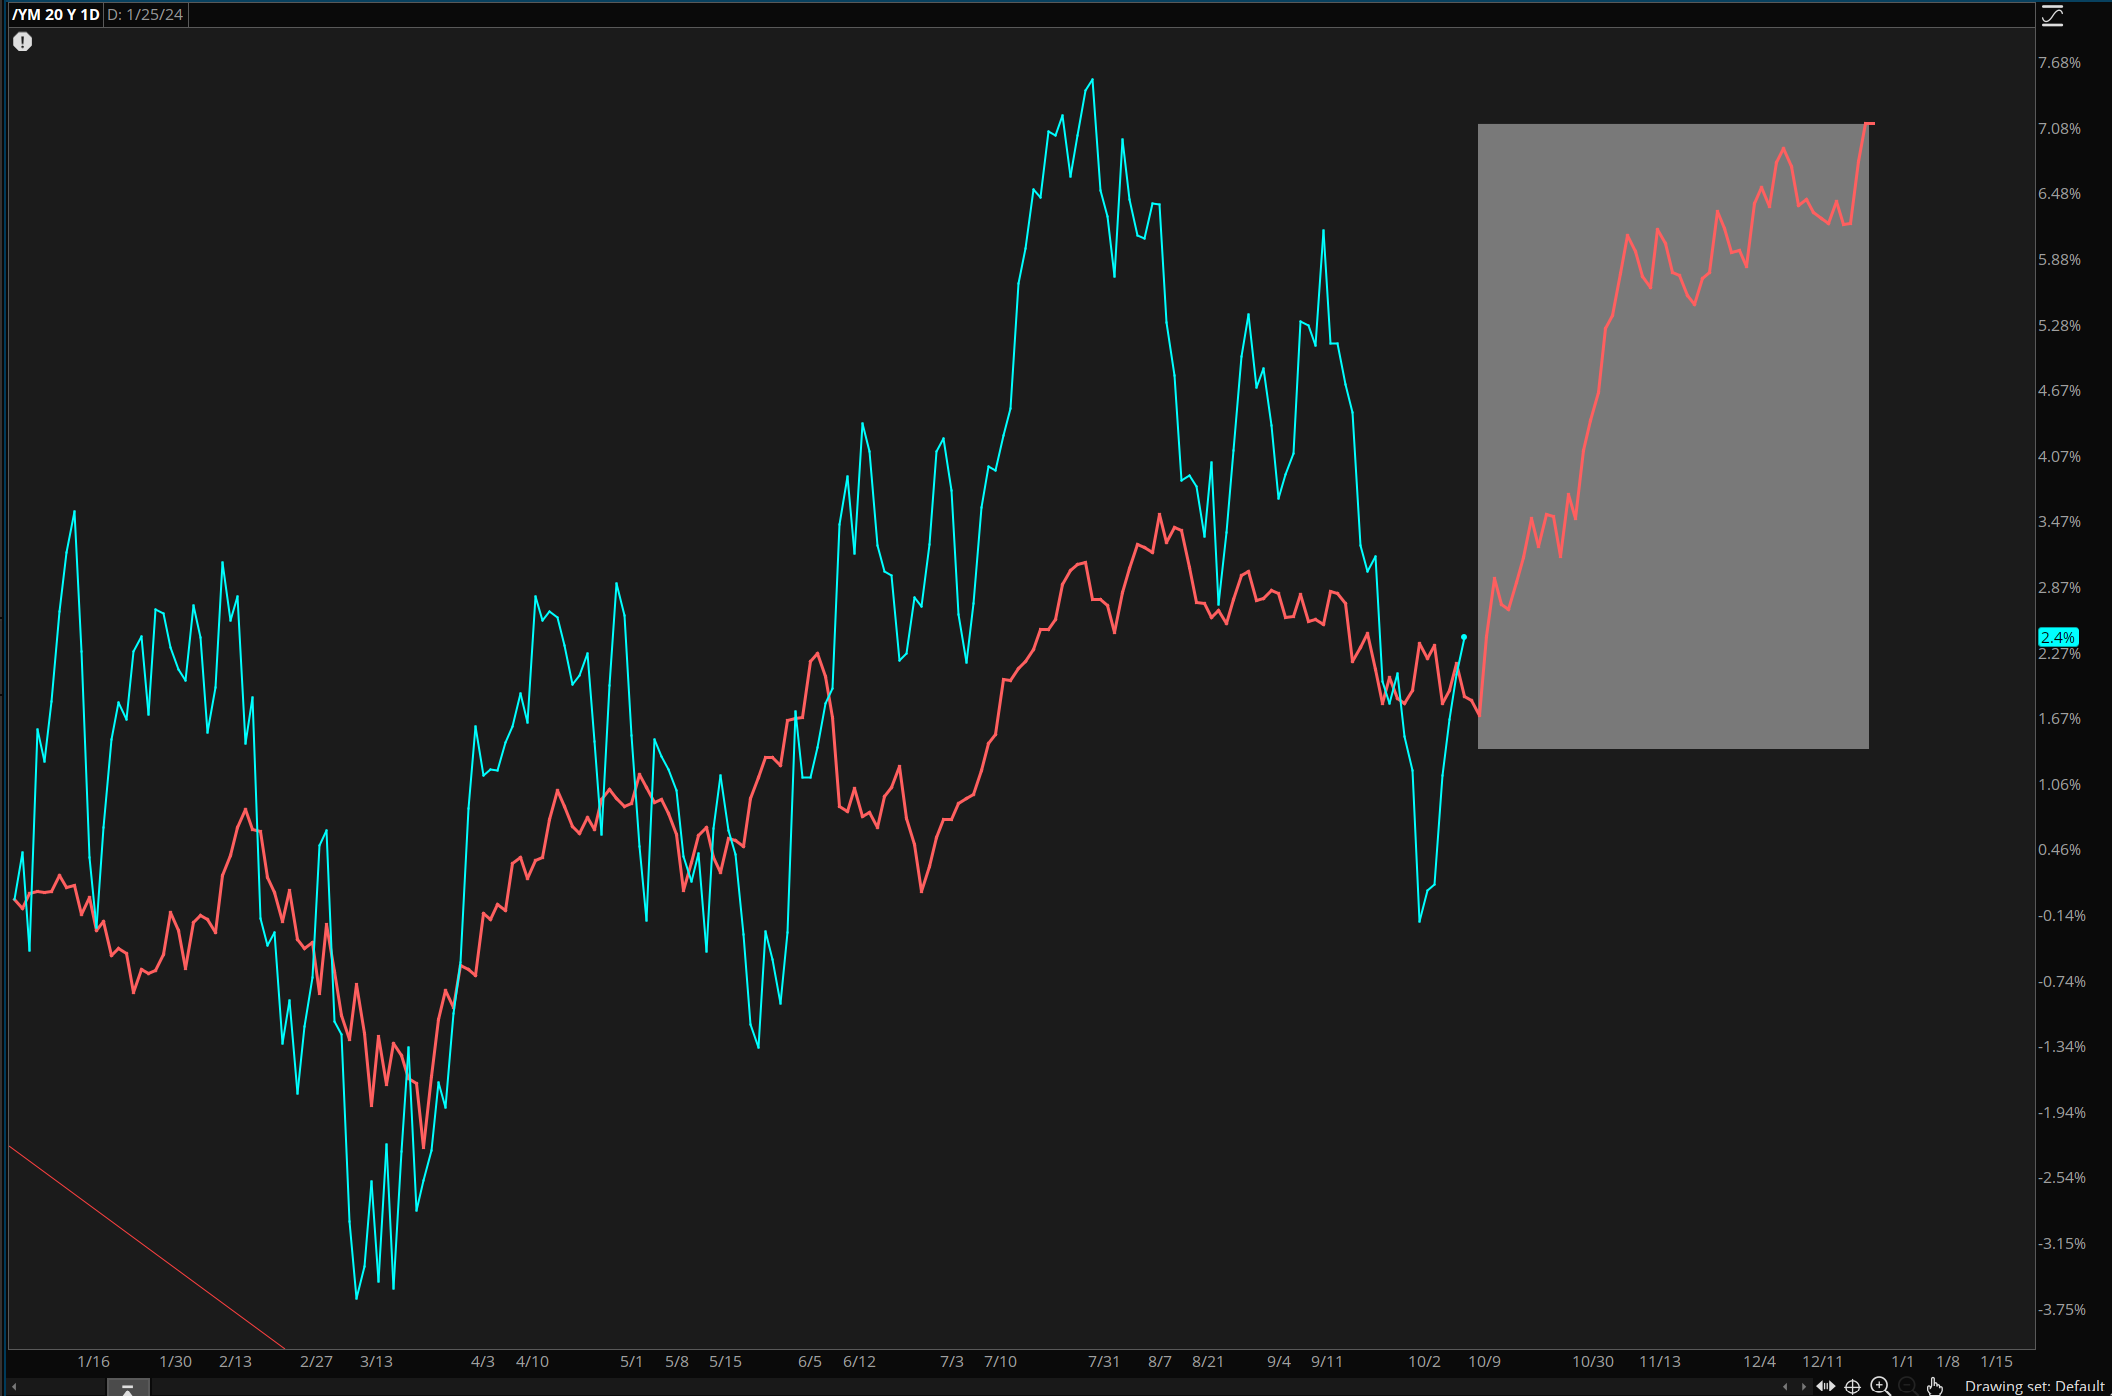
Here is DOW seasonality going into last quarter.
US Dollar
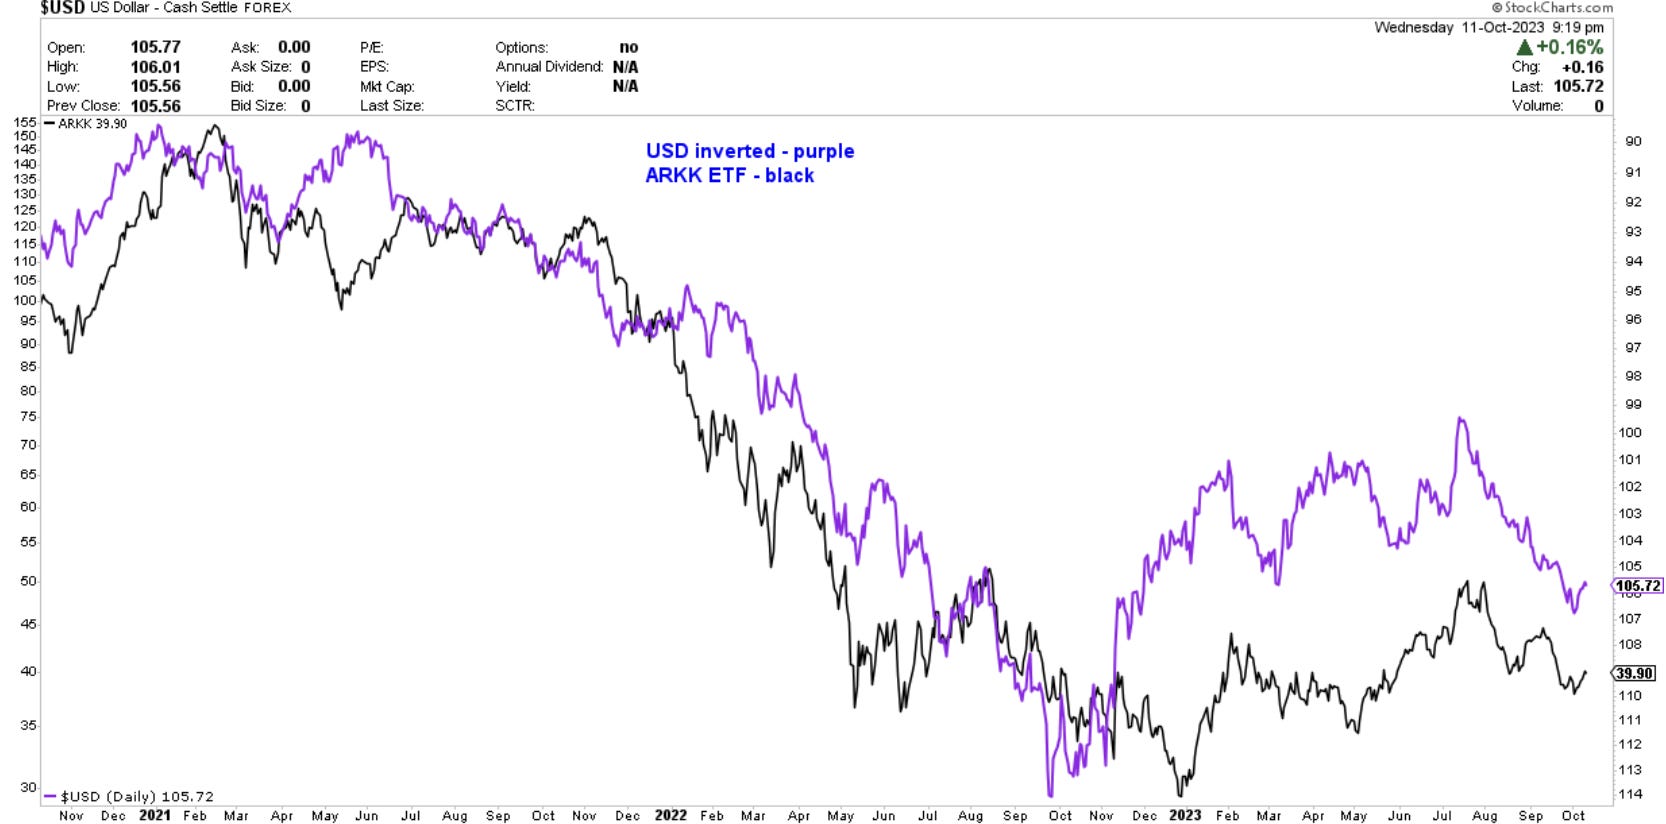
There is no better proxy for risk on - risk off than the AARK etf. Here it is inversely correlated with the US Dollar. Dollar bottoms, arkk tops. Dollar tops, arkk bottoms. Just food for thought.
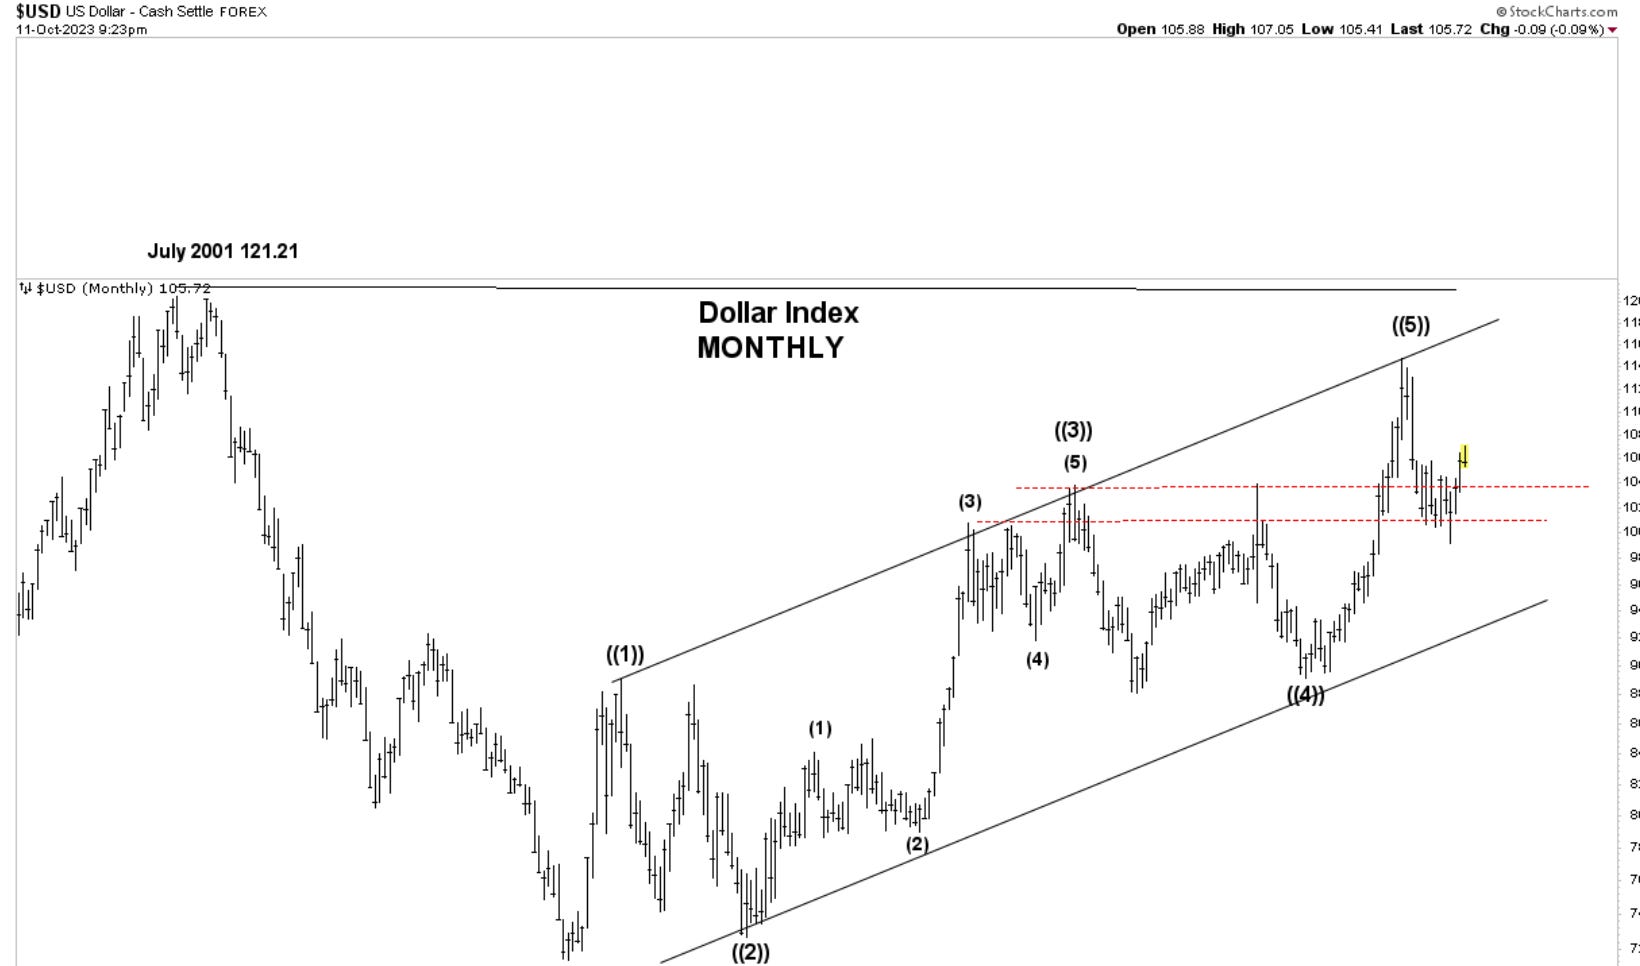
On the Monthly here is the main count.
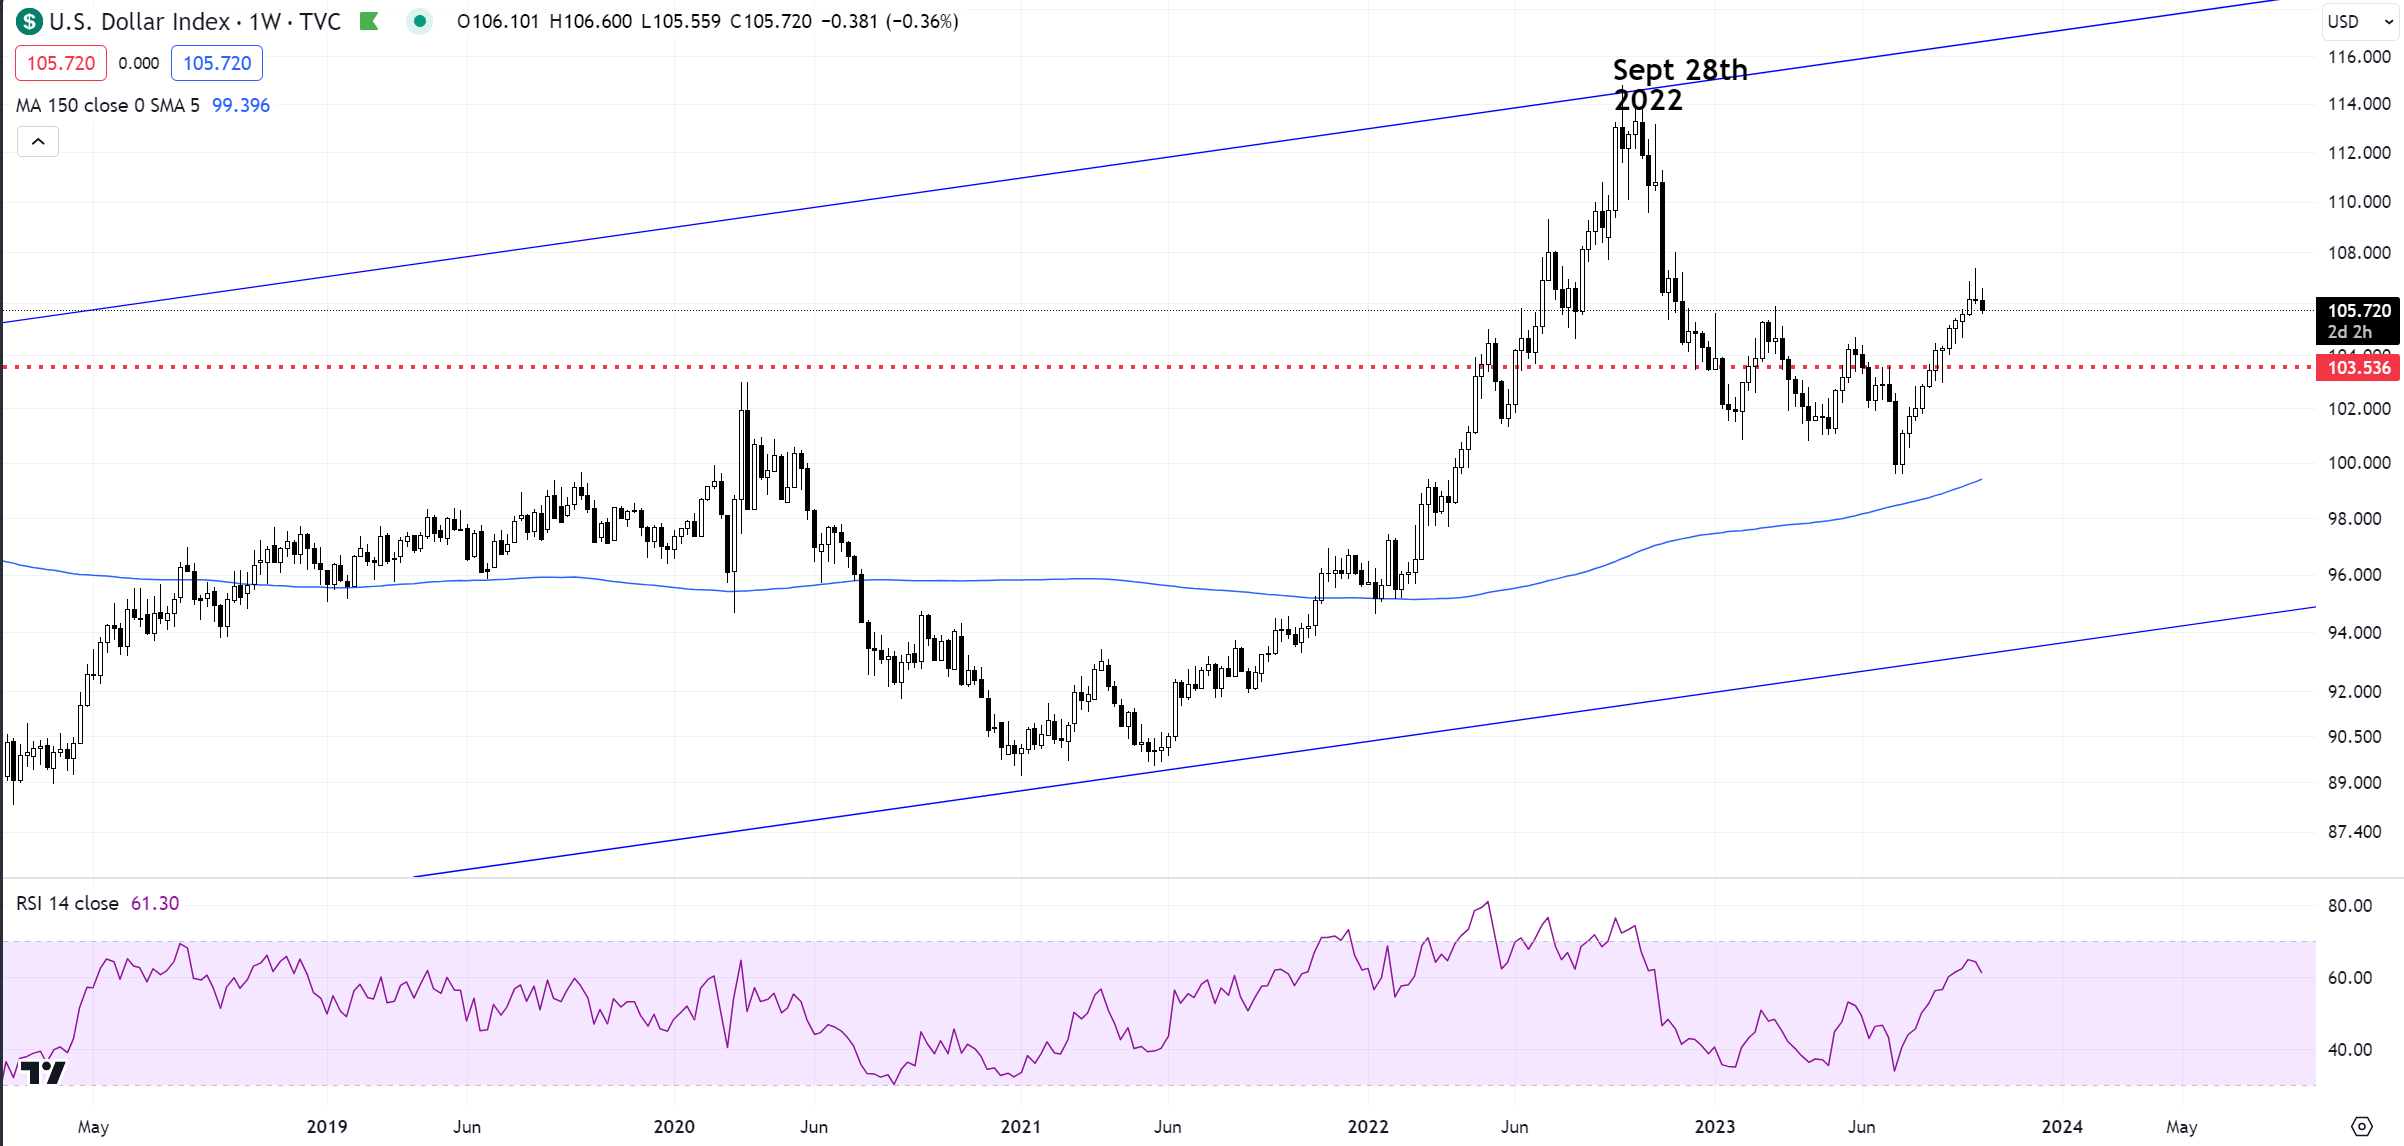
And the TV chart on weekly. Yes, topped a year ago on that channel top. That should be it for a long while.
Gold
Gold working the count- prior comments stand. Wave (ii) should be met with buying.
Can’t argue with the nice start of an impulse from 1820 in Gold. Dips should offer further long opportunities towards 1900. Have your risk levels in place as always, either fibs, prior wave lows, or horizontal key levels. Whatever you prefer, when things don’t work out, bailout. Did not really mean to sound poetical.
Bitcoin
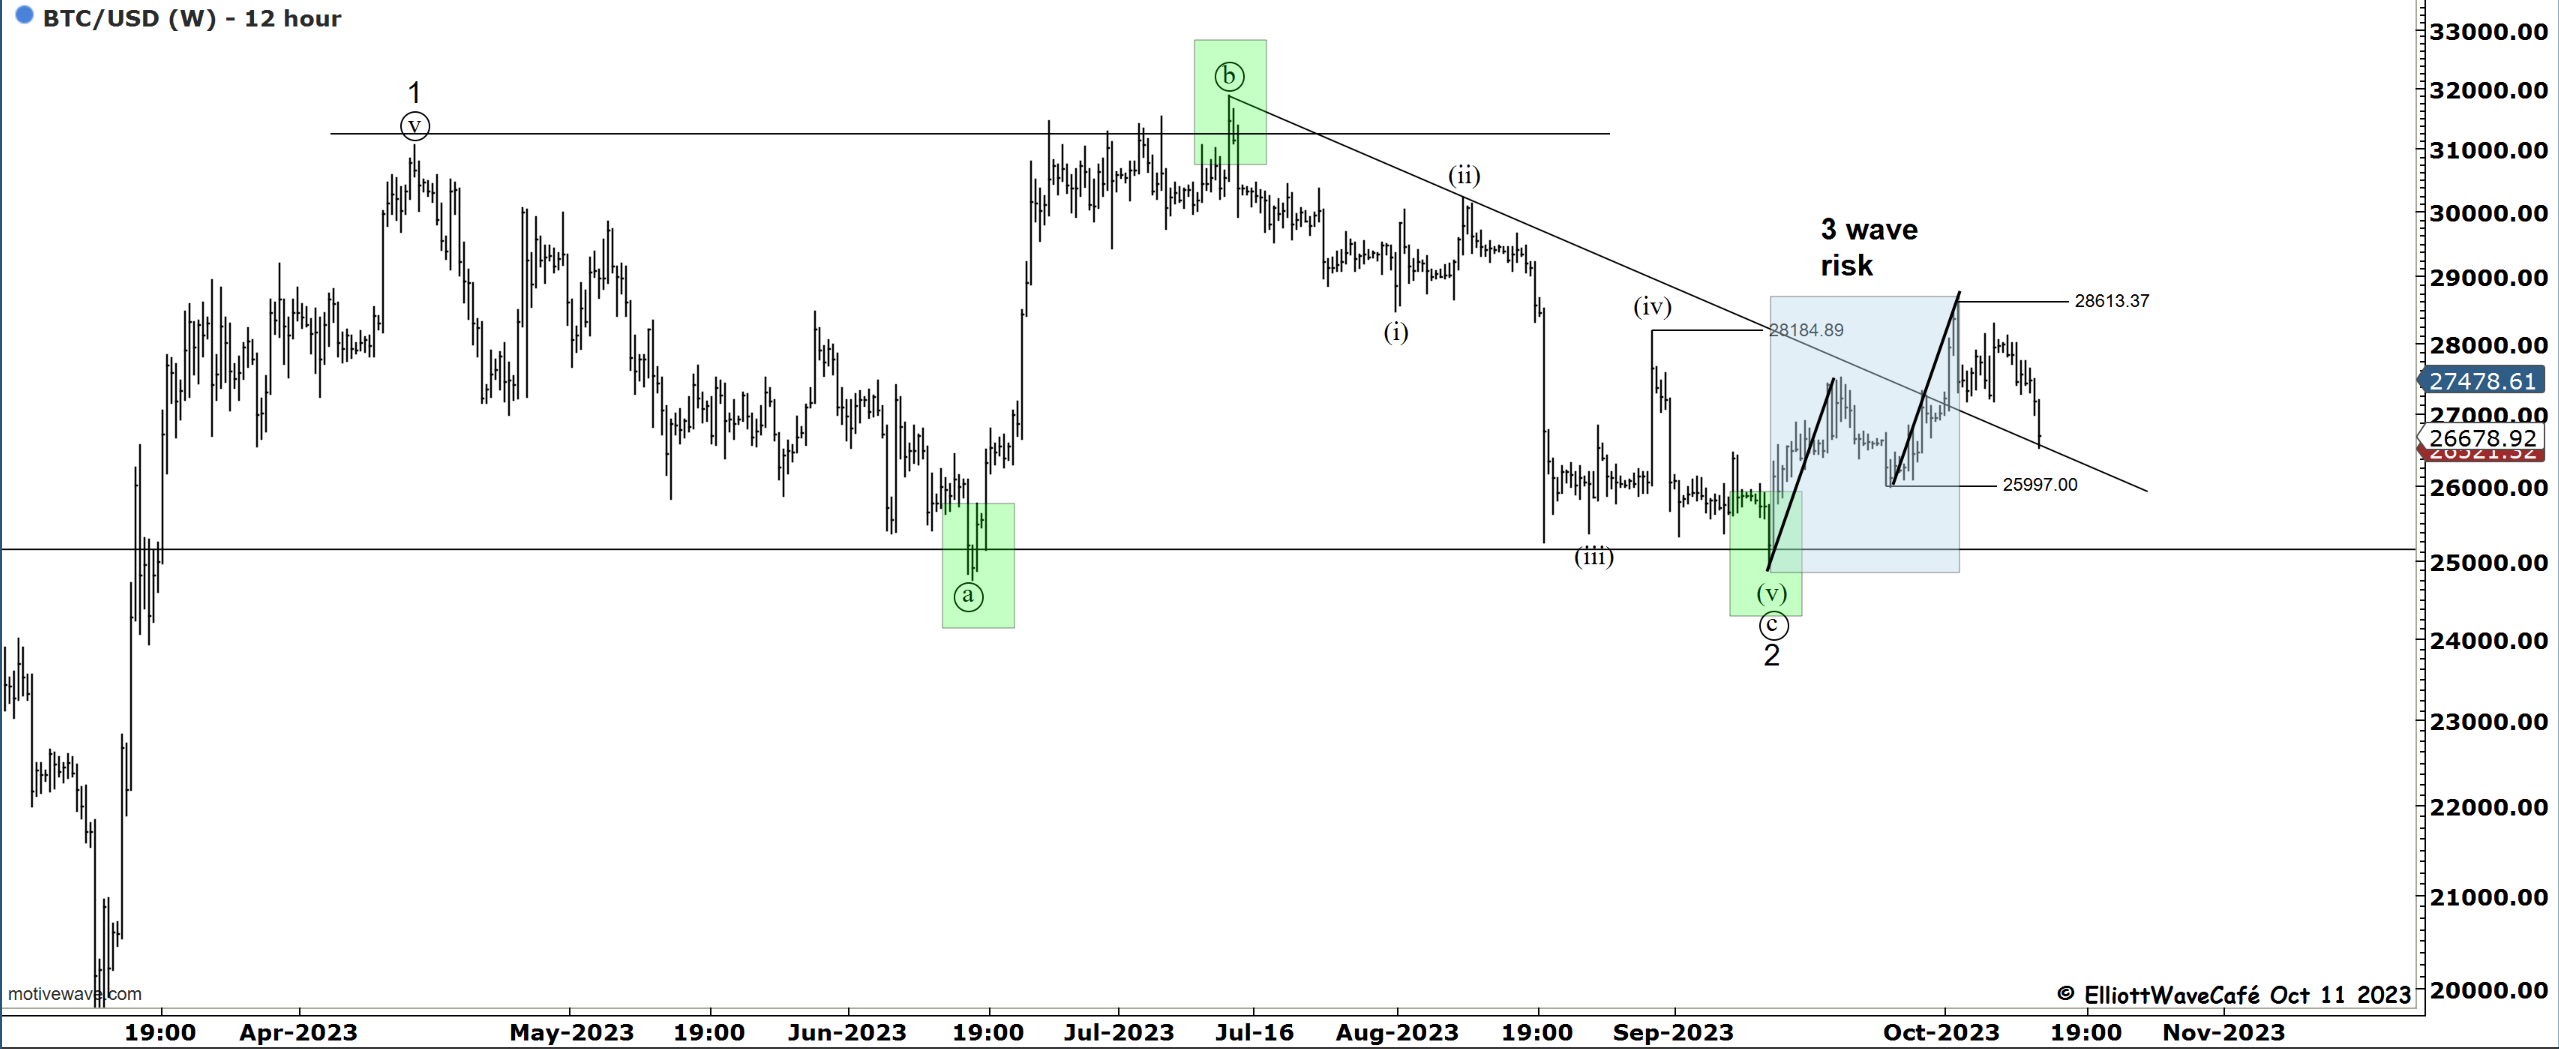
Moment of truth for BTC here as the up-3 wave risk is unfolding. The price is testing the broken trendline. A hold and bounce here above 28k would be a great sign. We cannot lose 26k. If we do, 25k will come under severe attack. Possibly the strong demand will hold it, but it becomes a tougher bet.
Daily video coming up next,
See you tomorrow- trade well,
Cris
email: ewcafe@pm.me