
The Daily Drip
Markets review, strategy and analysis
Note: The EW counts on the right edge are real-time, and they are prone to adjustments as price action develops. Elliott Wave has a fluid approach, is evidence-based, and requires constant monitoring of certain thresholds.
In the counts below, this (( )) = circle on chart
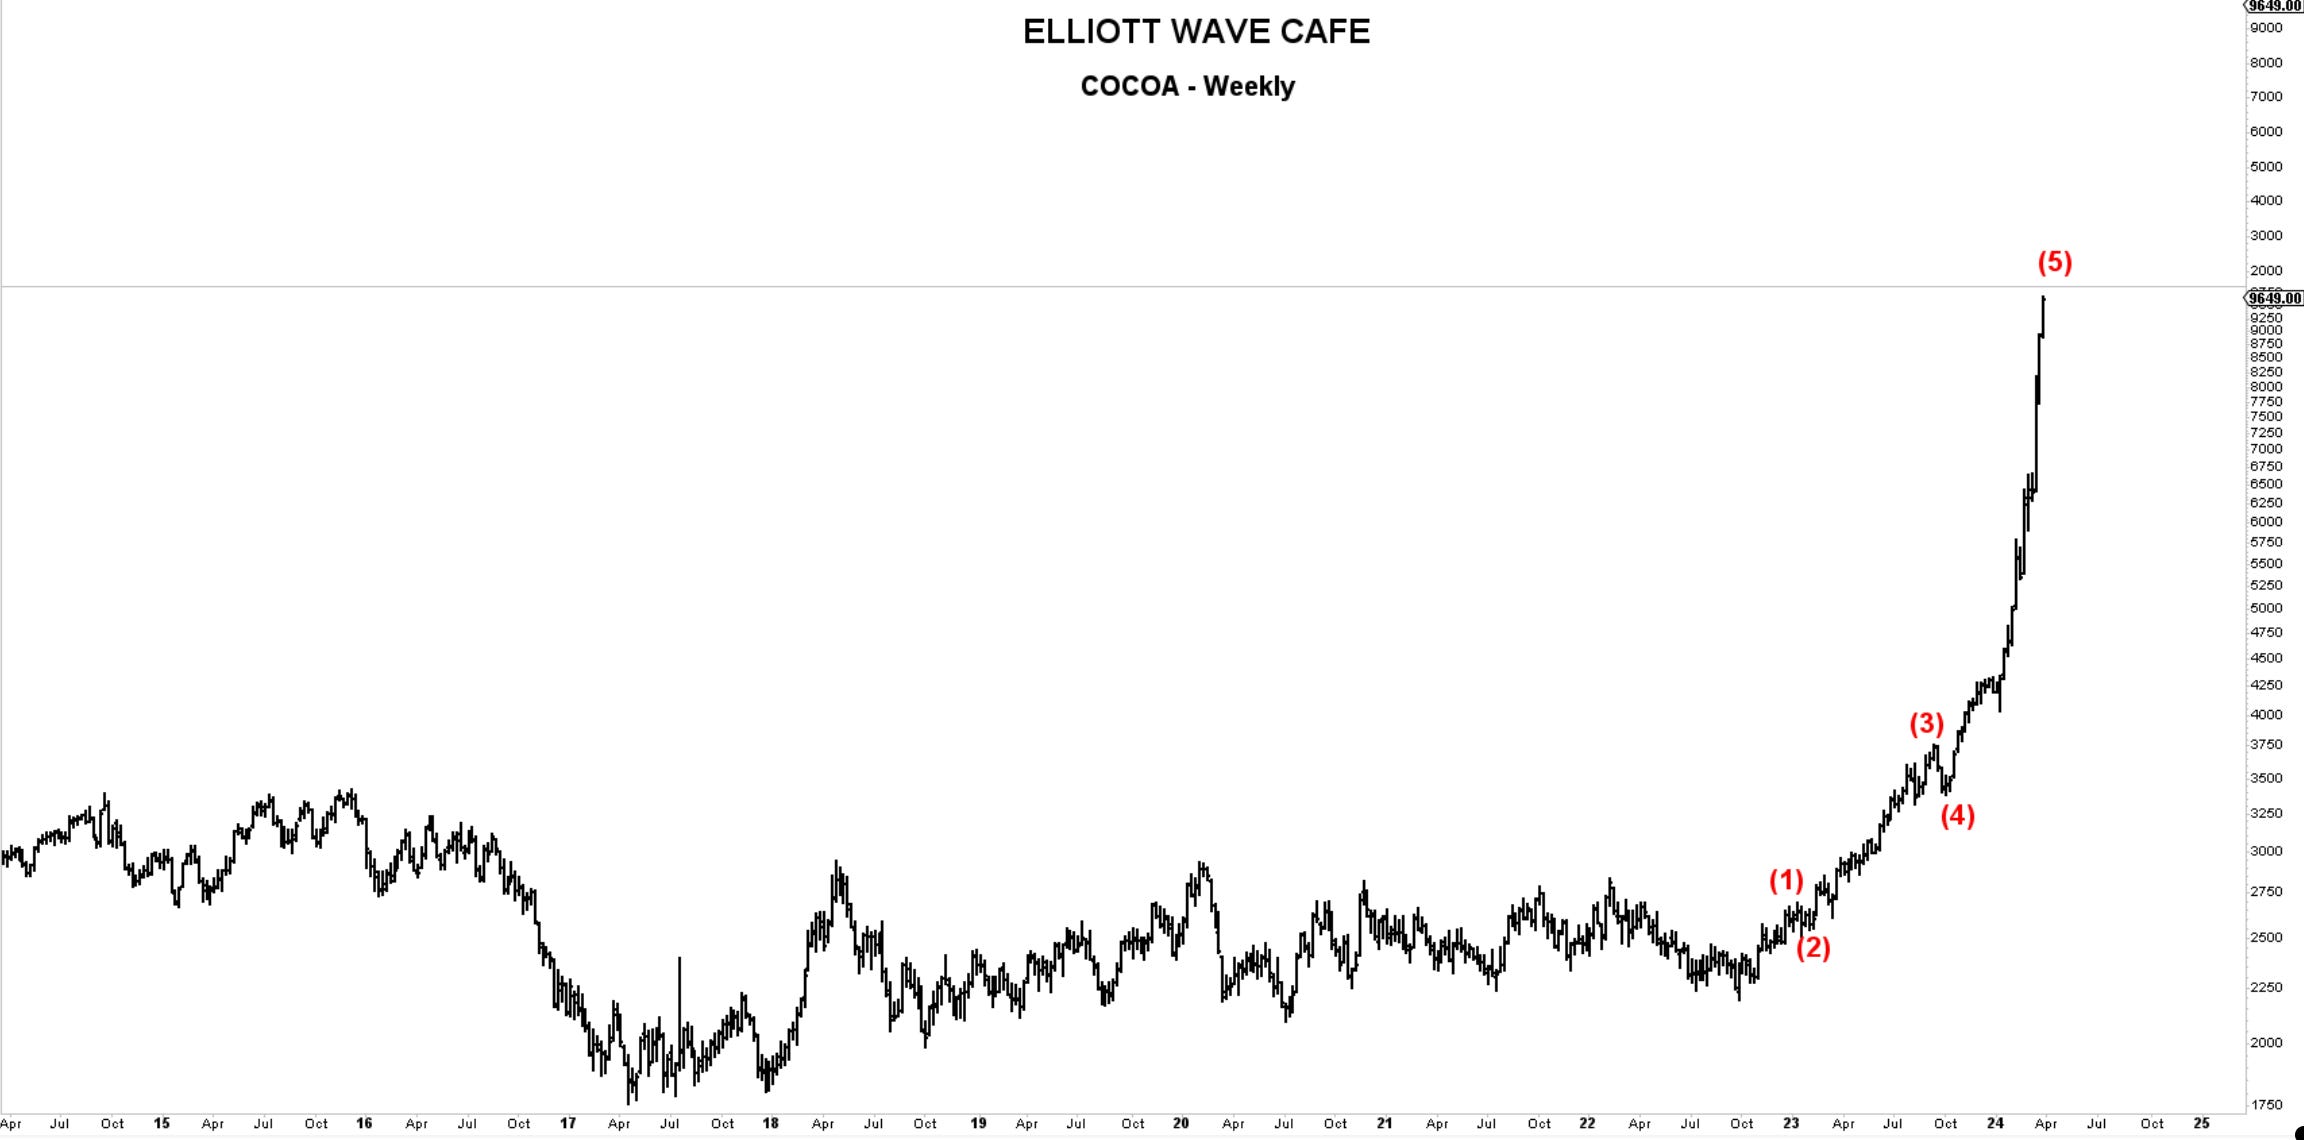
Chart of the Day—COCOA— Not a market I follow closely but it’s worth pointing out the simple motive wave structure it displays. Commodity markets are notorious for developing strong 5th waves and here we have a prime example of that in my view. This market, just like lumber a few years ago, will fall aggressively upon the completion of this 5th wave. I would not suggest picking a top here, but wait for evidence of topping and with the risk of missing the initial move lower, one can use the subsequent rally to initiate a trade.
In yesterday’s note, we looked at the core markets elliott wave counts on hourly and daily time frames and spent the daily video detailing the current moves and some alternate views. A good exercise to notice the slight differences in approaching counting.
Today I will review the daily technicals along with daily cycles on a market that’s giving continued signs of struggling to advance.
Let's dive into the charts below …
