
The Daily Drip
Core markets charts updates and commentary
Note: The counts on the right edge are real-time, and they are prone to adjustments as price action develops. Elliott Wave has a fluid approach, is evidence-based, and requires constant monitoring of certain thresholds.
In the counts below, this (( )) = circle on chart
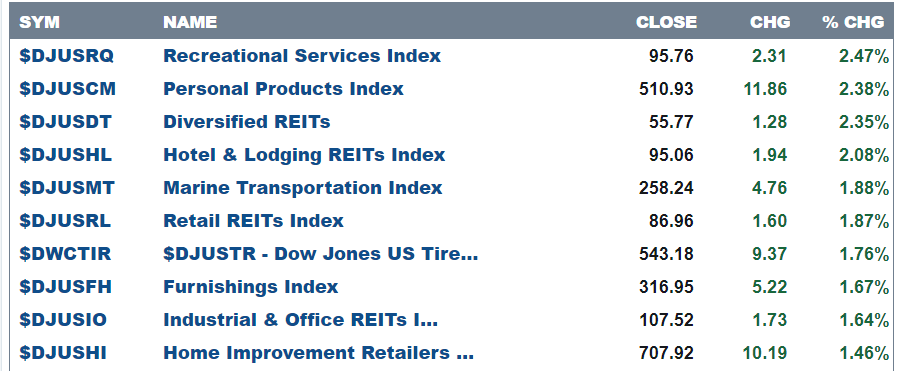
Here are today’s top 10 best performers out of 104 industries.
53 positive closes and 51 negative.
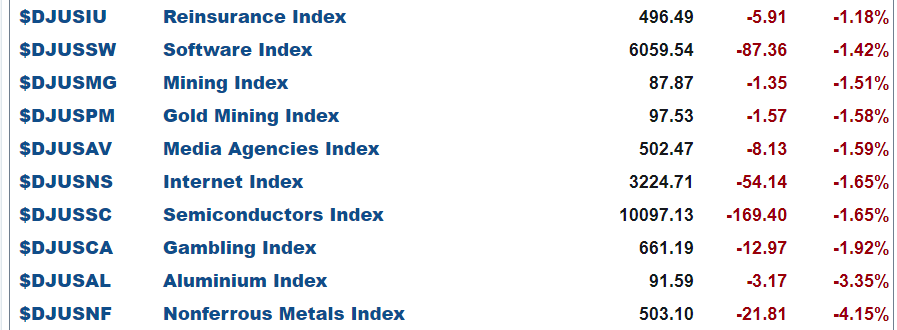
and bottom 10 …
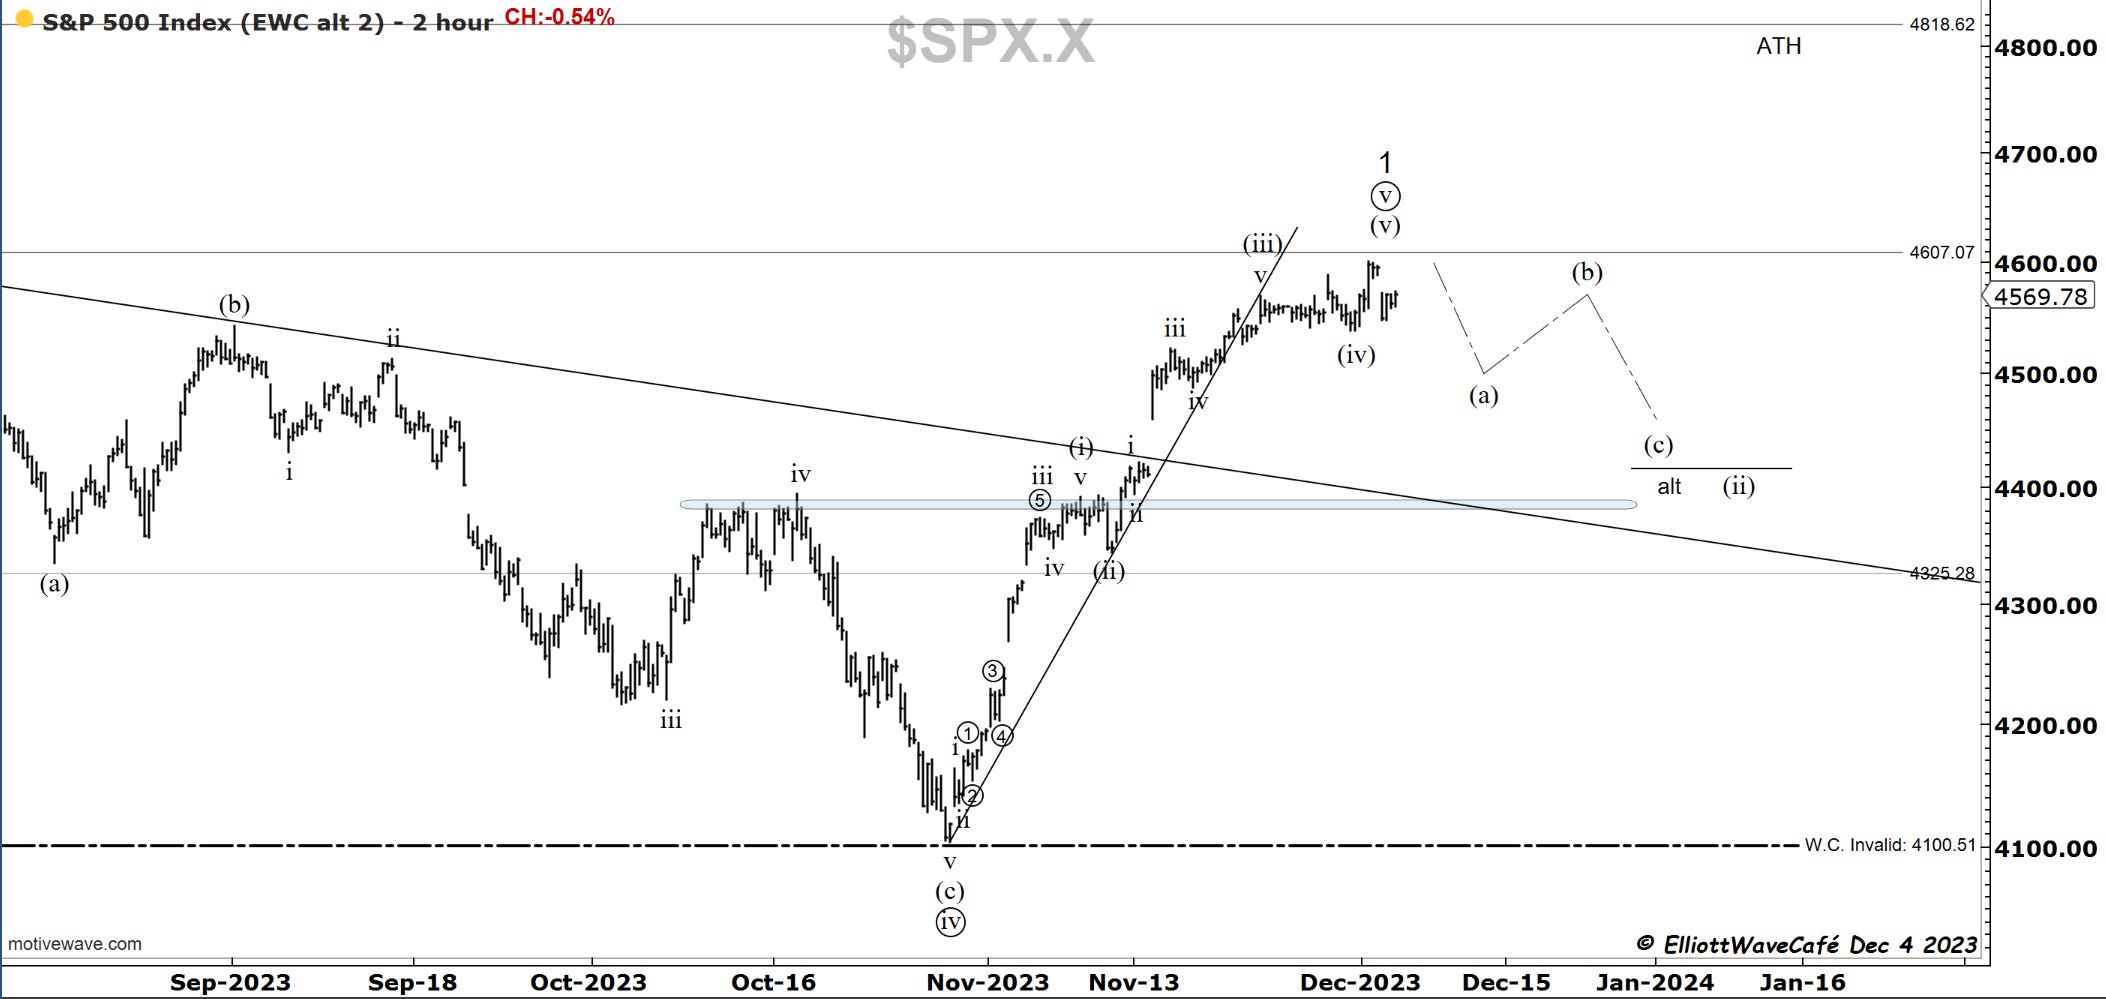
SP500
On Friday, Dec 1st, the index pushed higher one more time but stopped just below the 4607 highs from Jul 27th, 2023. We have been discussing the wave five topping formations here for the past several updates. What is also true is that the markets have been struggling to advance since roughly Nov 20th. My view stands that it is right to correct here after one of the strongest months in market history. Today we got a hint of that with the index dropping about 1% from the highs at one point in the session. The next 2 weeks have plenty of economic data, and you can’t blame traders for being cautious or pulling back on risk-taking. Many internals I follow shows sentiment exuberance along with the palpably excited trading of junk stocks and crypto. The cold showers are around the corner. Uber was accepted in the Sp500, and the stock sold off today. The Mag7 have been struggling for a couple of weeks already. Yes, we’re trading from large caps into small caps, but that’s never really sustainable in my view.
The count points to a move towards 4400 for at least a 38% correction of this latest Nov advance.
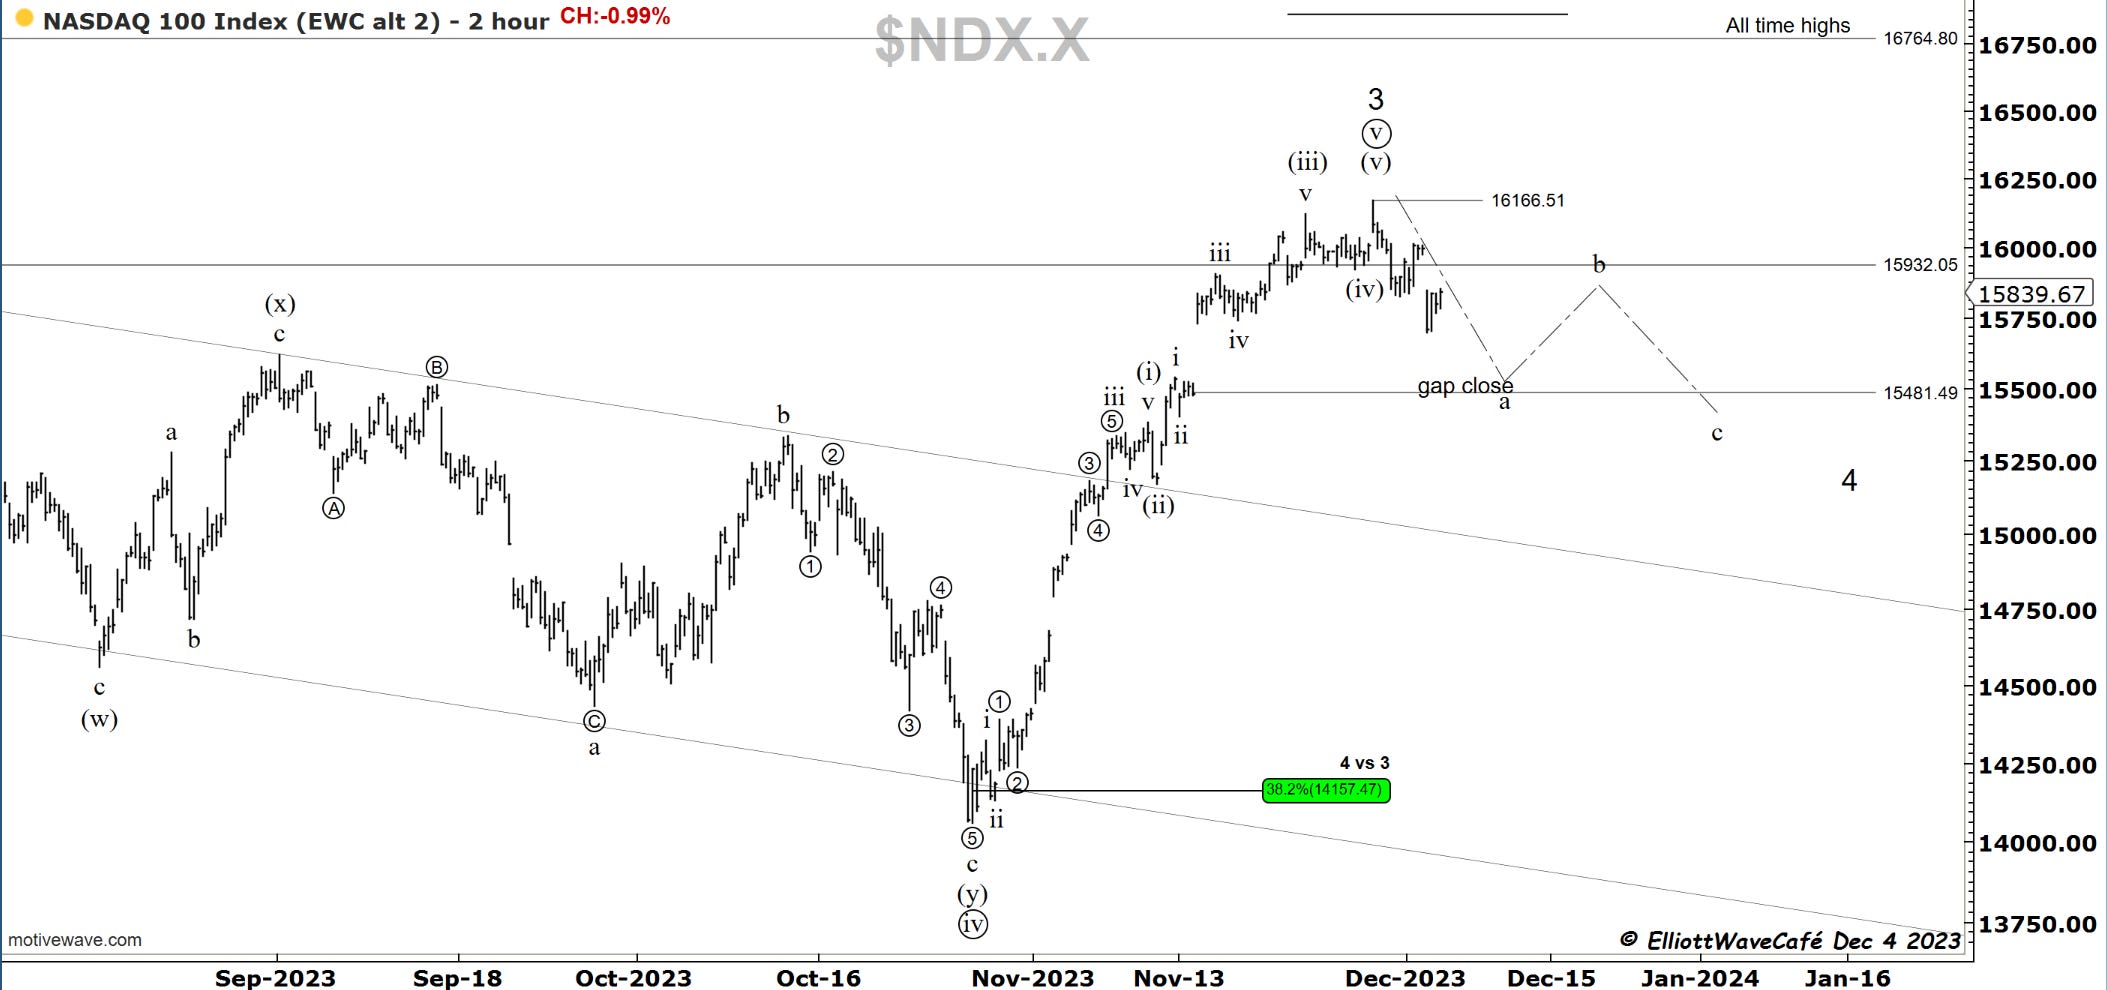
Nasdaq100
The Nasdaq topped the first on Nov 29th. It was the hardest hit today but managed to recover some. I continue to look for that gap close near 15480 and a correction that should unfold timewise for at least a few more weeks. At the larger degree I see it as a wave 4, subject to change depending on progression.
RUSSELL 2000
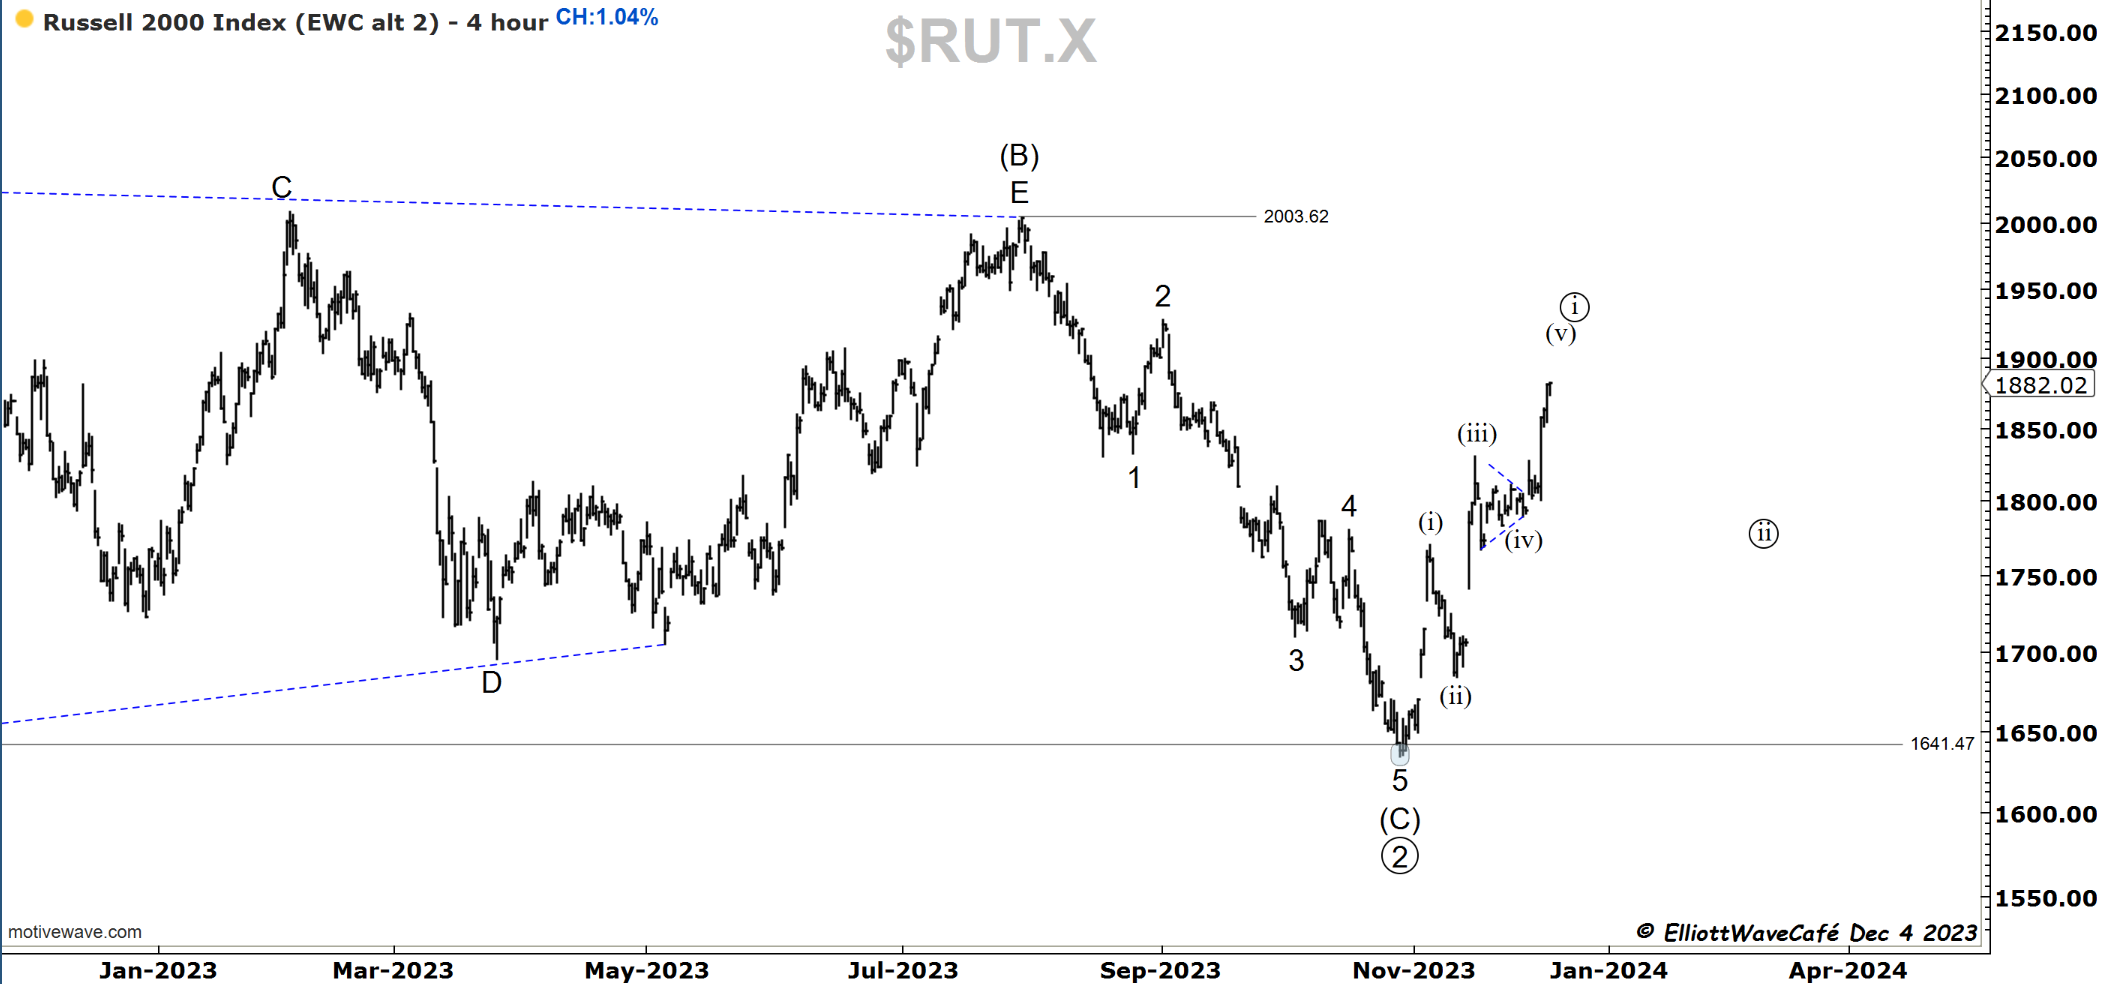
The Russell broke higher in a visible 5-wave formation. If we broke out of a 4th wave triangle, then the next pullback should bring us back towards the apex of that formation near 1800. Further advancing here will push the count into a 1,2 1,2 with much further to go. I am skeptical about that. If we correct in 3 waves after this initial rally, then the next leg higher will begin. It will secure that wave ((2)) low in late October.

Dow30
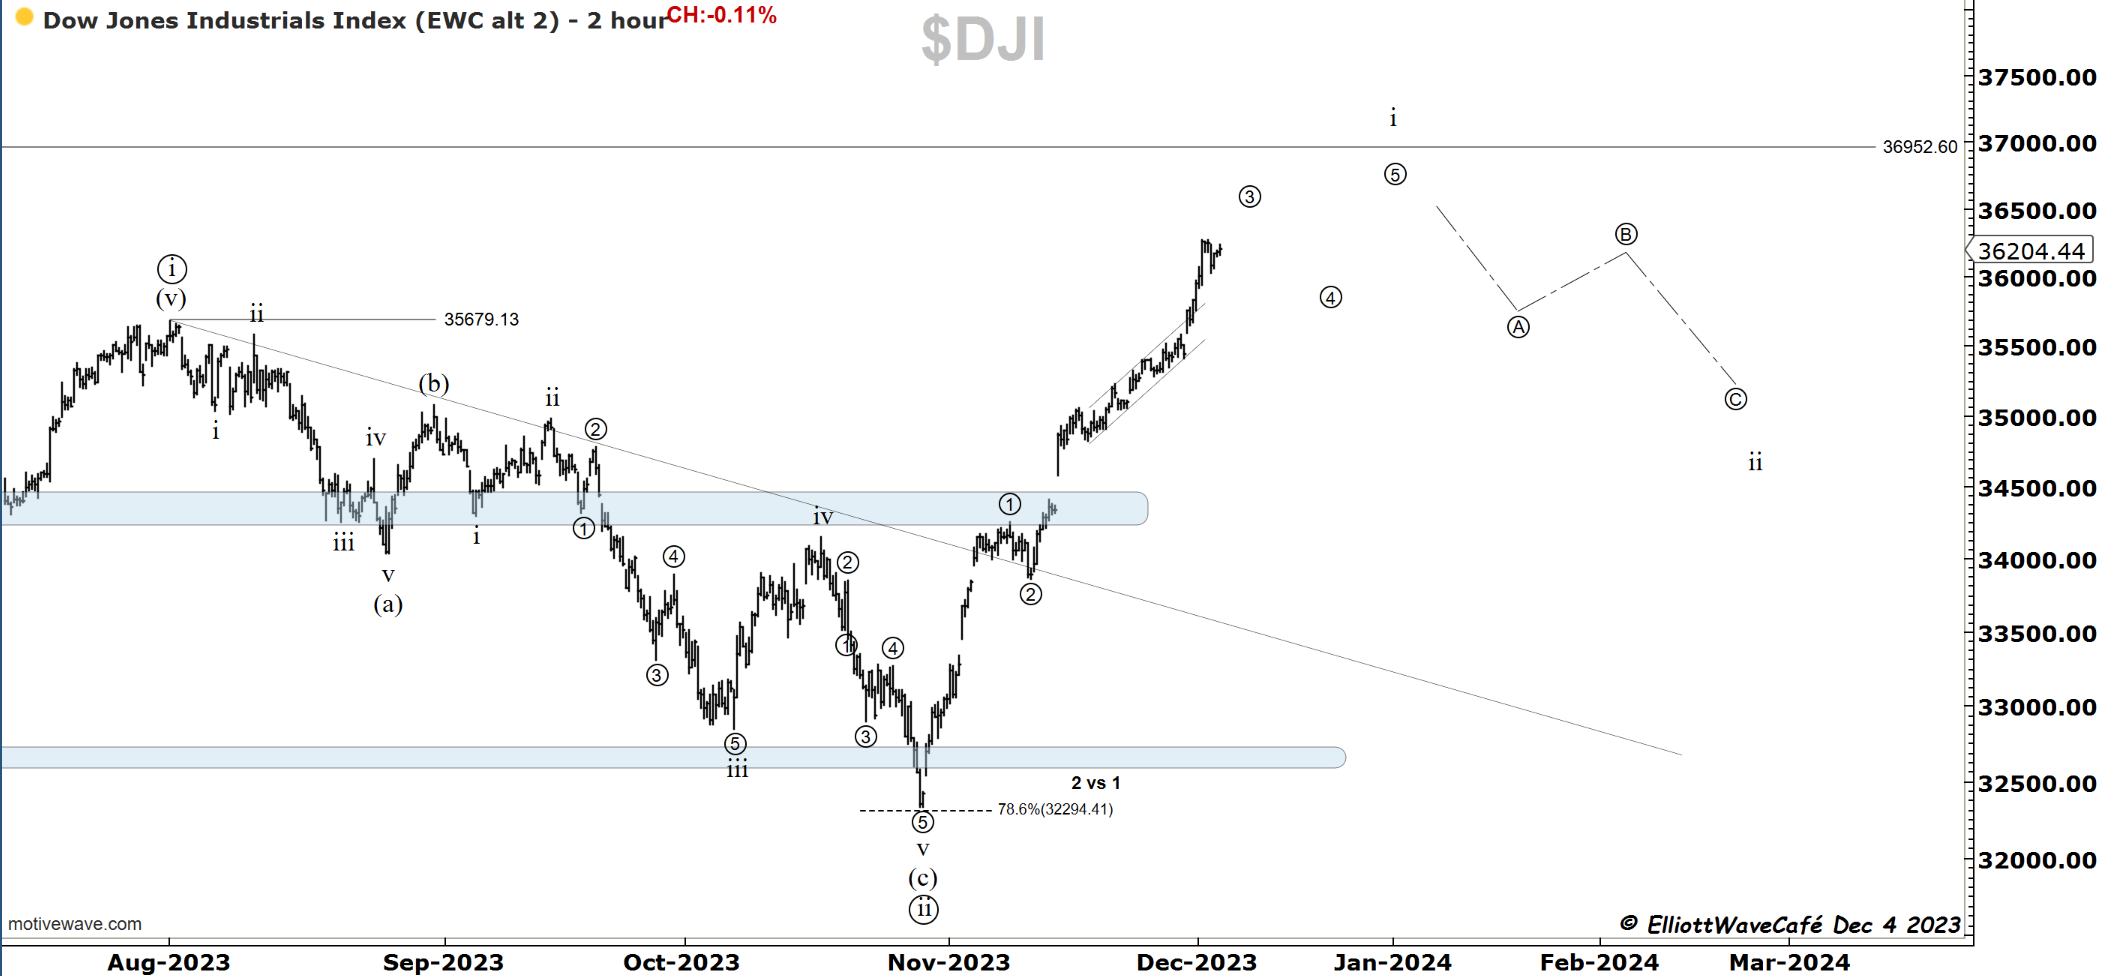
By surpassing 36,043 and extending, the original 5th wave approach had to be dismissed. A wave ((3)) seems more appropriate which once finished it will give way to a 4th and a 5th before a correction starts. Dow has been quite strong and it shows by the count stage vs the other indices.
US Dollar and Yields
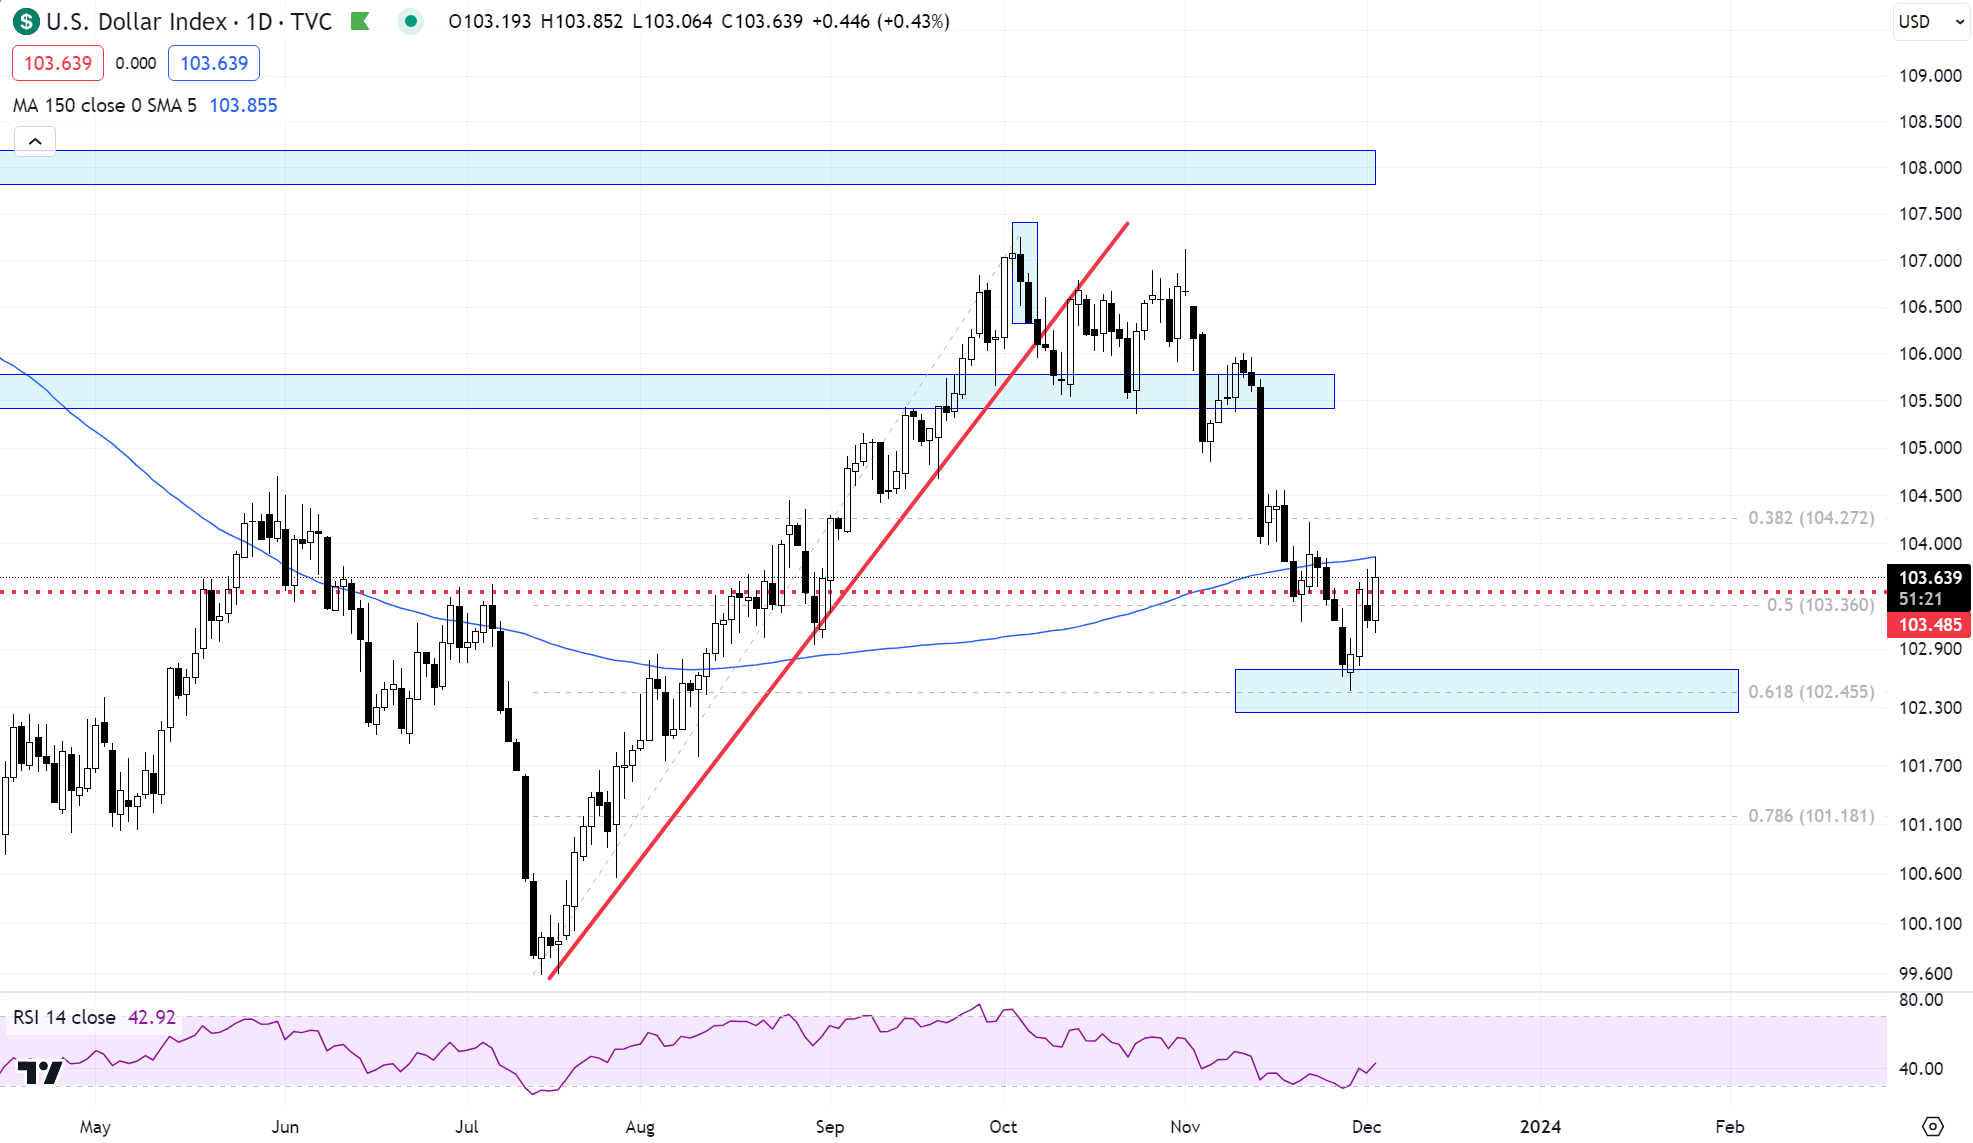
Dollar strength is not risk positive and the move from that .618 looks impulsive on lower time frames. It is one of the things that gives me confidence in calling for corrective price action in equities. The Gold move has been an outlier and likely heavily manipulated in the futures market. Tough to sustain a gold rally with the dollar bouncing.
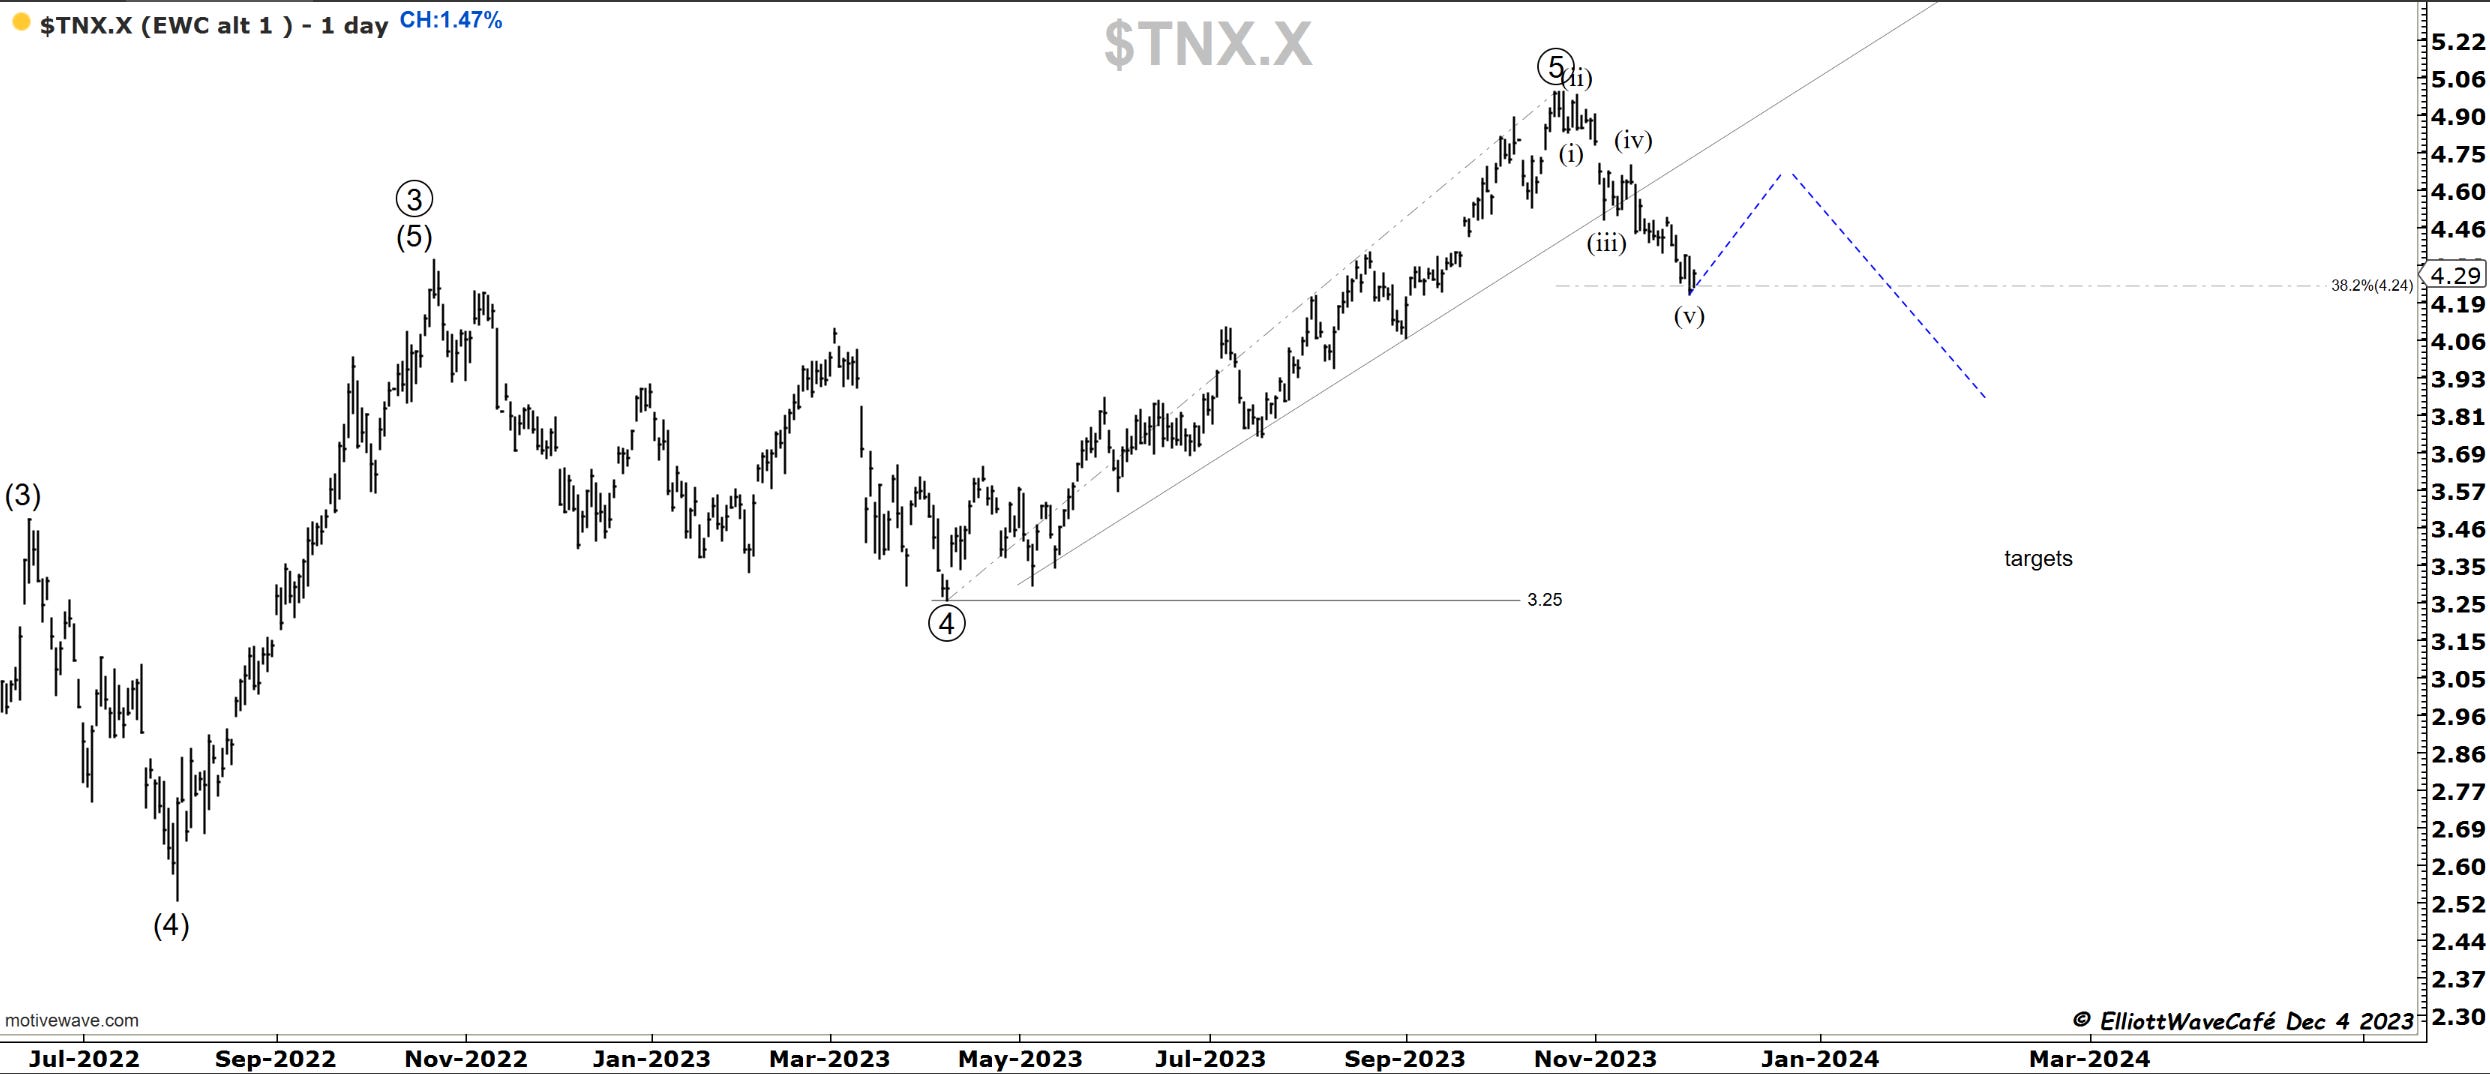
Yields have now corrected 38% of the rally from the spring this year. 4% is a key level that probably does not get broken before a rally here gets underway. The odds of a move back towards 4.50 - 4.60 are getting closer with each passing day. Rate-sensitive stocks and sectors won’t be happy.
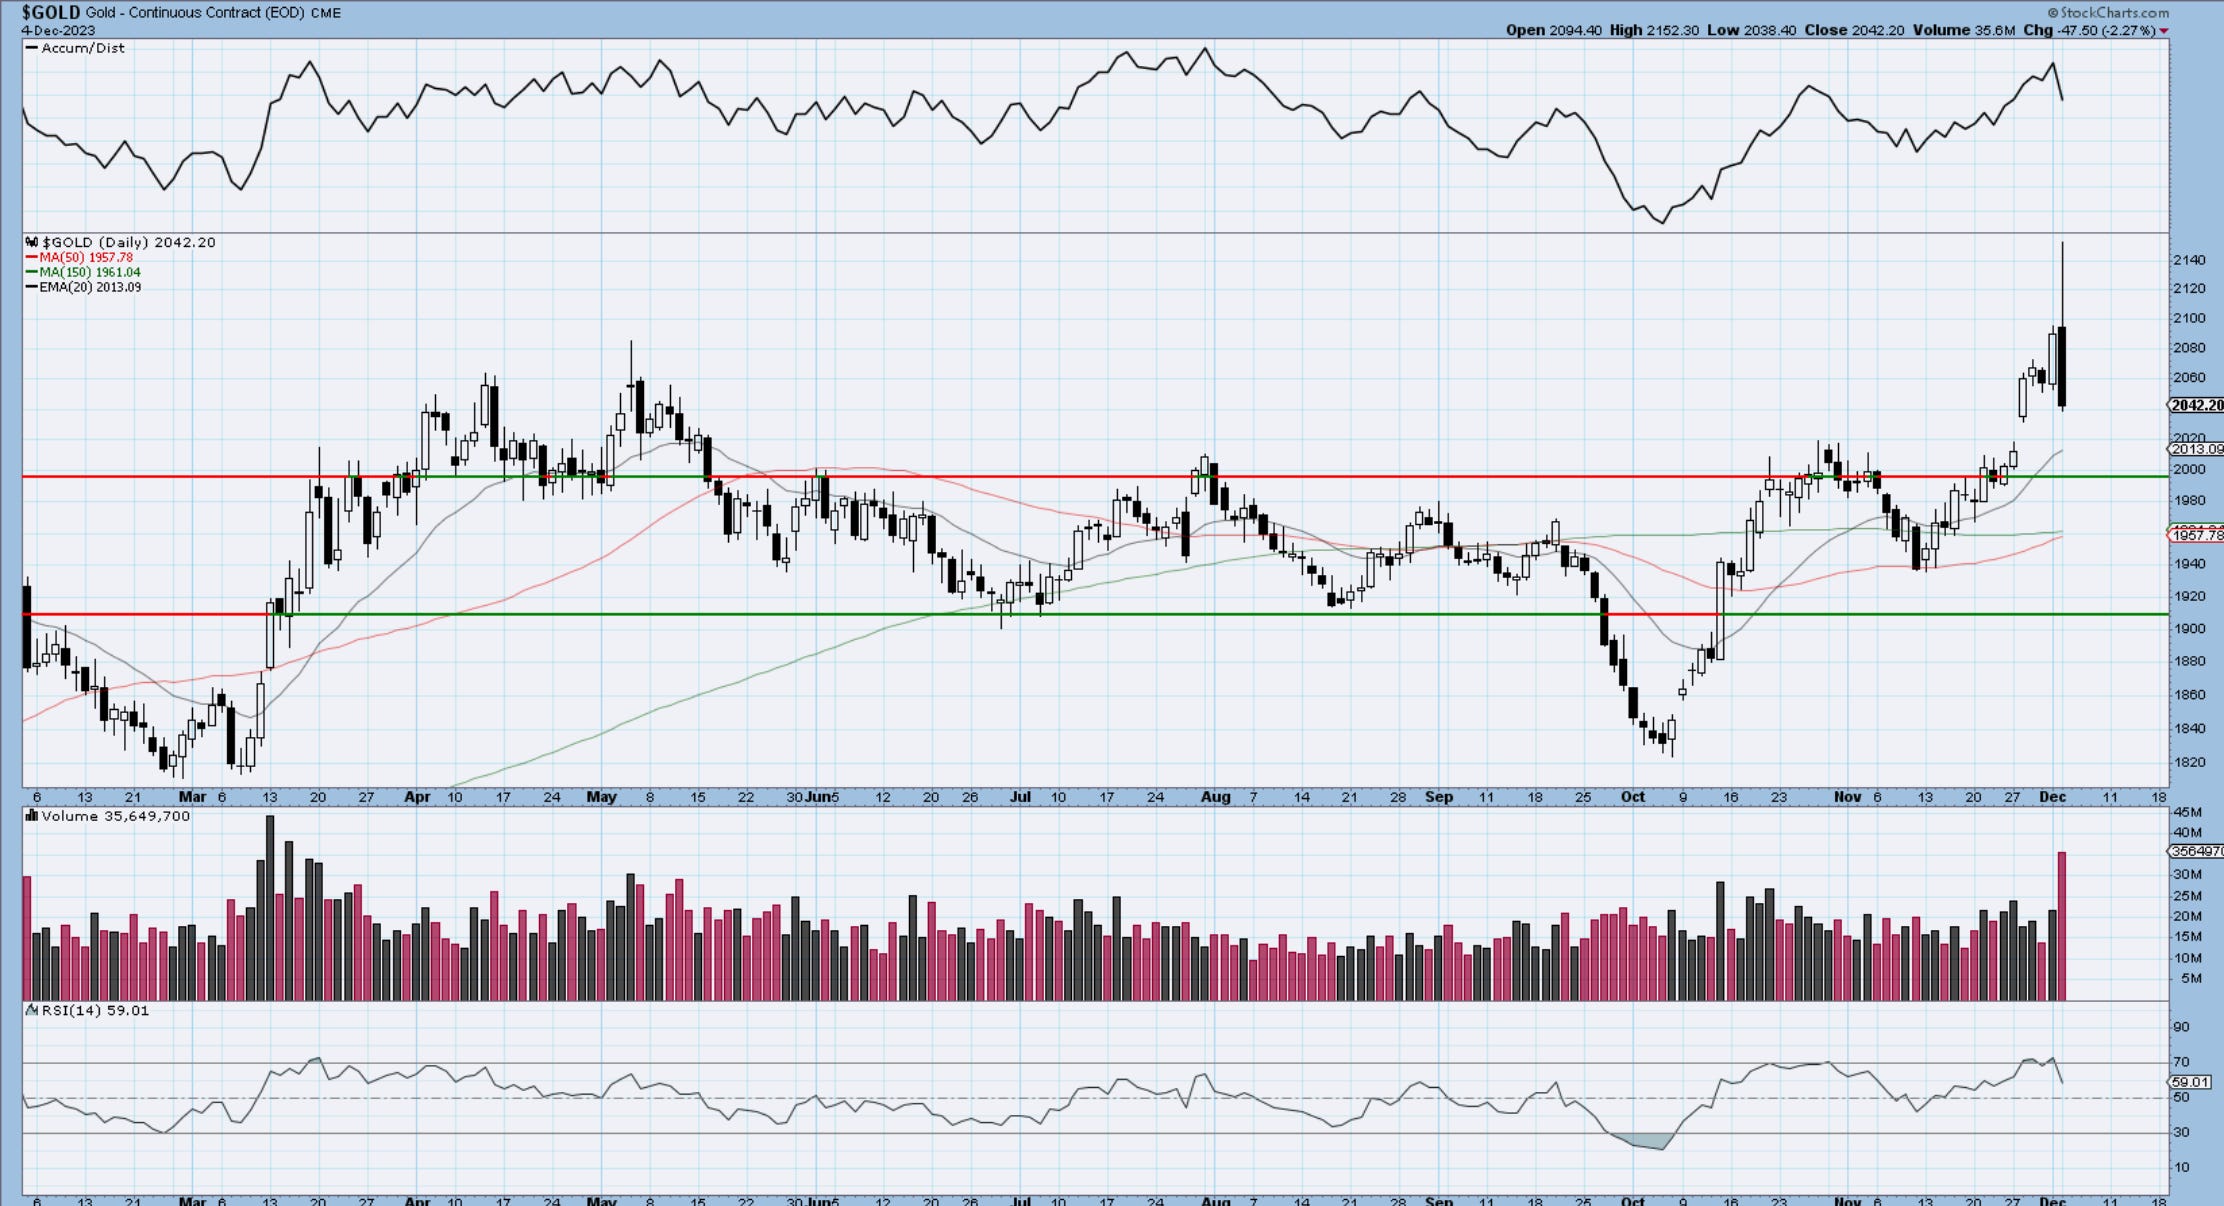
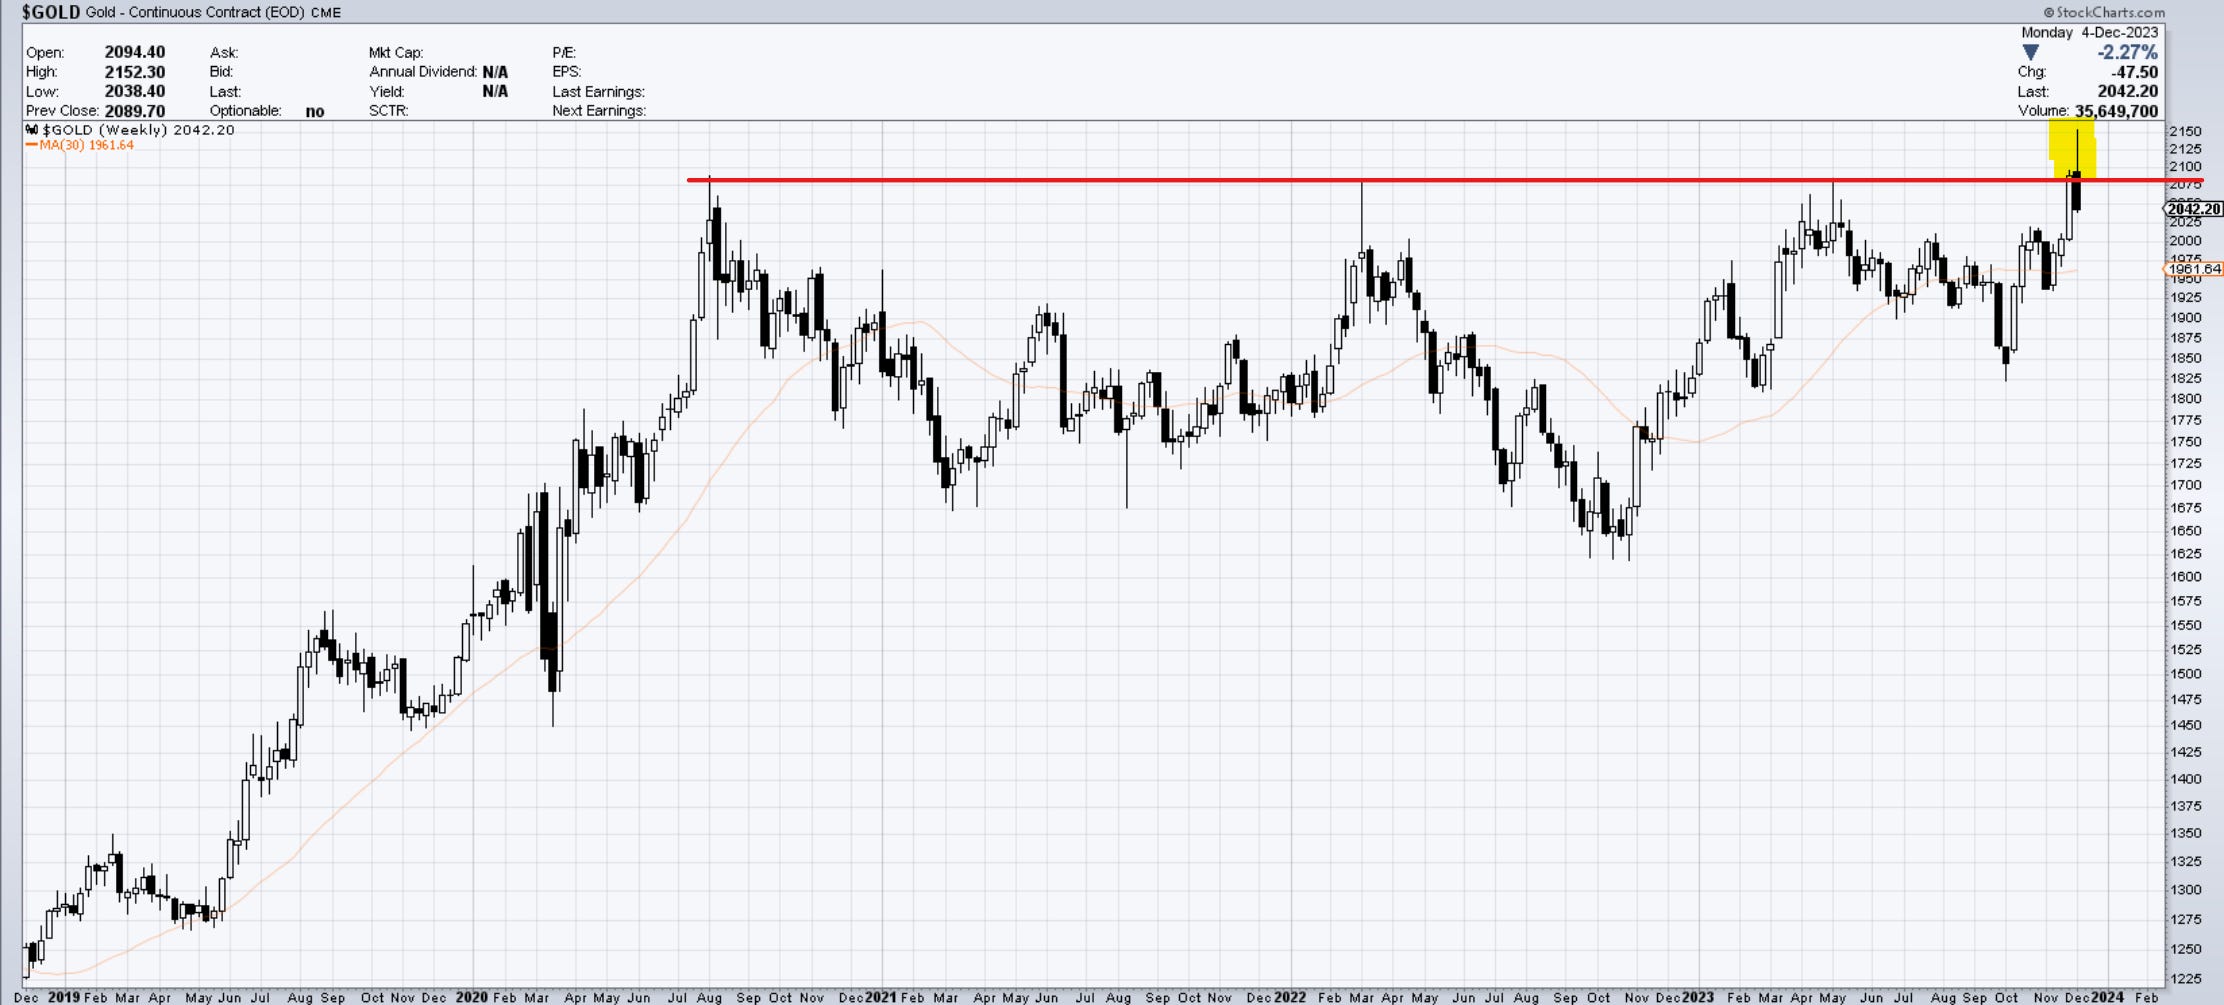
Gold
That’s one ugly failure in Gold. Just as I was saying above, when two assets don’t talk to each other the results can be disturbing. It’s the type of reaction that maybe is meant to scare traders before we actually resume higher. Imagine being long and seeing that rejection. If it can stabilize and bounce, then maybe it was nothing else then an isolated event. What gold bulls don’t want to see here, is further selling and metal moving below 2000. If that happens it will explain that there are still many trapped longs above 2100 and can accelerate even below 1850 in the months to come. Will keep an eye on its behavior.
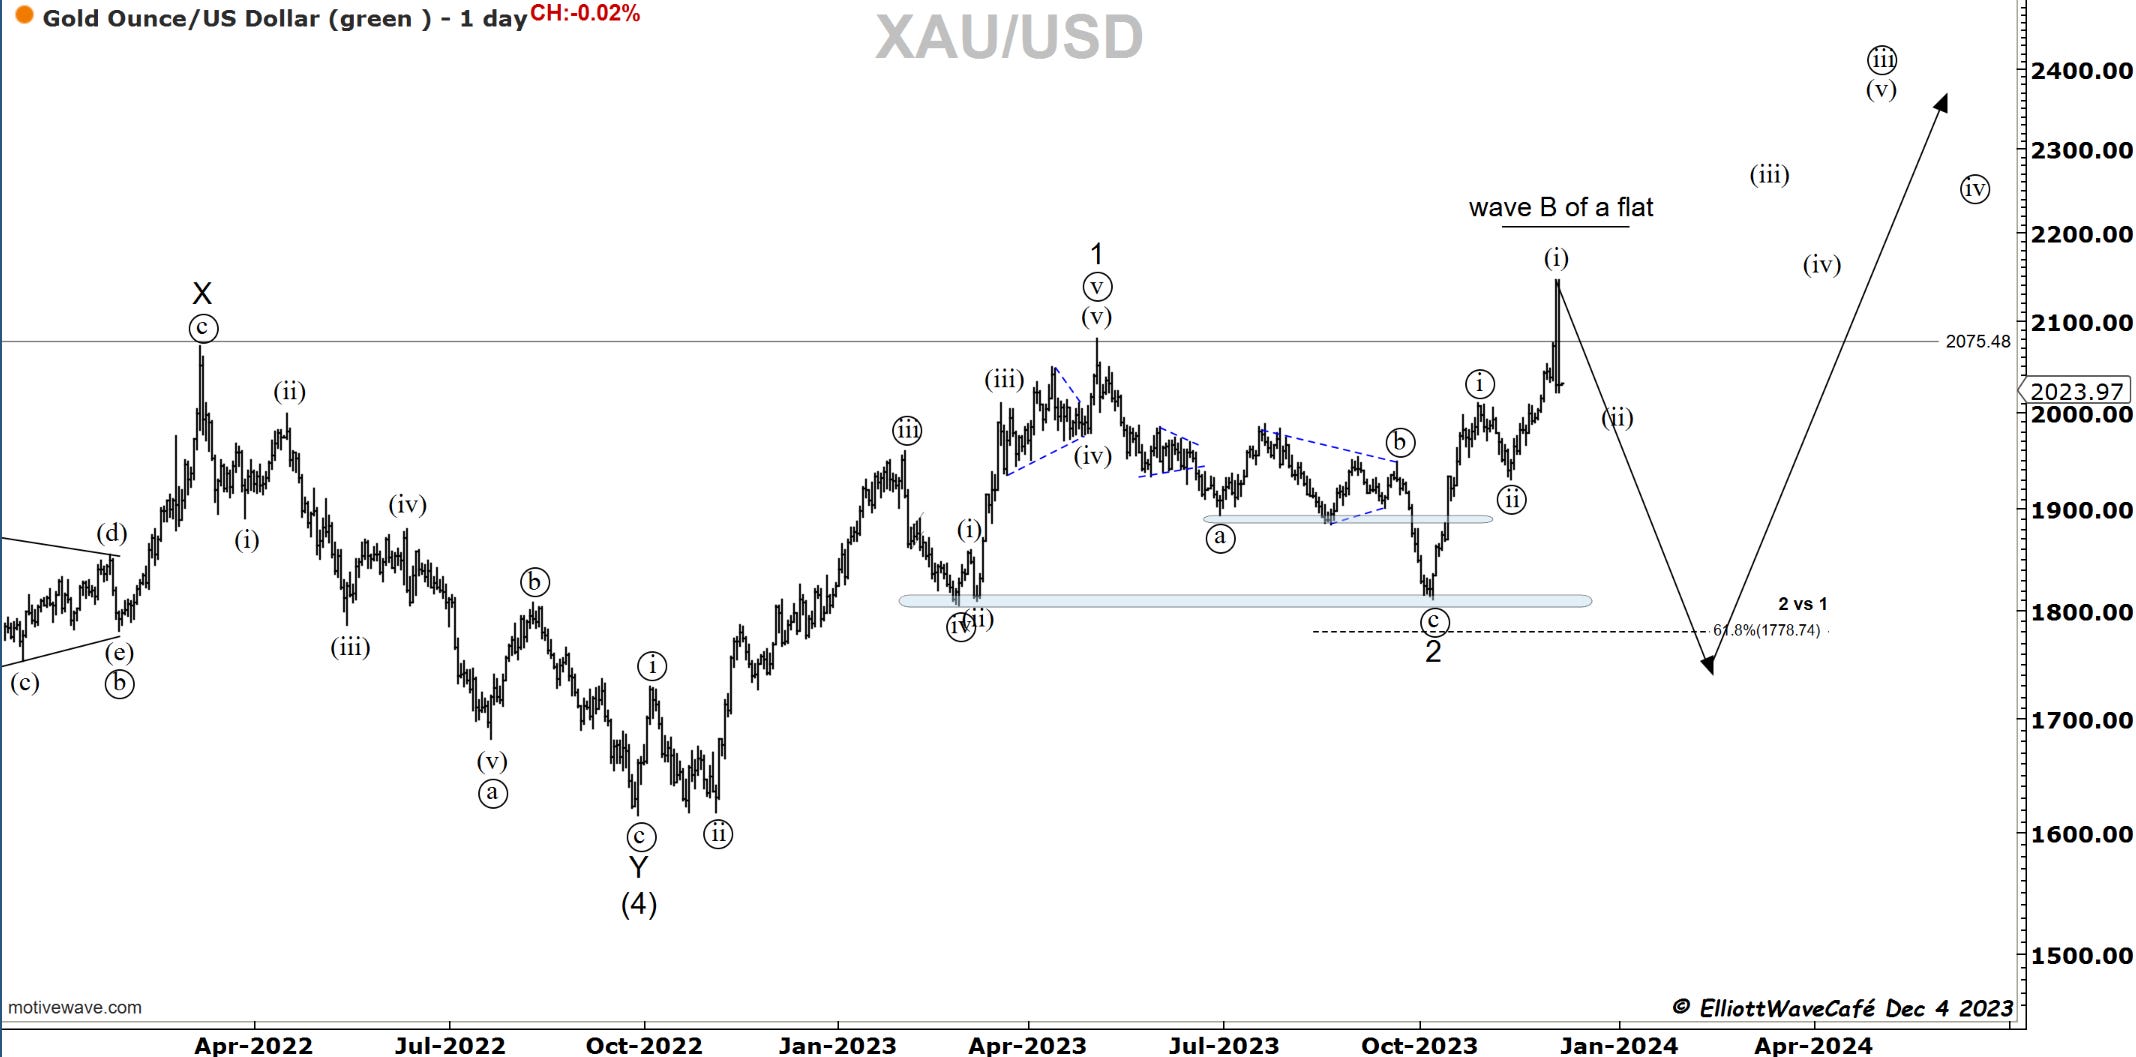
Here is the wave B of a flat scenario. If we hold as a (ii) that’s great news for longs.
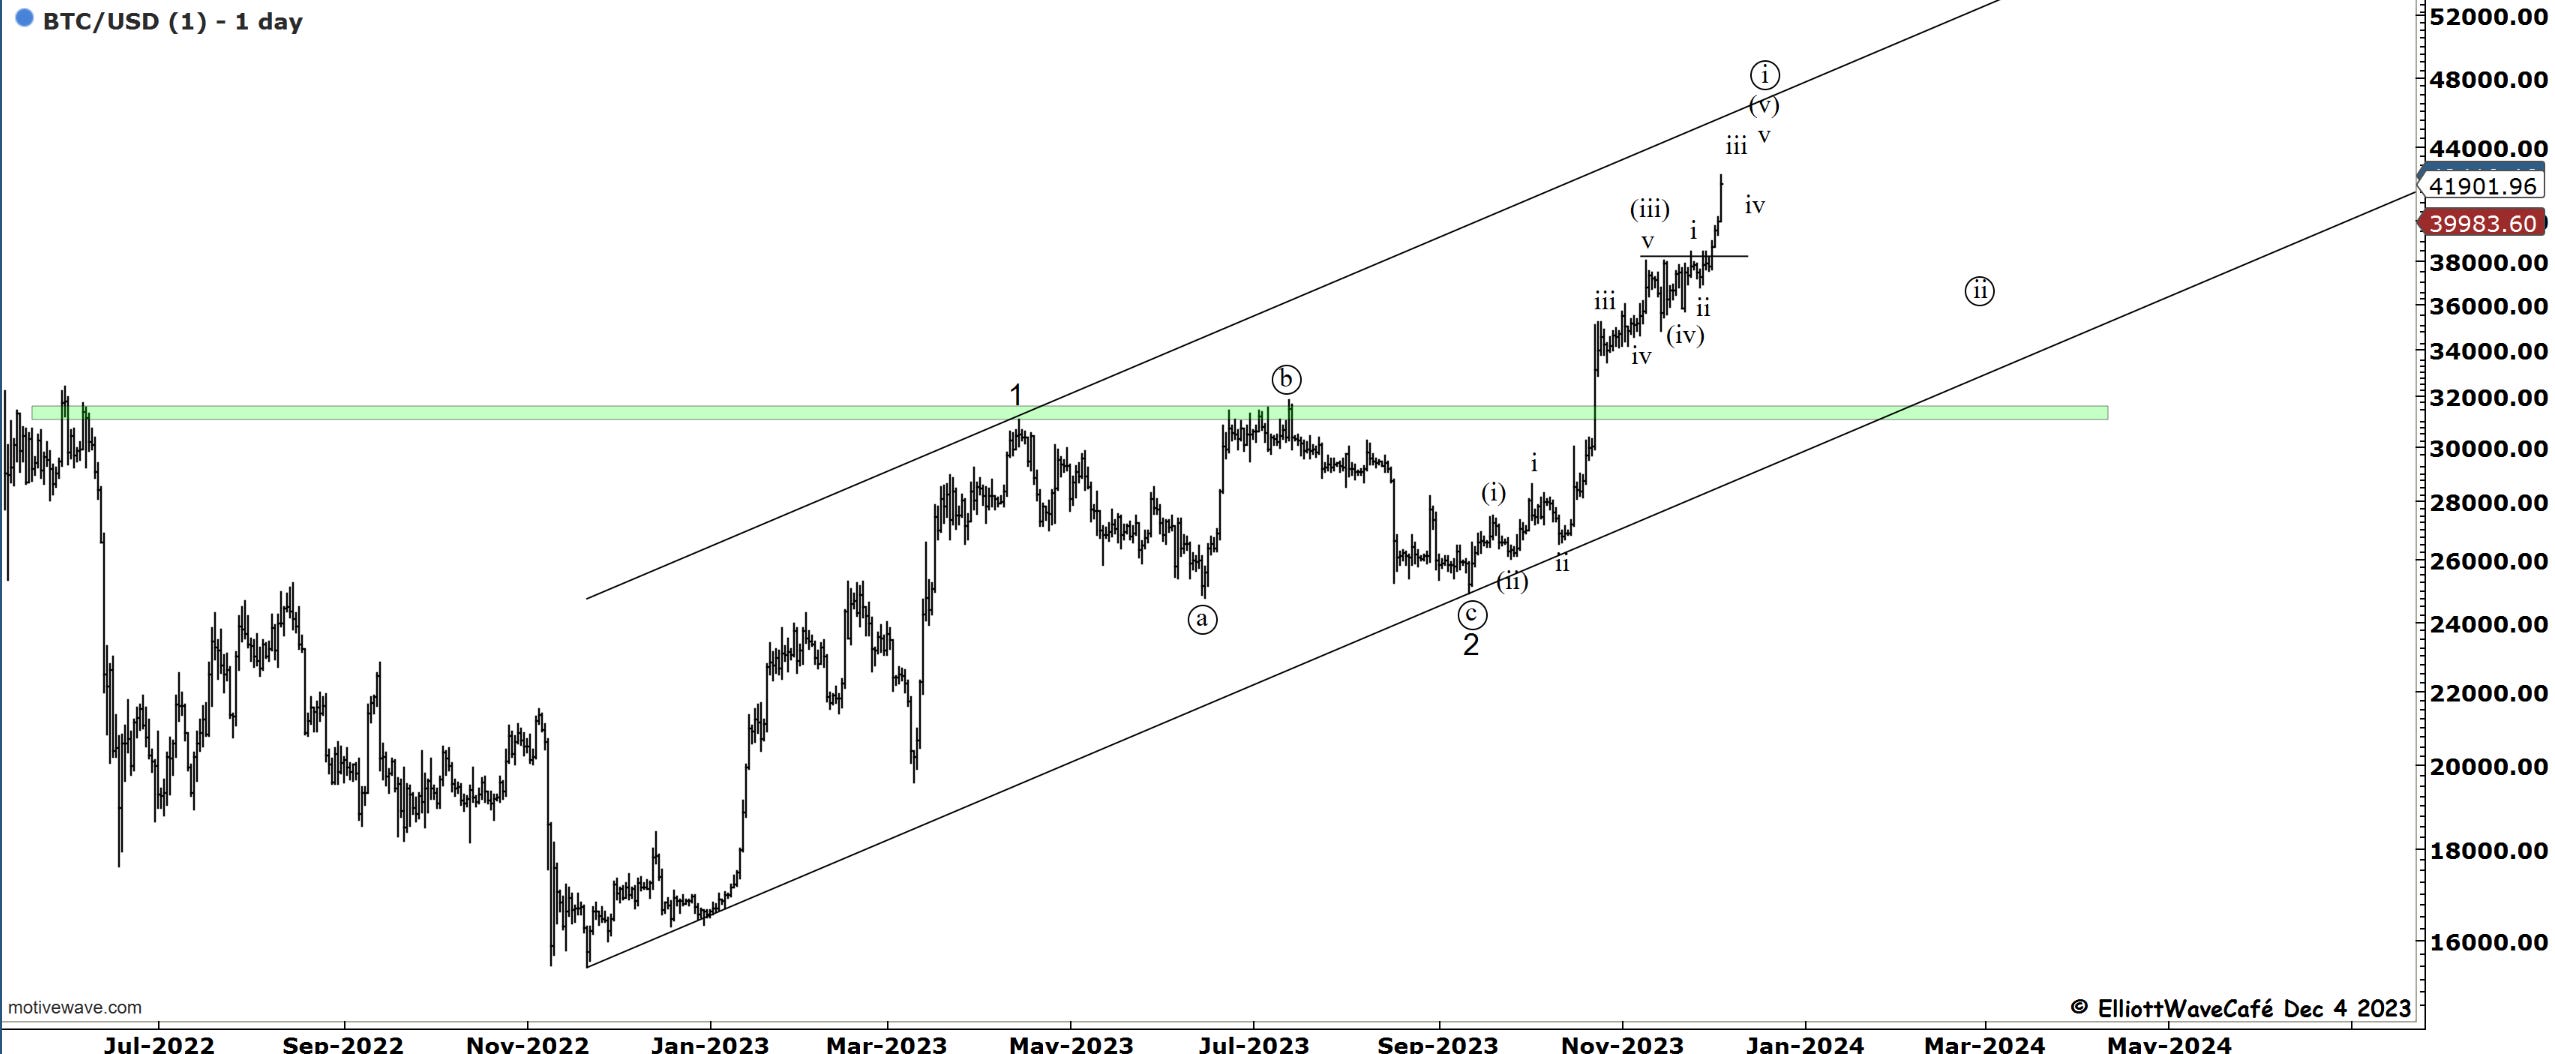
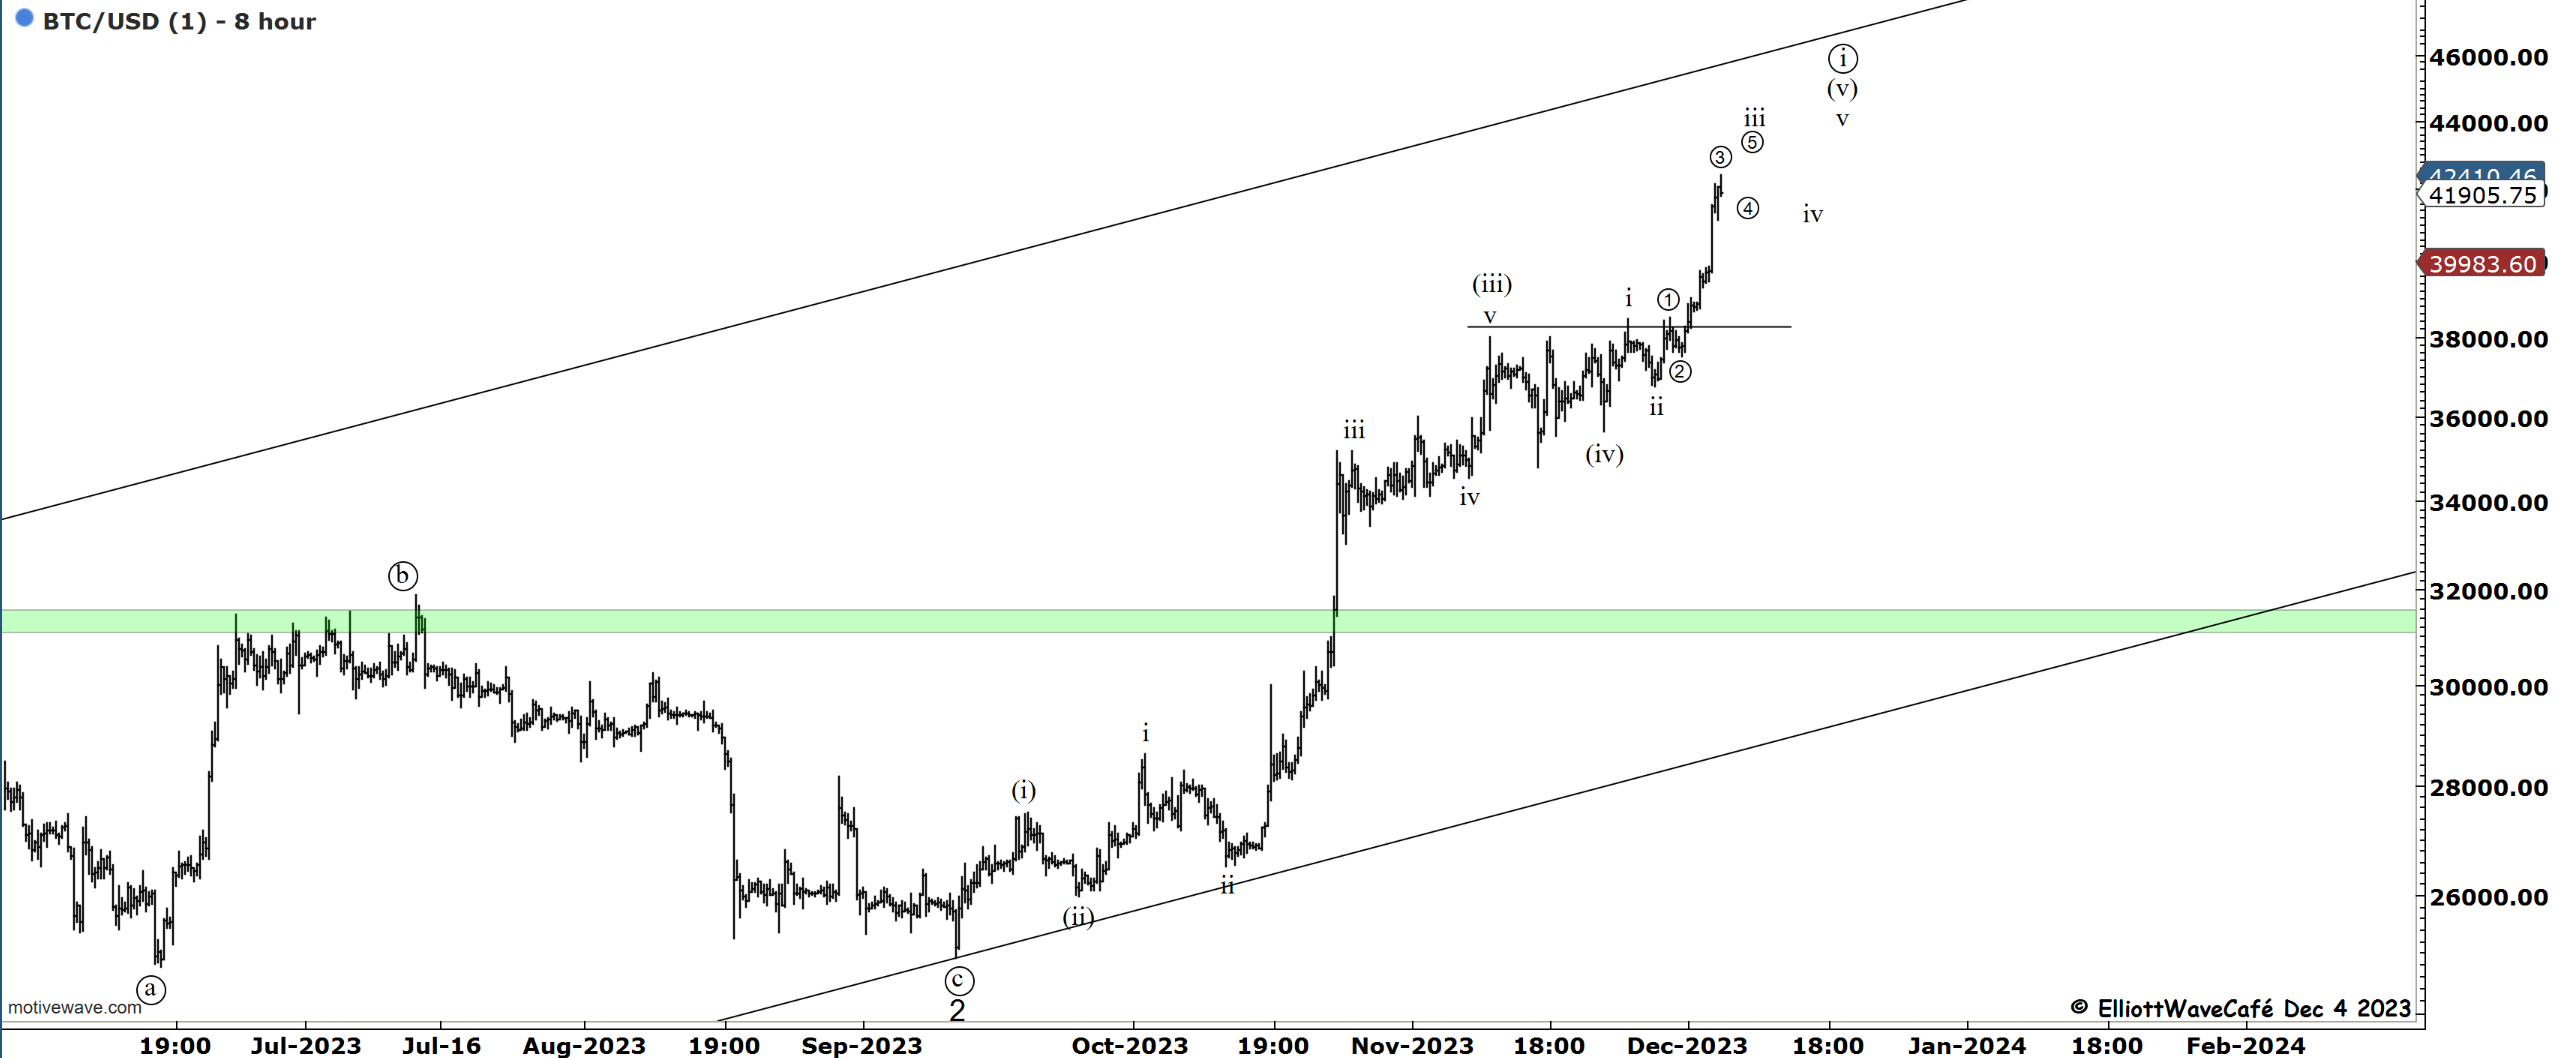
Bitcoin
Over the weekend breakout sent BTC towards 42k. It’s a final 5th wave thrust ahead of a corrective period. The bounce was higher and stronger than my expectations near 40k. The three charts below describe my thinking for the upcoming price action. Since we seem to be in a higher degree wave 3, one must be aware that pullbacks could be shallow and short-lived. As beautiful as a wave ((ii)) would look on the charts, we might not get it exactly like that. Shorter term if my subdivisions are right, we still need to grind higher a few more legs to complete the sequence. A move back below 39k would suggest the impulsive leg in wave ((i)) was completed.
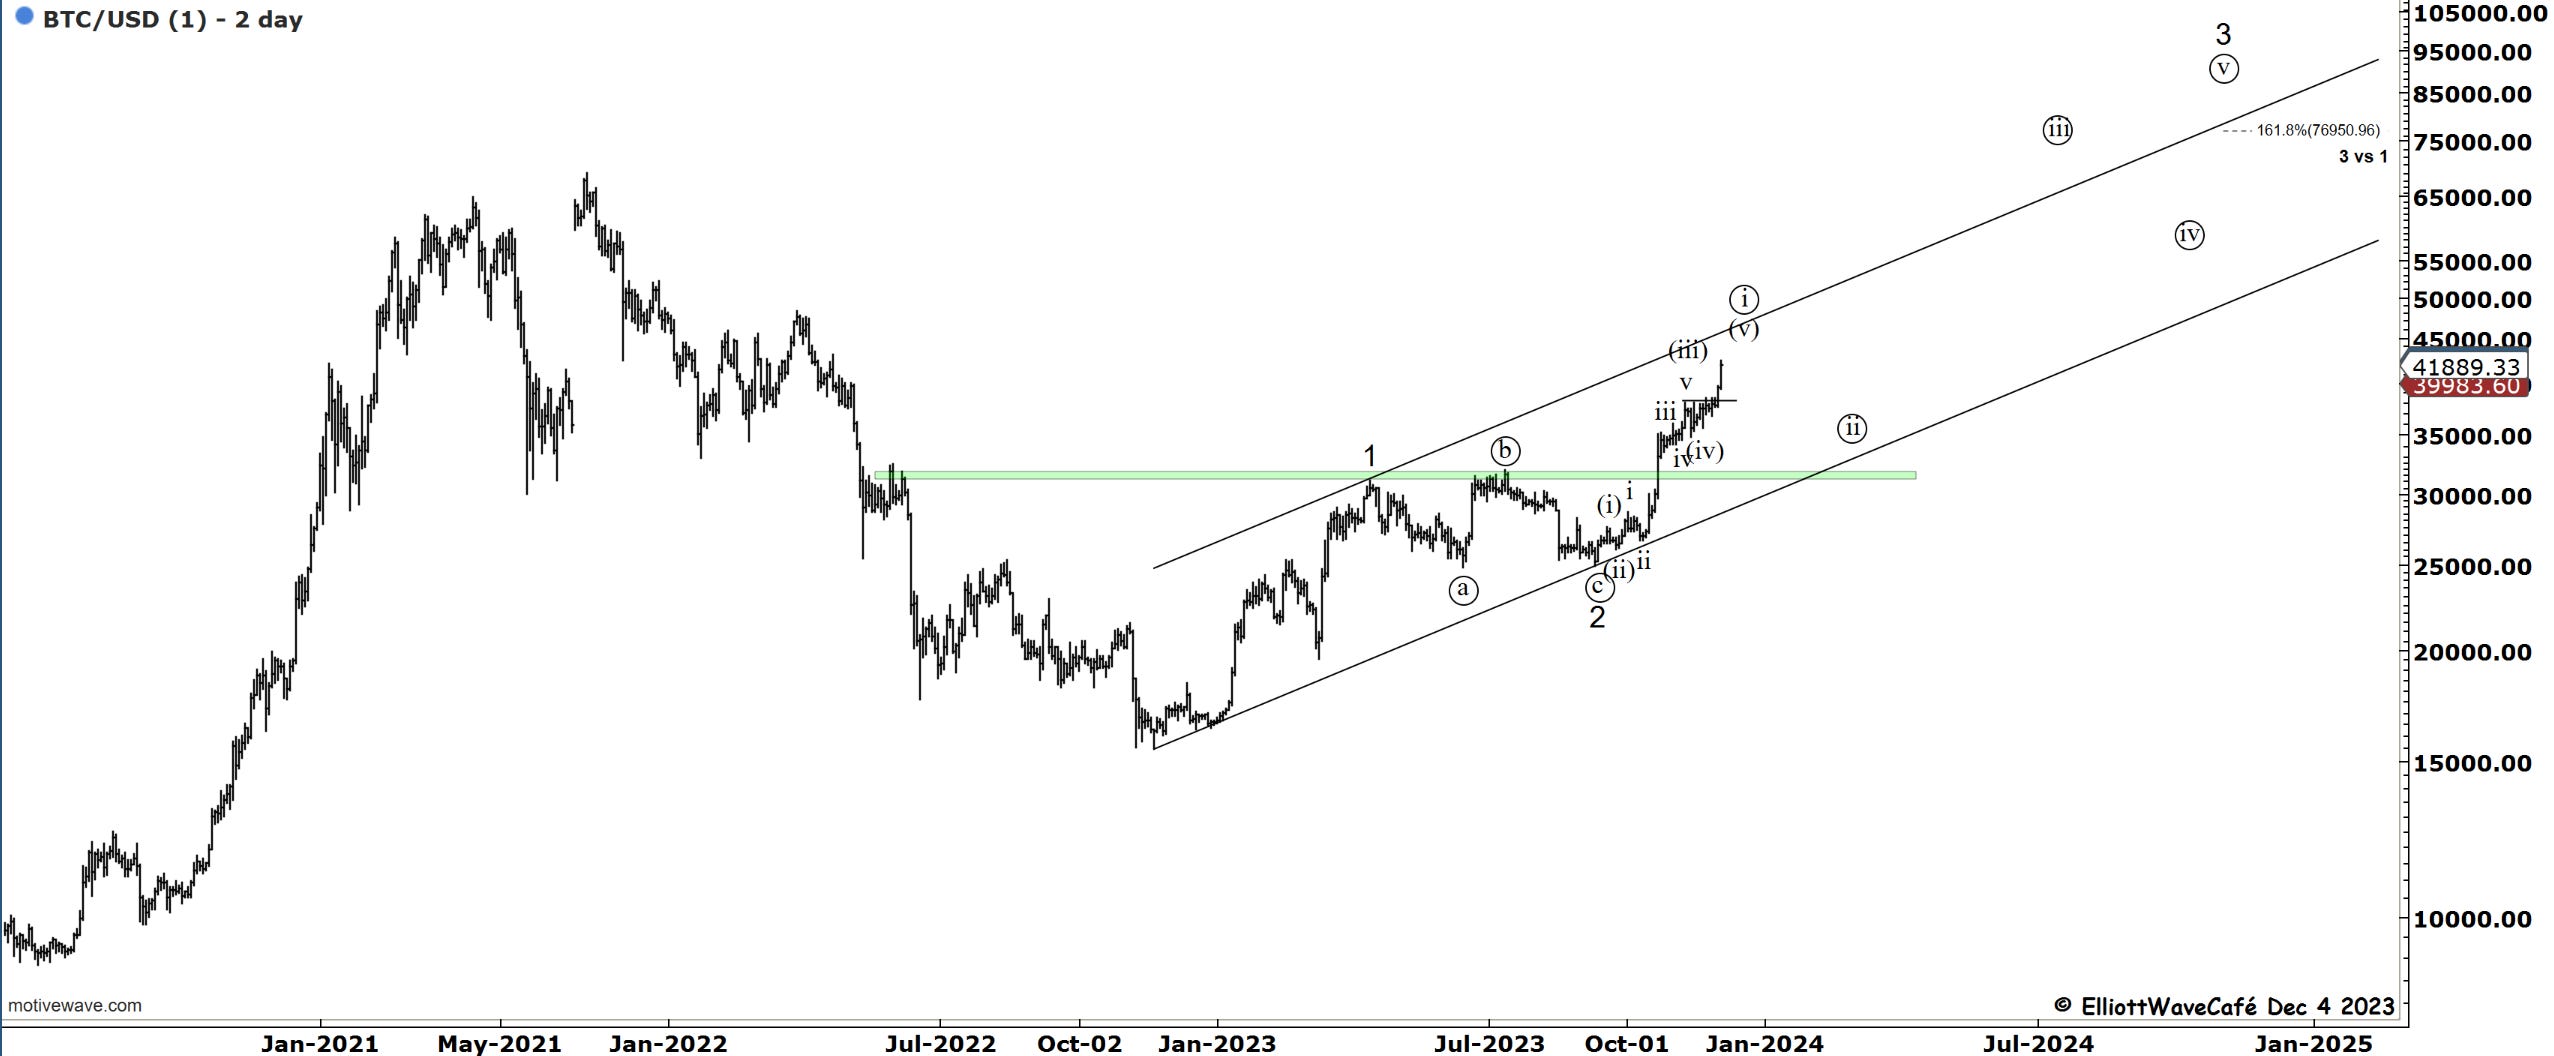
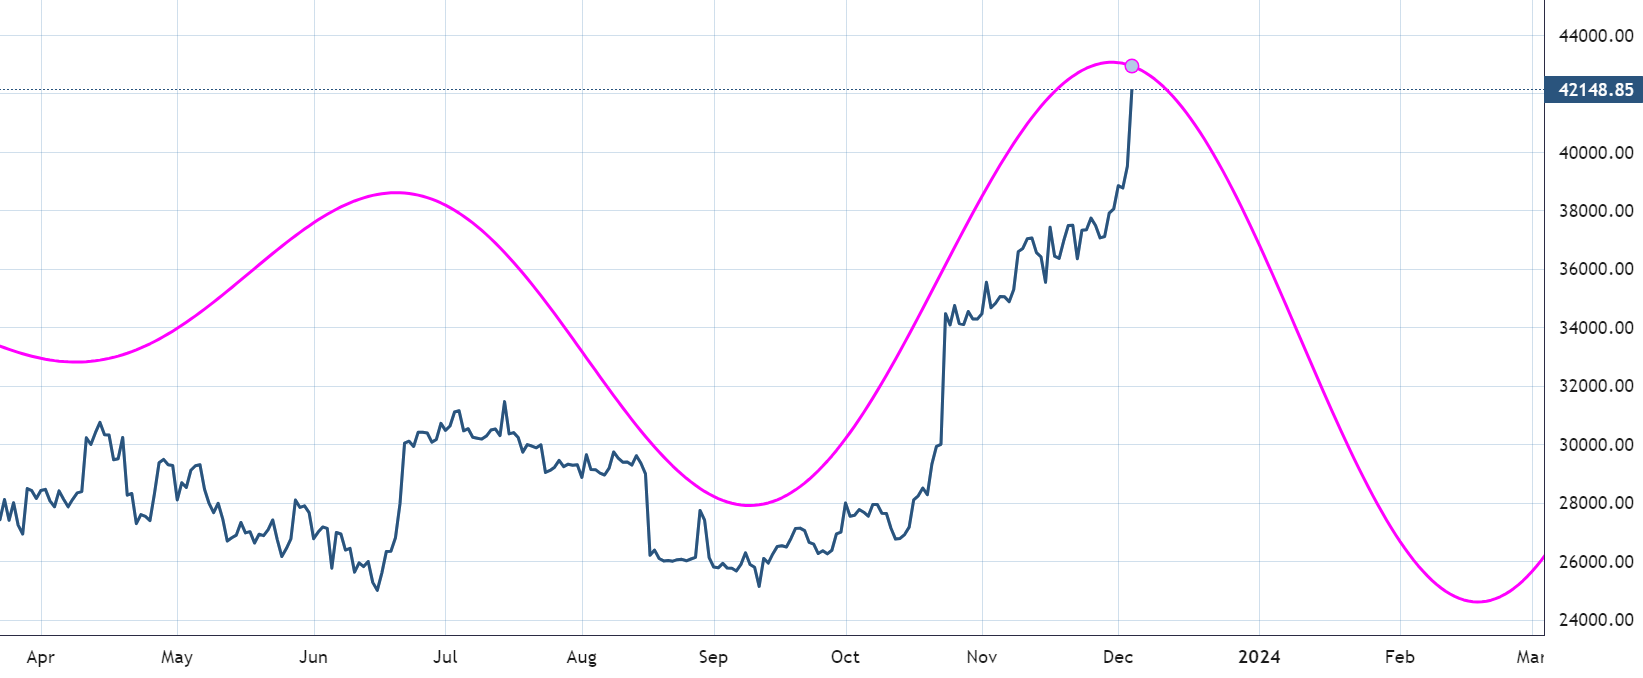
This BTC cycle is still in the back of my mind. It might just start after the top of the trending channel is hit above. I would tighten stops and take partial profits if that fits your trading strategy.
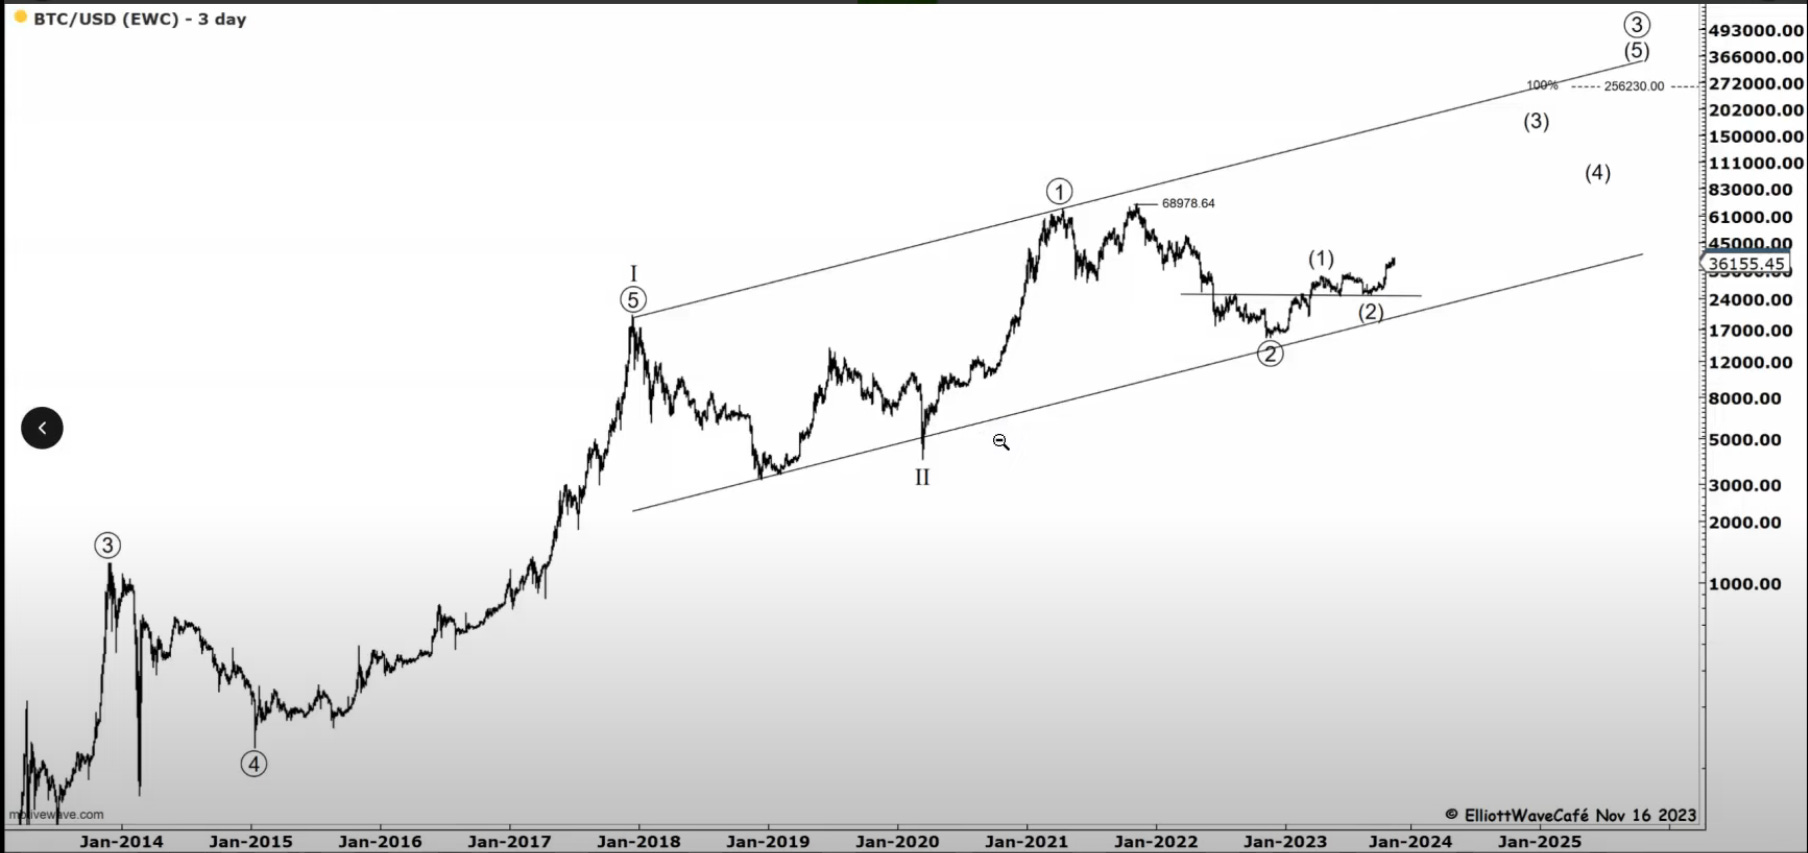
The much larger count can be found here. Presented this on Nov 16th note.
Daily video coming up next,
Have a great day wherever you are! - trade well, and don’t forget to subscribe and drop a like if this letter helps you in any way.
Cris
email: ewcafe@pm.me