
The Daily Drip
Core markets charts updates and commentary
Note: The counts on the right edge are real-time, and they are prone to adjustments as price action develops. Elliott Wave has a fluid approach, is evidence-based, and requires constant monitoring of certain thresholds.
In the counts below, this (( )) = circle on chart
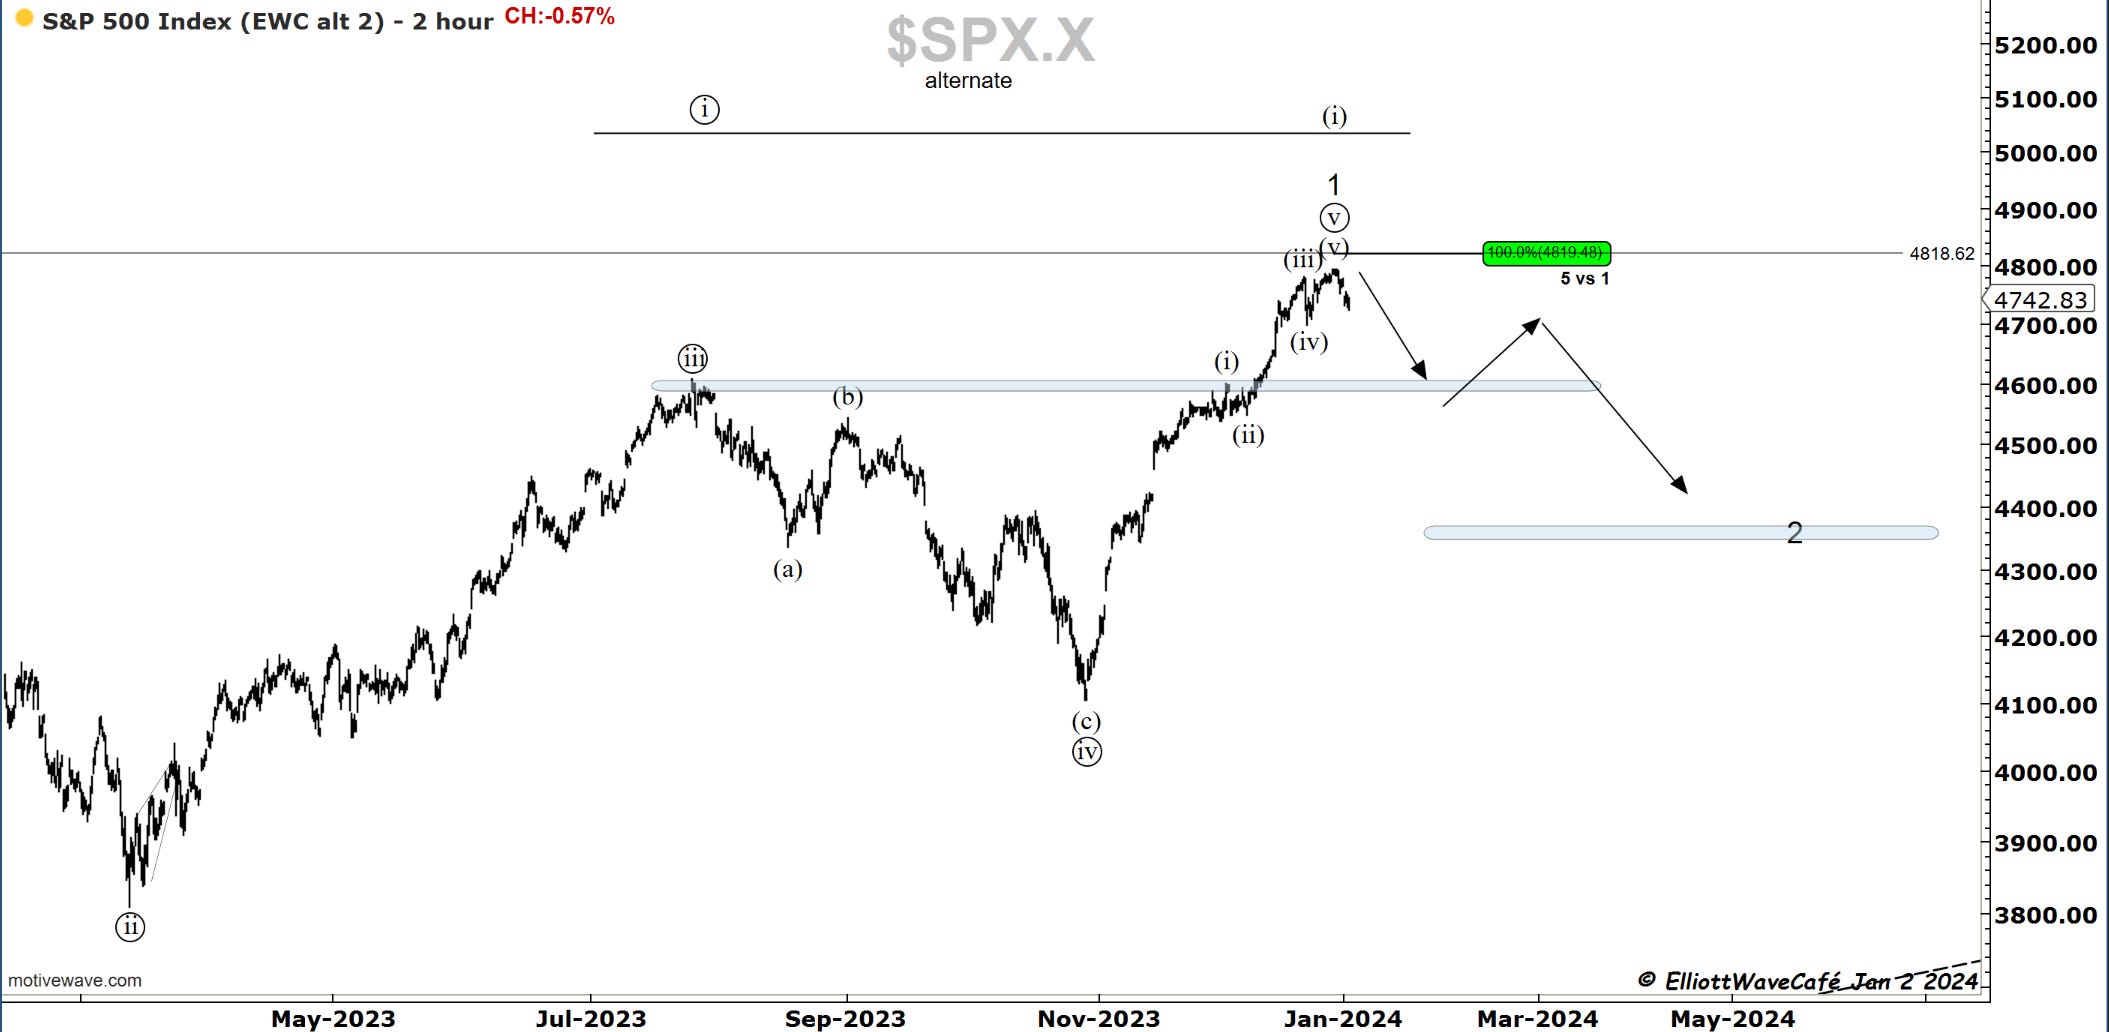
SP500
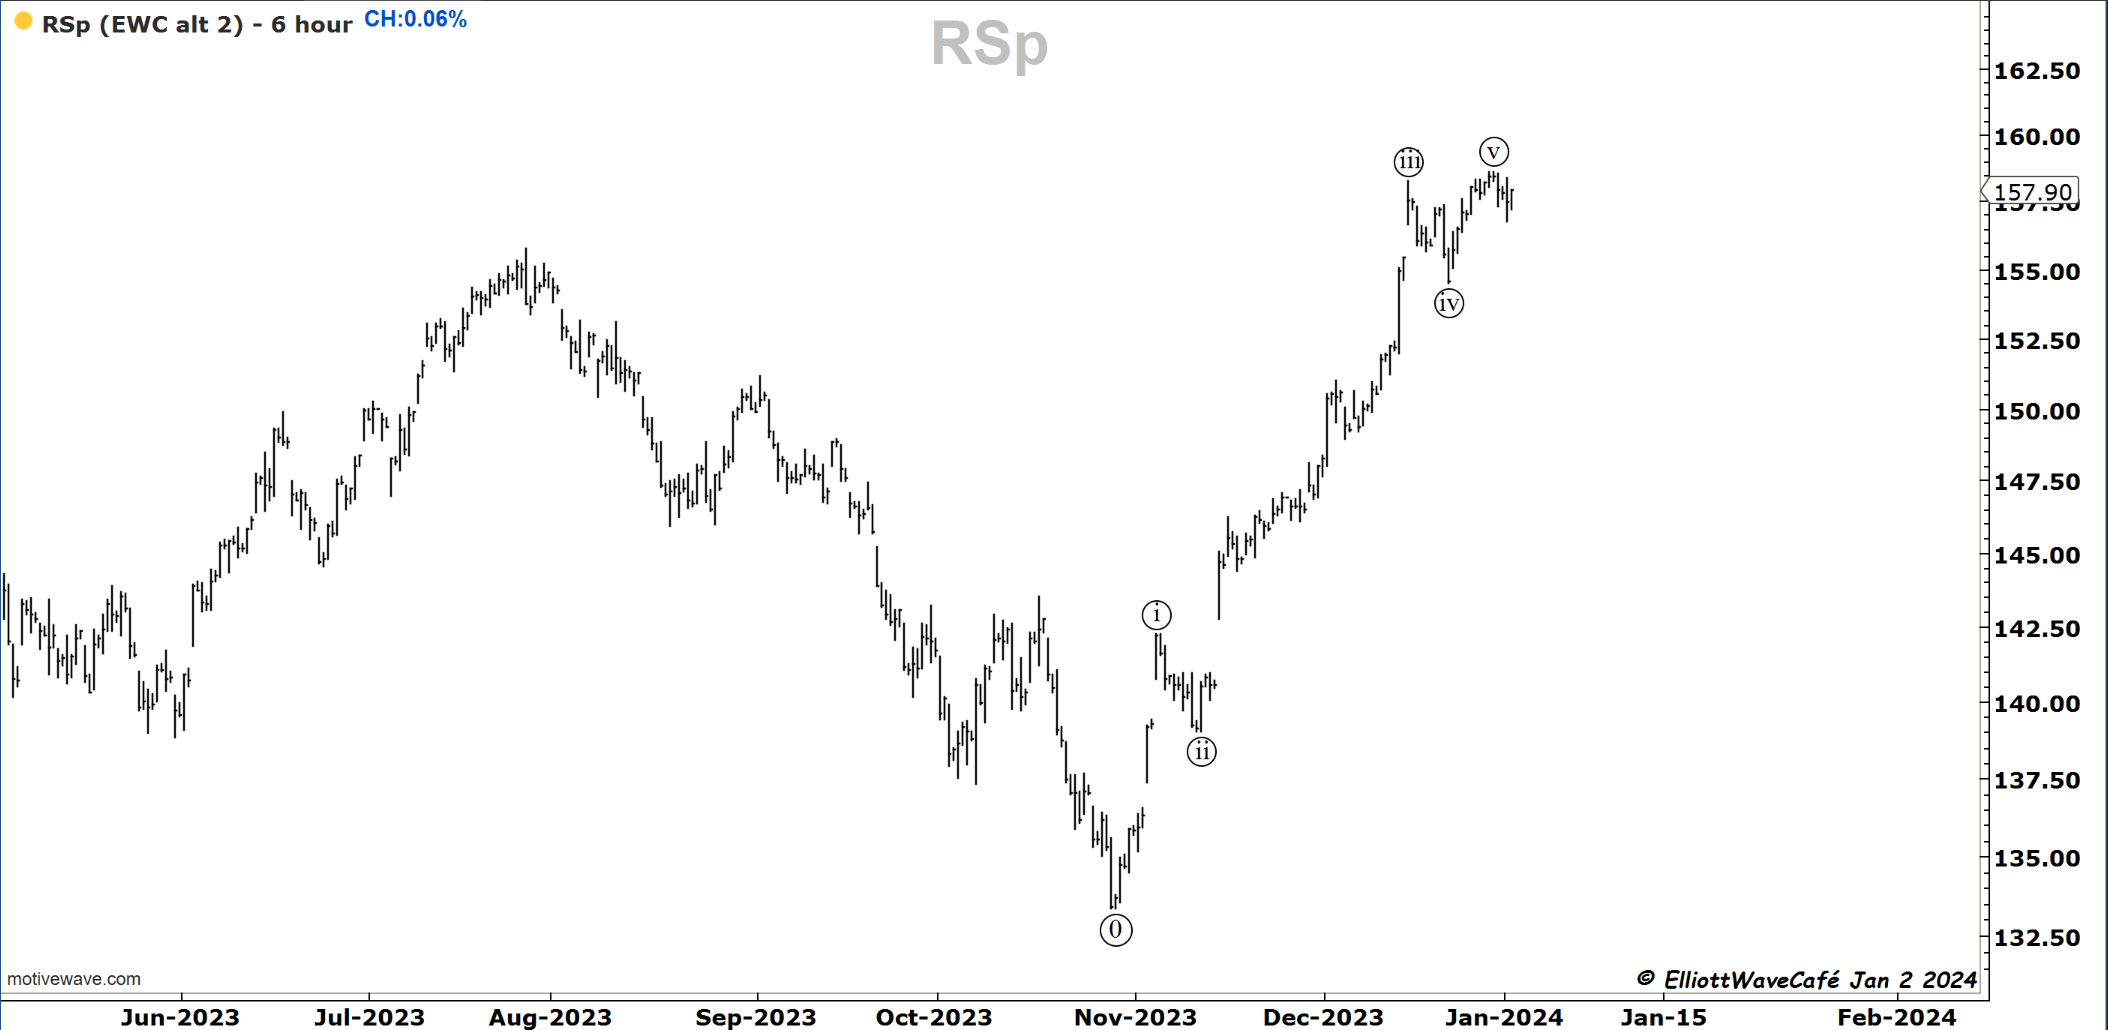
The year started with a bit of selling across markets. The concentration of the large caps made it feel a bit worse than it actually was because if you look at an equal weight chart, RSP, we were actually flat on the day. The reasons for this can be attributed to a number of factors, one of which we touched on in the last letter from 2023, and it referred to profit tax selling so as to not incur gains in 2023 and delay them for a year. The other one that came this morning was an Apple downgrade. So, one of the days, known as quite a strong positive on a seasonal basis, ended up on the opposite side.
The count is unchanged from last week, and we’re getting further confirmation of a top. Since today’s move will be nowhere near enough to correct the advance from late October, I expect further selling to take place on rallies until at least the 4600 targets are hit. Overall we can look at a 61.8% decline that could reach as low as 4400 before we can discuss a much larger rally in wave 3.
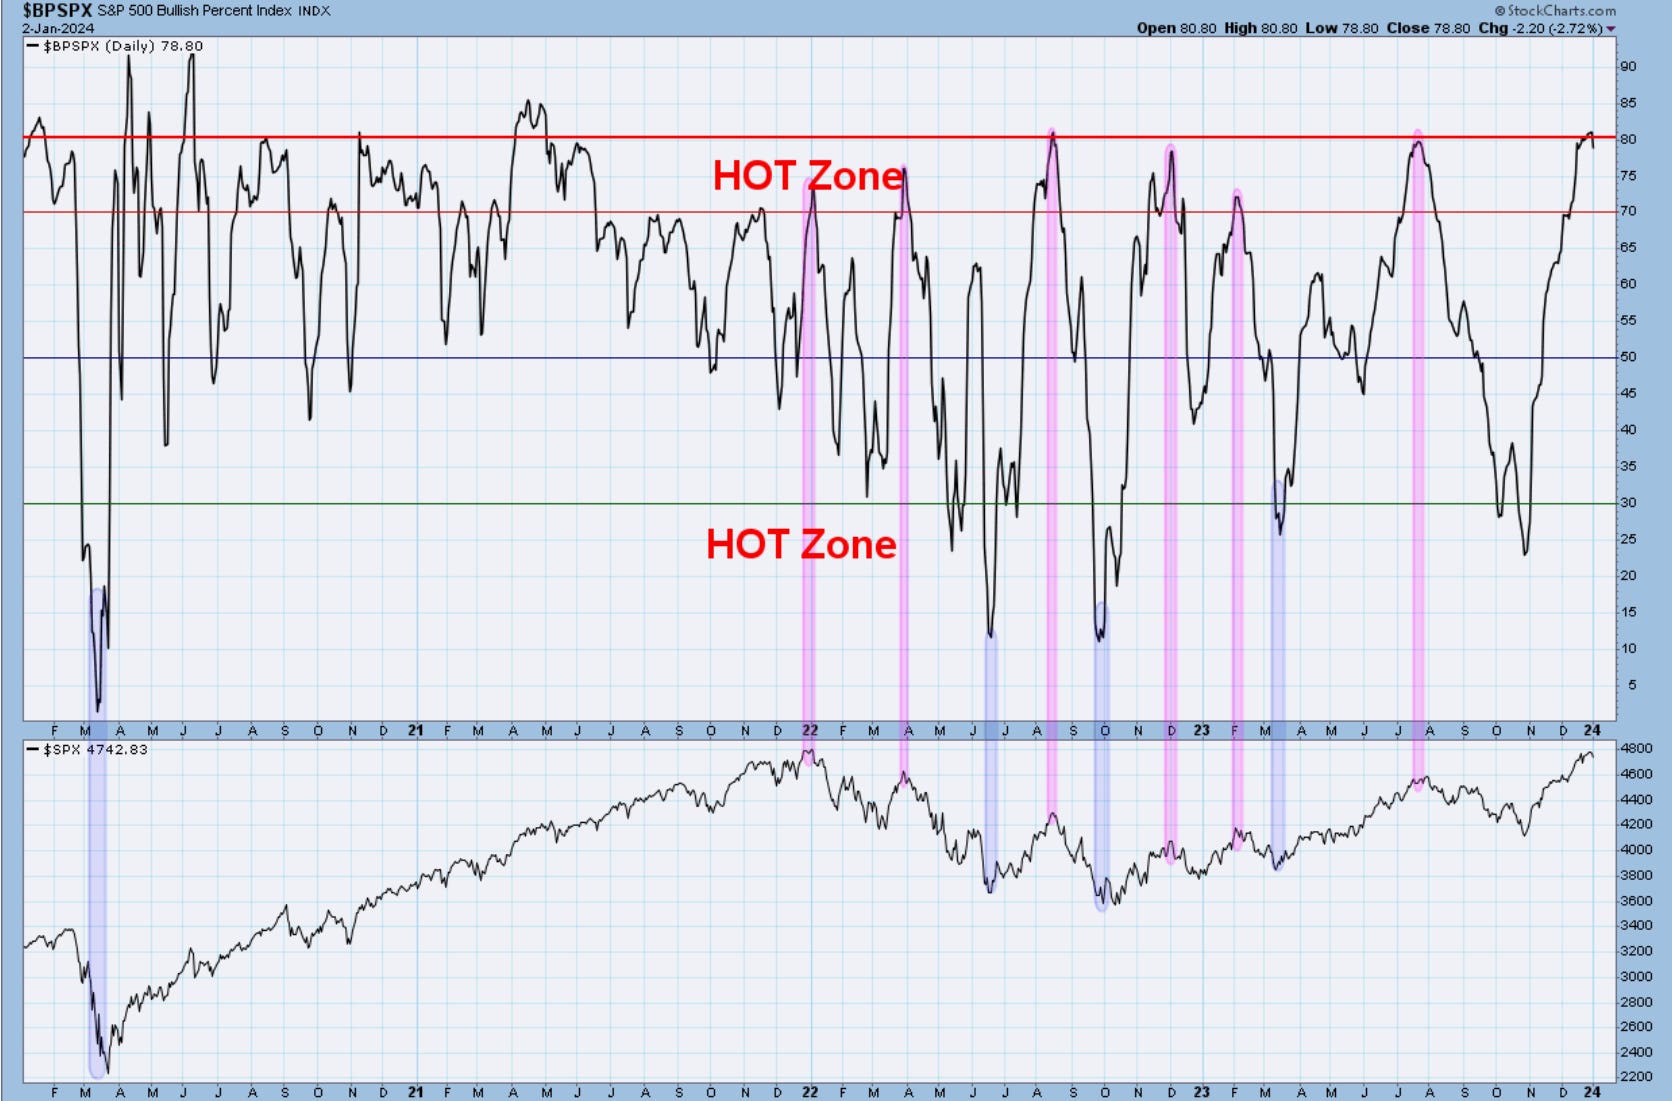
Notice how we barely turned down a small hook from BPI extreme 80 readings.
To conclude, I think stocks are entering a period of consolidation and correction with higher yields and higher dollar. The news we will be getting will likely support this thesis. The stocks of the week for long exposure I sent to clients yesterday were mostly staples and healthcare, and today alone, we were up 1.8% on -0.5% SPX. The short spread options positions on SPY and QQQ have jumped nicely as well. The timing on those is mid-February and March, and I will go over it in tonight’s video.
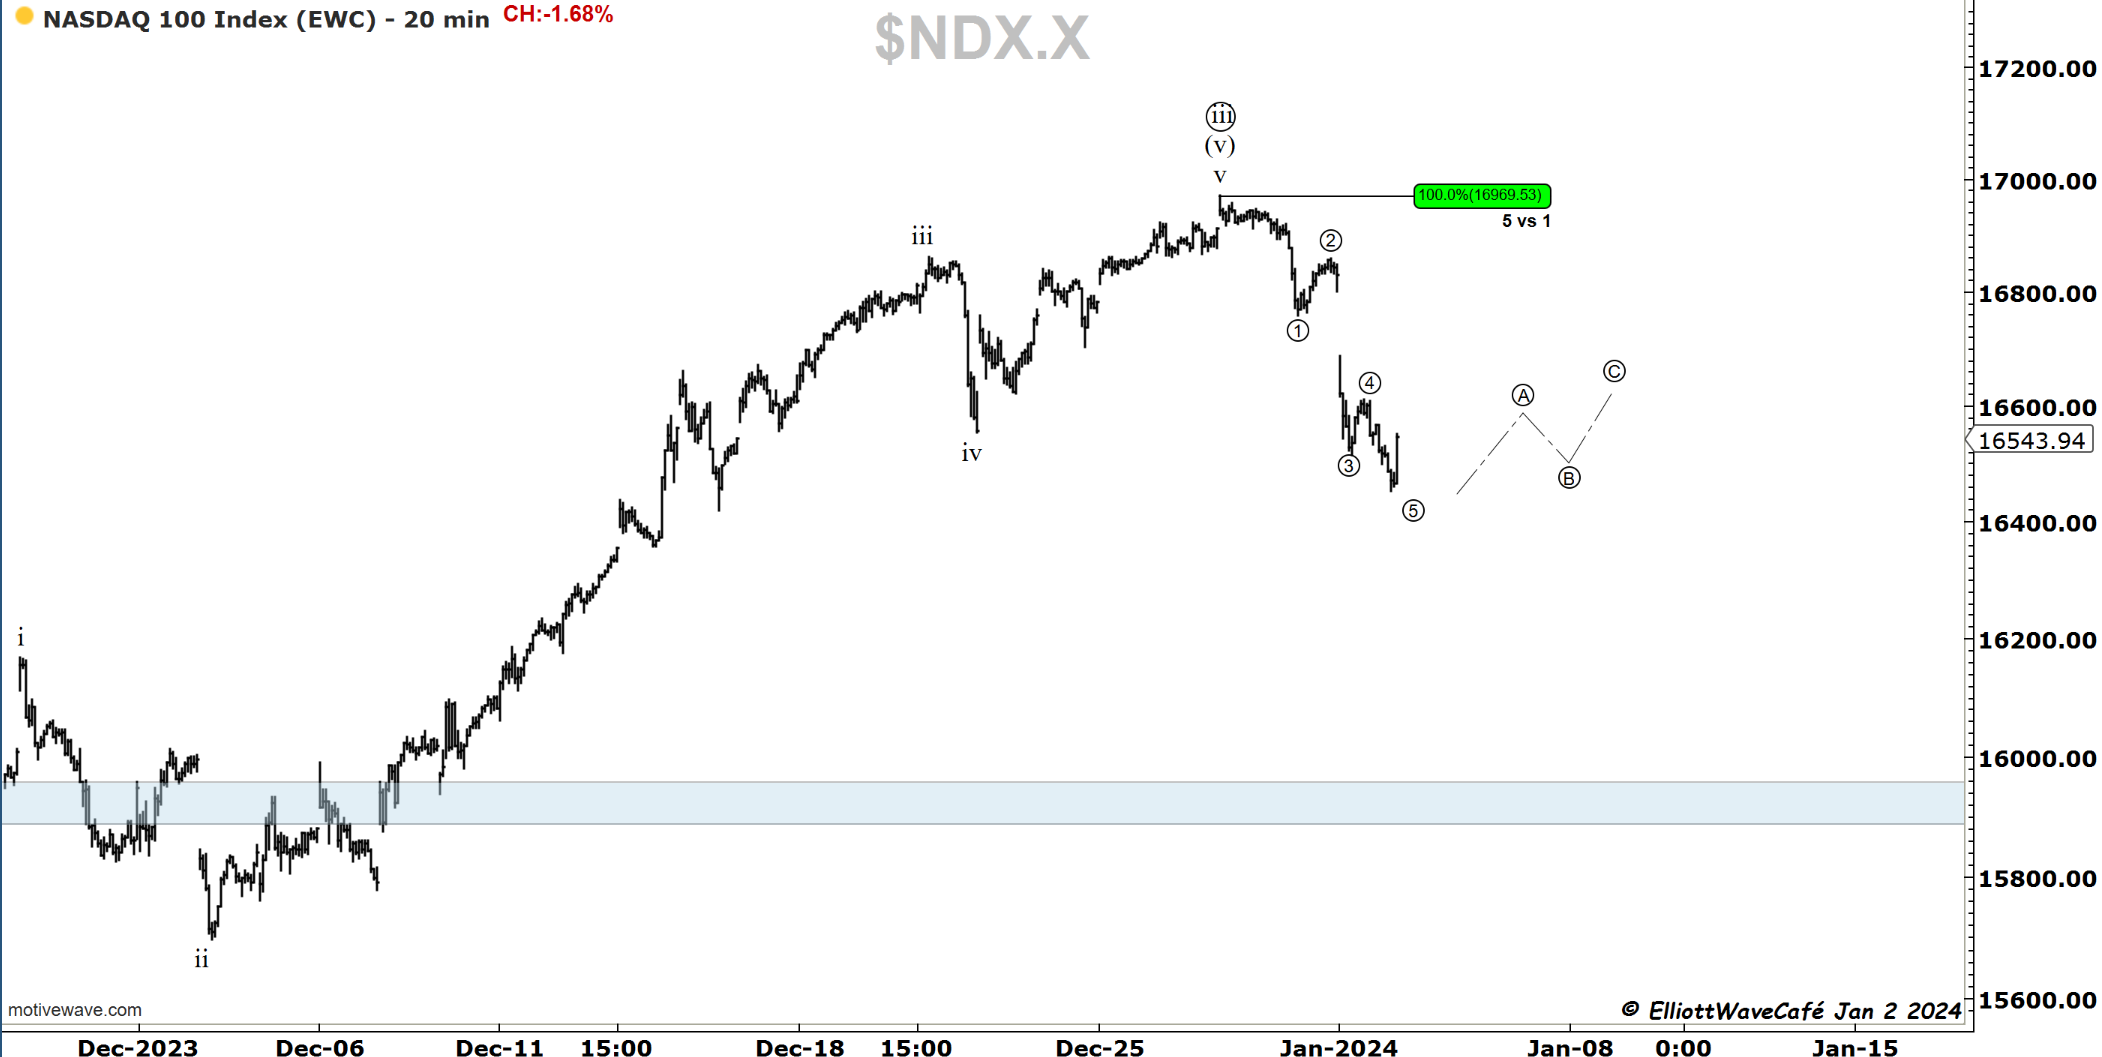
Nasdaq100
With the growth trade getting hit strongly, the Nasdaq lost -1.68%. On the second 20-minute chart, you can spot a nice 5-wave decline, which tells us that any corrective rallies will be subject to further selling. The initial target is 16,000, where I expect bids to come in and support prices. I think even that level will ultimately fail to allow for a slightly deeper correction. I am considering it a wave ((iv)) at the moment until and if any evidence builds for it being a second wave instead at the larger degree, just like in the SP500.
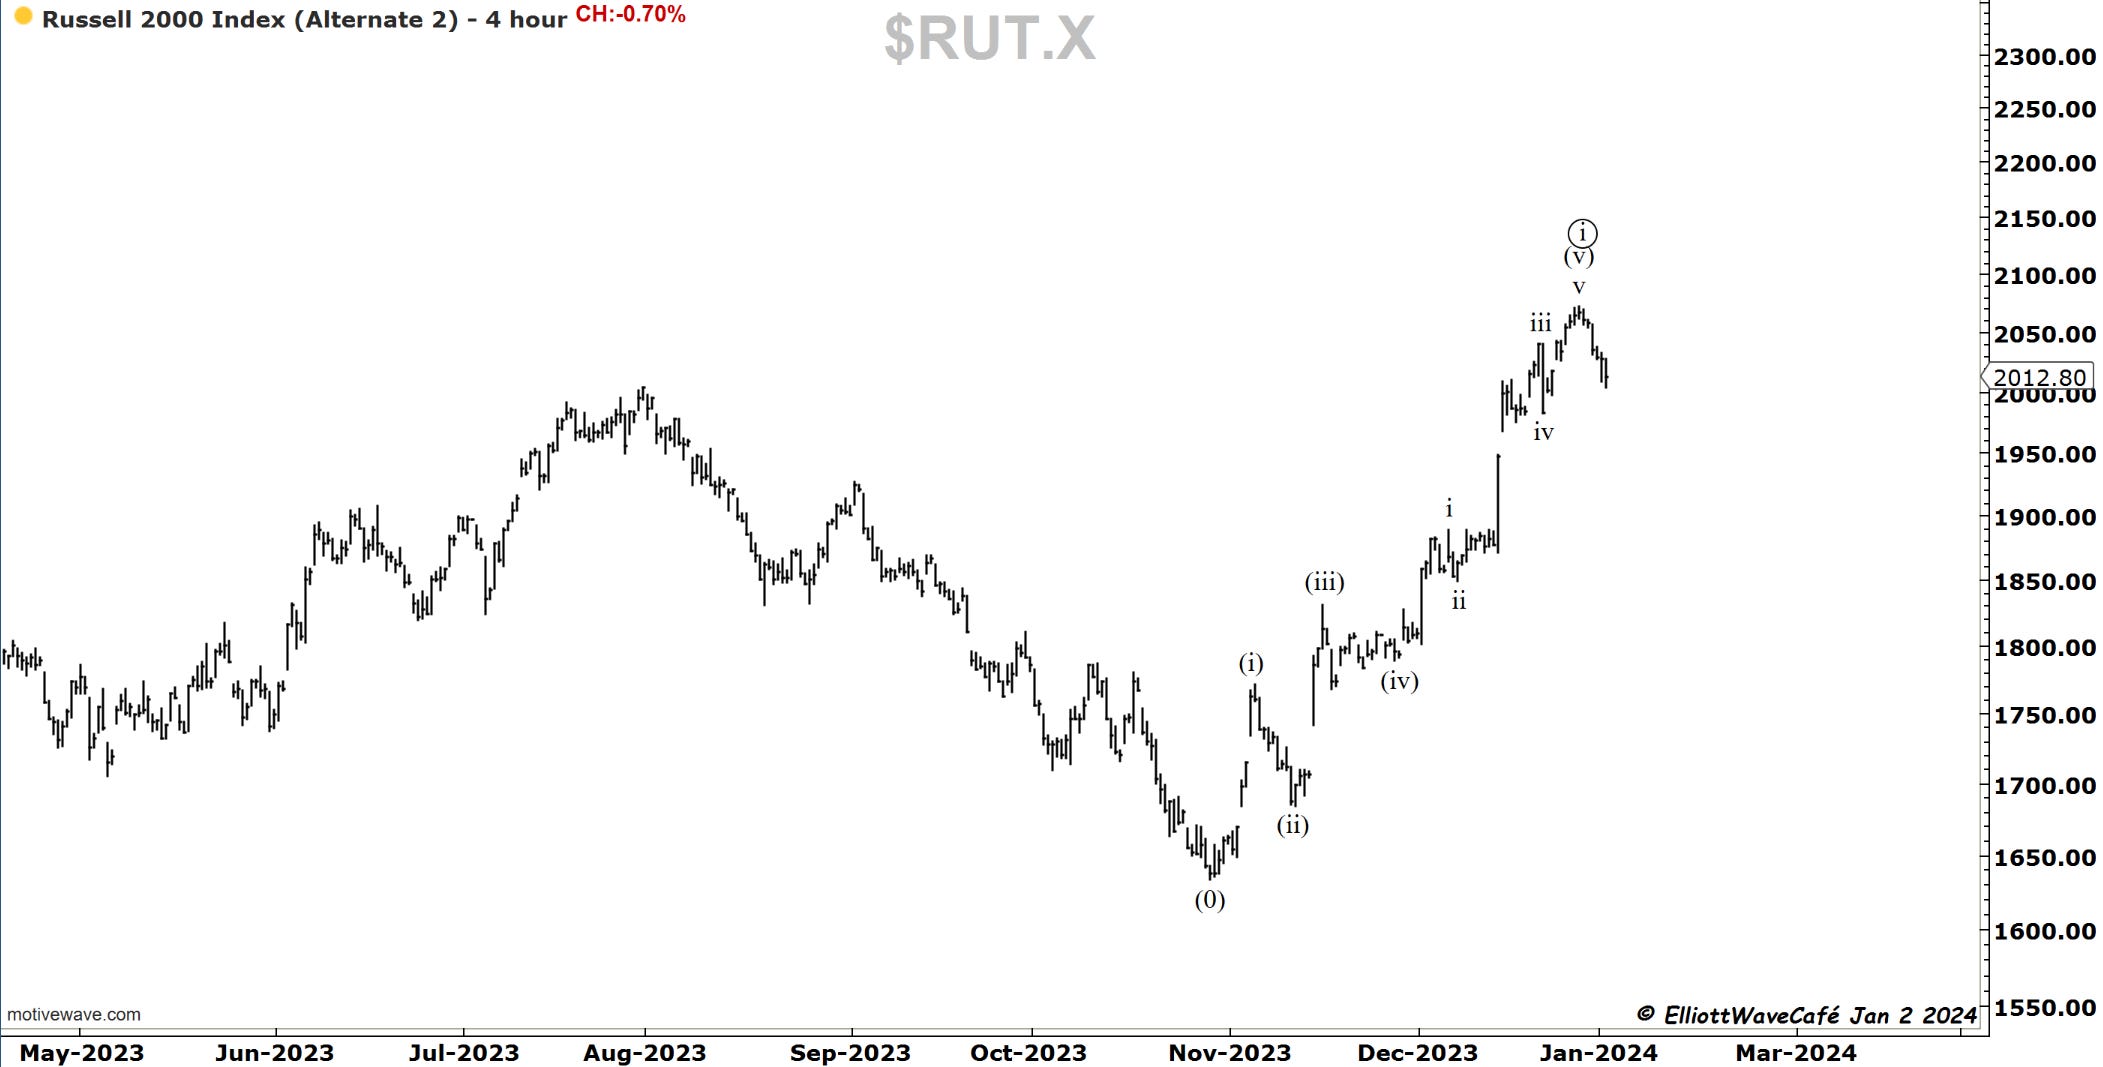
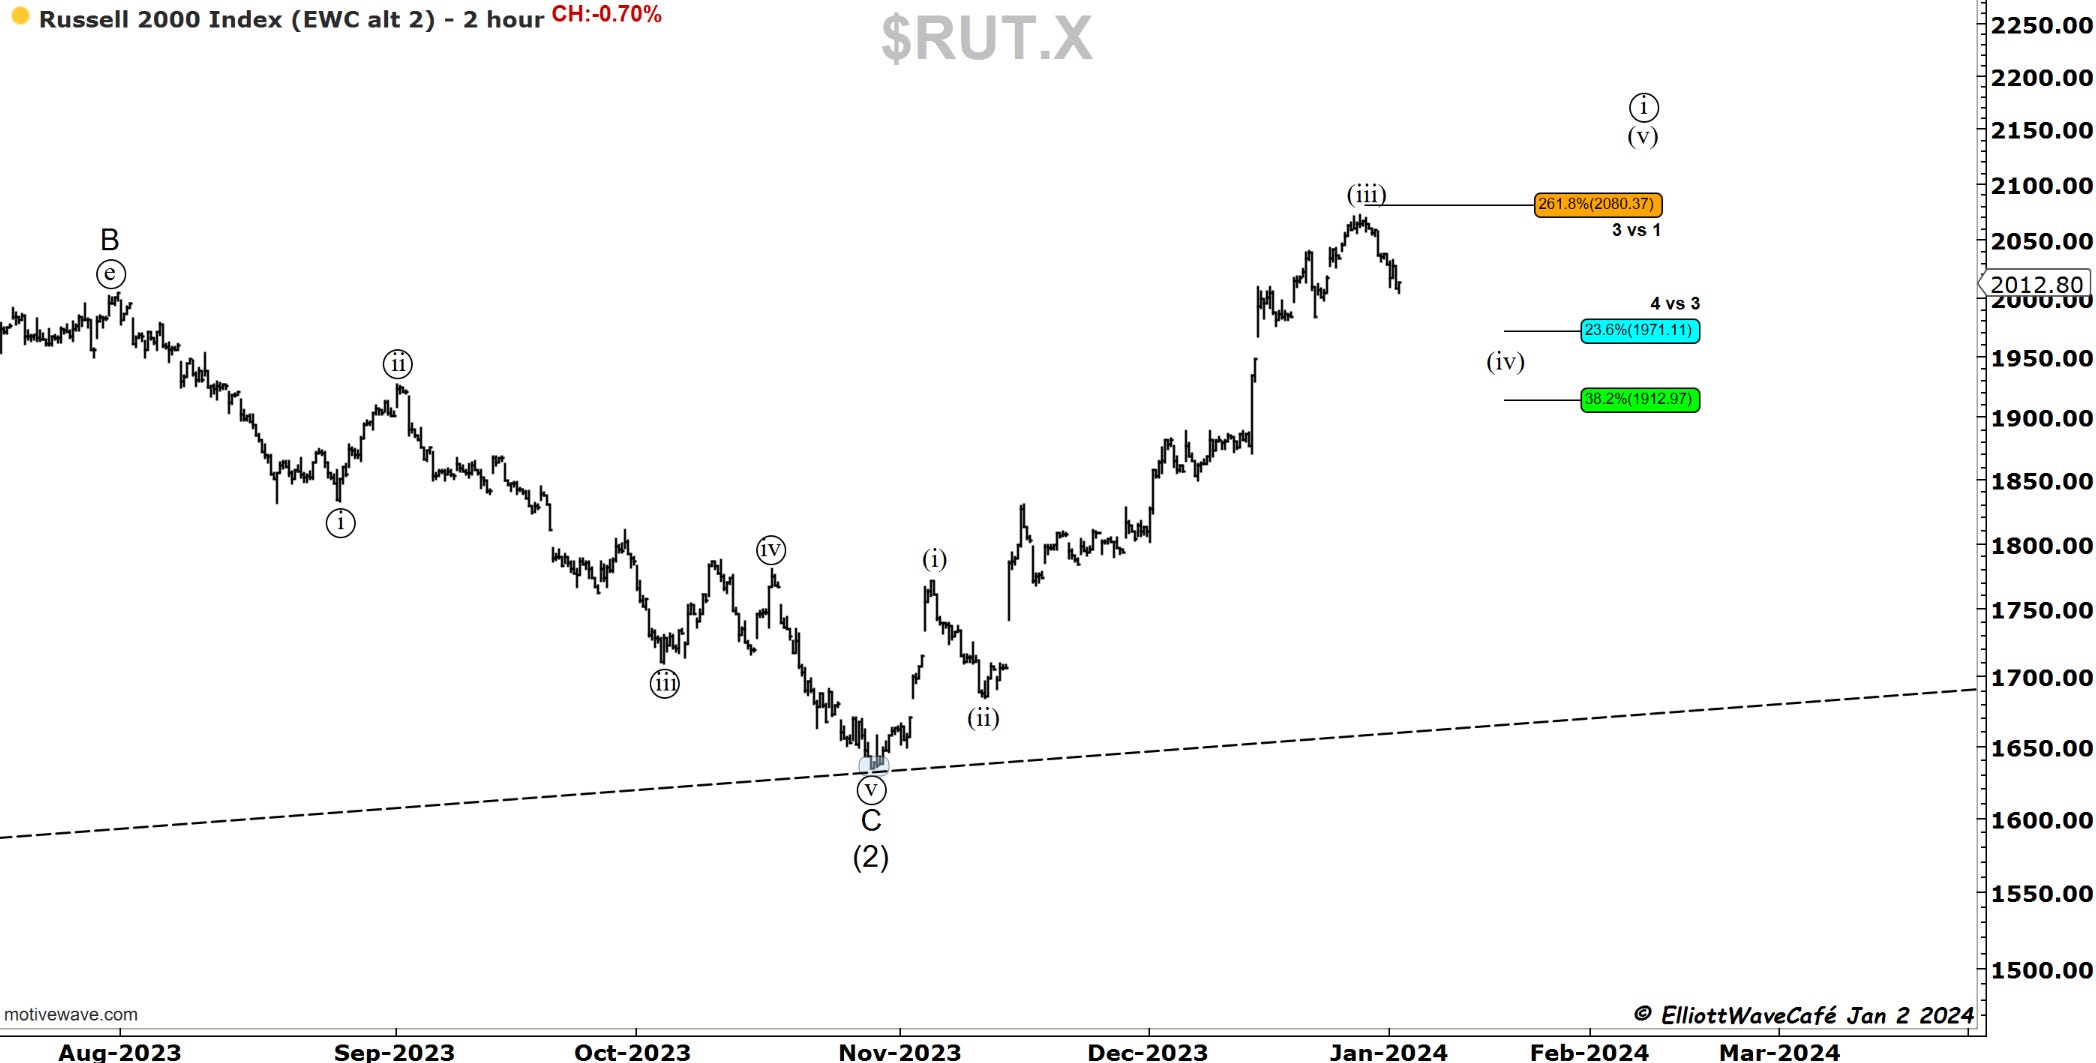
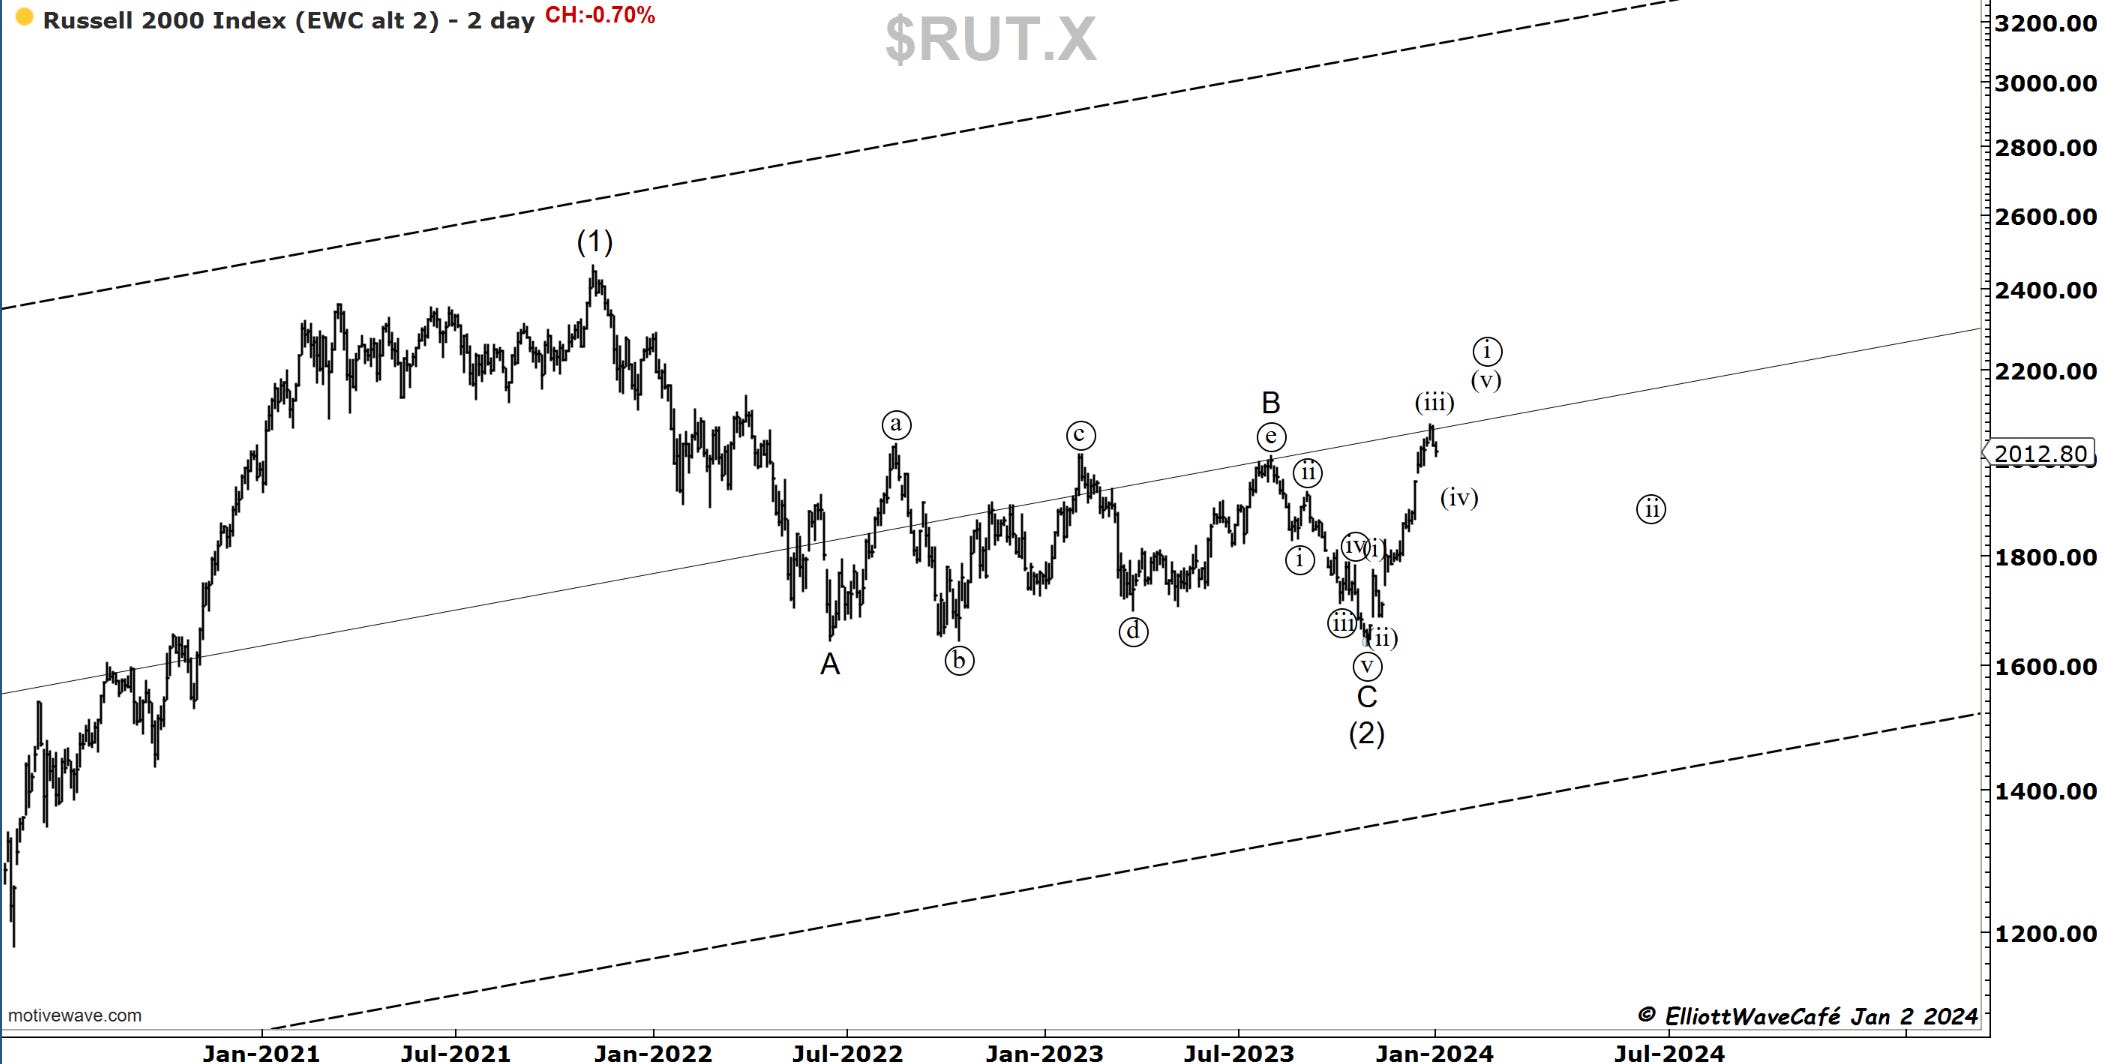
RUSSELL 2000
There was quite a bit of froth built up in the Russell, where most of the so-called “junk stocks” reside. You could hear the calls for multiple baggers and short squeezes from miles away in all the high-beta, high-adrenaline names. Those are usually signs, that someone needs to pay the piper. The count is still a bit unclear until a more meaningful correction develops. If we see this index drop towards 1900, it will become clear that we’re not in a 4th wave anymore, but very likely a ((ii)).

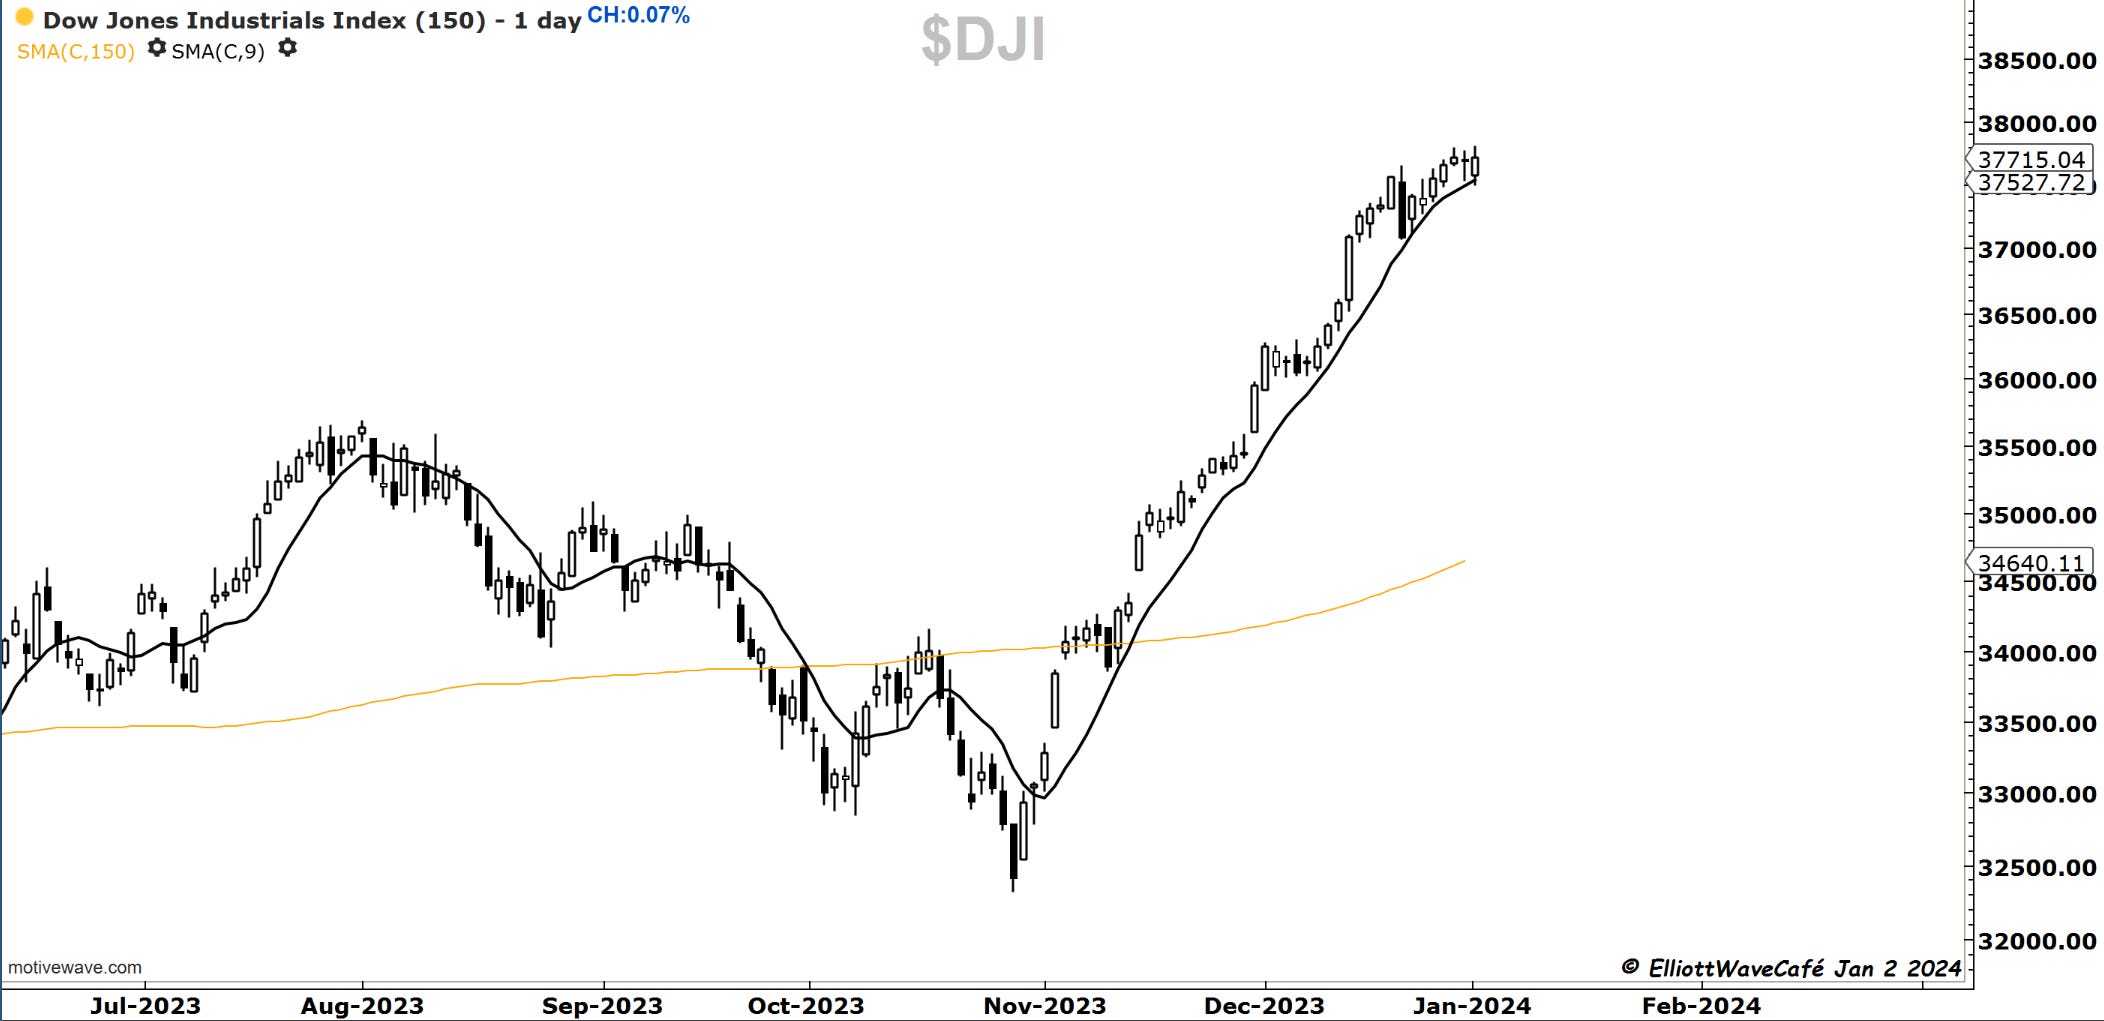
Dow30
The Dow has yet to roll over, but the RSI is hinting that it’s just a matter of time. It has a lot more value, so it is somewhat defensive, just like RSP, and today was a great proof of that. I think 37k will be tagged as the other indices raise up the heat here as well. 36k is a bit further down, but not out of the realm of a proper correction.
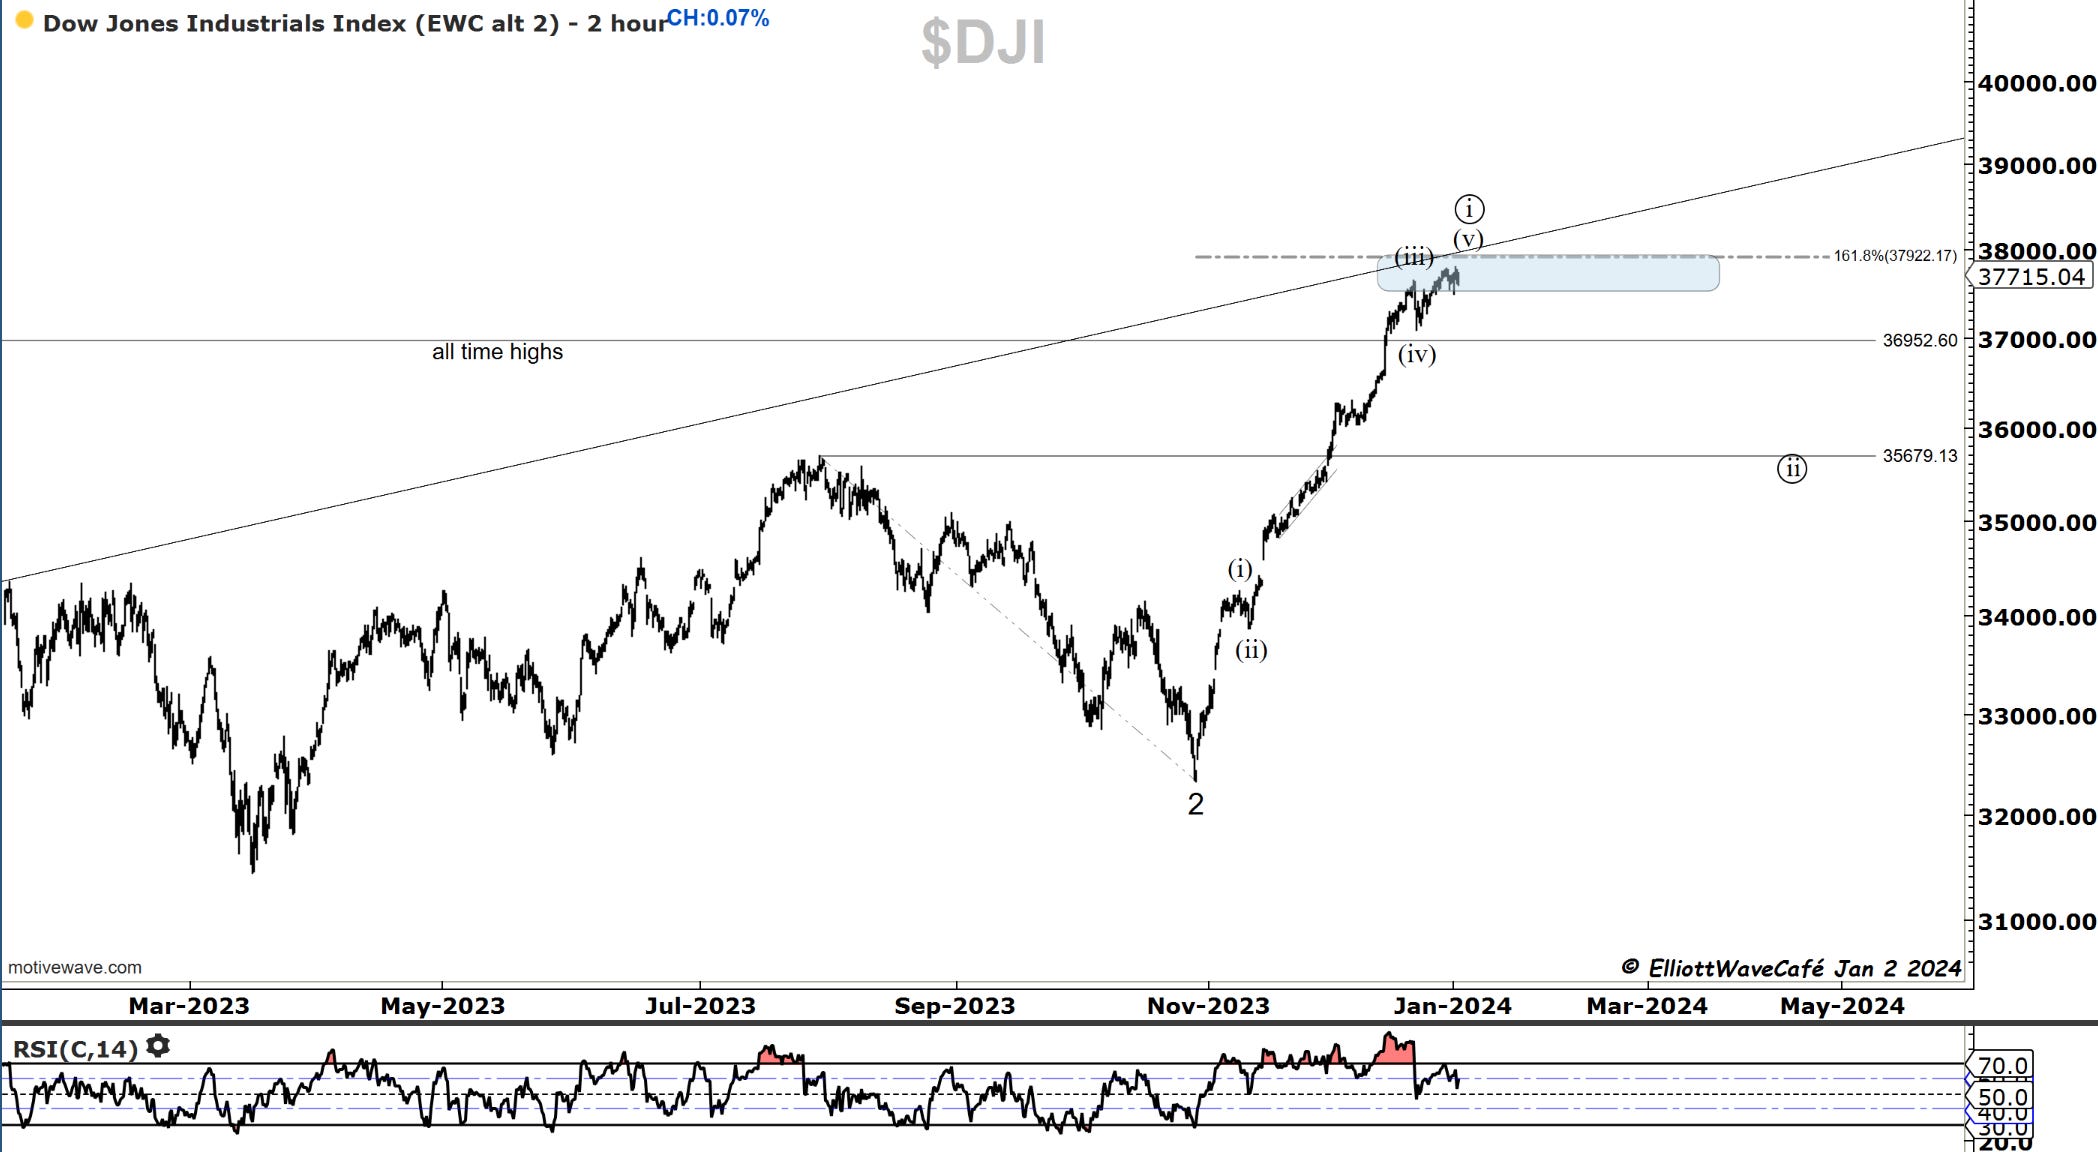
Watch for a close below the 9-day MA to get things started. The other markets are now below it.
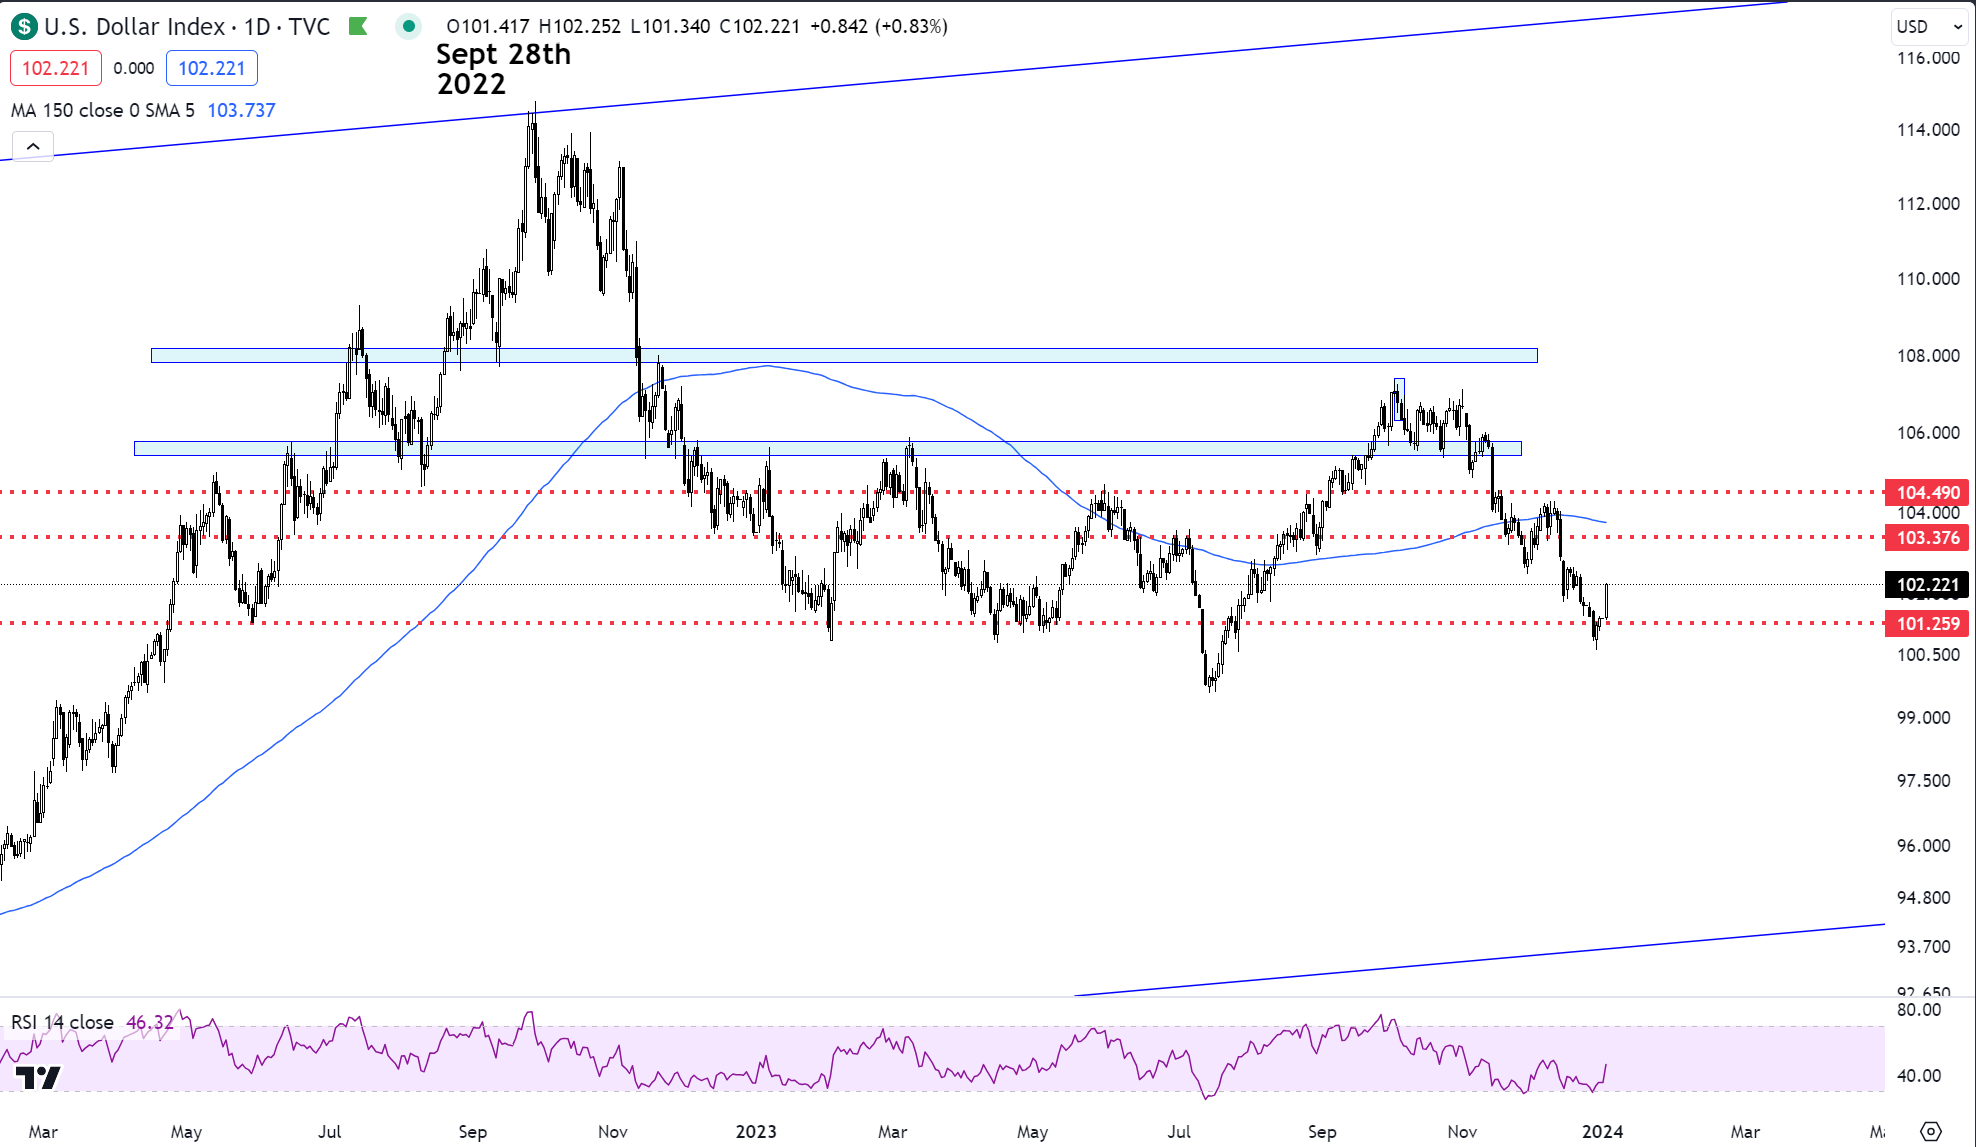
US Dollar and Yields
We talked about the support in the USD for the past several postings. It rallied nearly 1% today, pretty much in line with expectations. My conviction for higher continues to come from seasonality tailwinds in January and the timing cycles presented. It’s possible we will be hitting 103.40 from below over the coming weeks. The Dollar needs to be constantly watched as a gauge for analyzing risk.
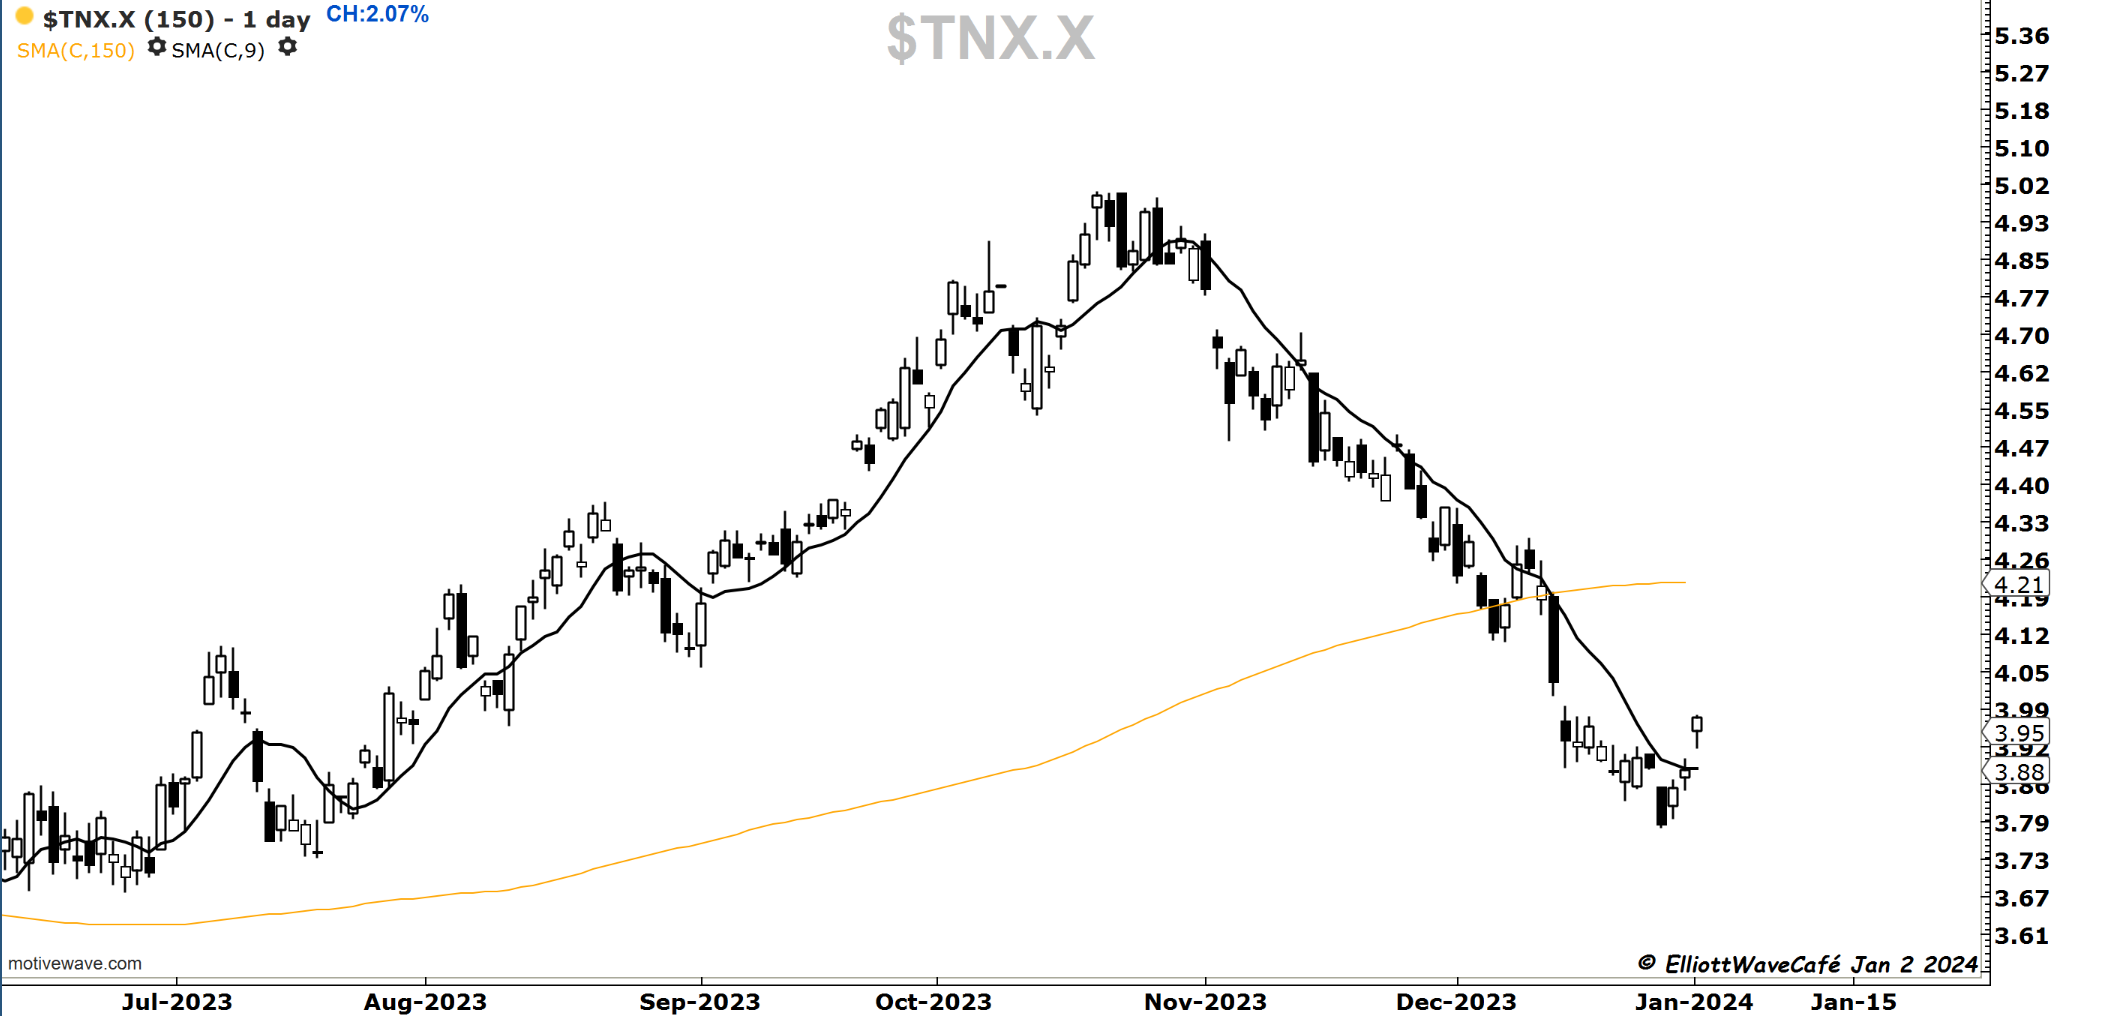
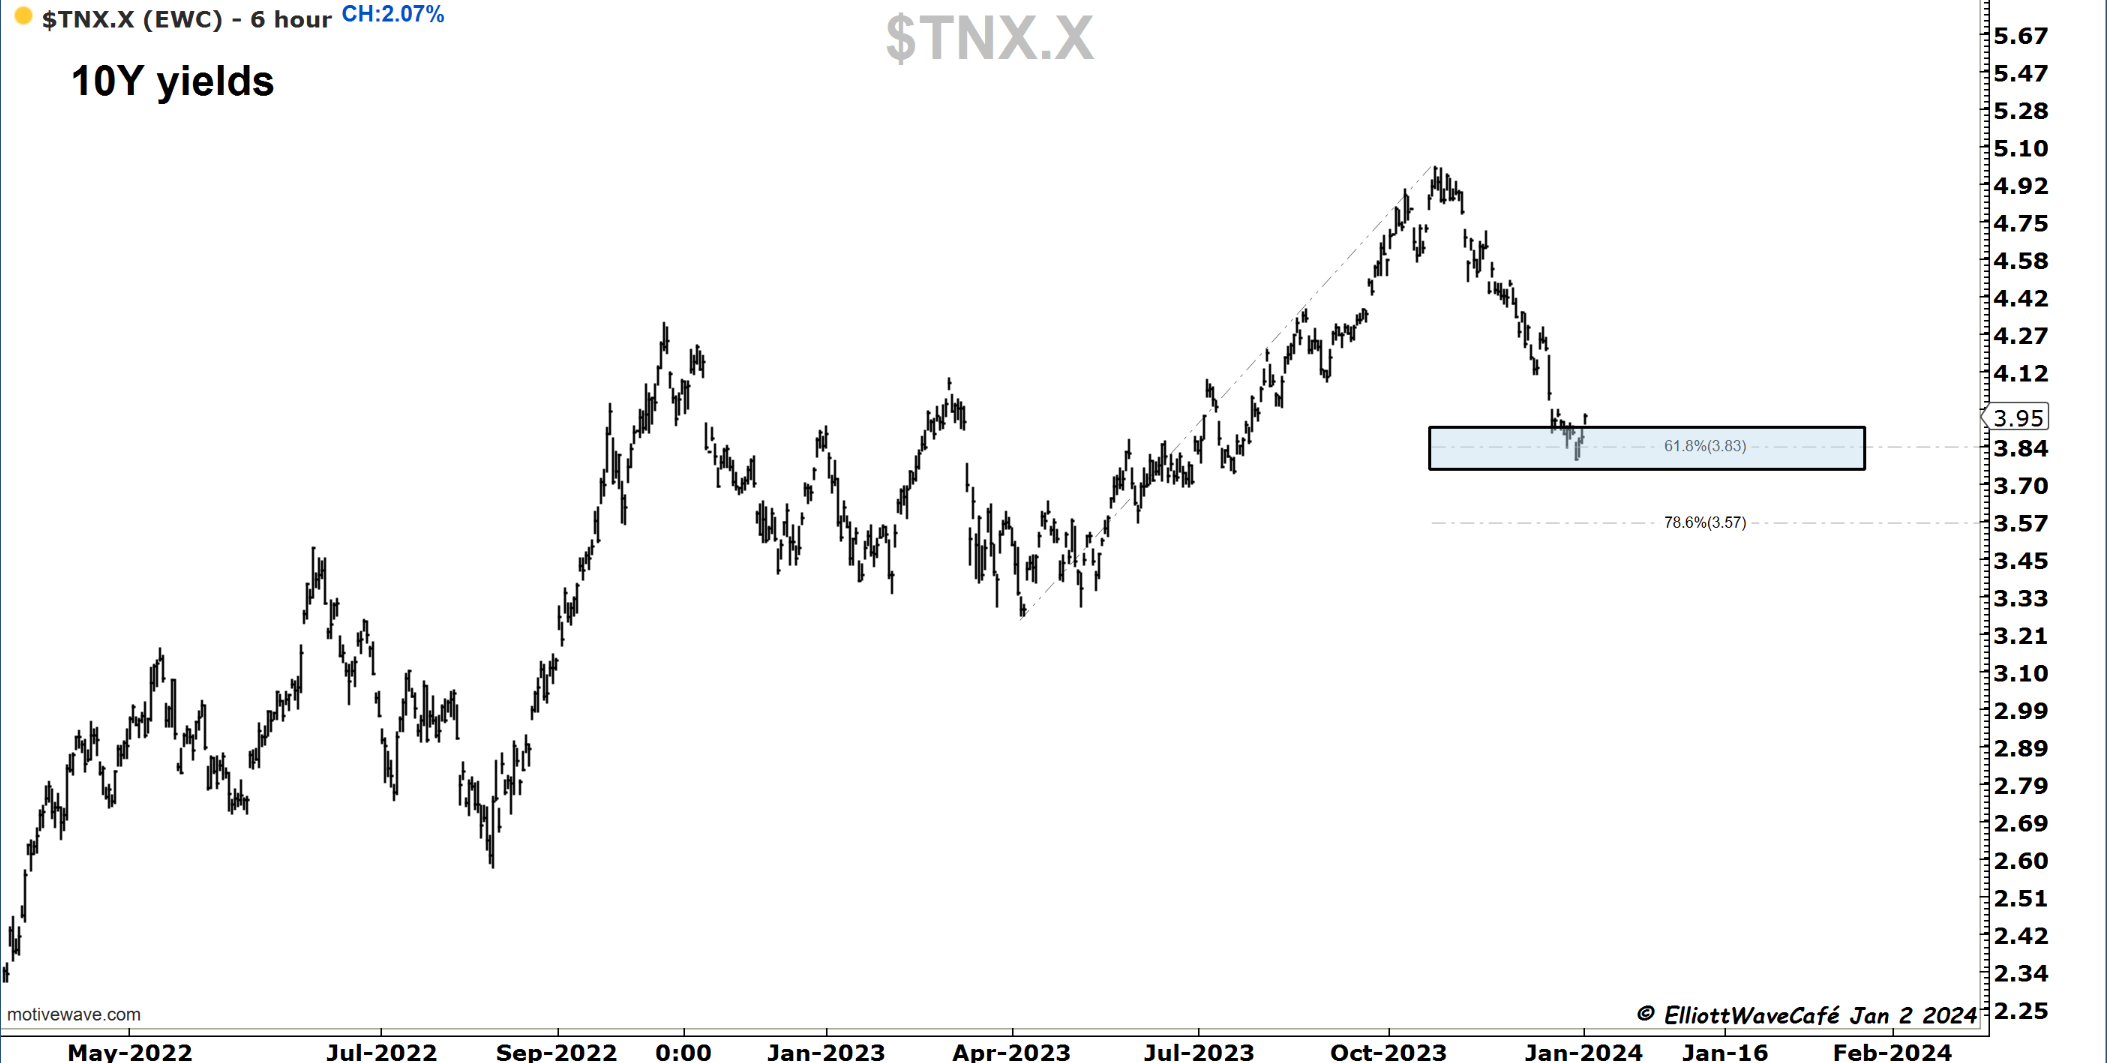
Yields have started to respond as well from the fib zones mentioned. We are now above the 9-day flexible trendline, suggesting the downtrend is over for a while. A move back to at least 4.2% is expected. Growth trade will be suffering under those conditions.
Gold
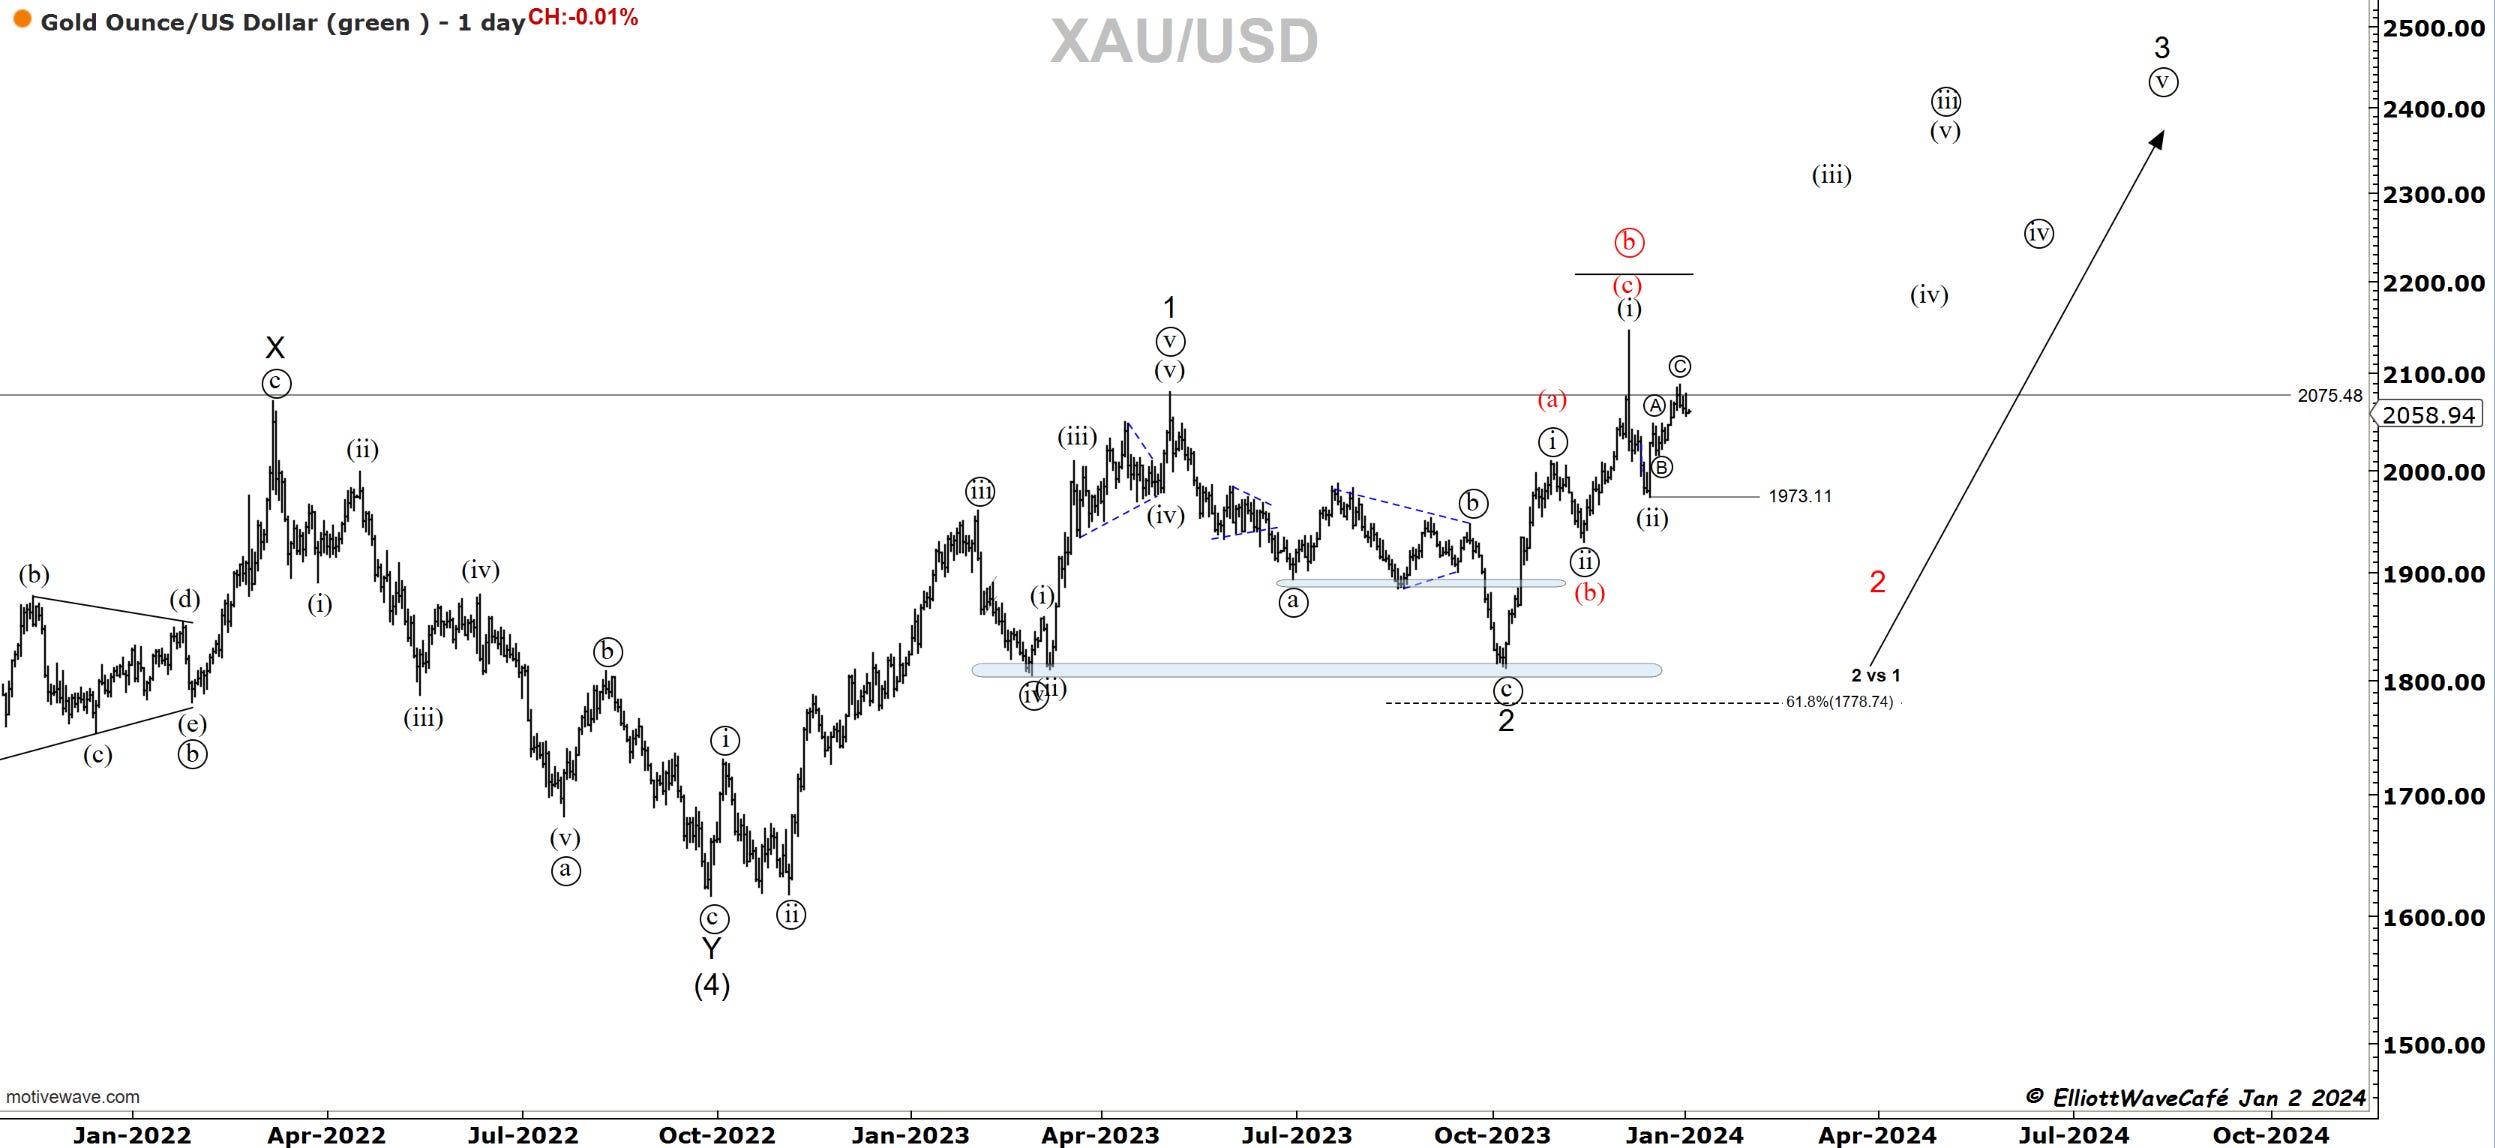
A bit of a selloff in Gold with the stronger dollar, but nothing worth changing drastically the overall picture. There are arguments to be made for just a 3 wave little rally after the December drop. Hovering near all-time highs does not give us a whole lot to work with. I am going to refrain from making any strong calls until we see some of these key levels getting challenged.
Bitcoin
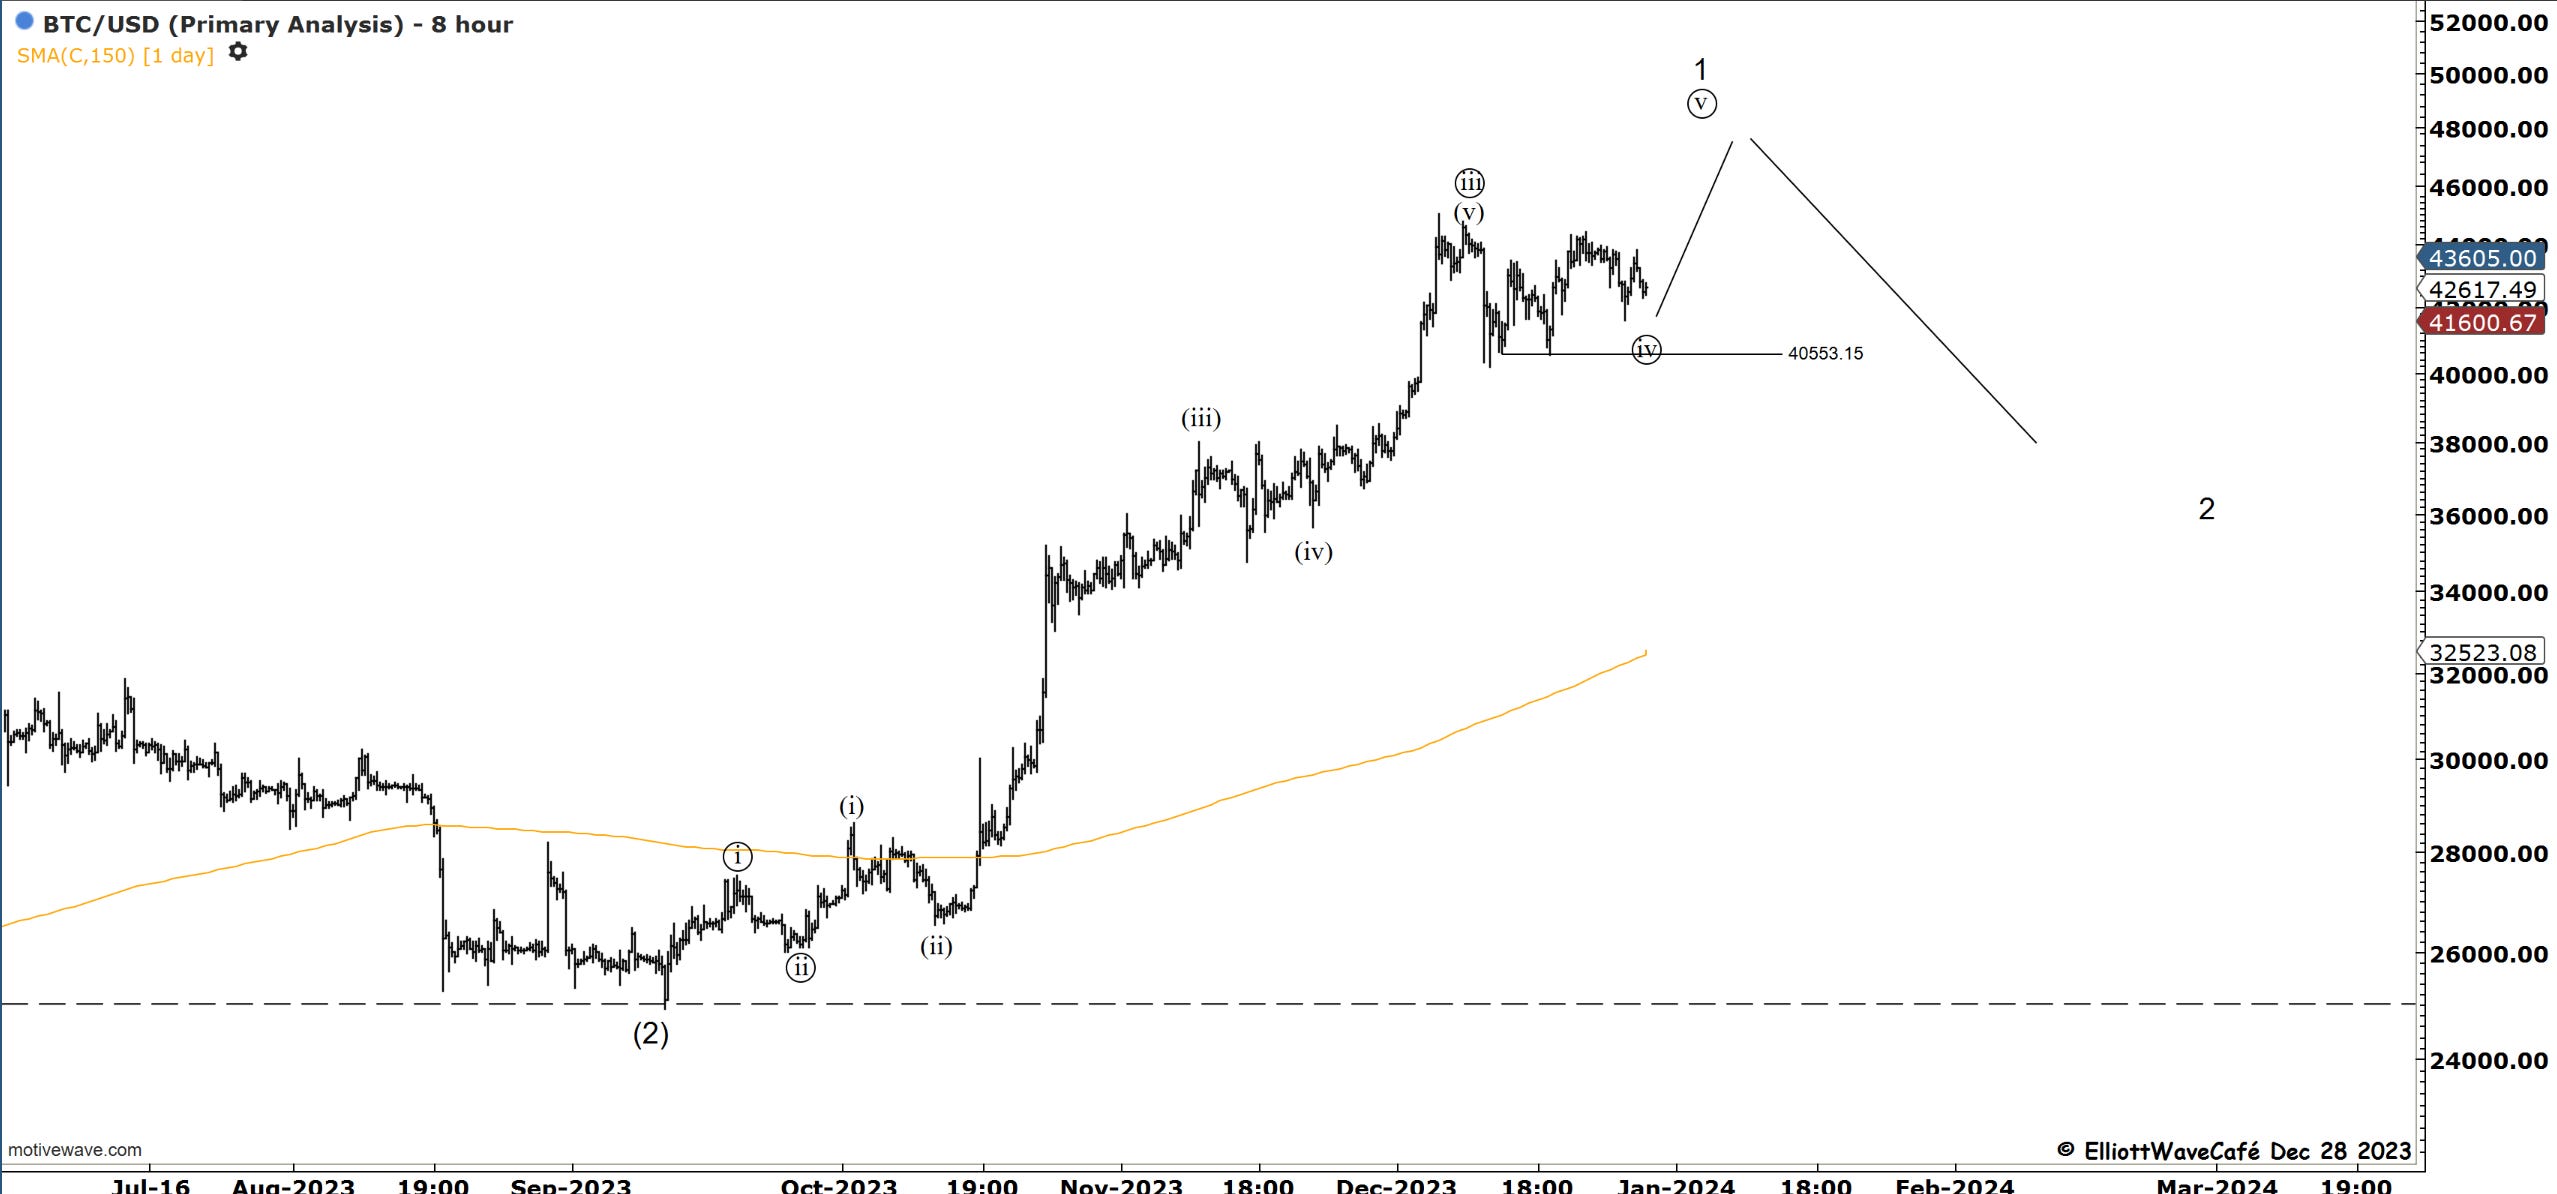
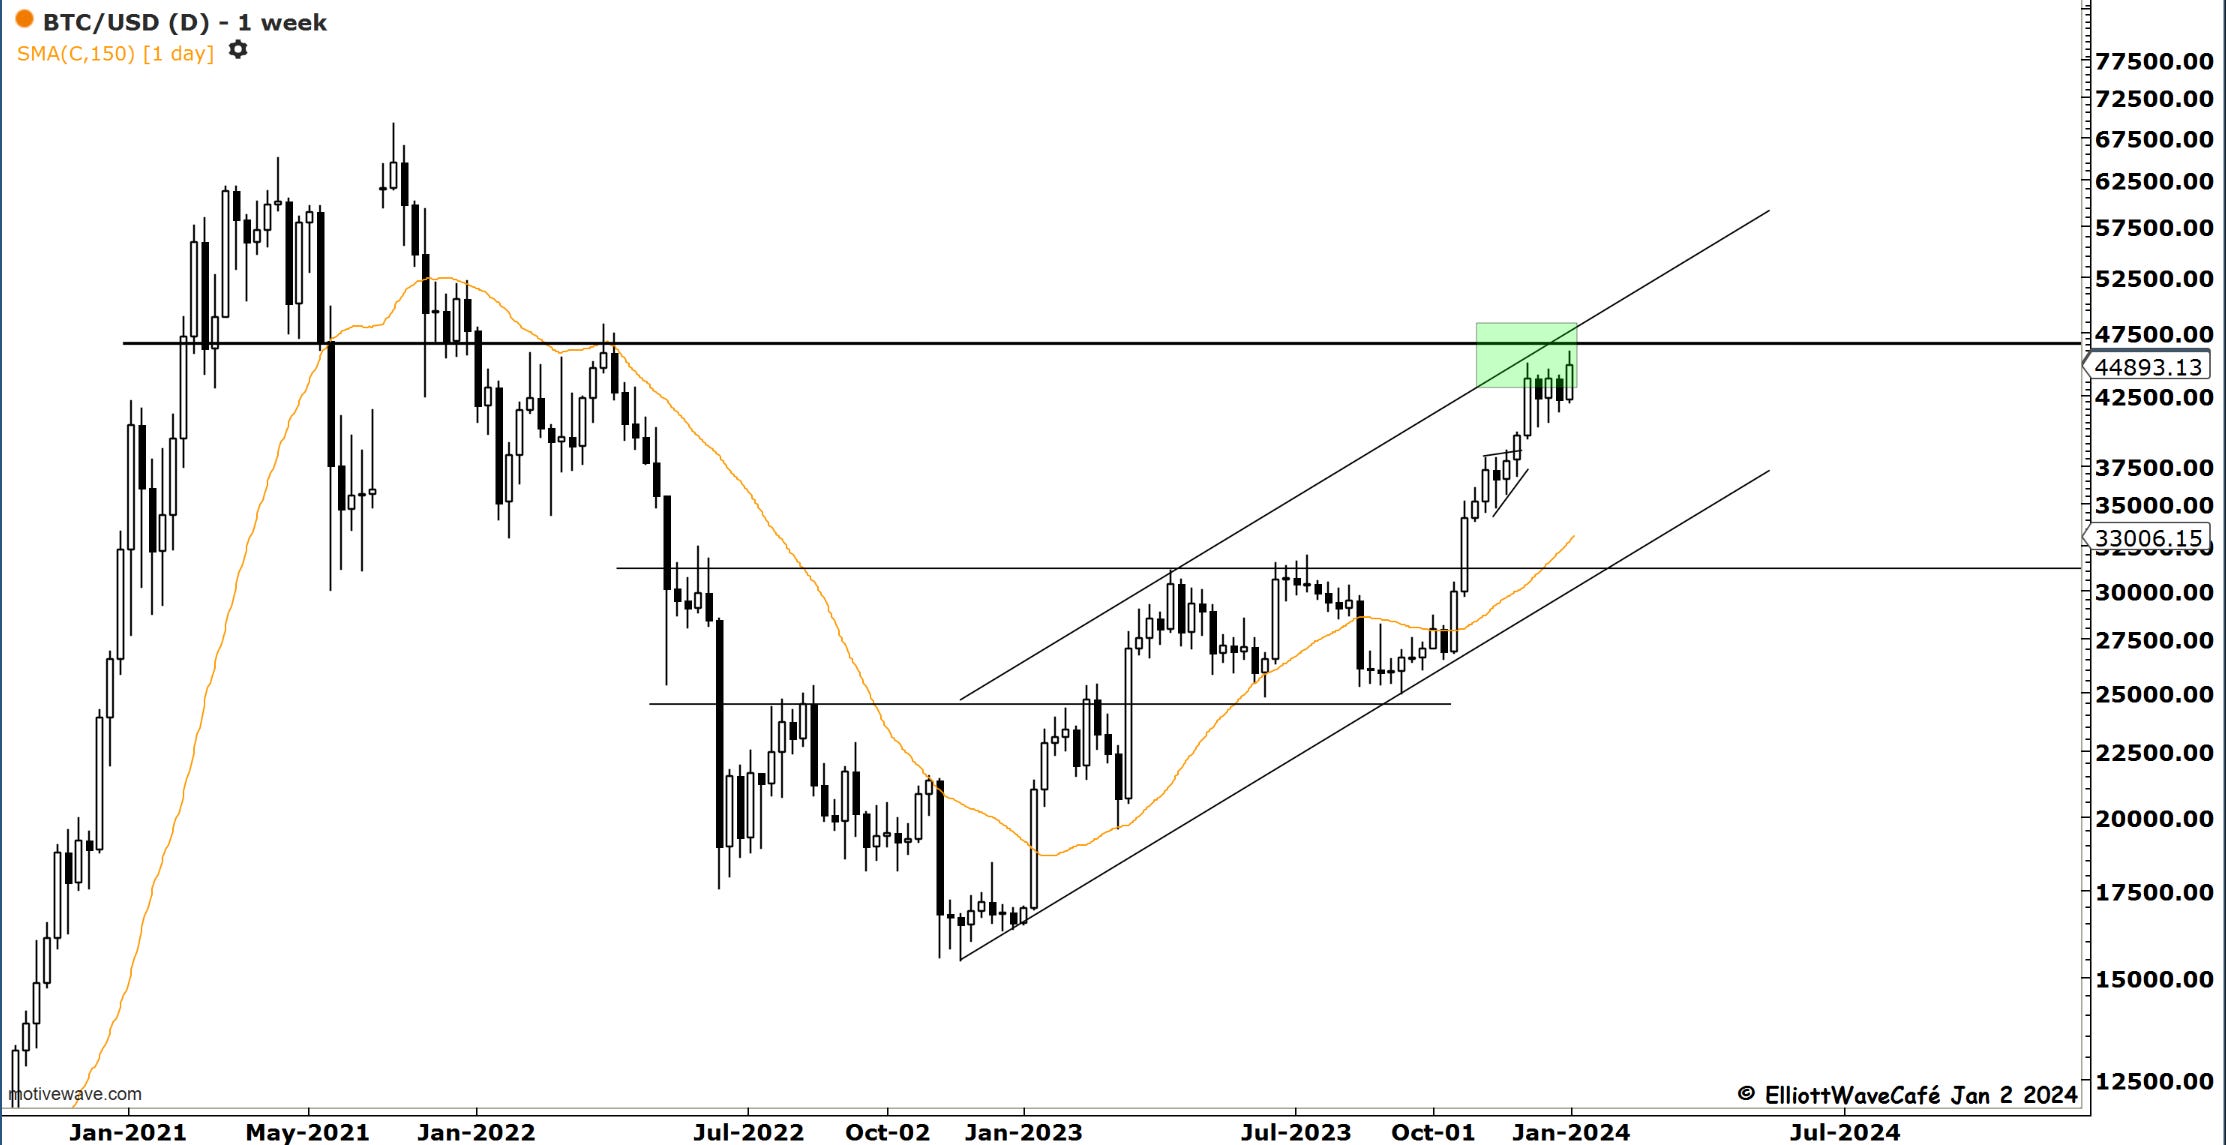
With the move above 44,434, the second chart presented last week was activated. It called for one more thrust higher in a wave ((v)) before we begin a corrective move in a second wave. A drop back below wave (iv) low or about 42,000 will be the confirmation needed. I would expect a 36k BTC over the next couple of months.
“Double shot” Daily member video coming up next,
If you’re new to Elliott Wave or need to refresh, there is a 7-hour video course with downloadable slides under The Coarse tab on the website.
Have a great day wherever you are! - trade well, and don’t forget to subscribe and drop a like if this letter helps you in any way.
Cris
email: ewcafe@pm.me
Do you think your ndx w3 is too short?