
The Daily Drip
Elliott Wave and technical market updates on SPX,NDX,DOW,IWM,DXY,BITCOIN
Note: The counts on the right edge are real-time, and they are prone to adjustments as price action develops. Elliott Wave has a fluid approach, is evidence-based, and requires constant monitoring of certain thresholds.
In the counts below, this (( )) = circle on chart
“The Daily Drip”update is now available as part of a lower subscription tier $8/month or $6.67/mo yearly. Here is a free preview….
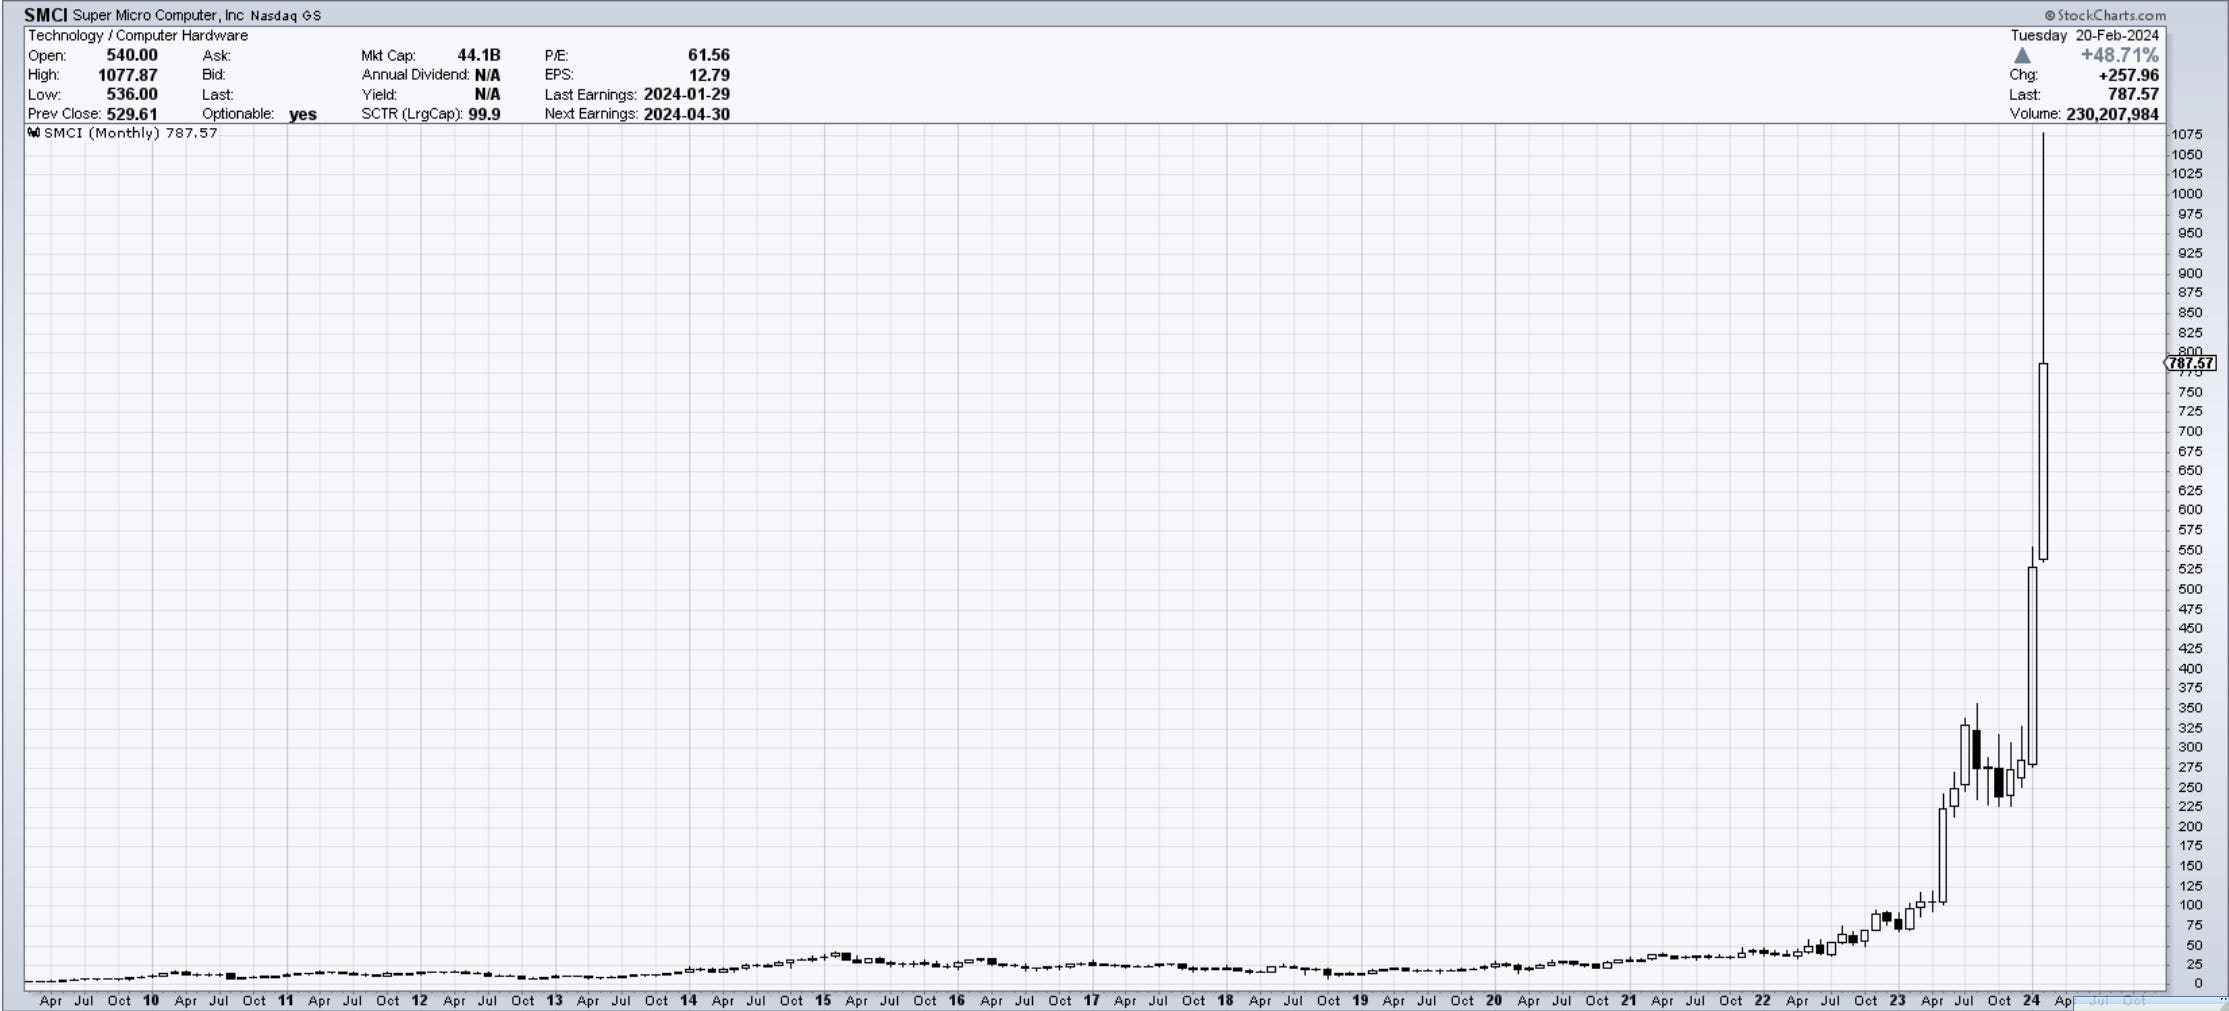
Updated …Chart of the Day $SMCI. - trees do grow to the sky. But in another Universe, not on Earth.
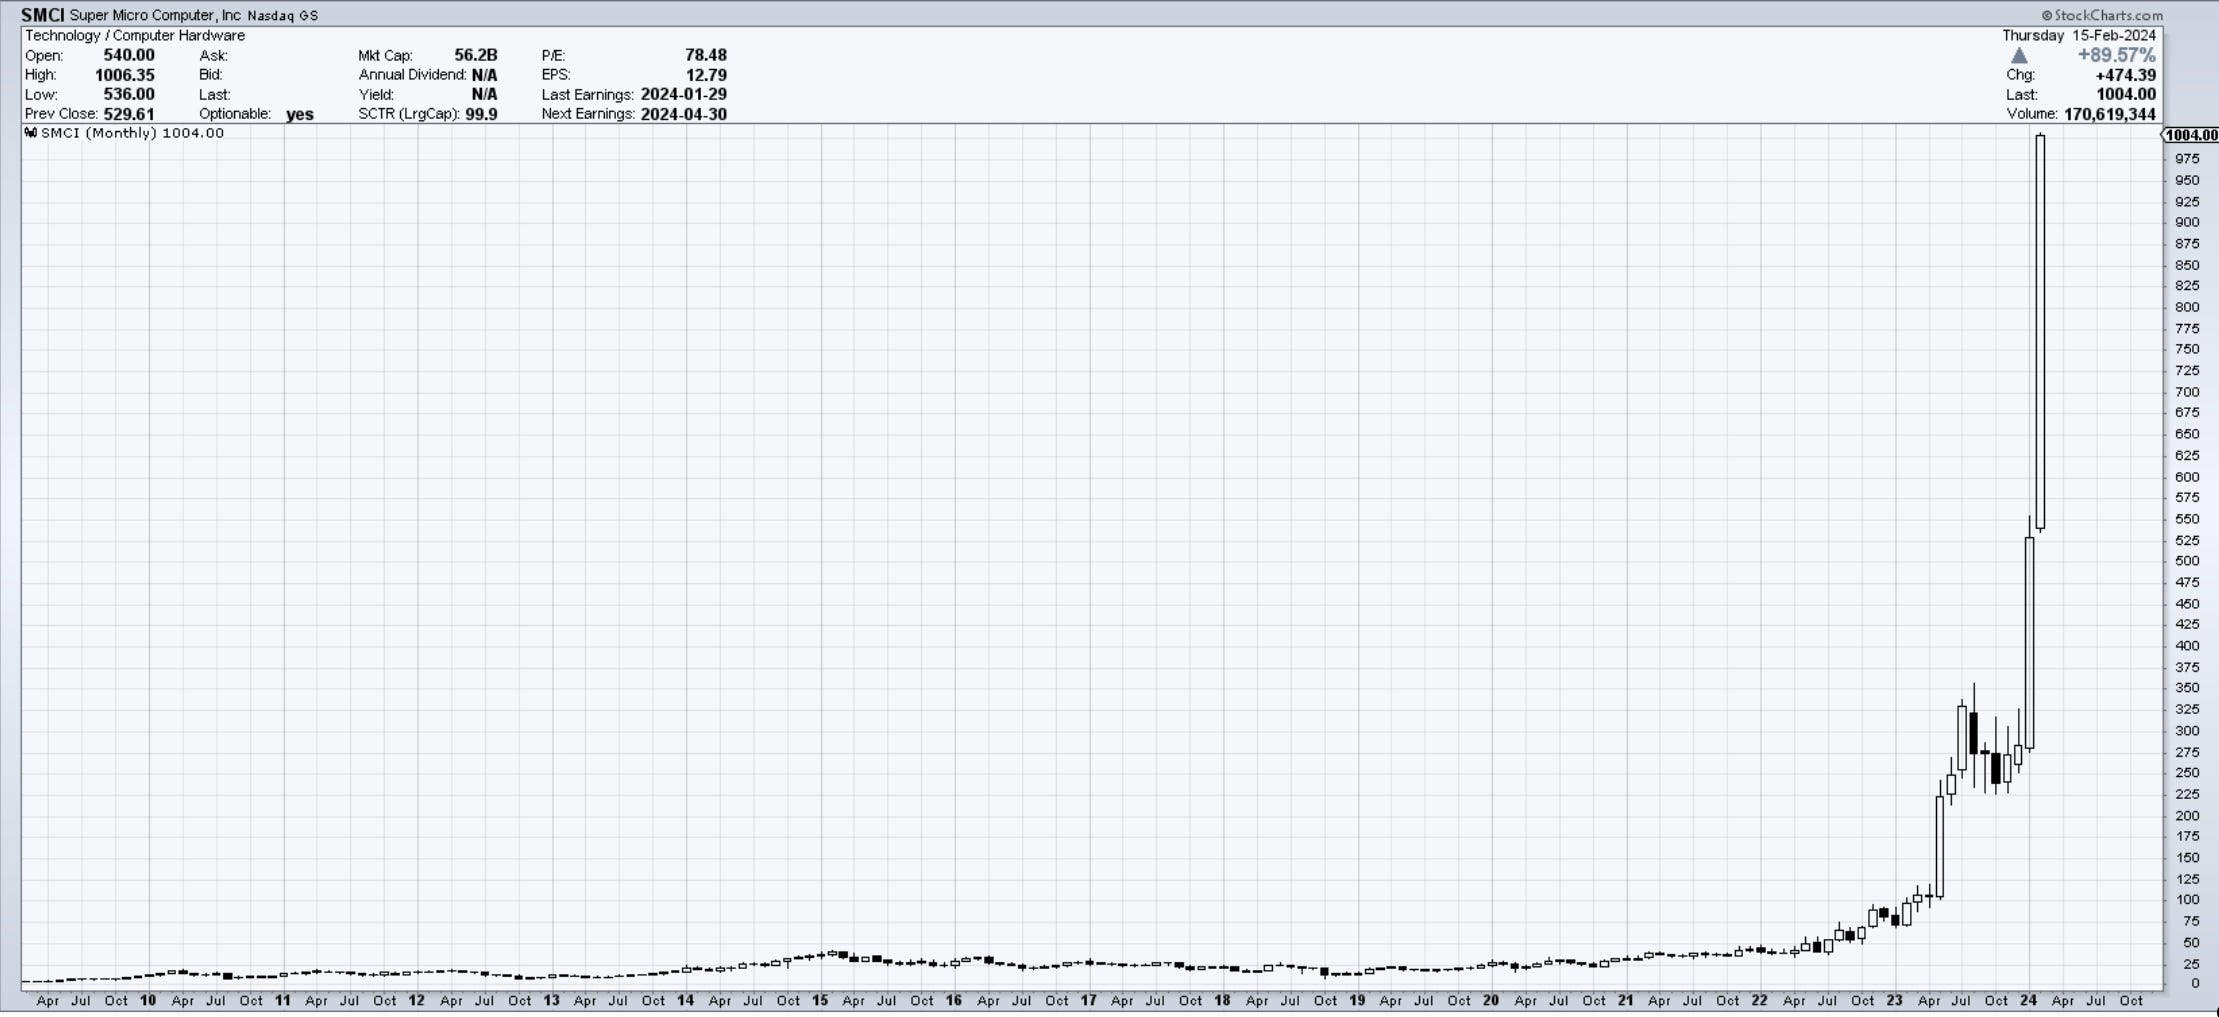
A 36% drop and far from over. Bubbles burst.
SP500
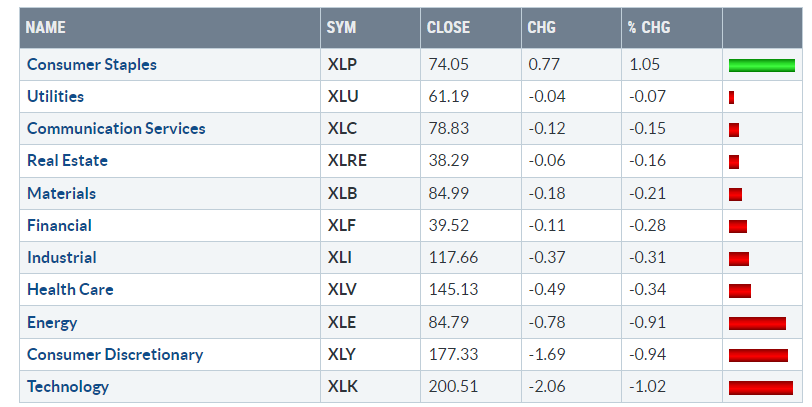
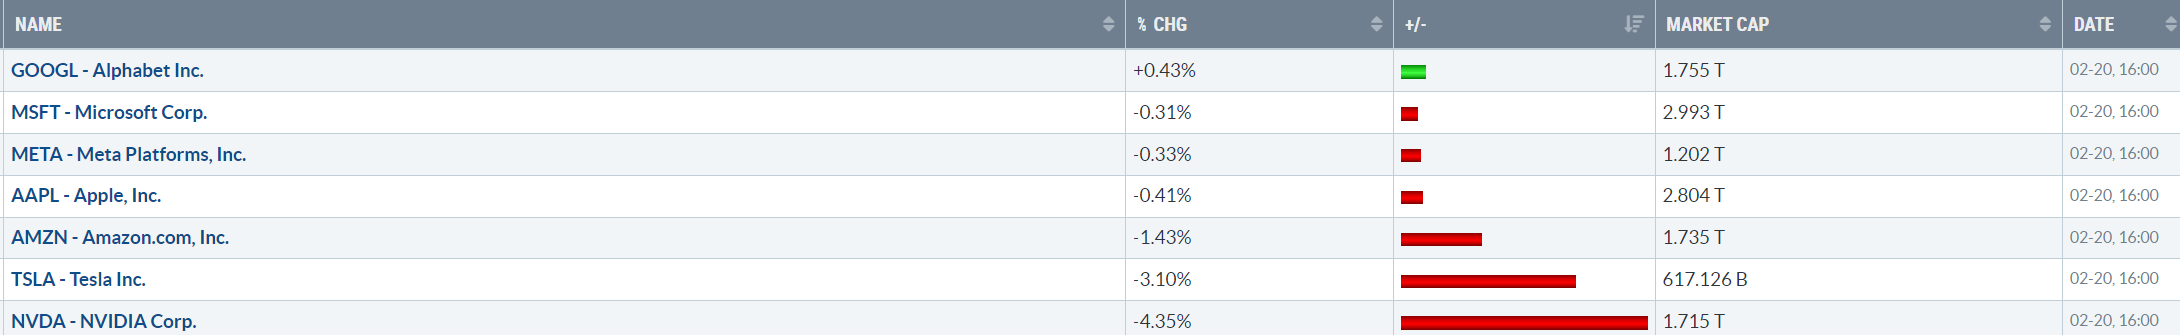
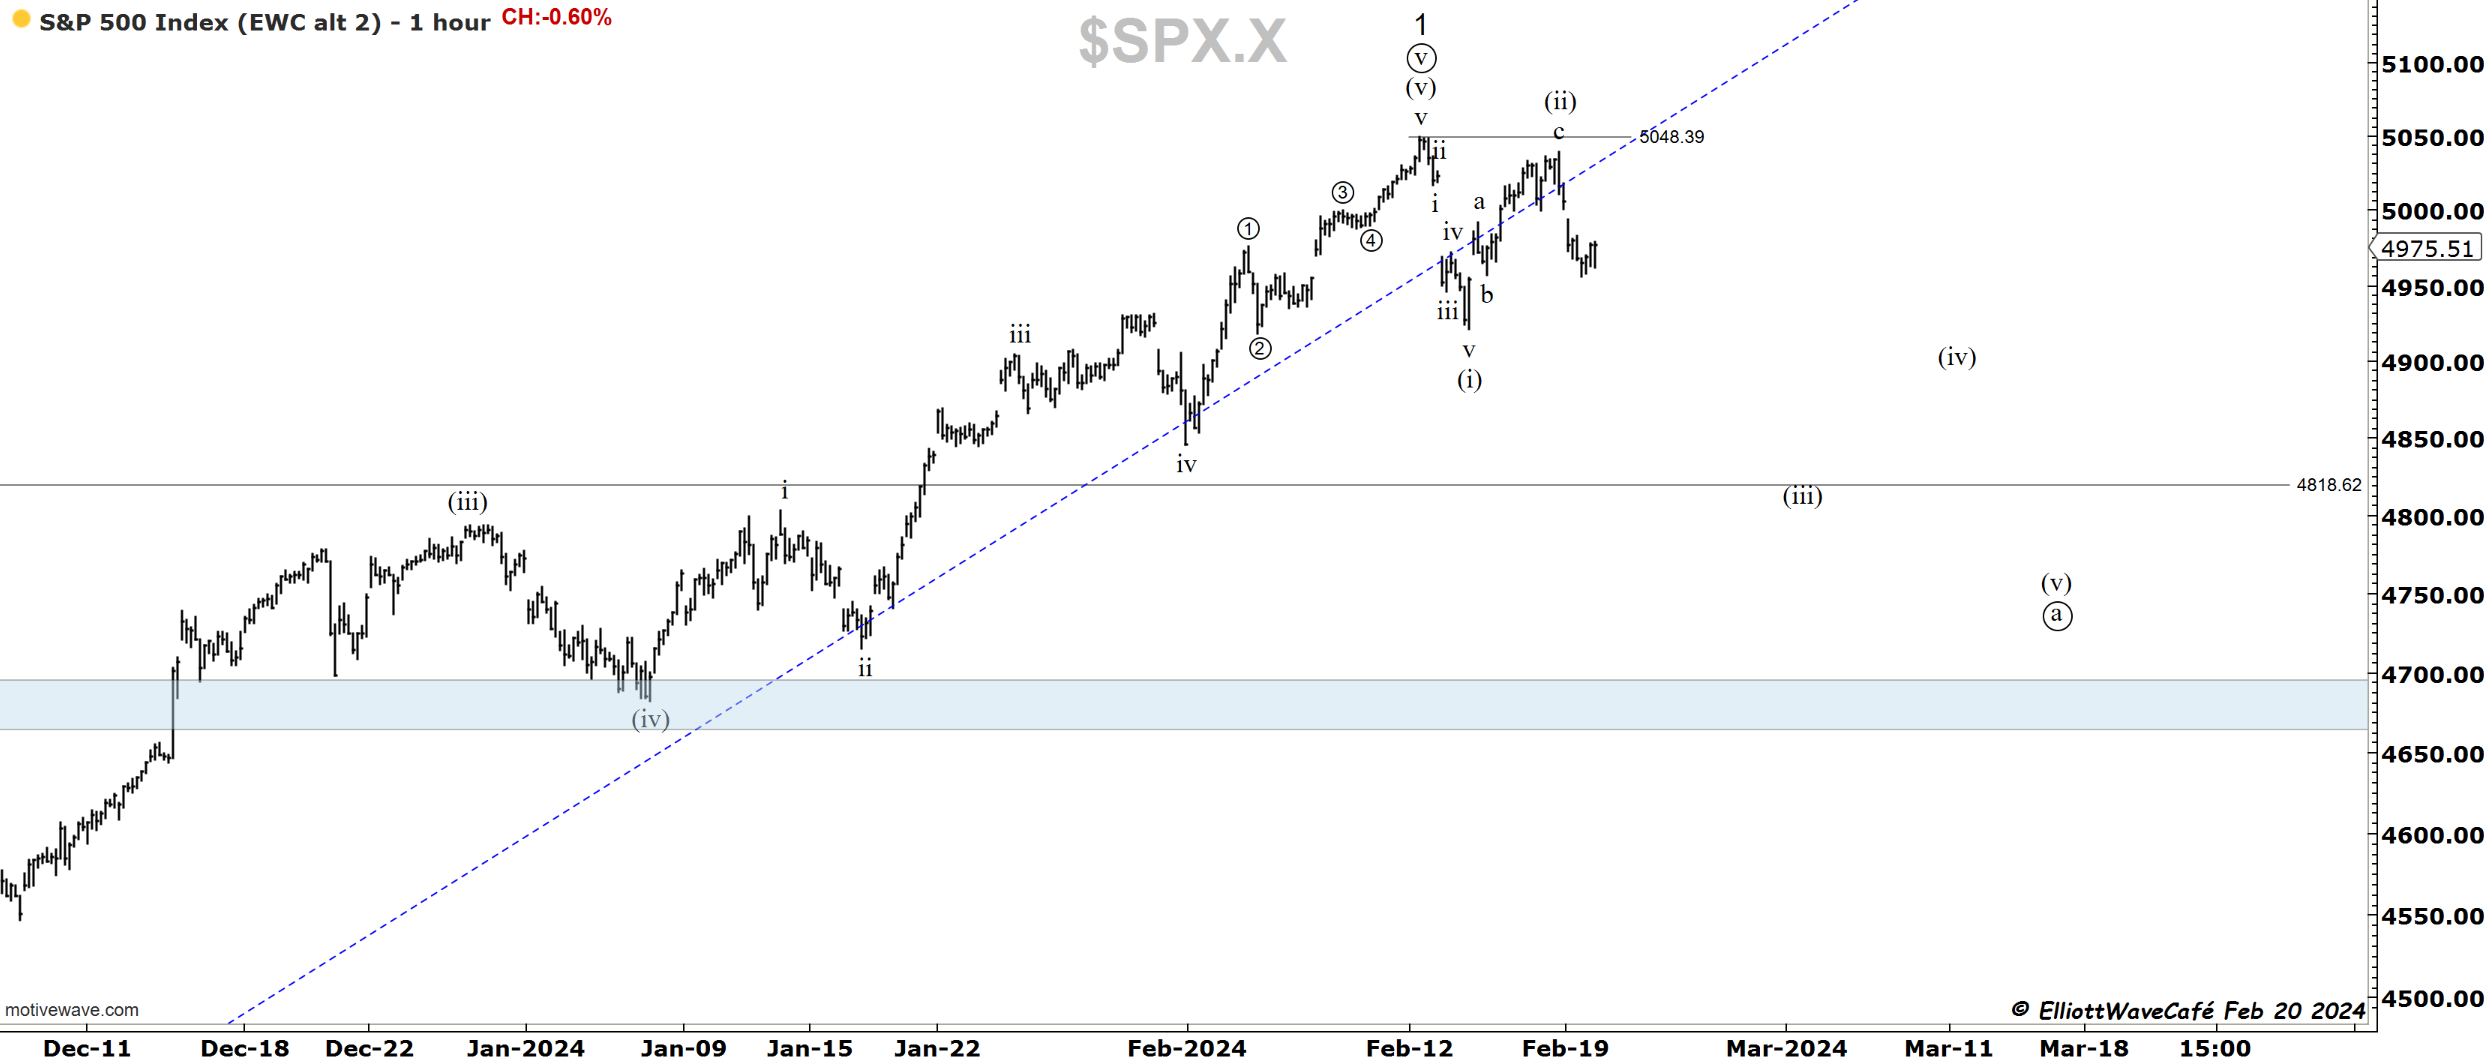
The SP500 could never overtake the 5048 mark and thus kept the current count active. The failure to rally started with the option expiration day on Friday and continued today. You can see from the chart below that Staples was the only positive sector as full defensive play was unfolding. Tech and Consumer discretionary, two “risk on” sectors, were dumped aggressively. There was extended weakness in semiconductors, a trade that provided much help to the overall market on the way up. The RSP (equal weight Sp500) maintained some outperformance, showing the pressure that can be put on prices by only a handful of very large stocks. NVDA was the biggest loser, dropping over 6% at some point today. I guess traders are jittery about tomorrow’s earnings and how the SP500 has been acting lately. Sell first, ask questions later.
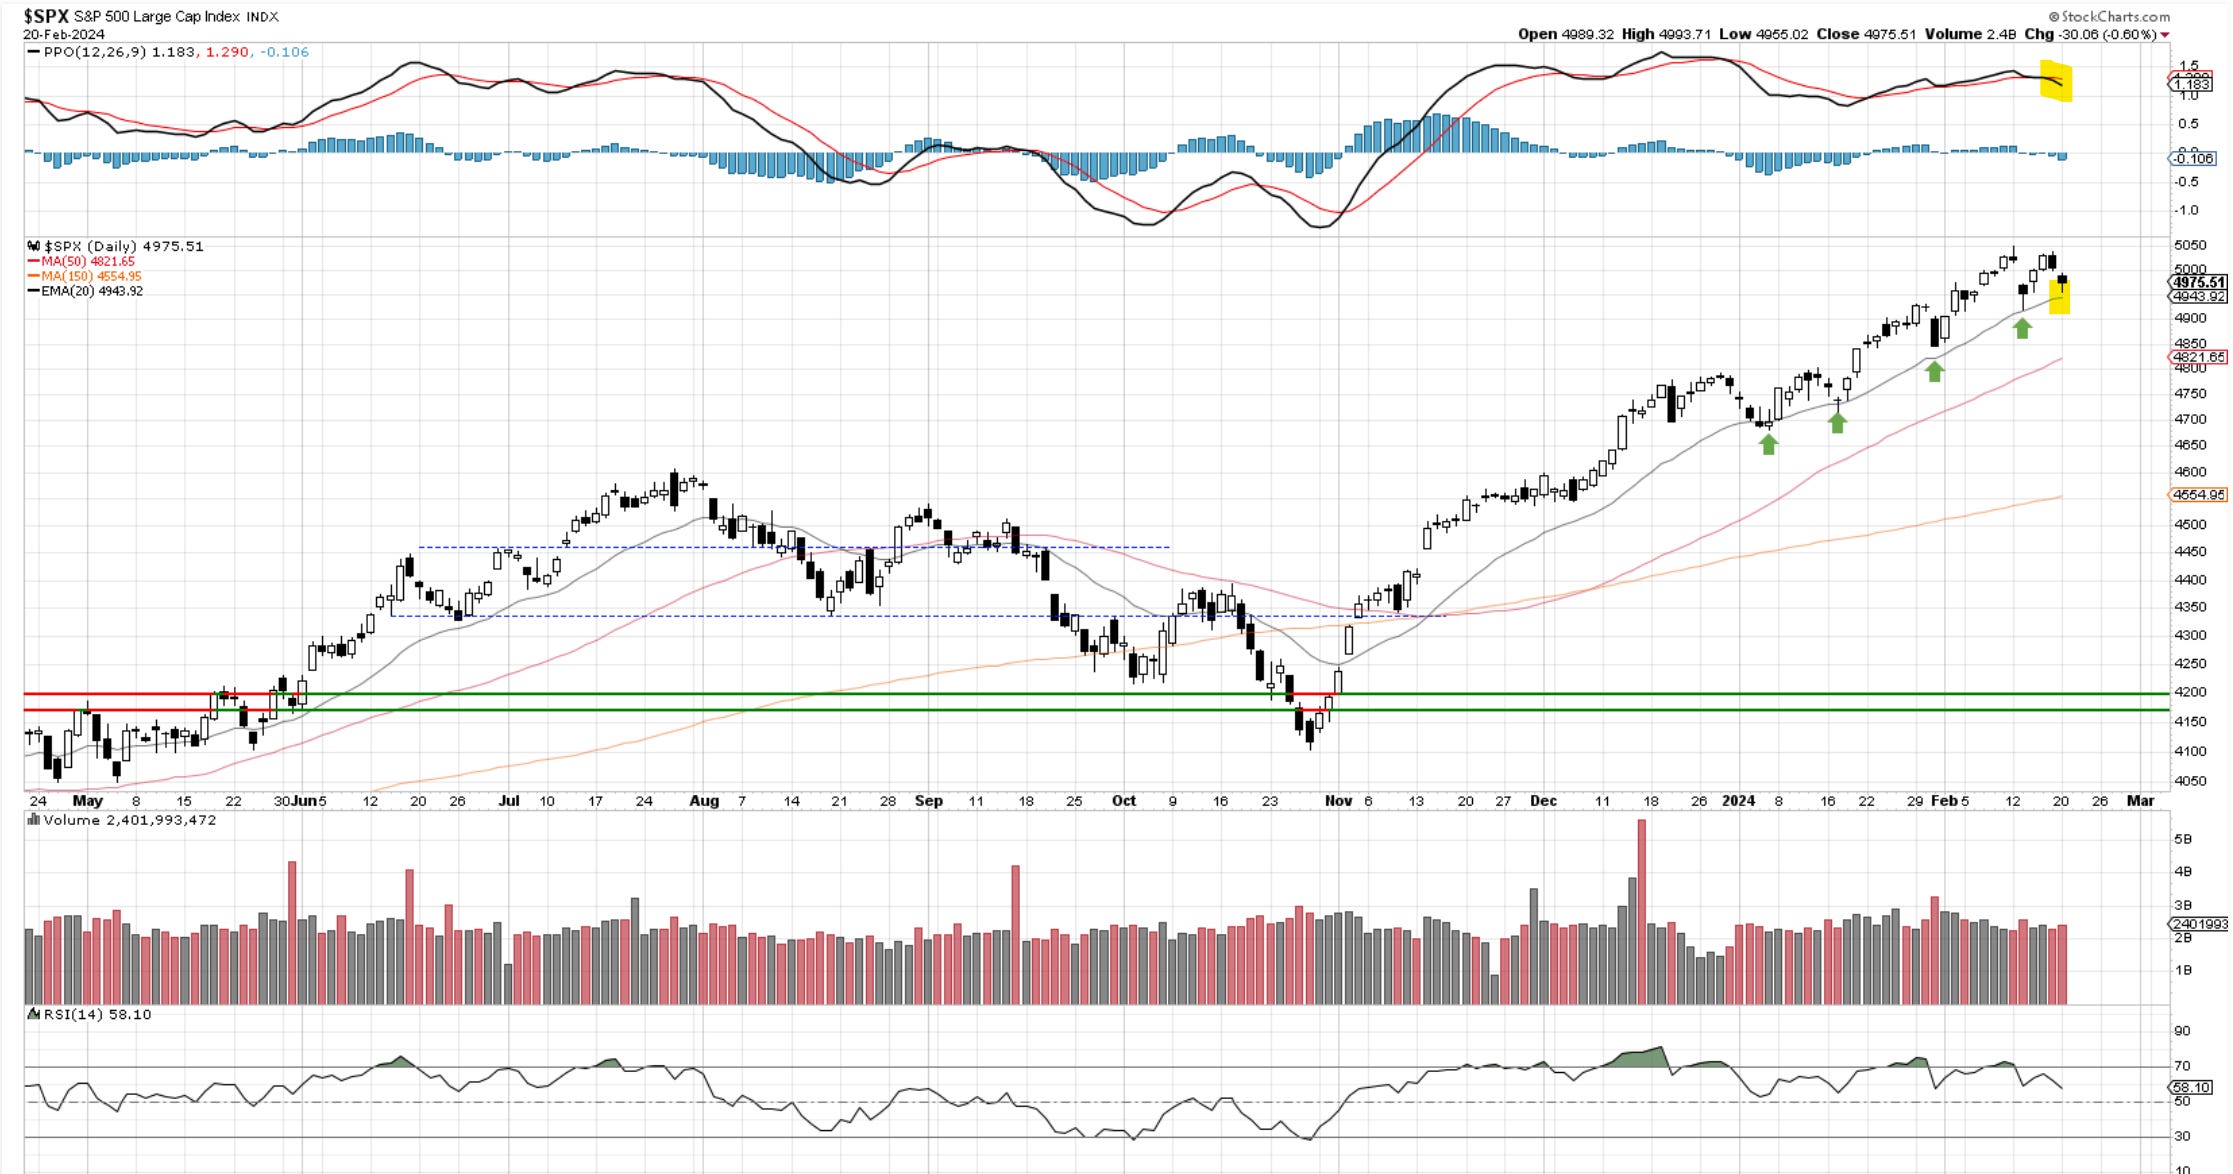
Let’s look at the Daily chart. Notice the prices testing the 20-day MA once again. In previous instances, it provided support, and it’s possible it will do so again. But I need to draw attention to a couple of things. The MACD broke this time around, and the 20-day test happened without the market making a new high prior. Basically, we’re coming from a lower high. This indicates weakness, and it’s quite probable that we lose the 20day in the days ahead. I have shown seasonality charts before, and we are now officially in a weak period historically until roughly the end of March.
With wave (ii) displayed just below the all-time highs, we should now be in the initial phases of wave (iii). The idea is that we would be looking for the most basic form of corrections, the zigzag. A wave ((a)) in five waves. We could get that or something else; that is up to the market. Our job is to continue to look for signs of this still being on the correct track or not. So far, it is. The 20-minute chart below shows another impulsive move from the c wave top. Normally, we would now see a 3-wave rally followed by further declines.
Let’s continue to analyze the rest of the markets,
