
The Daily Drip
Markets review, strategy and analysis
Note: The EW counts on the right edge are real-time, and they are prone to adjustments as price action develops. Elliott Wave has a fluid approach, is evidence-based, and requires constant monitoring of certain thresholds.
In the counts below, this (( )) = circle on chart
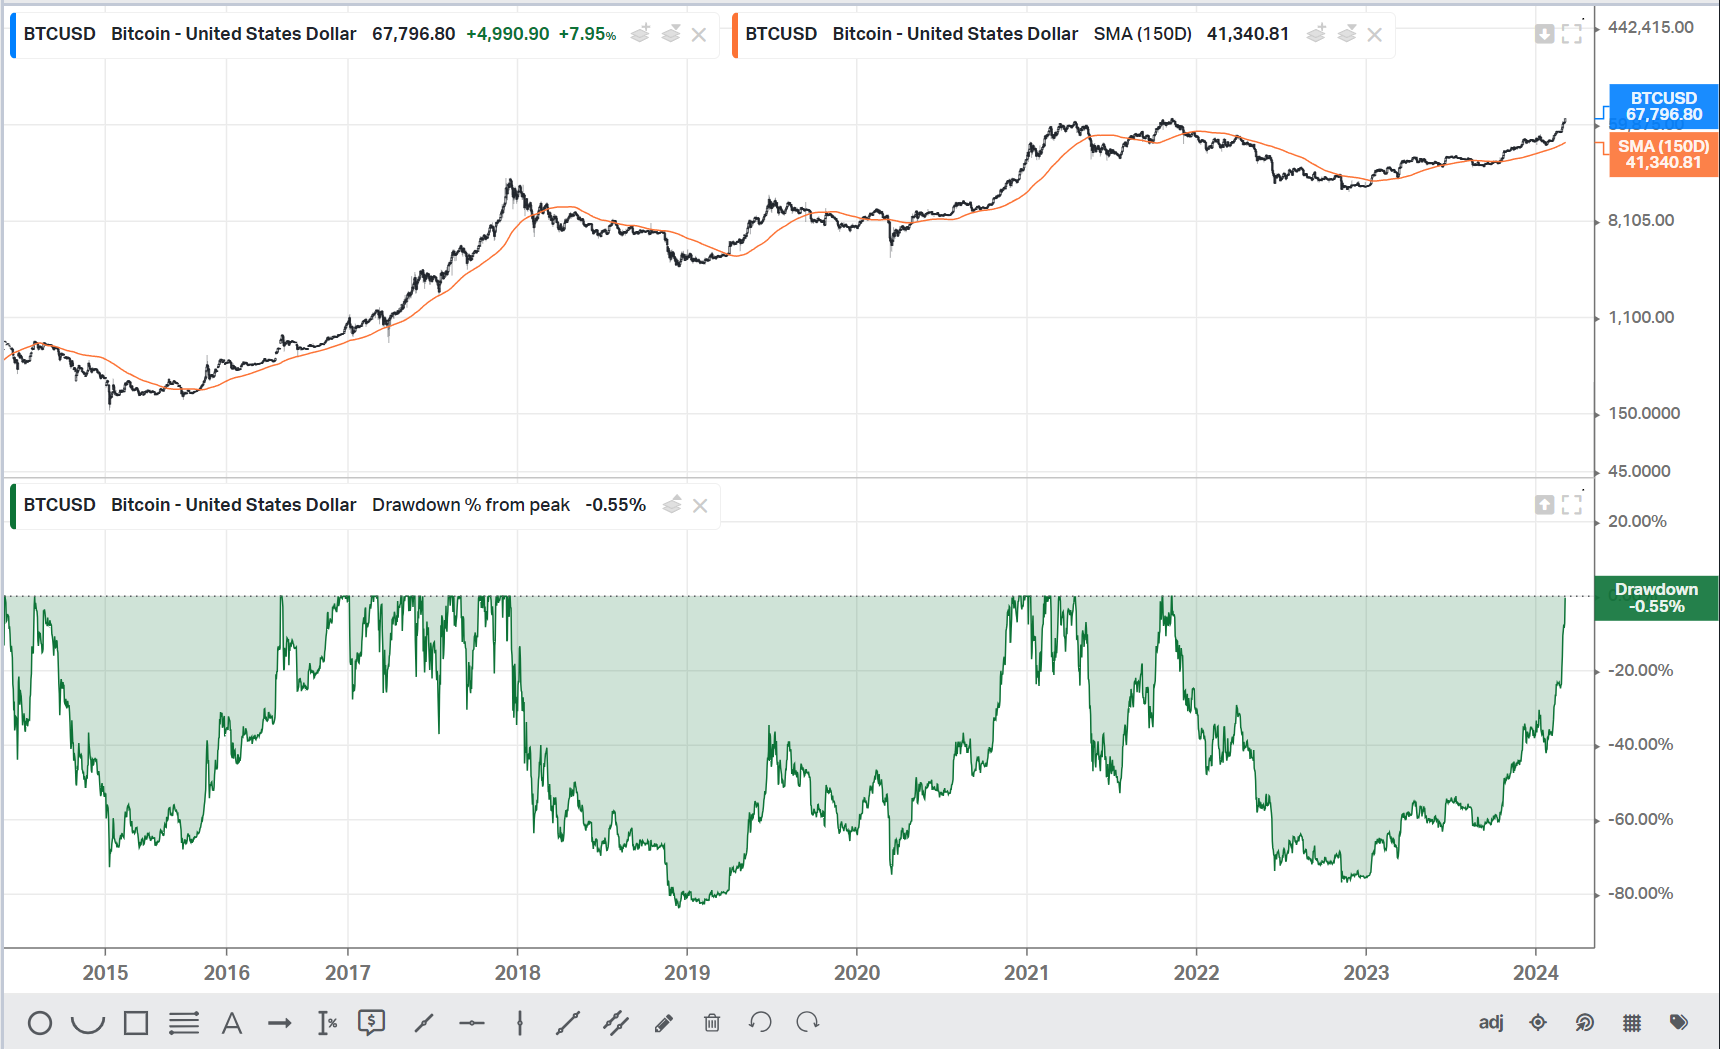
Chart of the Day BTC - It took Bitcoin 2 years and 4 months to return to ATH. The last time we had a large bear market, it took 3 years. Holders continue to get rewarded for their patience.
SP500
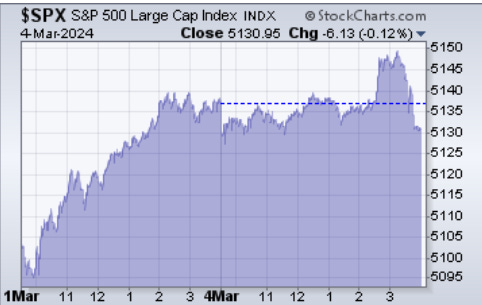
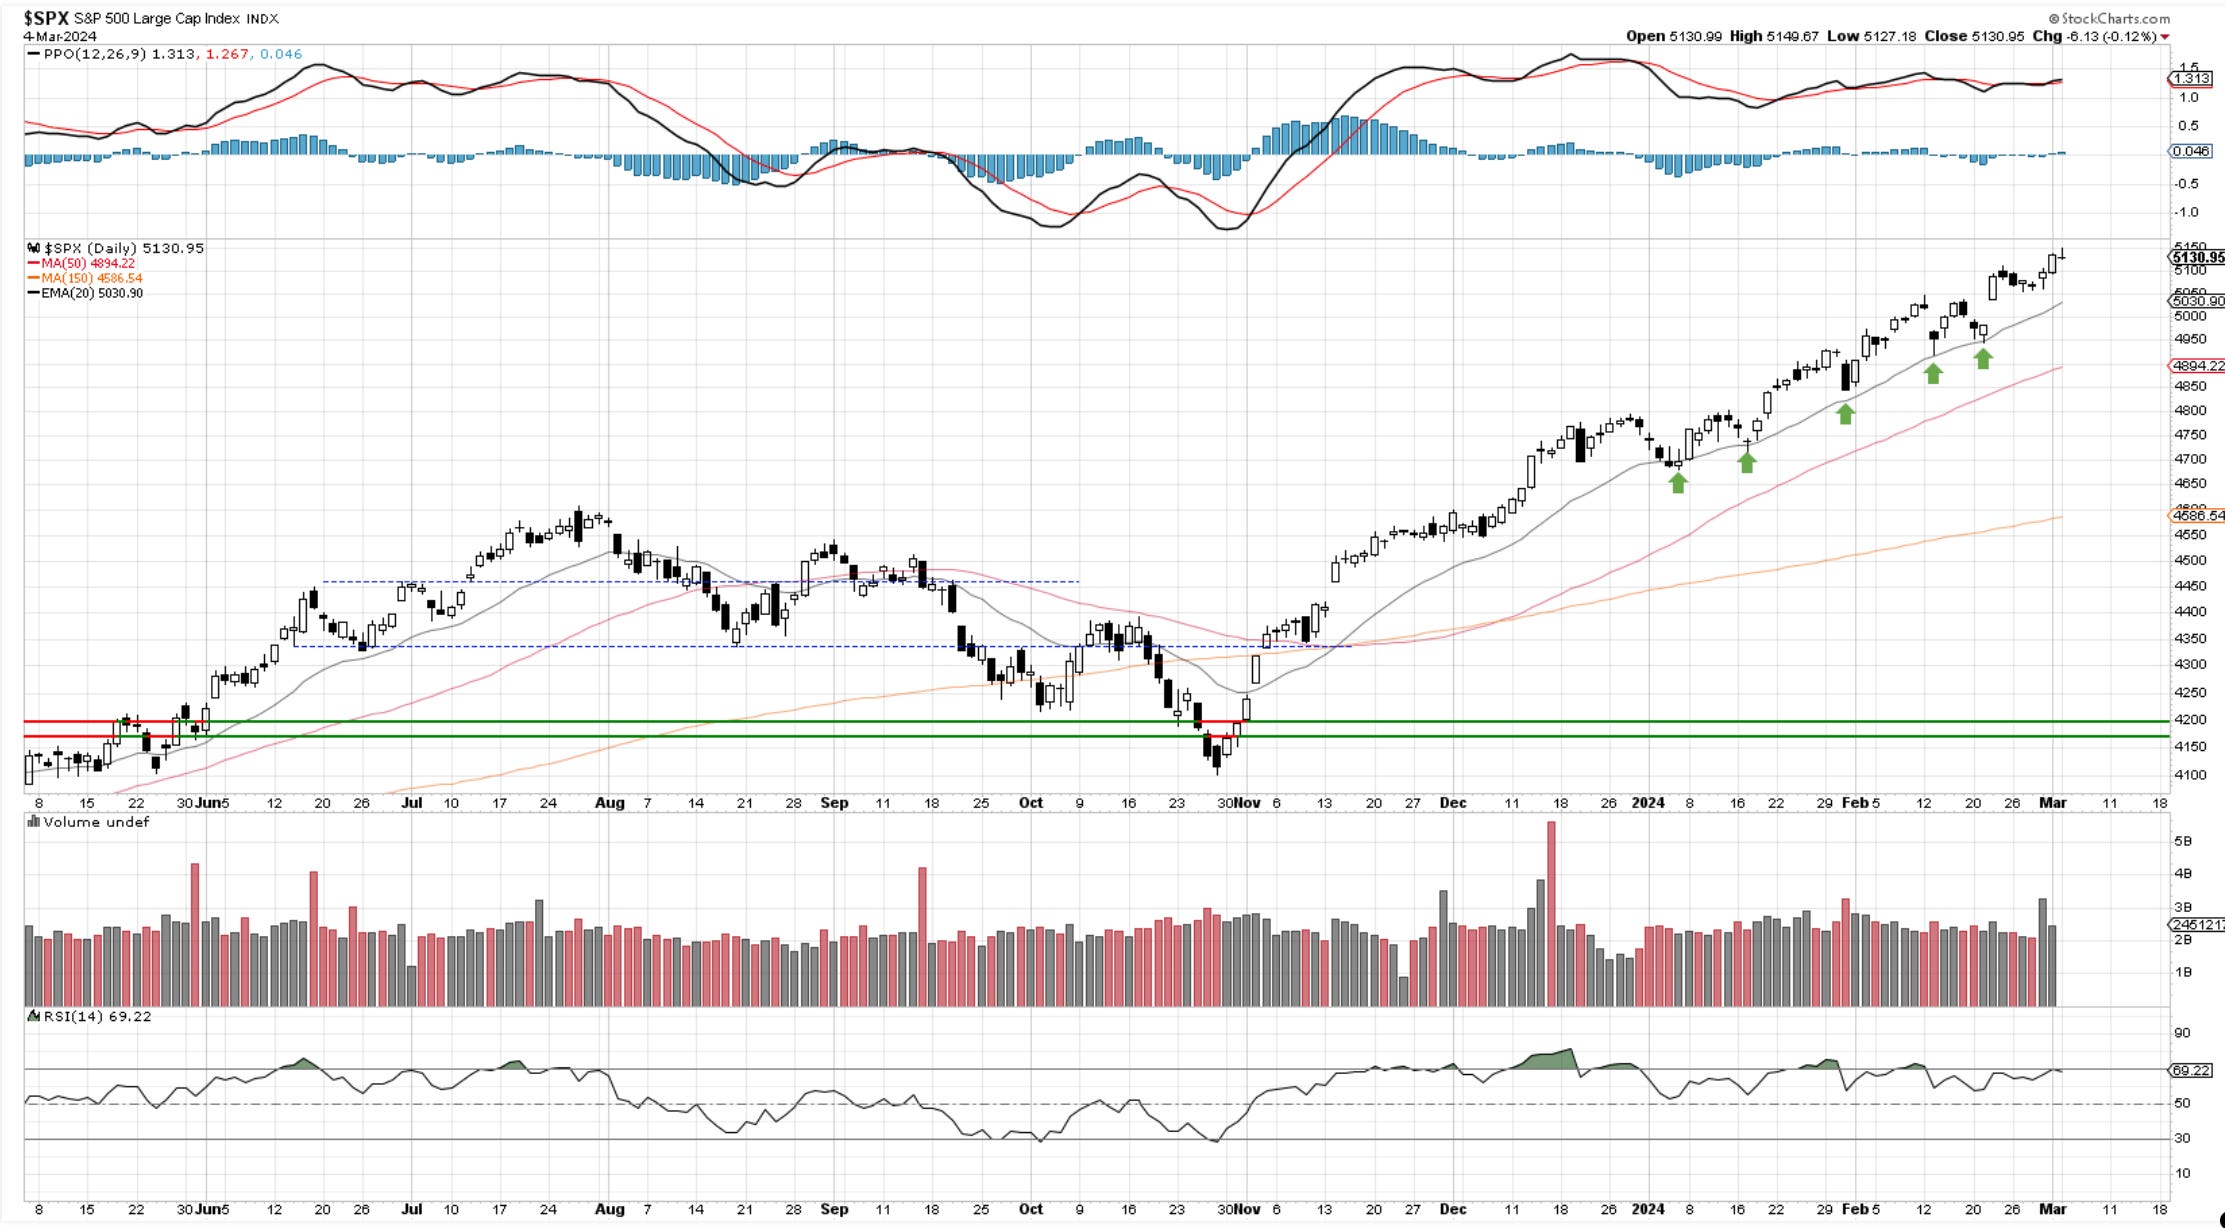
Today’s price action posts a small failure after an attempted rally. You can see in the clean bar chart below how the open and close are near the same levels with a quick thrust to new highs. A smaller chart below depicts the intraday moves. Everytime bears take charge and close lower at the end of the day one must pay attention. The evidence of trend exhaustion is still small, and we need to see more to start thinking a correction is upon us. A break of 5100 would be additional evidence.
This week has some important events, one of them being Jay Powell testifying in front of Congress on Wednesday and Thursday. Then we have President Biden’s State of the Union on Thursday evening. The Job report on Friday follows it. Next week, we have the inflation CPI data on Tuesday. As you can see plenty of tape bombs lurking in the shadows and for the markets to take on additional risk, it will be tricky. We might see a bit of choppiness until mid-next week.
Let’s take a look at the charts below and review SPX, NDX, IWM, DOW, DXY, GOLD, BTC
Daily video following as well…
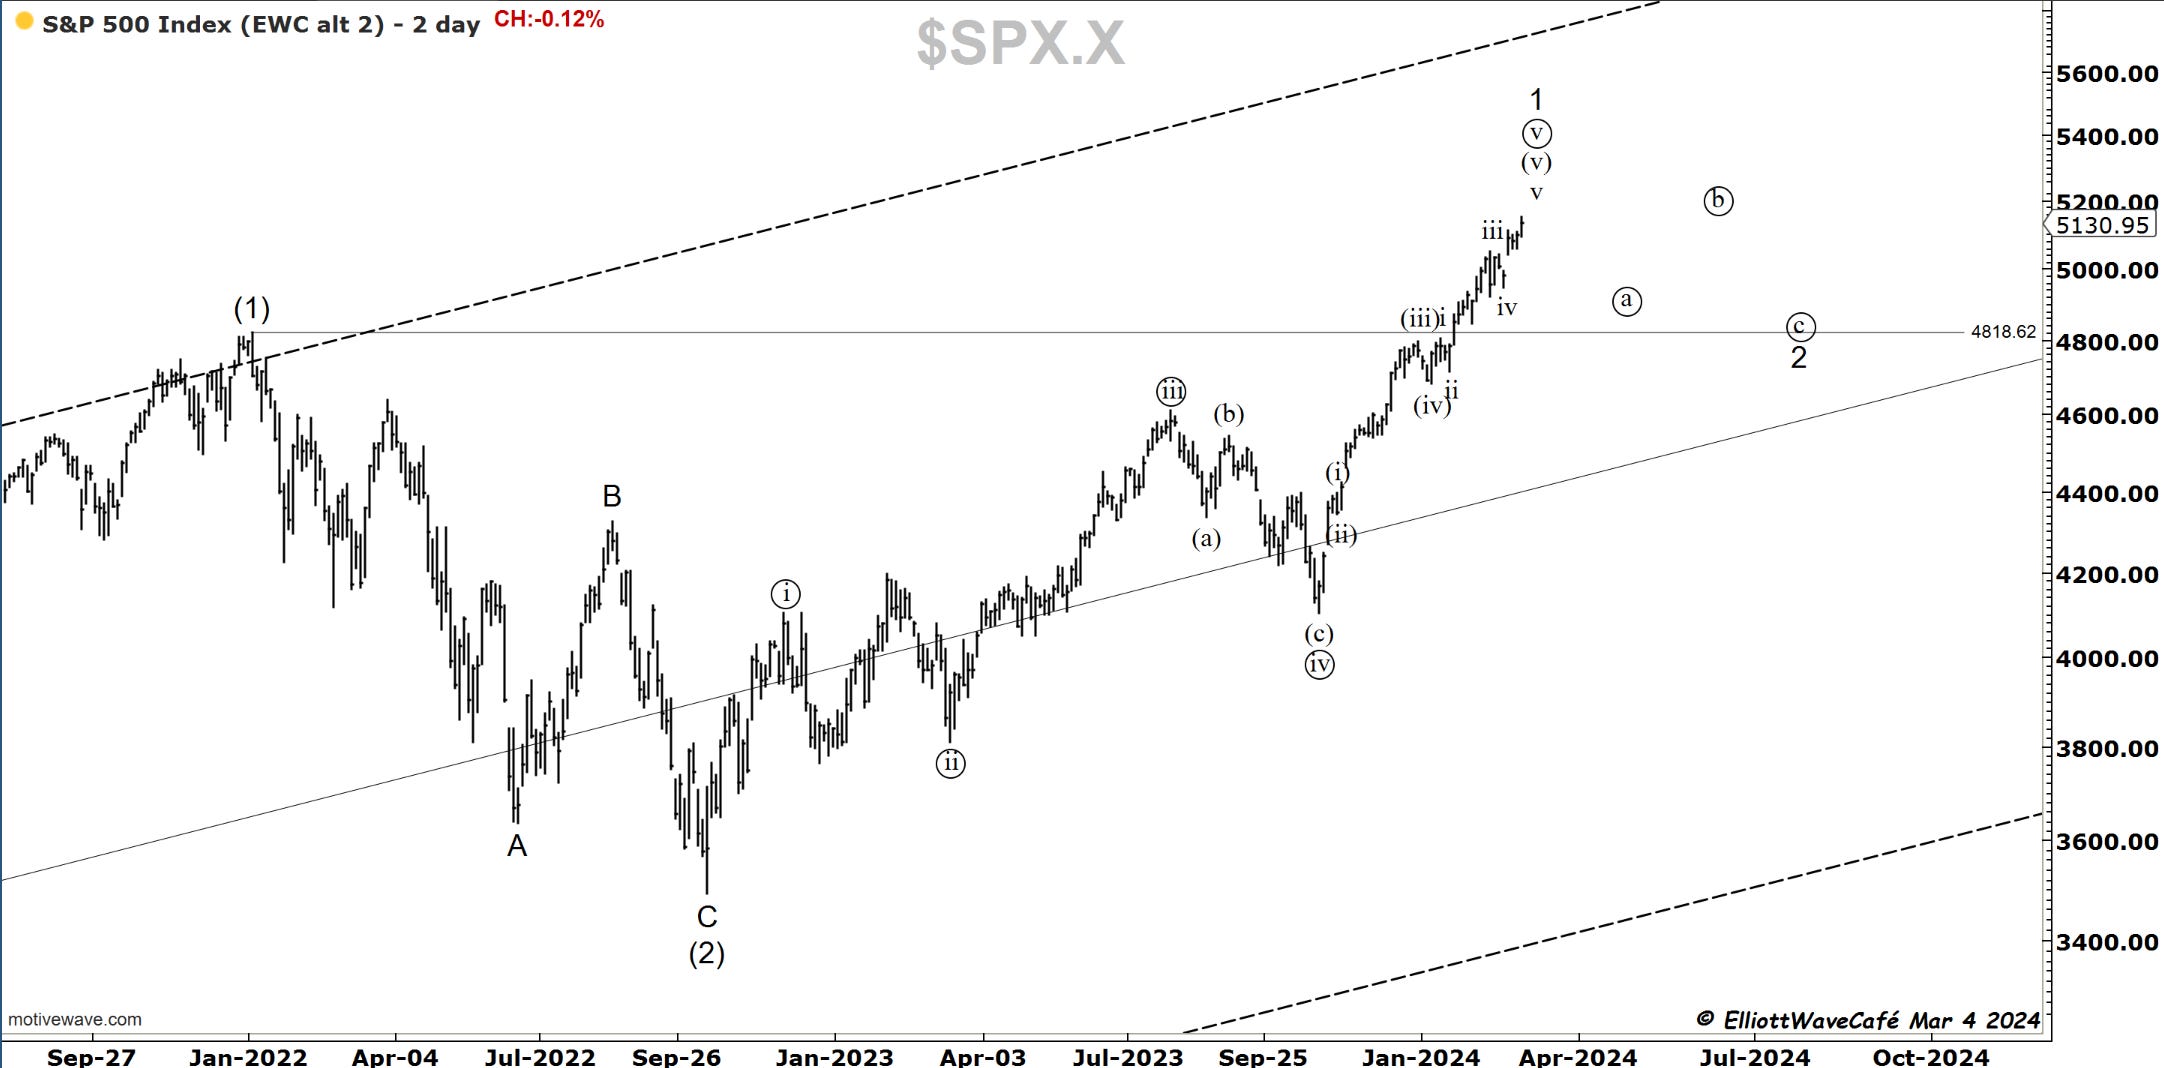
The daily trend remains clean and with no visible attack upon key moving averages. If we lose 5100, then 5050 becomes the bid area for shorter-term trend following systems.
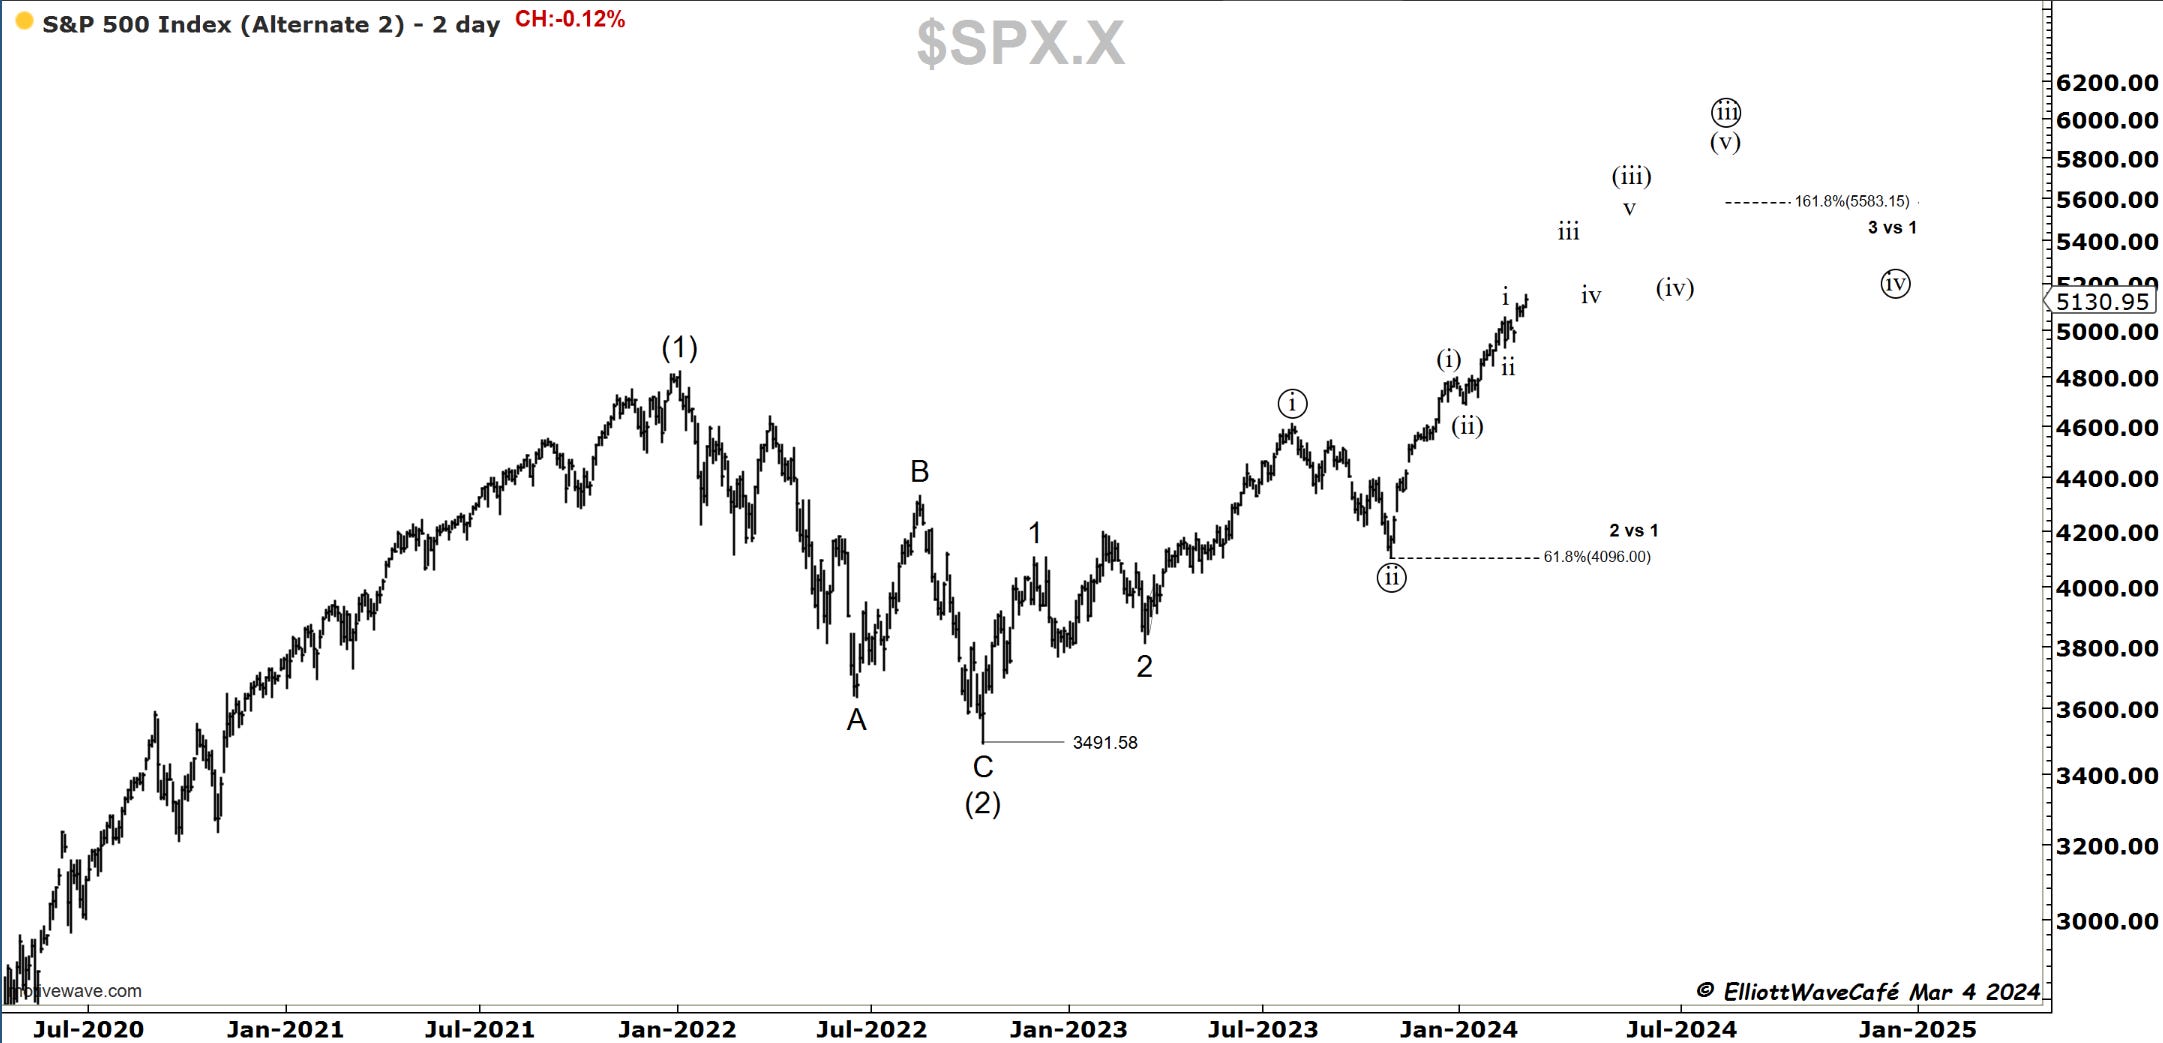
Running two simultaneous counts at the moment. It is hard to make trading decisions based on the current mix, so the best I can do is observe and look for evidence of them working or not. In the first chart the idea is that we’re in the middle of an ongoing trend, while the second is pointing to exhaustion in a fifth wave. A very hands-on active trader following the trend must continue to raise stops above key levels and know his invalidation levels.
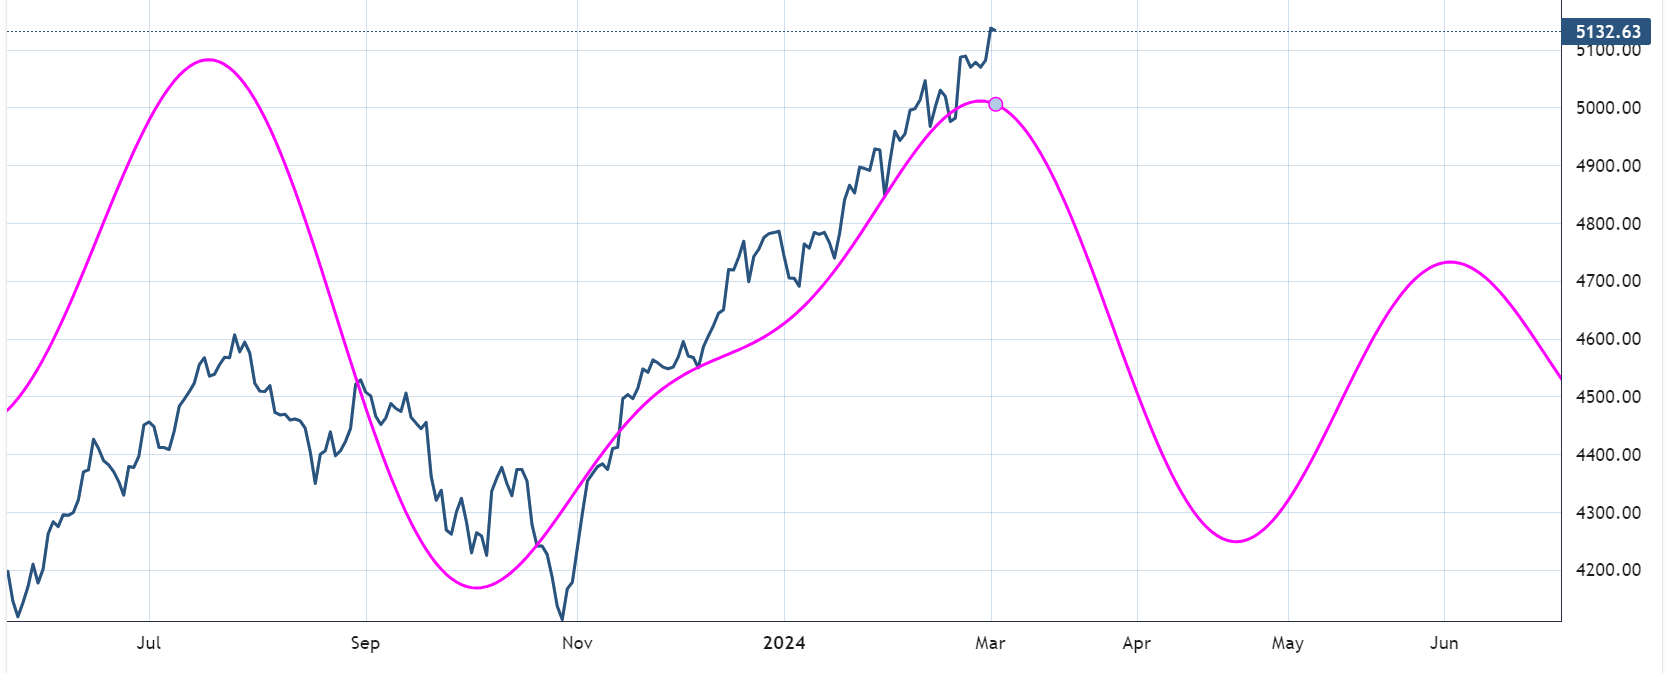
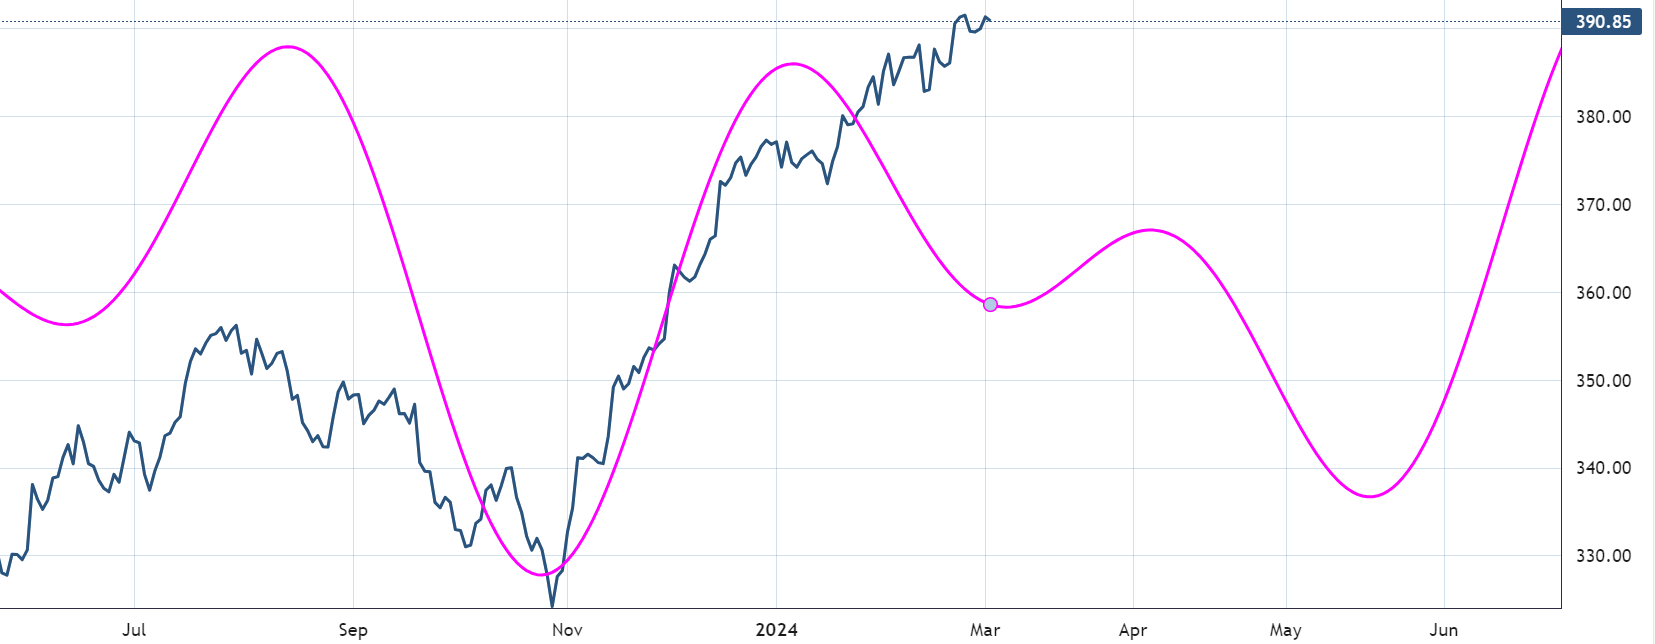
The active composite cycle of 180,124 and 80 days points to some weakness over the next 6 weeks after failing to respond at the data observed late December and January.
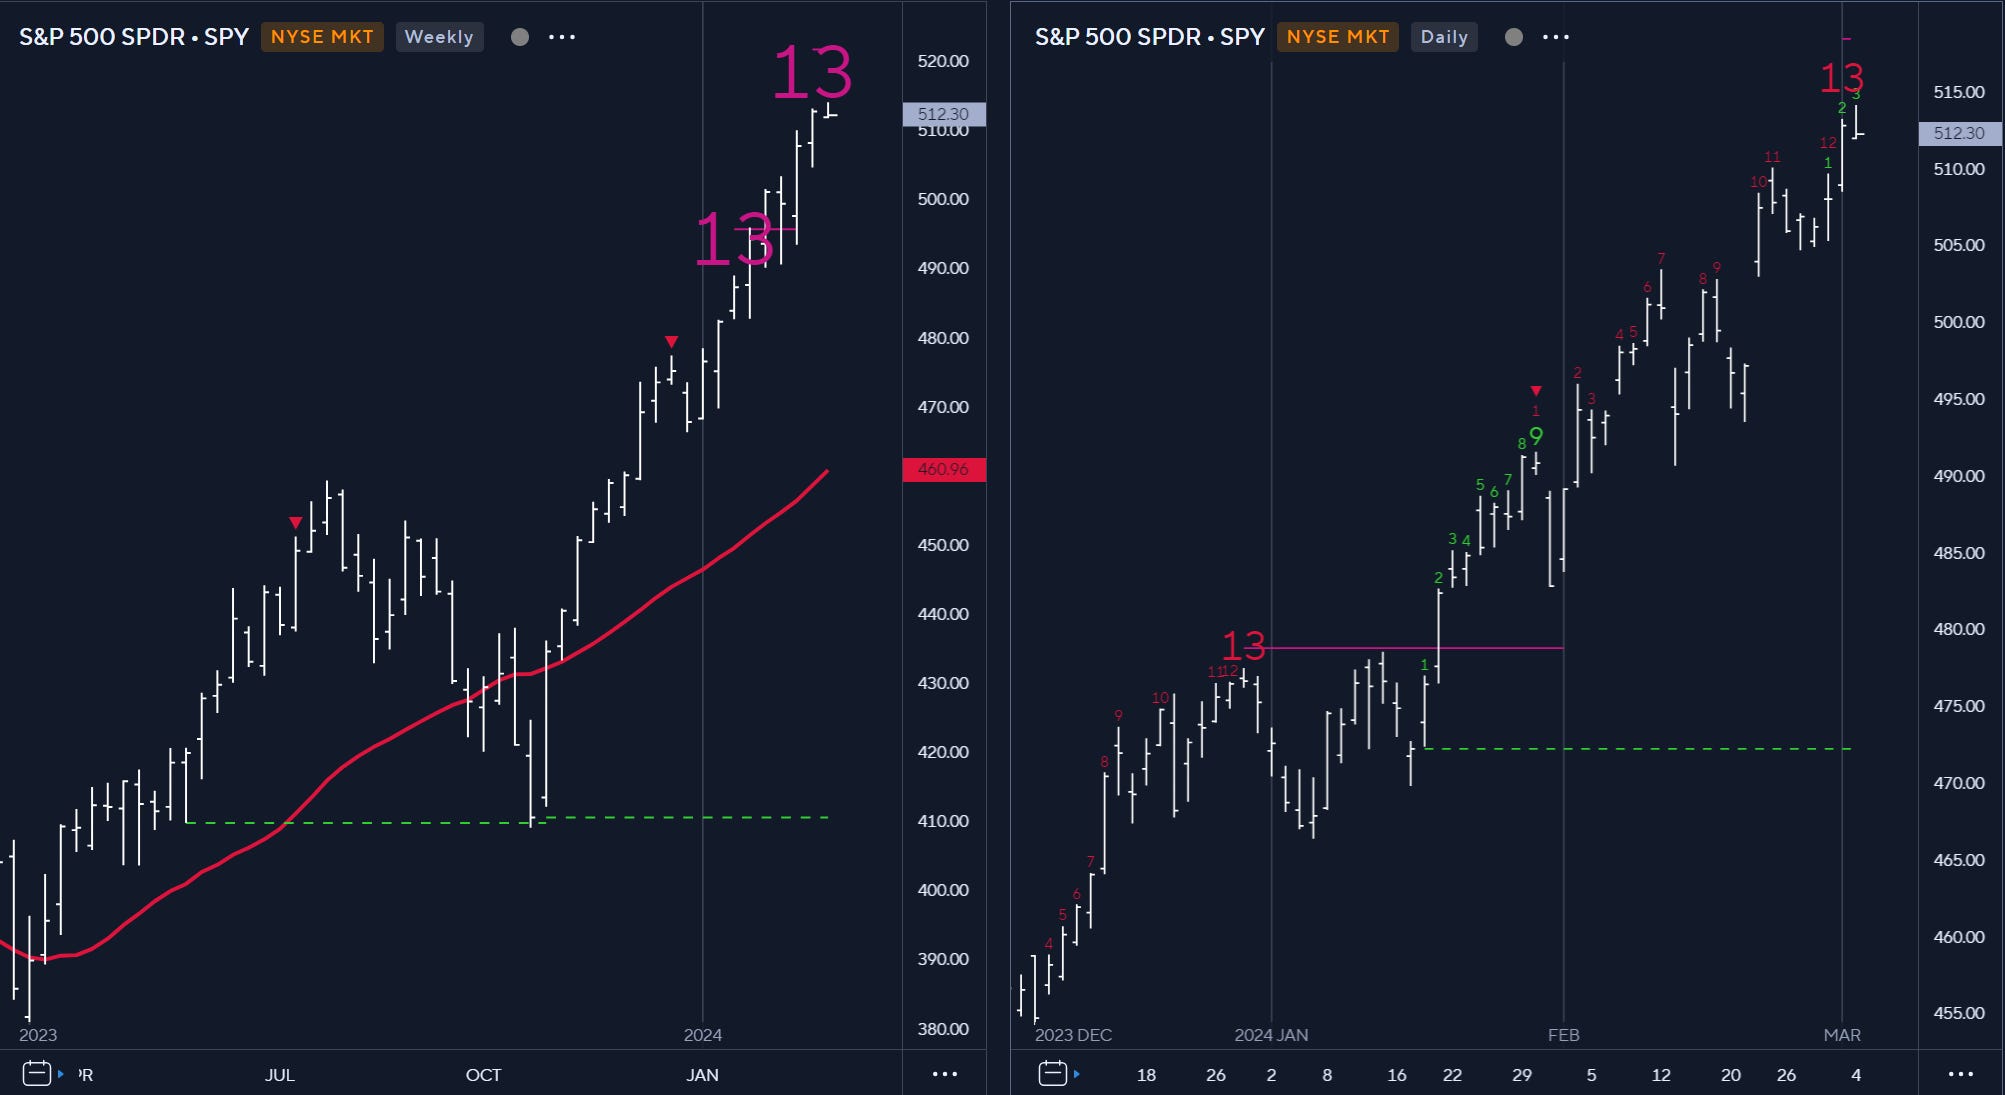
Another interesting “caution” signal comes from the DeMark indicators that point to buyer exhaustion on both weekly and daily chart with 13 counts visible on sequential and strict combo.
Head on a swivel here as we’re entering the depths of March after failing to correct during what historically is a weak February. Check out the weekly report for larger weekly trends and breakouts that remain bullish.
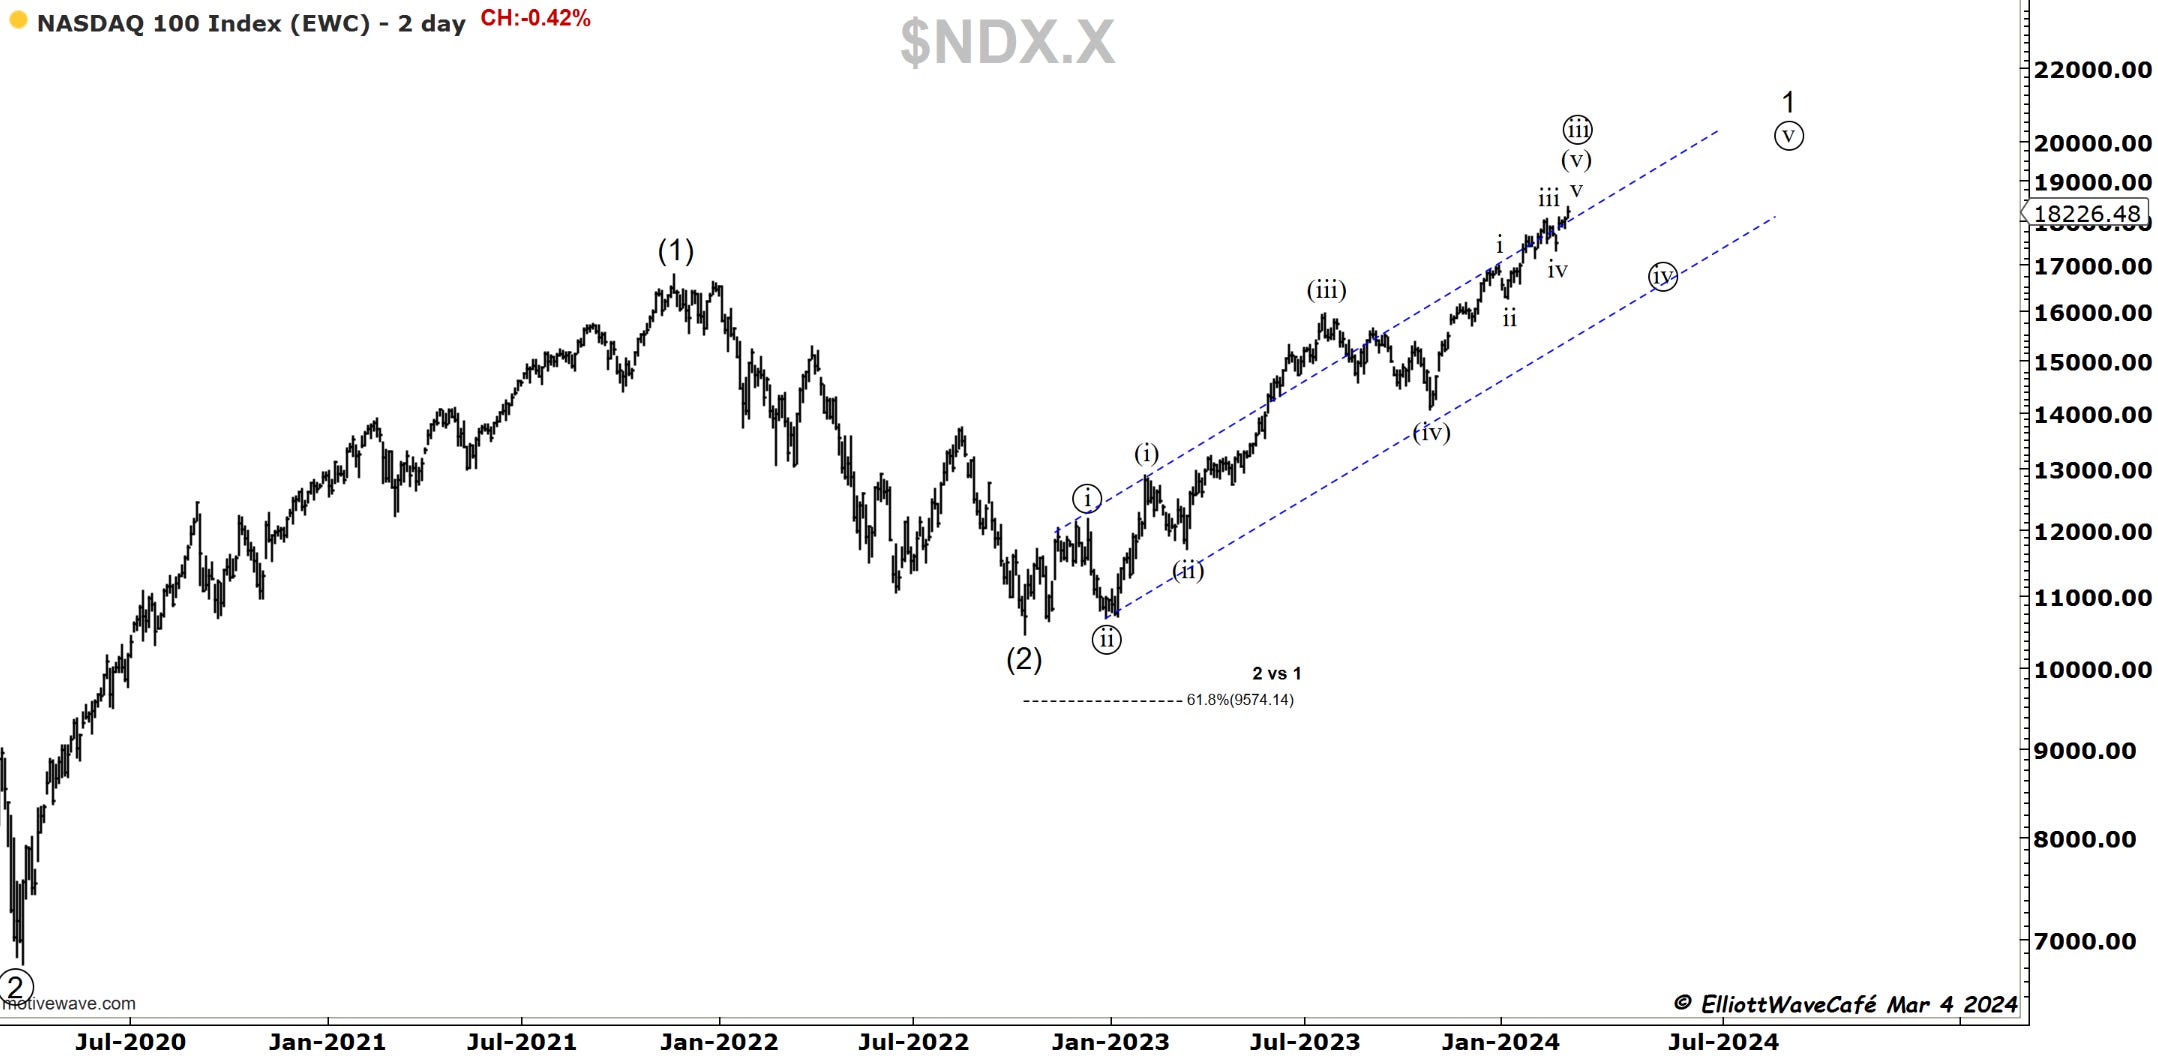
Nasdaq100
Stocks like TSLA, GOOGL, and AAPL had a pretty bad day but did not really derail the larger tech composite. We lost some ground in the close but until 18k gets broken there is not much to note here. Trends are intact.
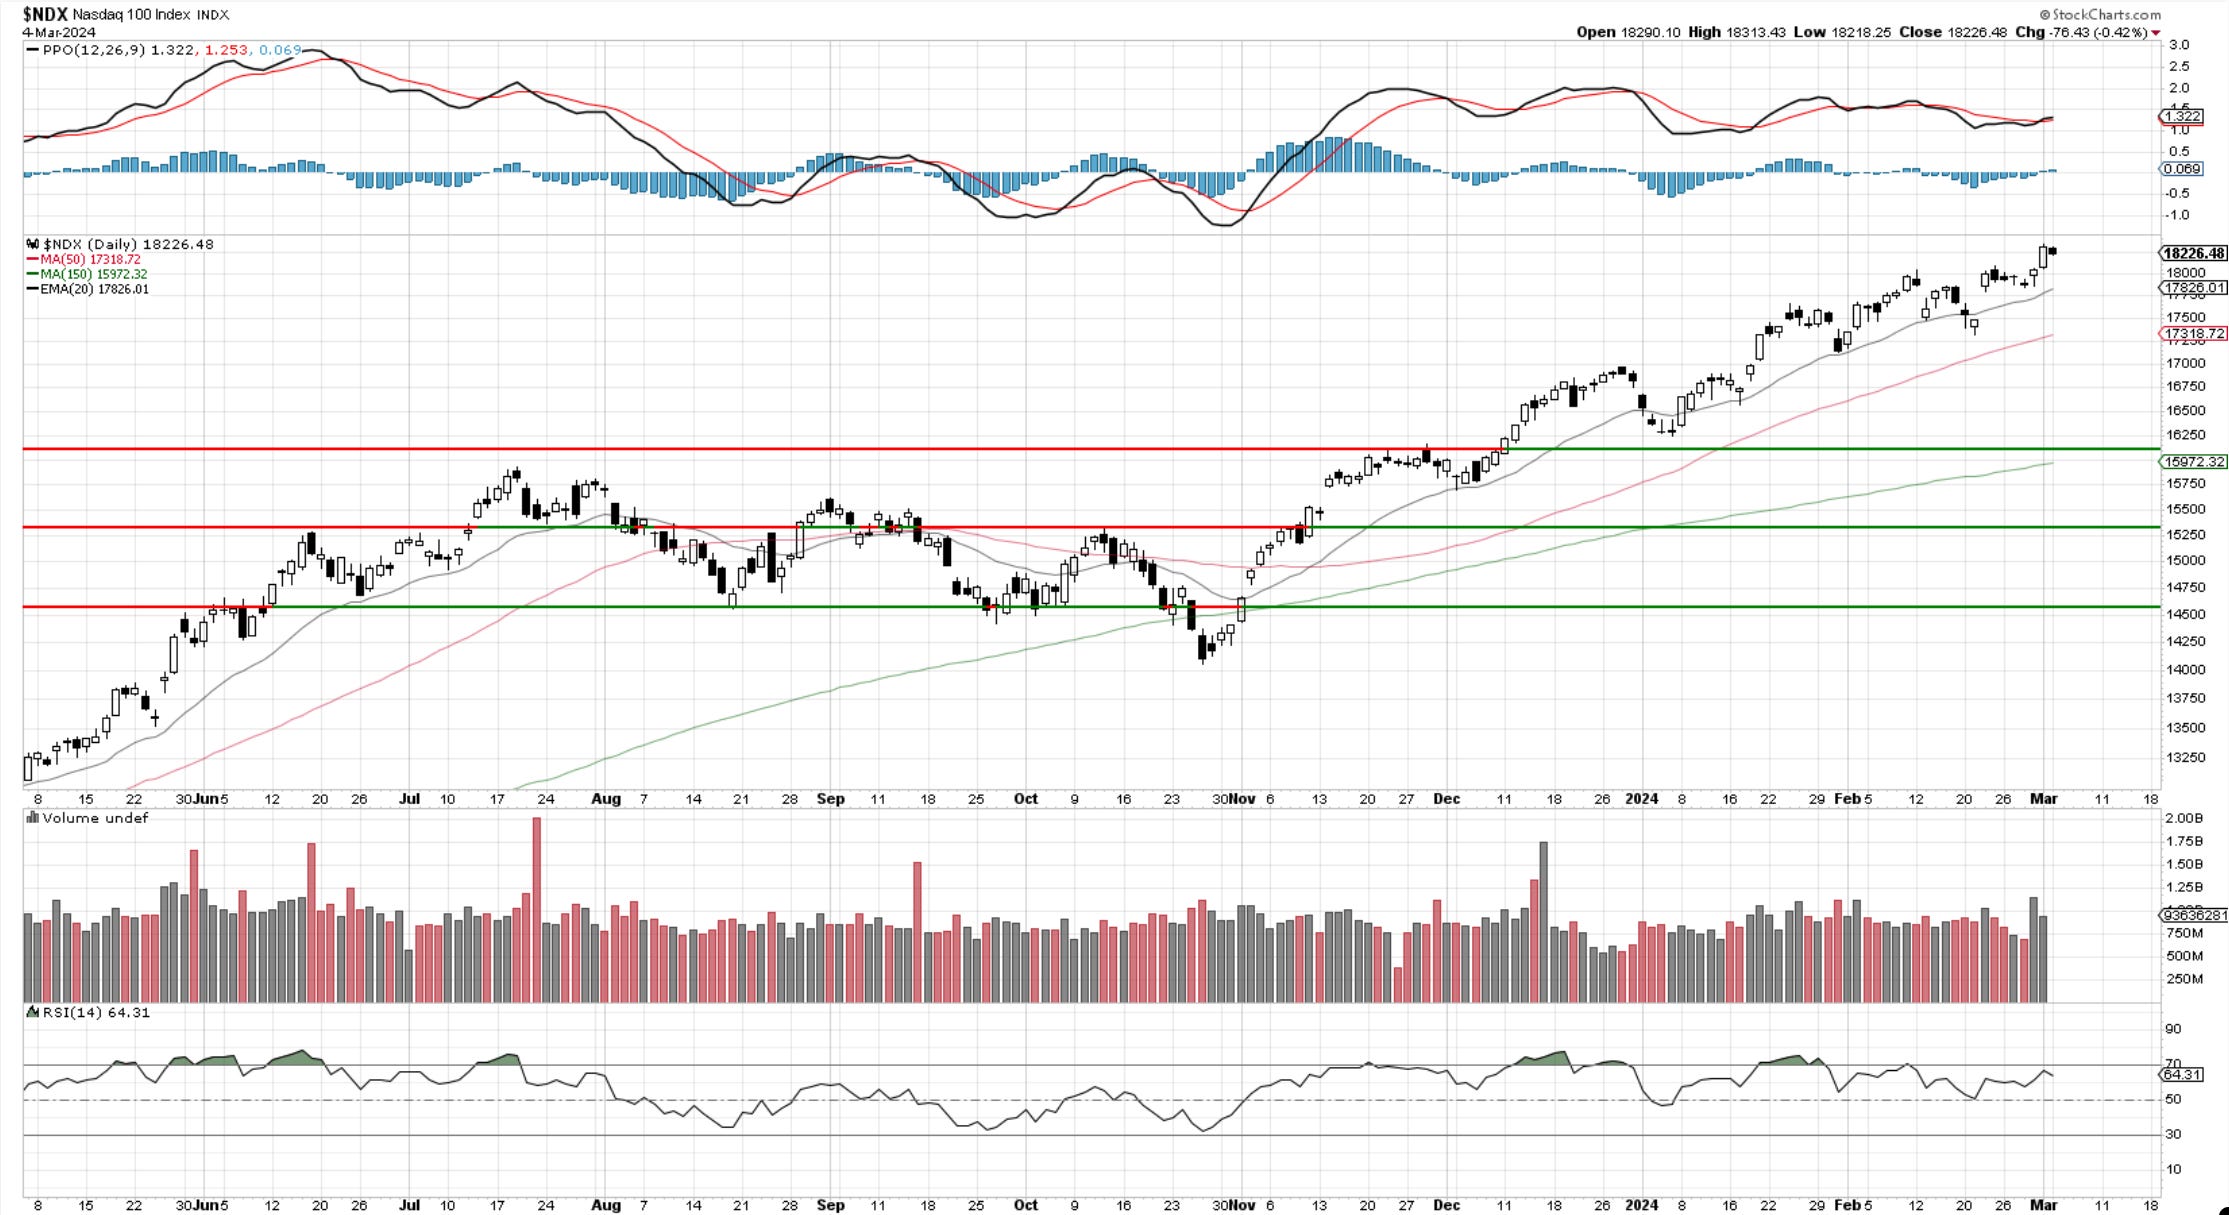
You’re familiar by now with the 2 active counts we’re tracking. I would want to see the market get below 17k to elevate the bearish version to primary status.
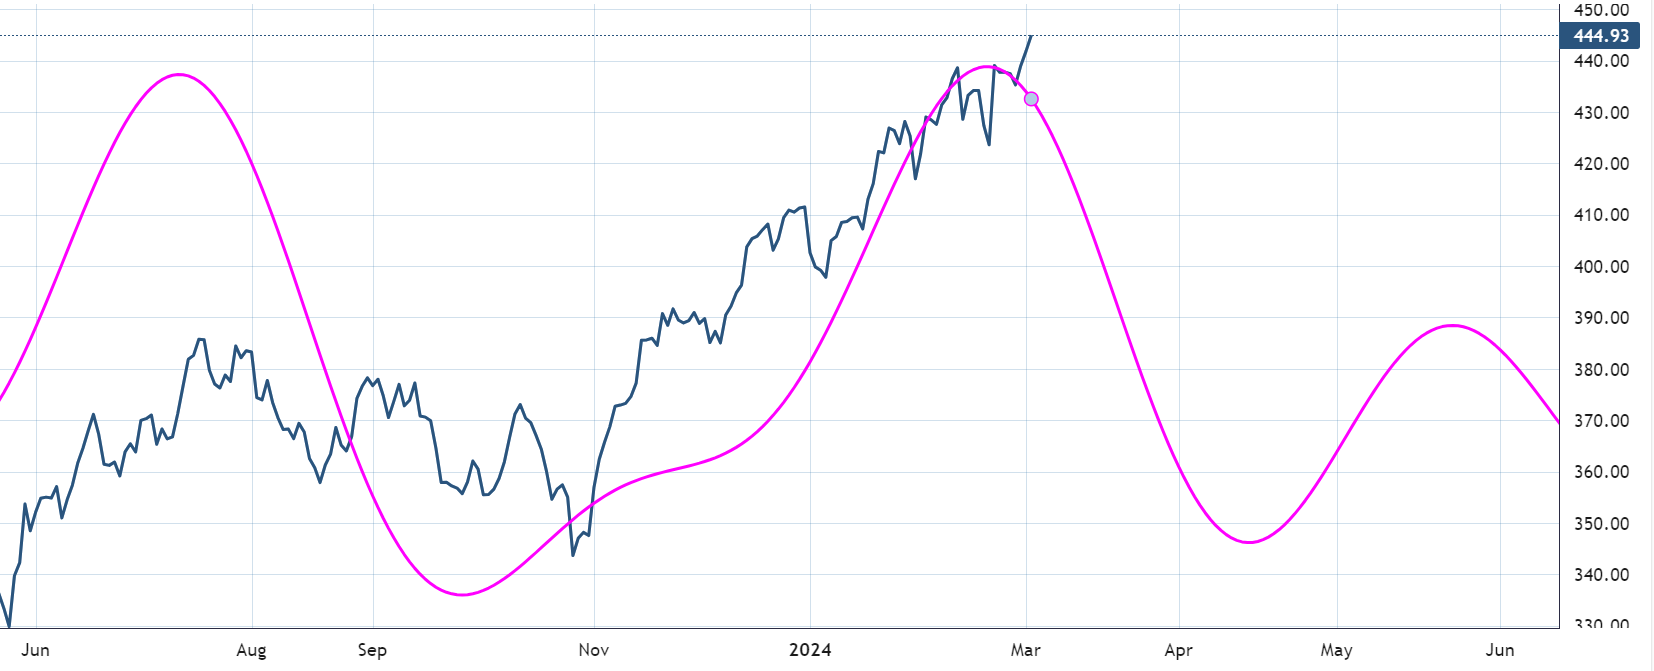
The cycle composite in the QQQ looks similar to the SPY and within a decent timeline for some sideways action or give-back.
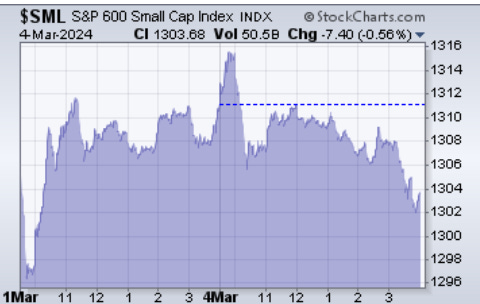
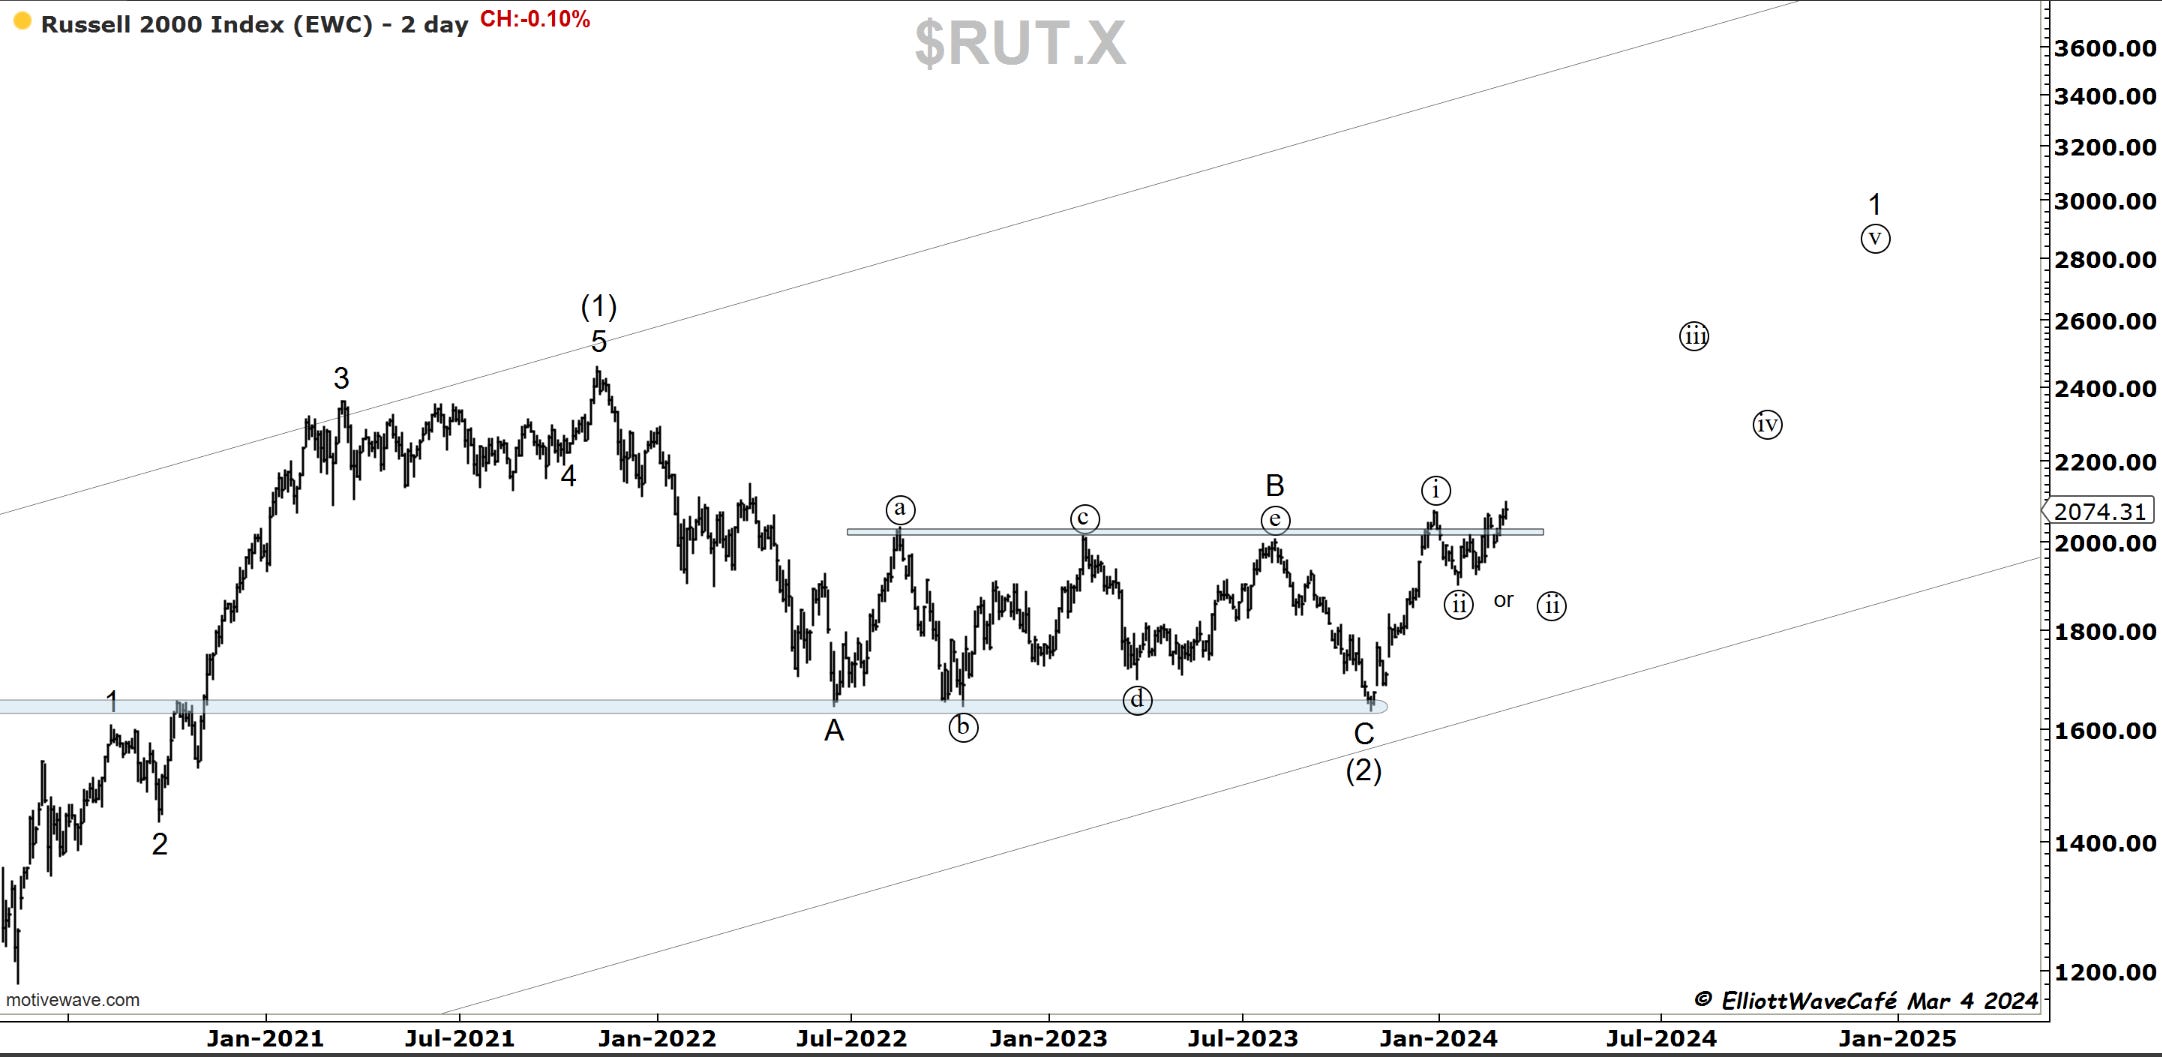
RUSSELL 2000 - IWM
Small caps started strong right out of the gate, but then the rally fizzled out as the day went on. If it manages to remain above 200 the arguments for bullish positions and breakout remain. Below those levels, a technical trader needs to be cautious.
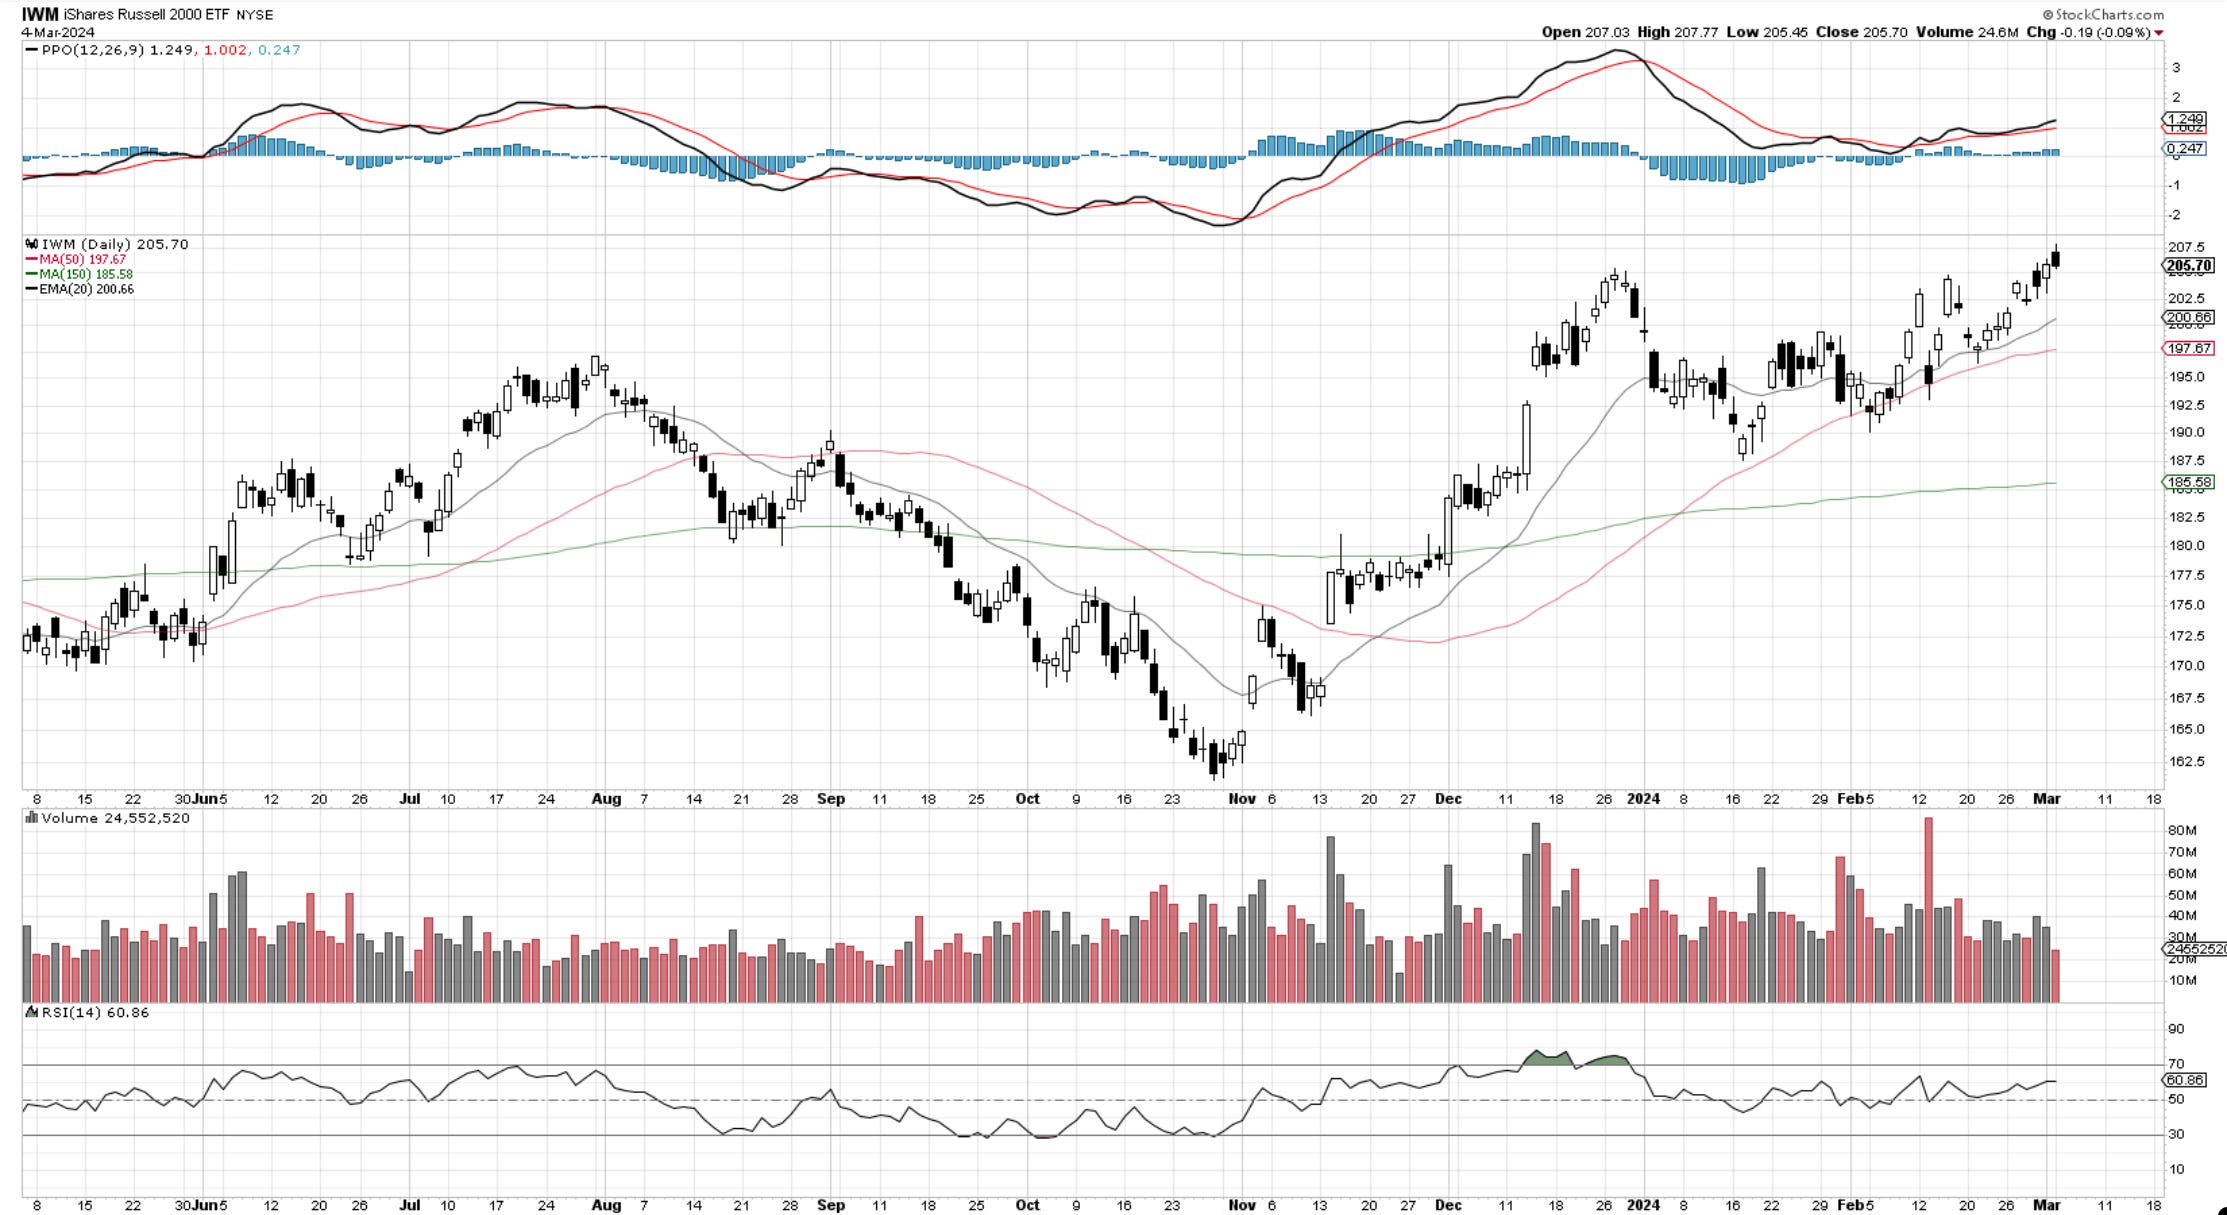
A choppy move to above wave ((i)) top always makes it susceptible for a B wave.
For those wanting to chat with fellow traders, the link is below.

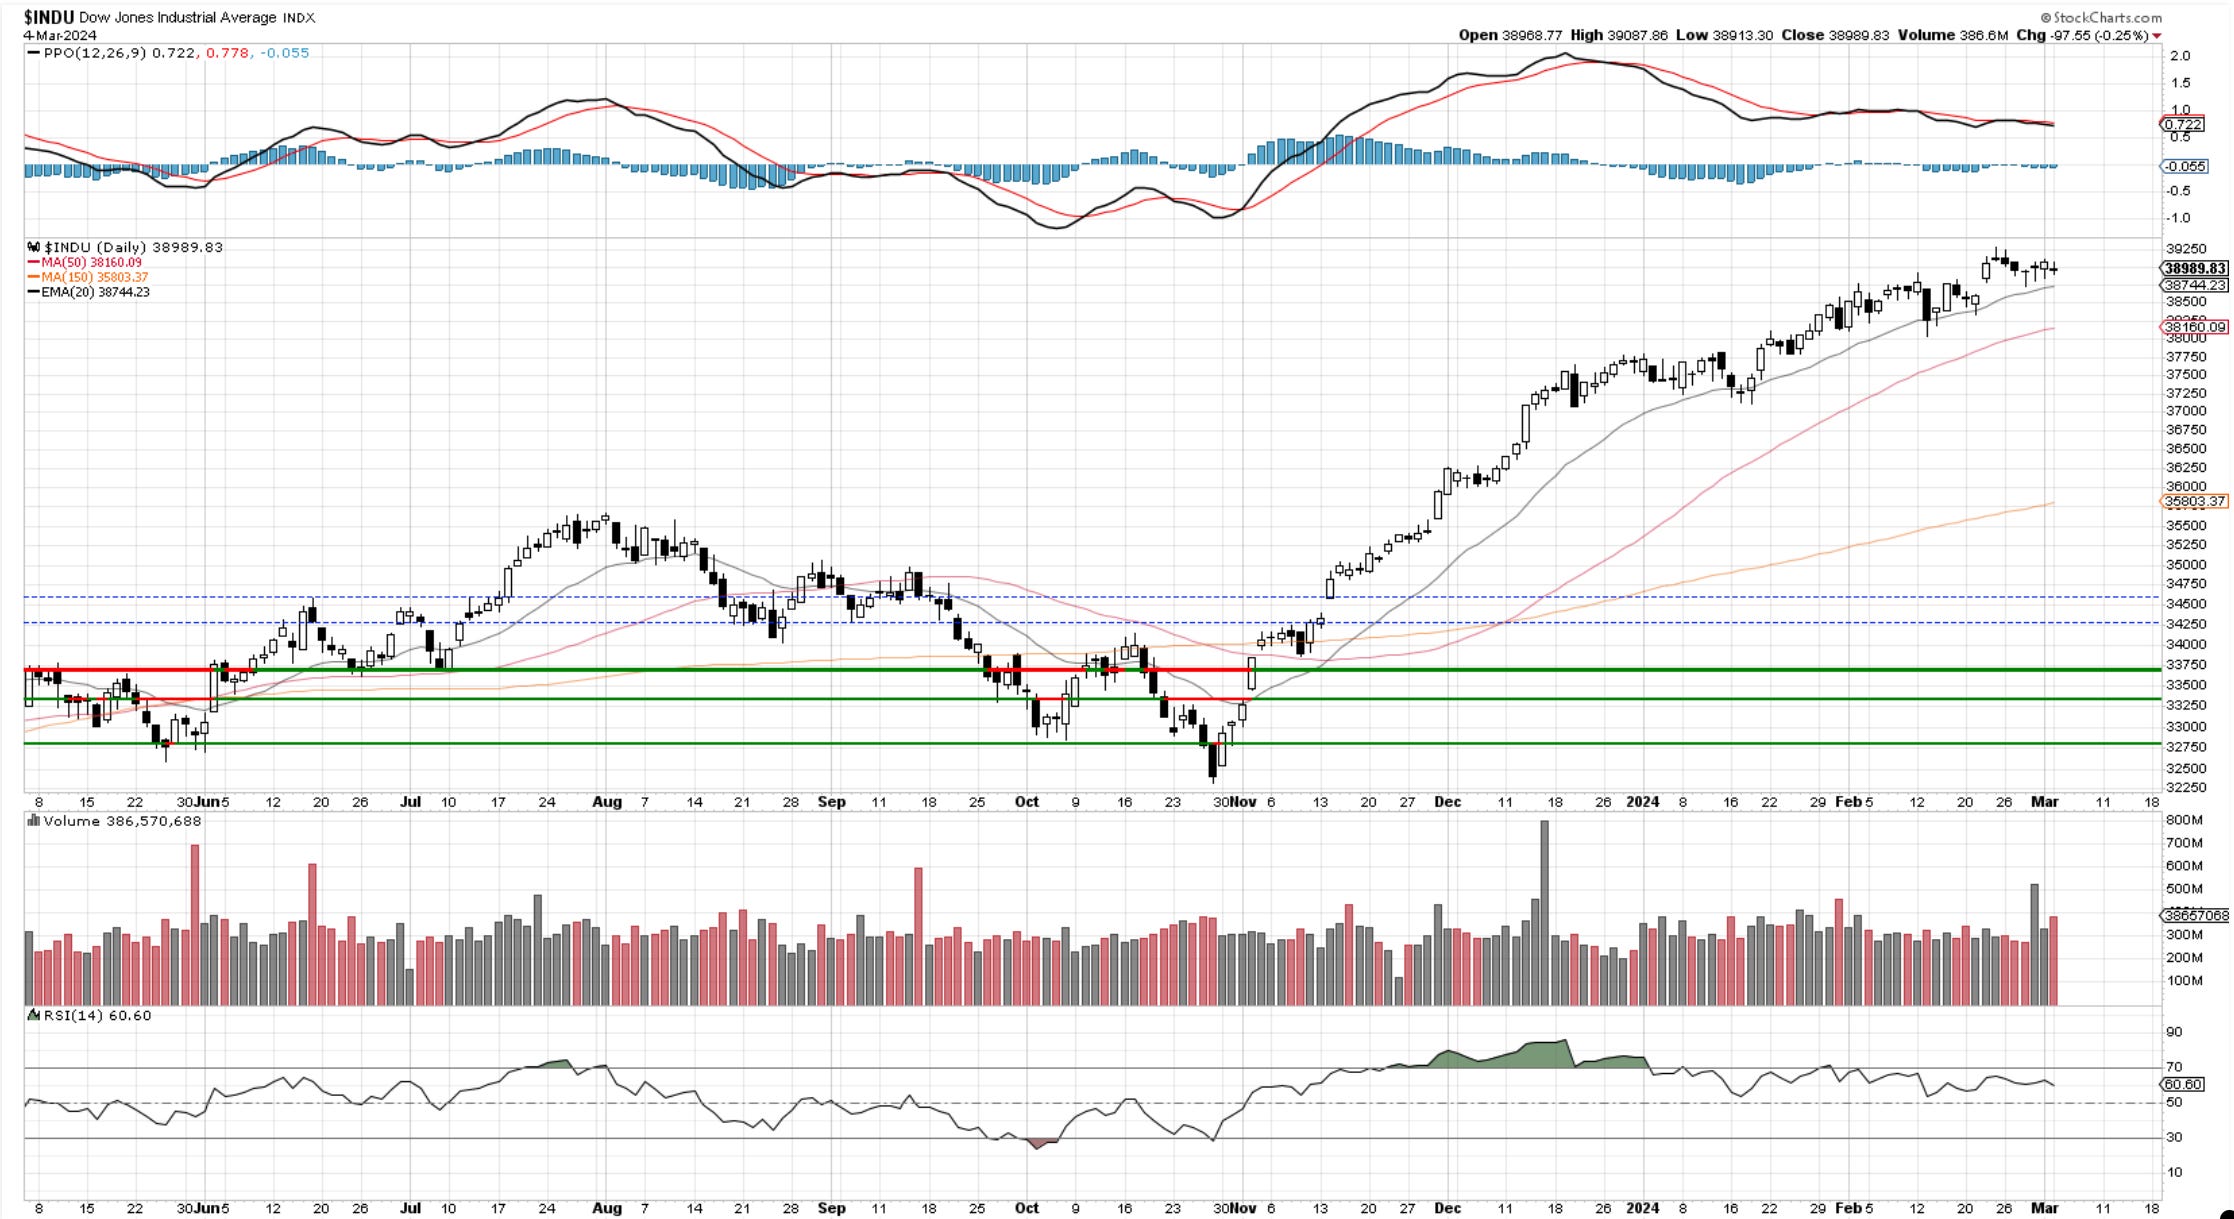
Dow30
It has been seven days since the Dow broke 38,800. It only managed to get to 39,130 before retreating and sitting at old resistance. Looking at it as a pause in trend for now until we see some clear violation of lower levels.
The two active counts put elliott wave analysts in a difficult position at the current juncture.
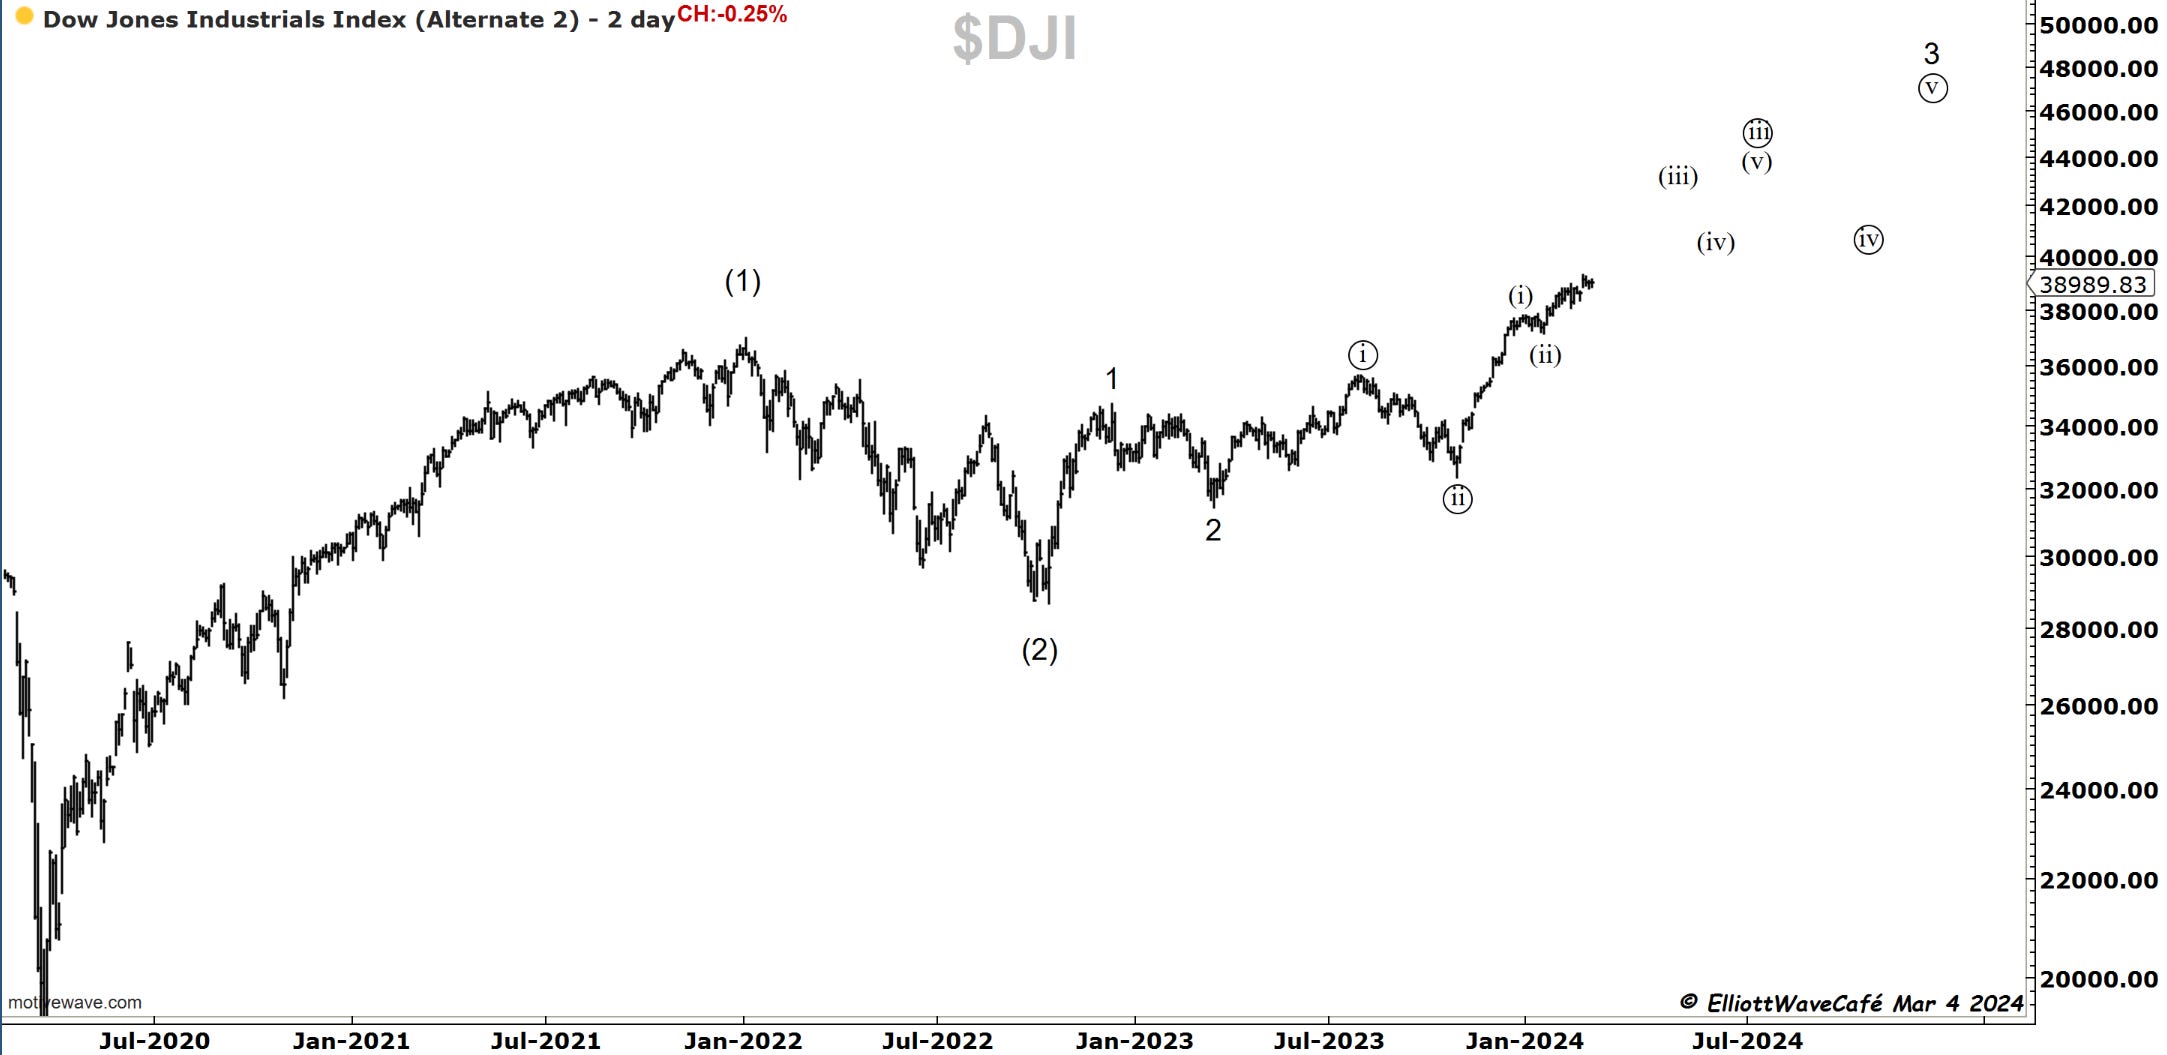
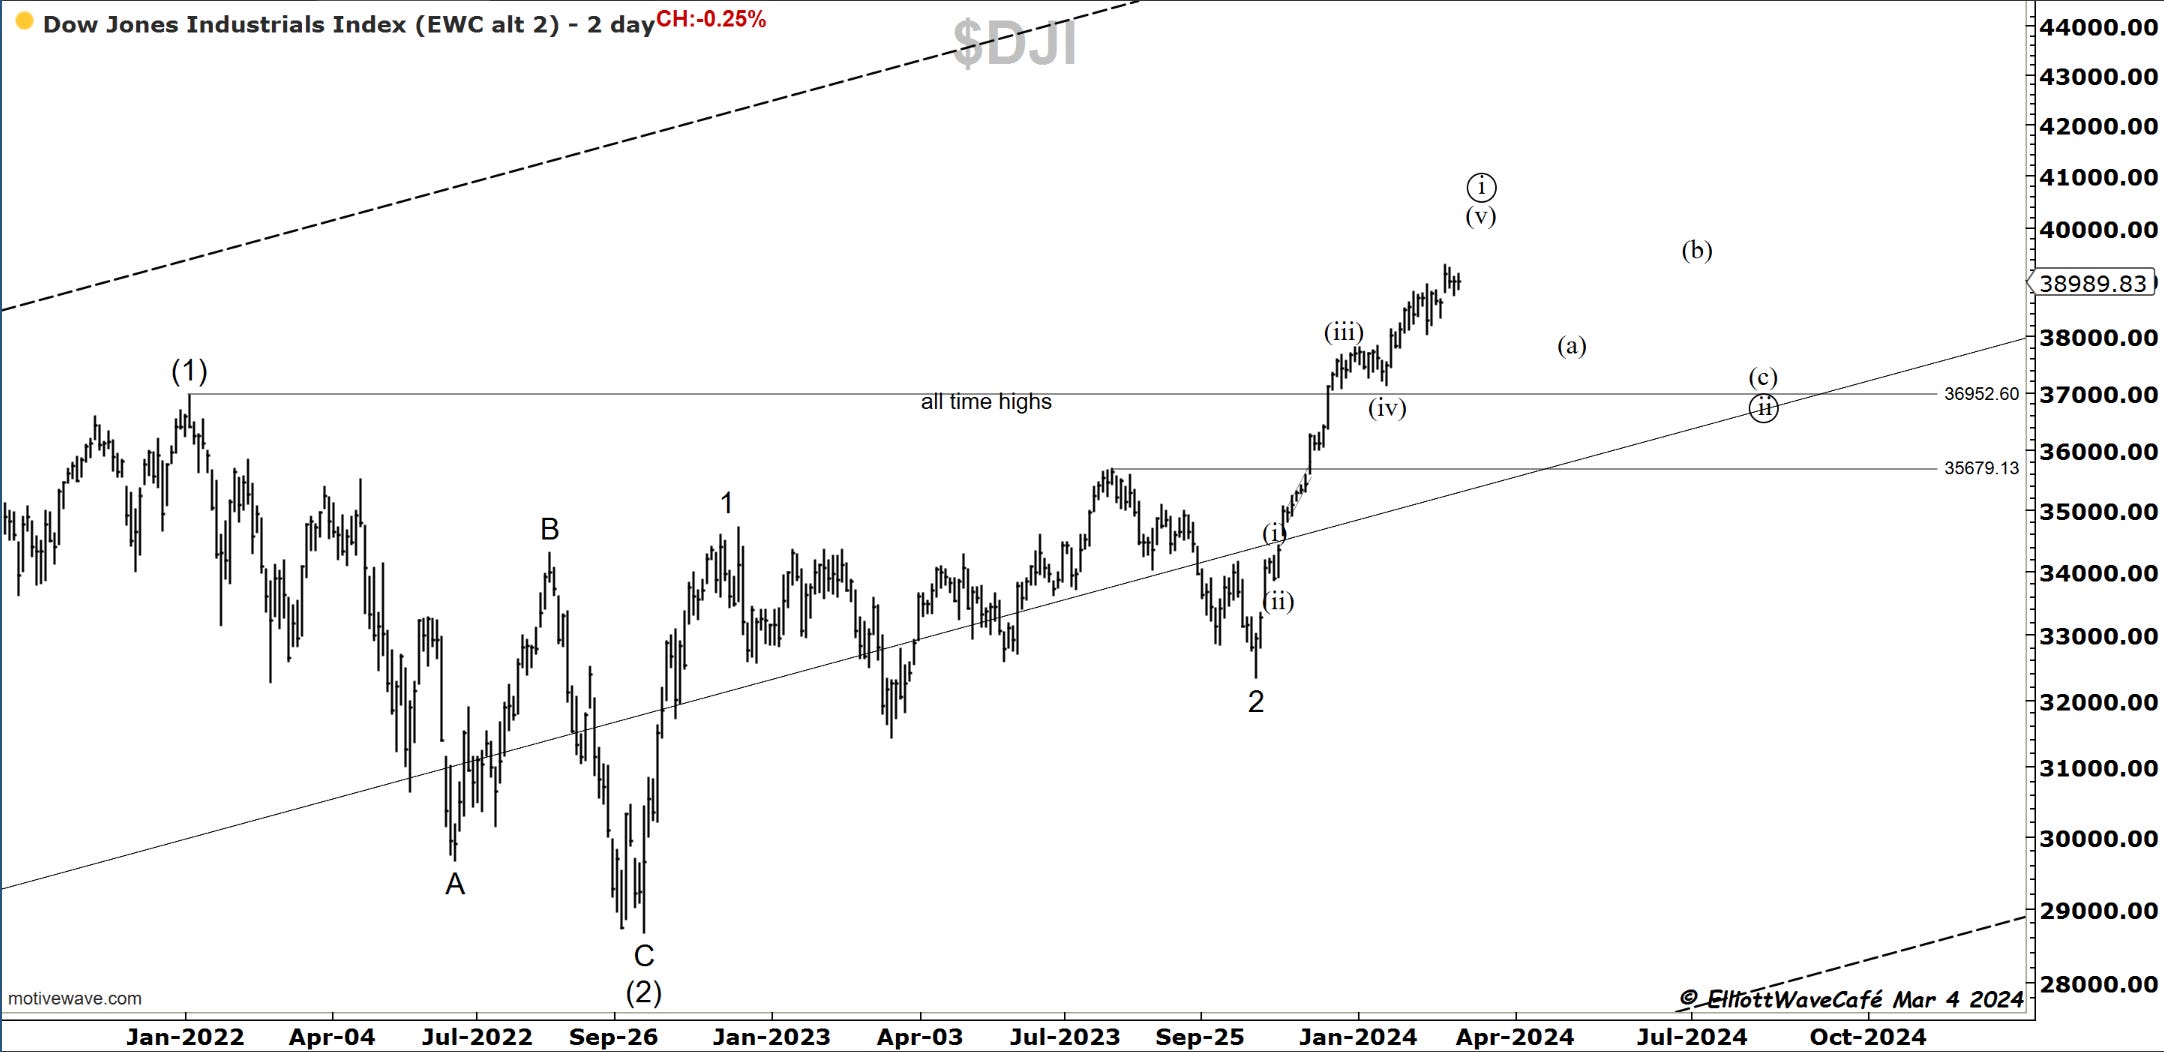
The 145day and 85day active cyles point to some weakness ahead. Price has yet to respond.
US Dollar and Yields
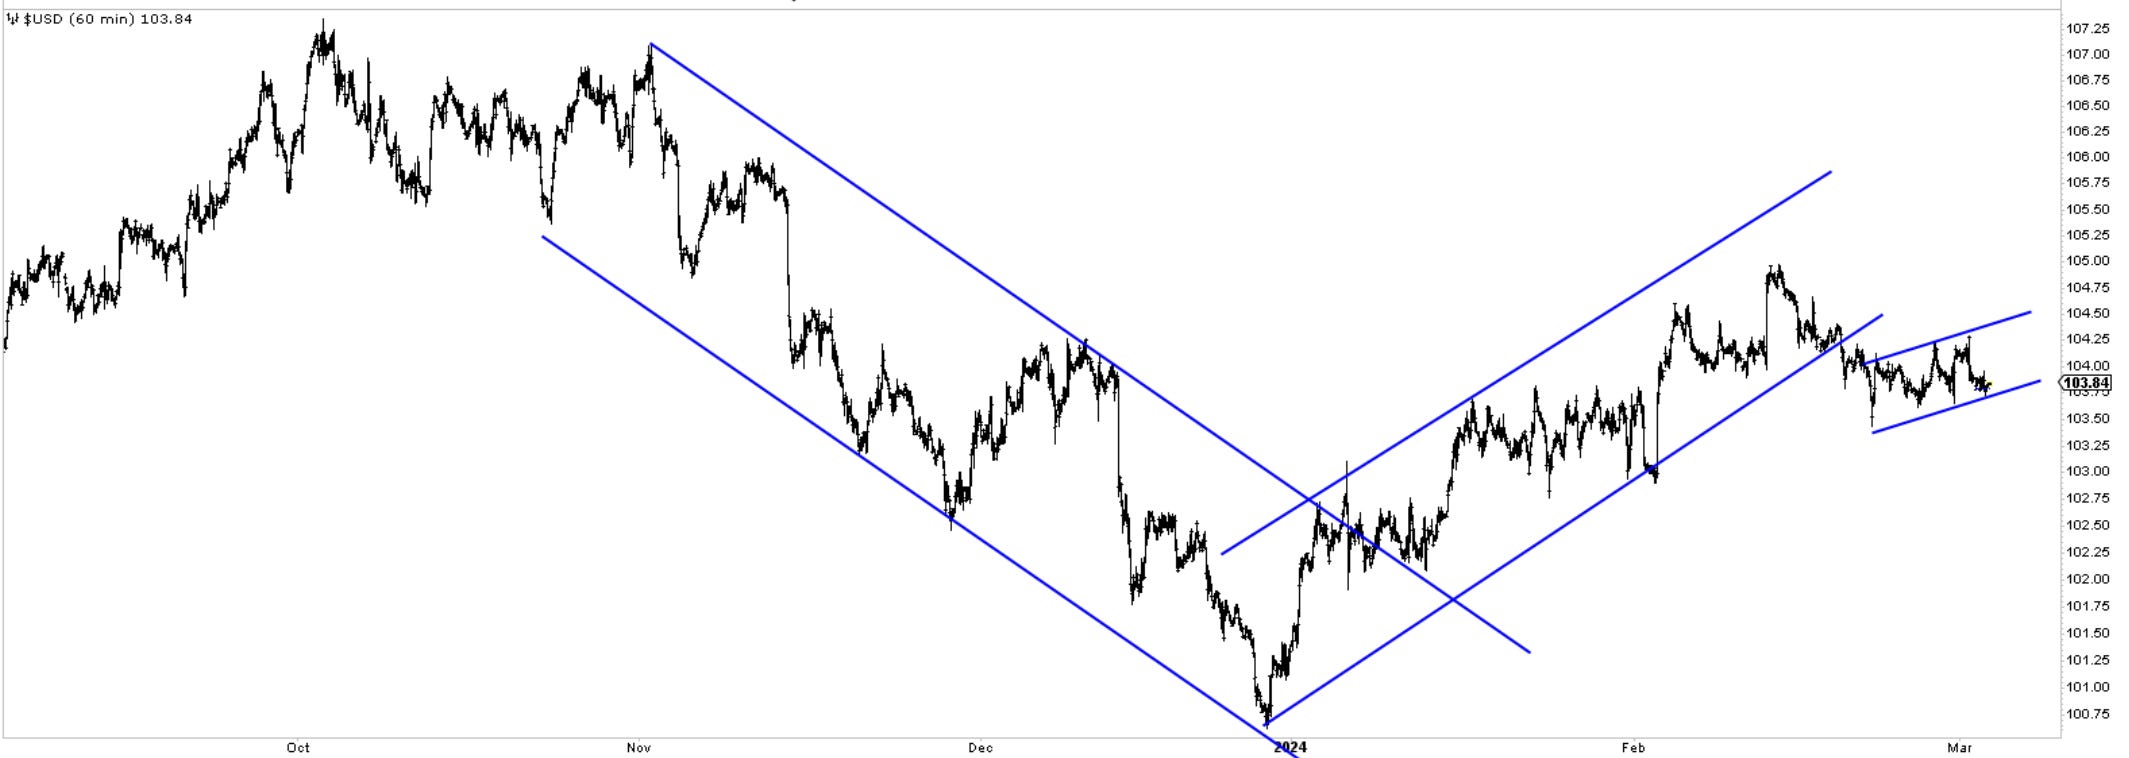
All I can offer on the Dollar at the moment is a technical picture based on channeling. The uptrend was violated, and we are now in what looks to be a small bearish flag. If we lose 103.50, the targets are 102.70.
Gold
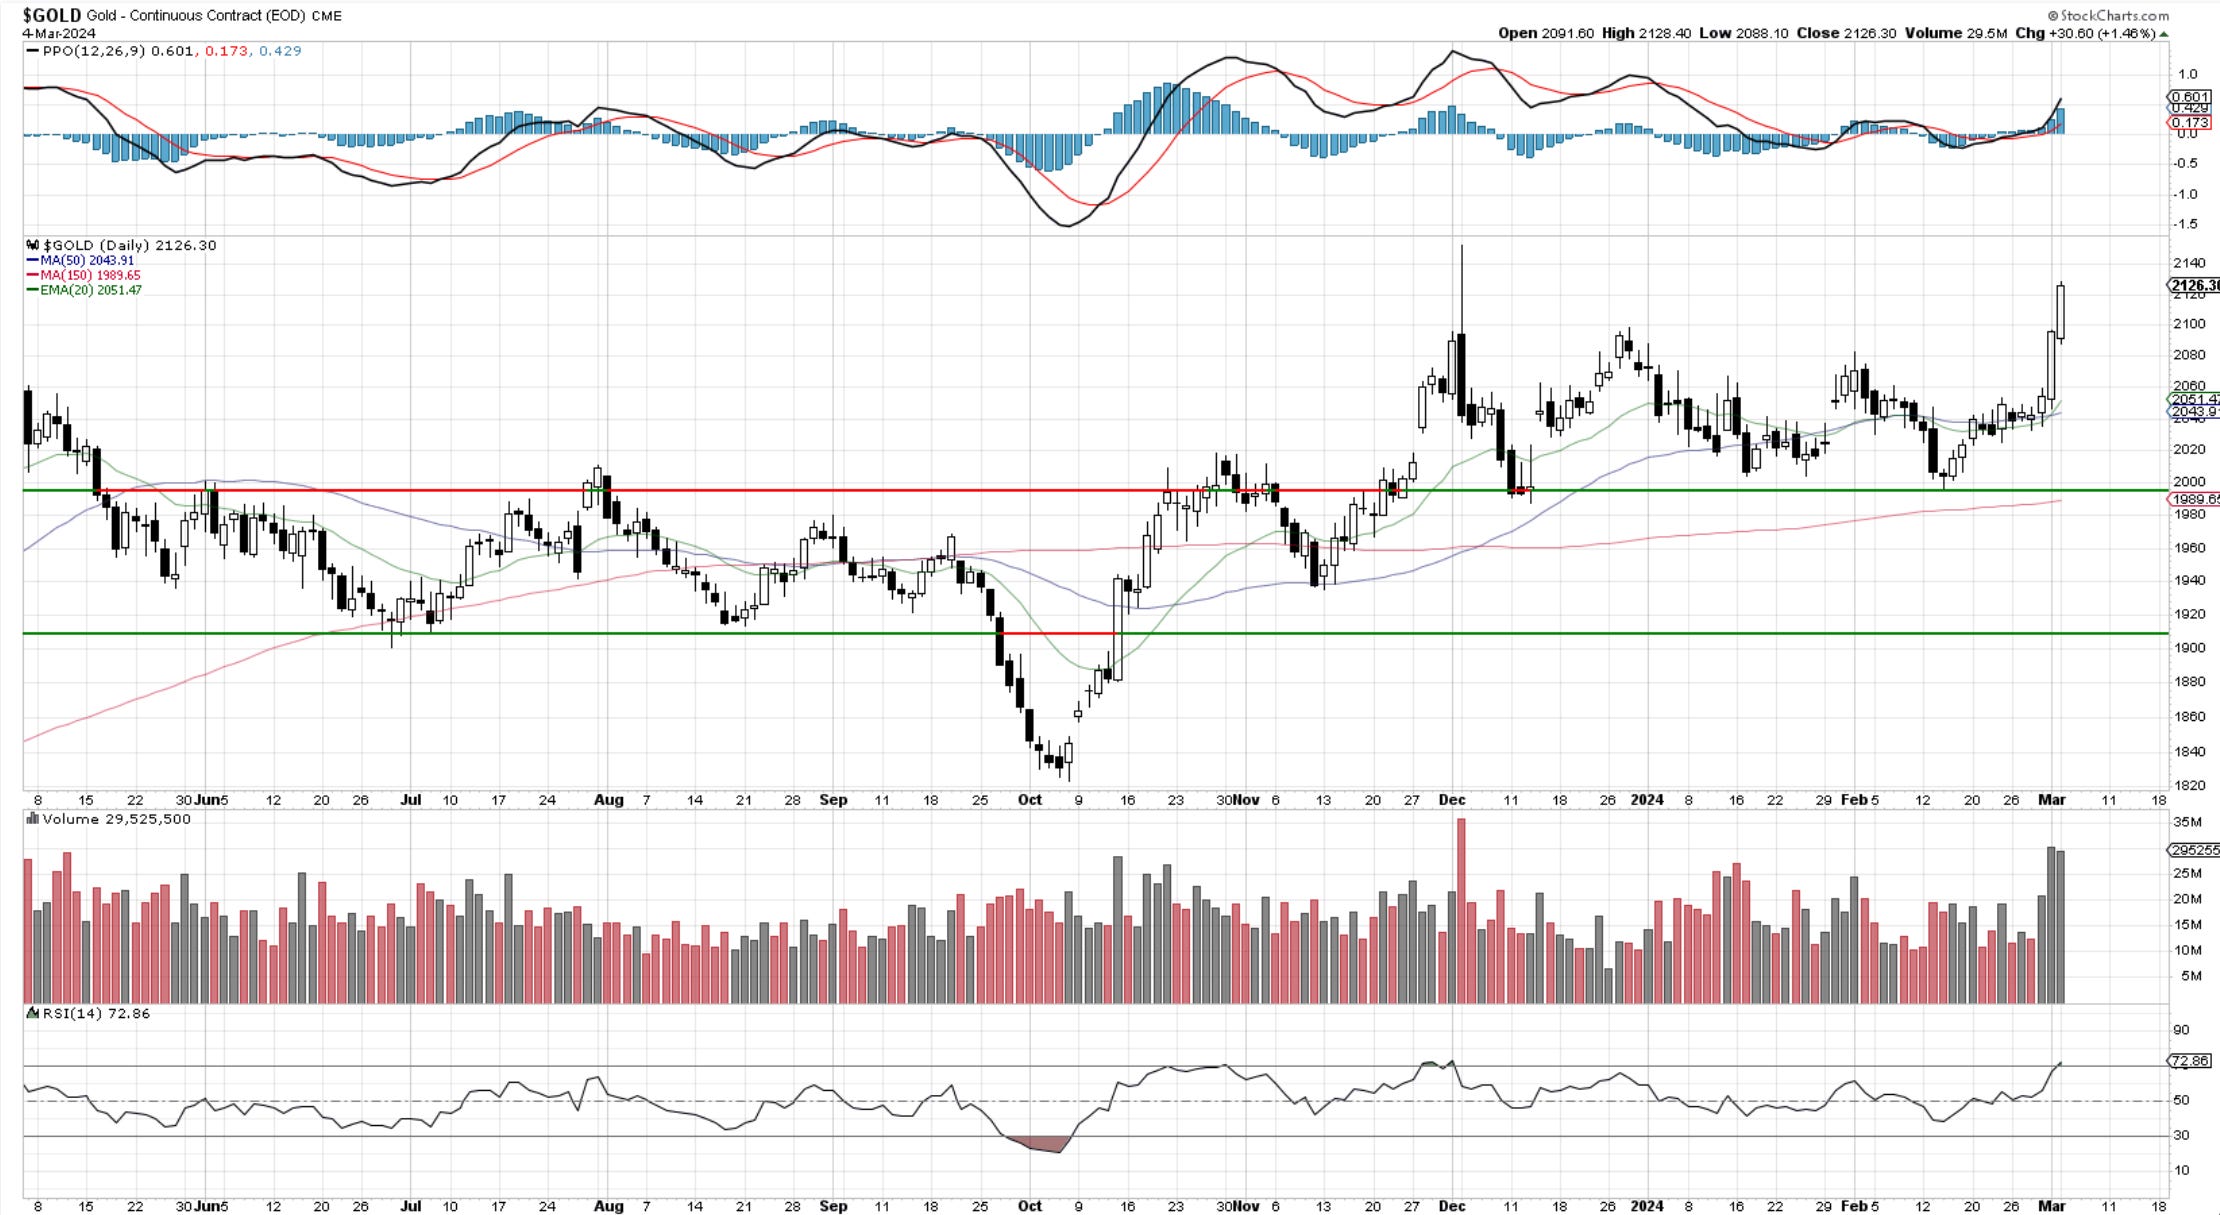
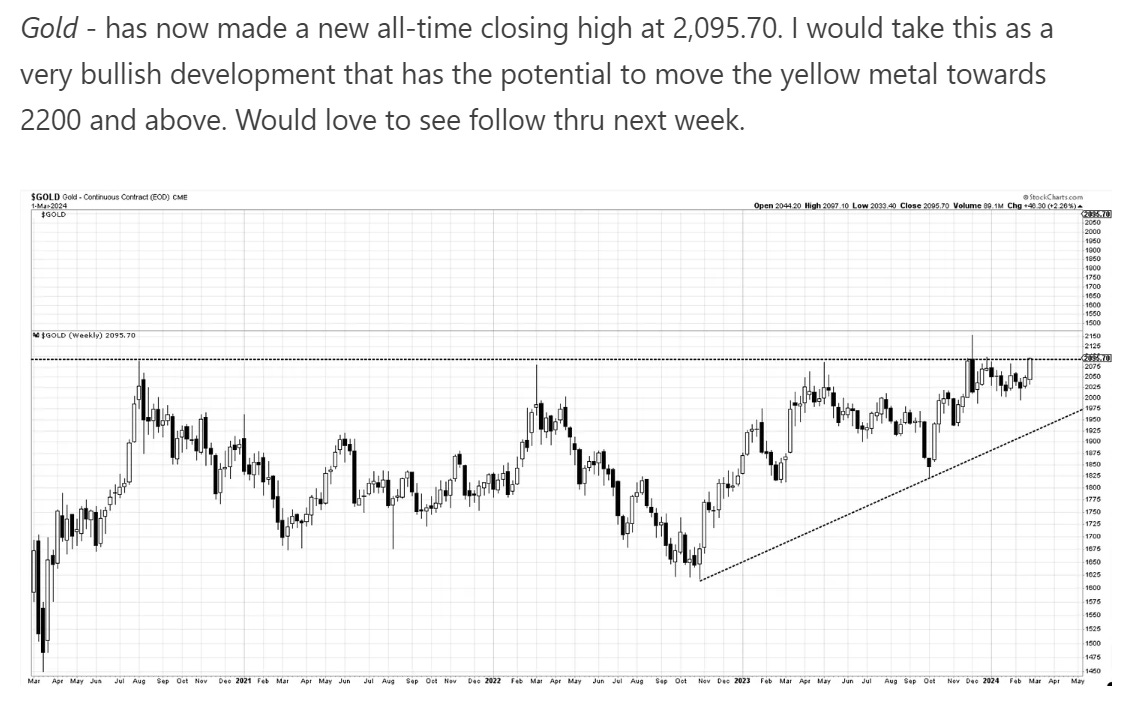
The breakout in Gold has arrived. The volume confirms it and we have now the highest daily closes ever. This is in addition to the weekly closes mentioned in Saturday’s report. Gold has disappointed before but one must consider this a good signal and look for further upside. As always, risk management is key. Consider a break back below 2050 as enough of a reason to revisit the bullish outlook.
Here is Saturday’s note.
Here is the count that would have us beginning a large third-wave upside rally towards 2500.
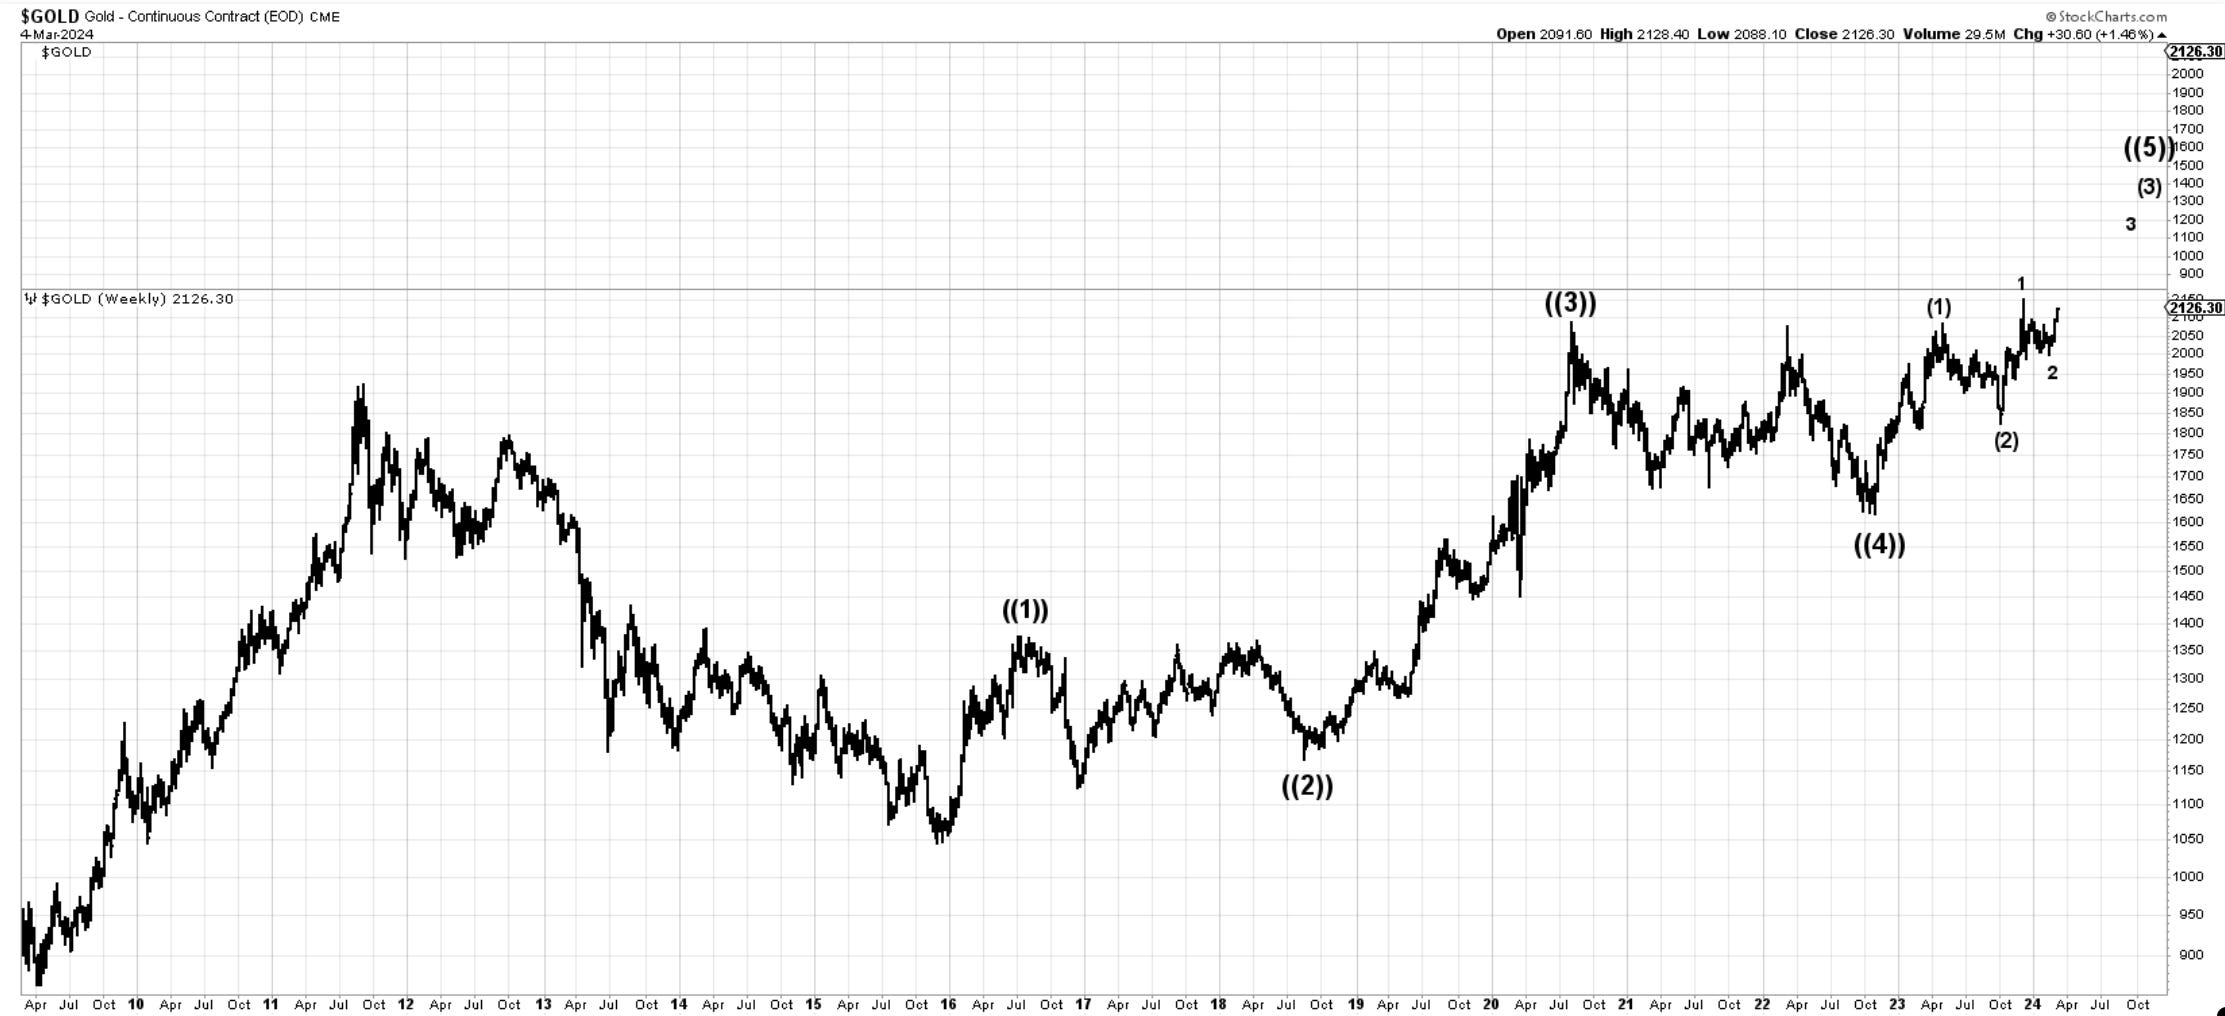
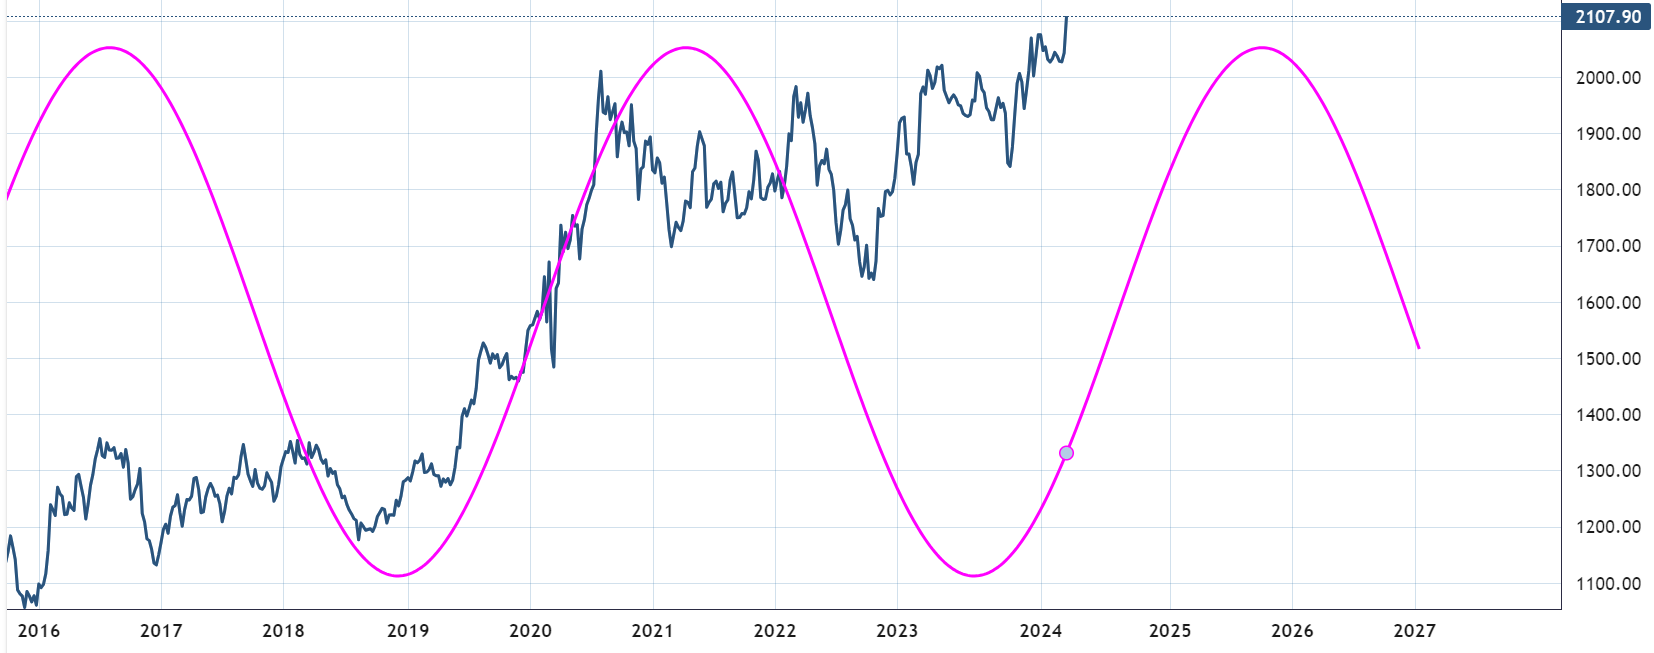
Active 245 Weekly cycles show further bullish trend in gold until fall of 2025.
Bitcoin
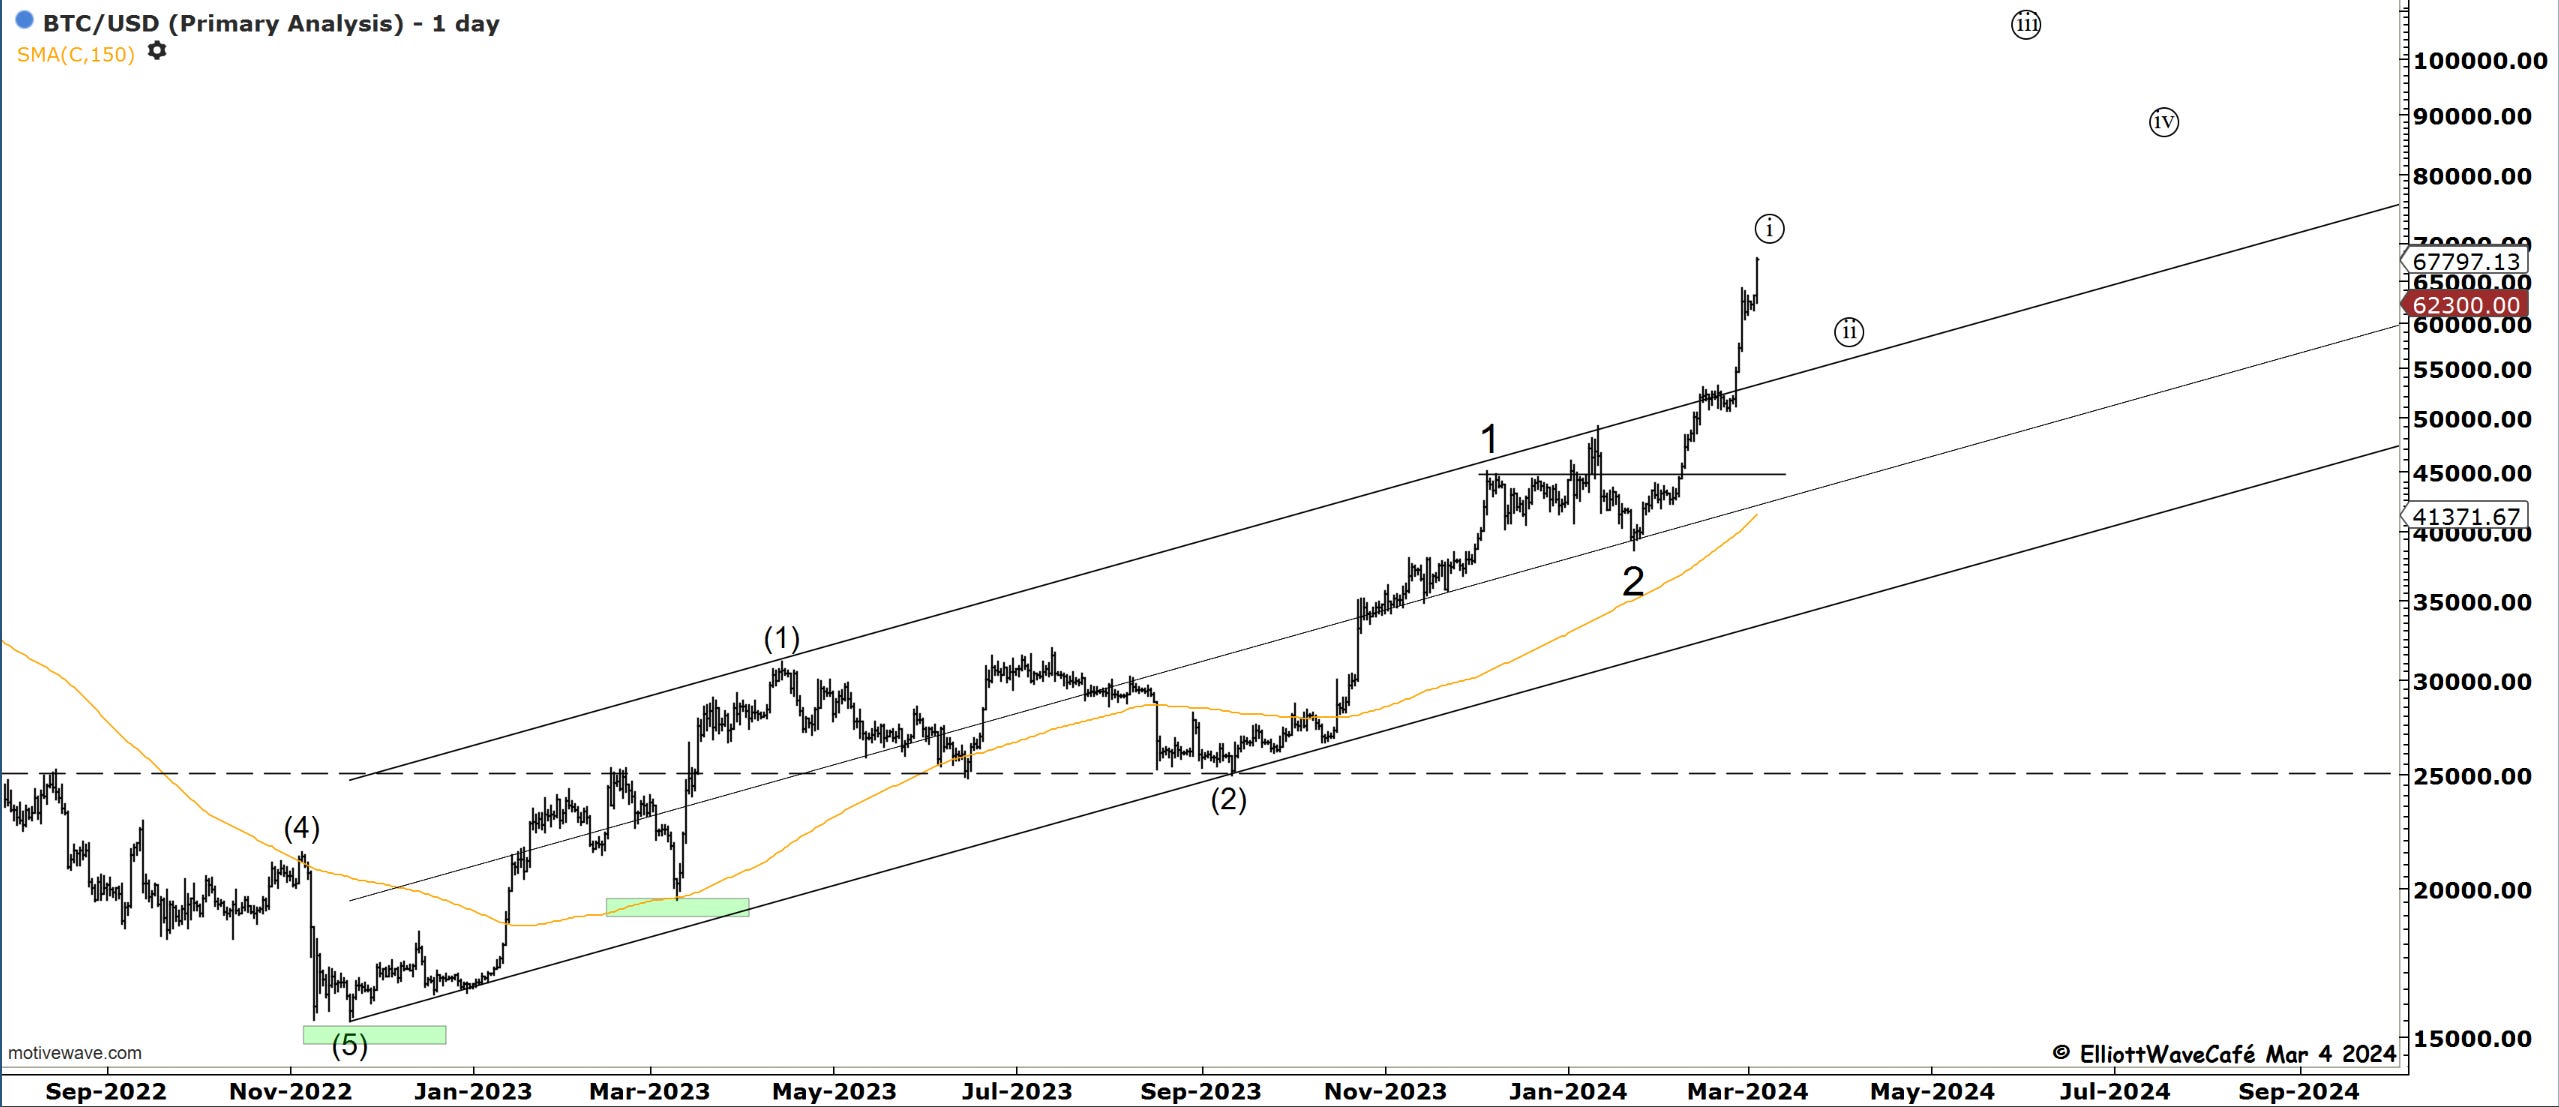
For now, BTC has followed the bullish script presented in prior updates.
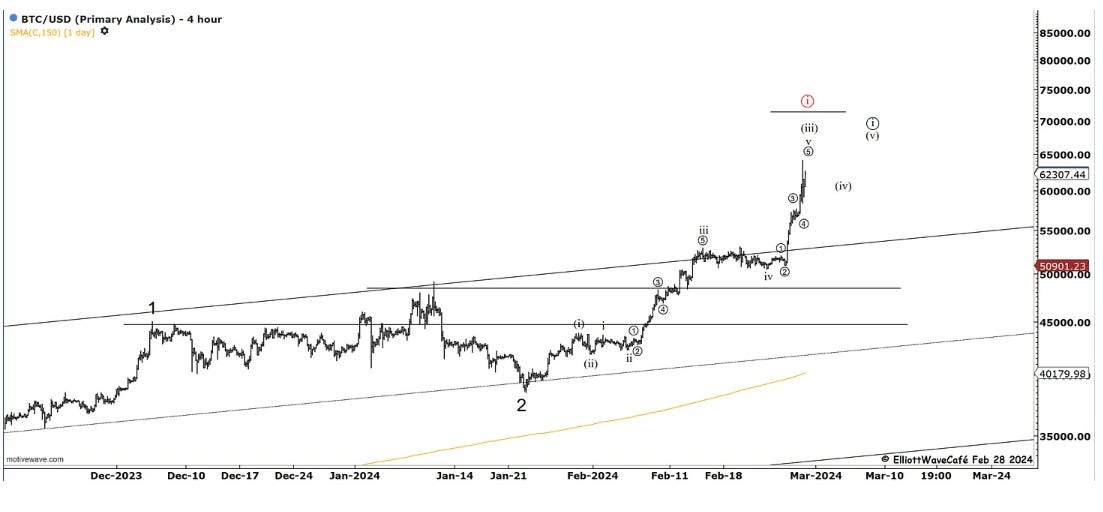
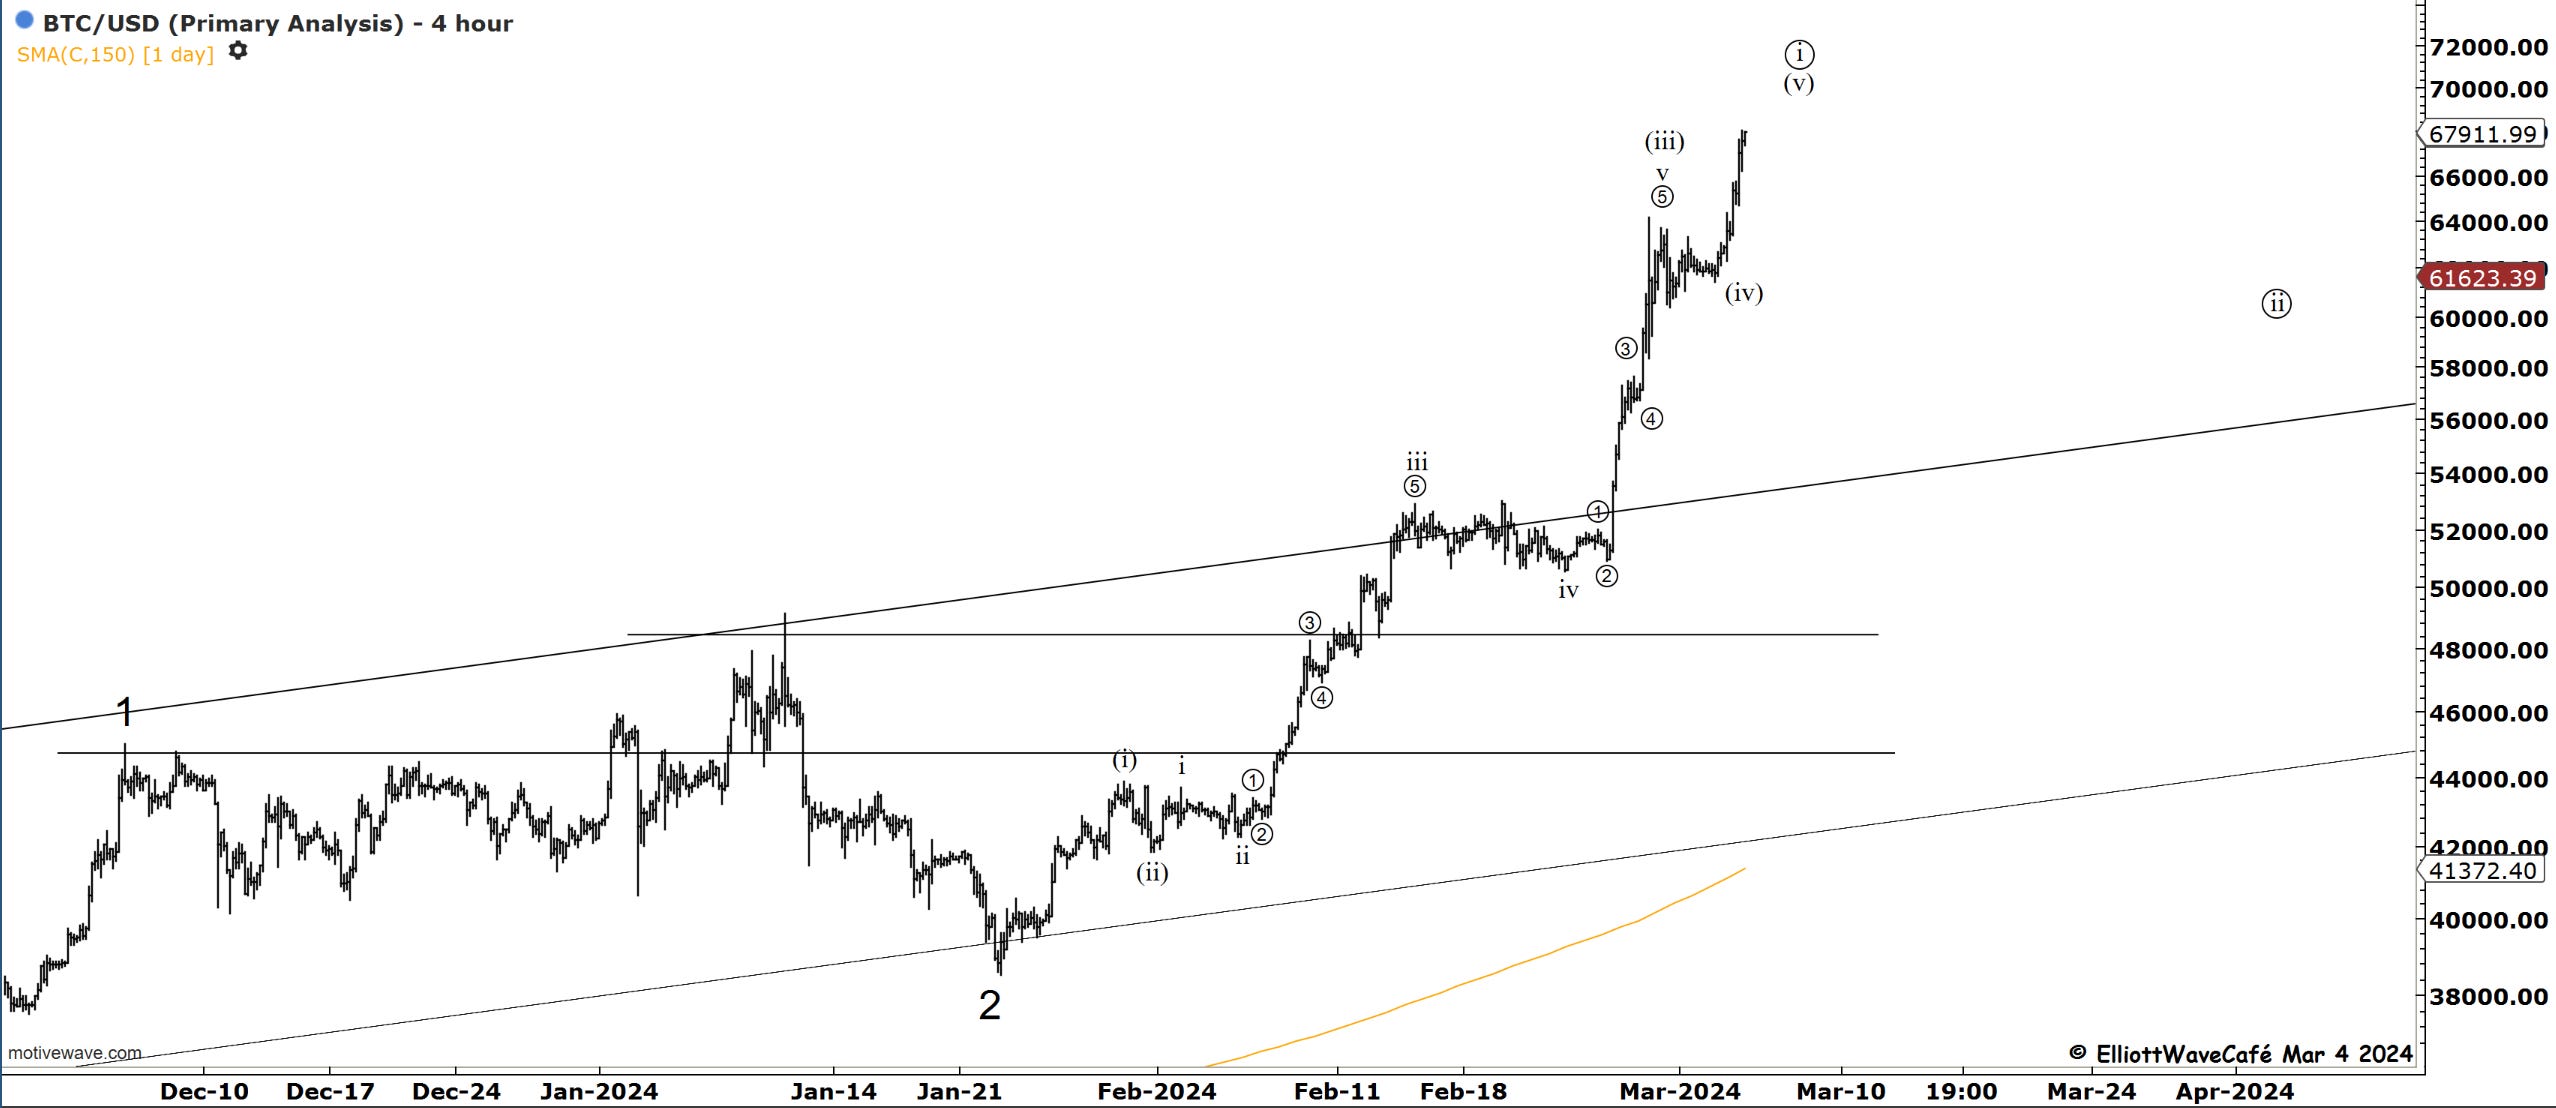
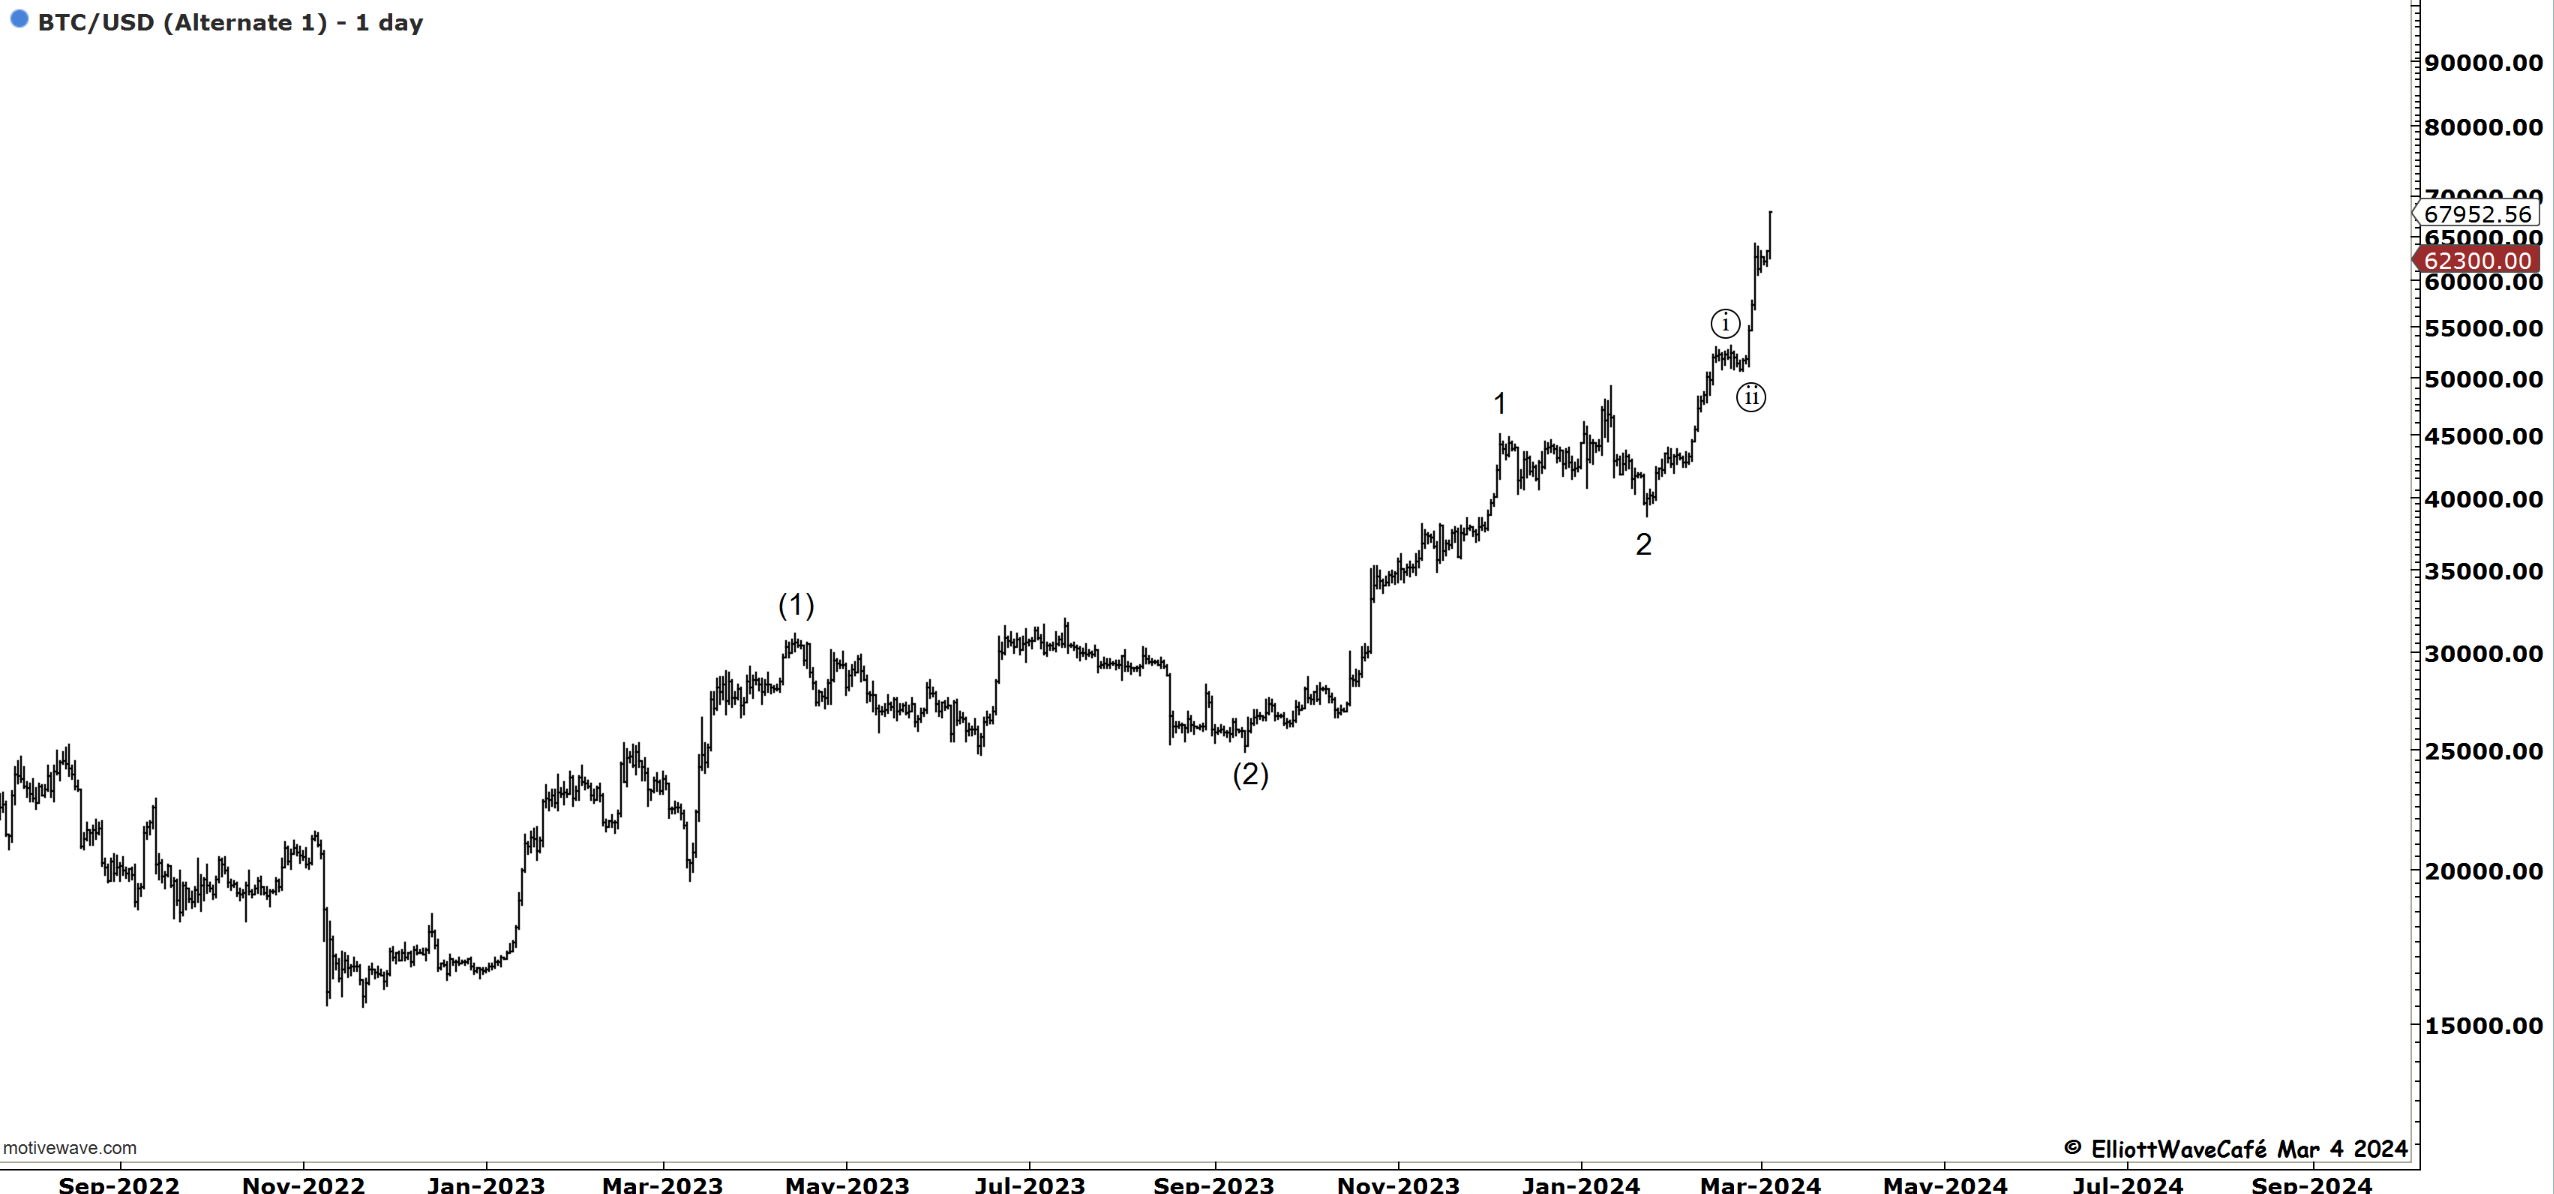
If we had a triangle in wave (iv) , the current spike is part of a wave (v). The market is hungry to reach ATH after more than 2 years. I would not want to be a hero here and make calls of when this will stop or if it’ll follow the wave ((i)) idea. In strong trends one must respect price and not make early assumptions of tops. The market will signal once it is ready to start correcting. Take a look at the alternate bullish count below.
Break of channel suggests strong 3rd wave type price action. Any channel line retests would be opportunities to re-bid this asset.
Alternate bullish view.
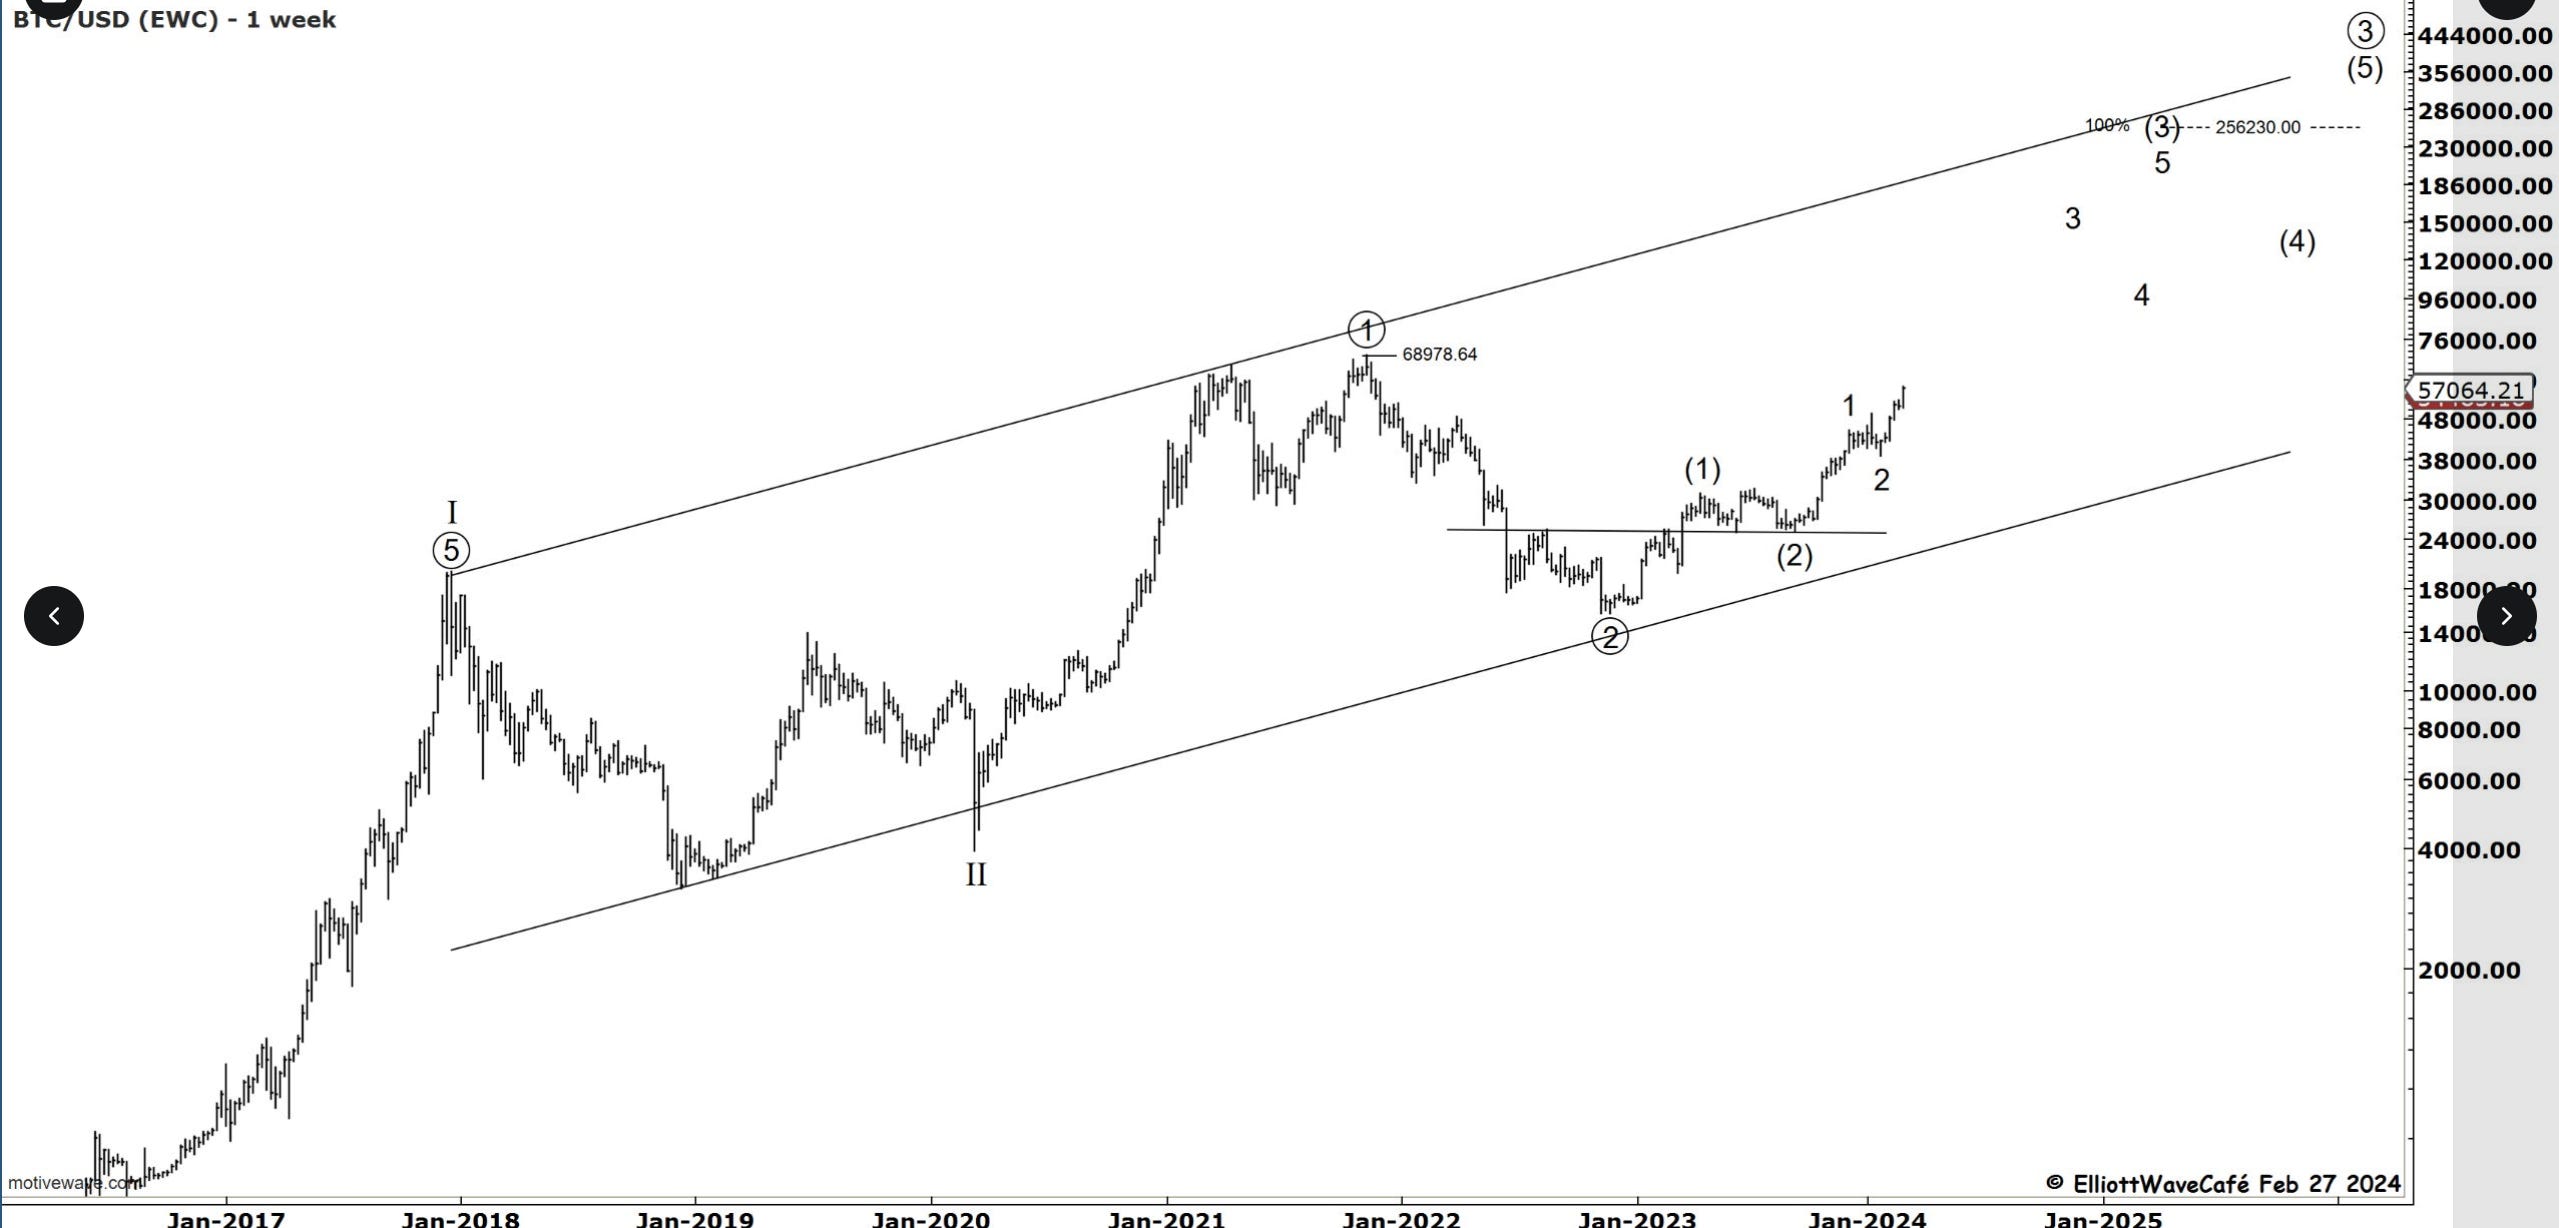
Overall main outlook from prior updates.
If you’re new to Elliott Wave or need to refresh, there is a 7-hour video course with downloadable slides under The Coarse tab on the website. Requires a yearly “Founding Member subscription”.
Cris
email: ewcafe@pm.me