
The Daily Drip
Core markets charts updates and commentary
Note: The counts on the right edge are real-time, and they are prone to adjustments as price action develops. Elliott Wave has a fluid approach, is evidence-based, and requires constant monitoring of certain thresholds.
In the counts below, this (( )) = circle on chart
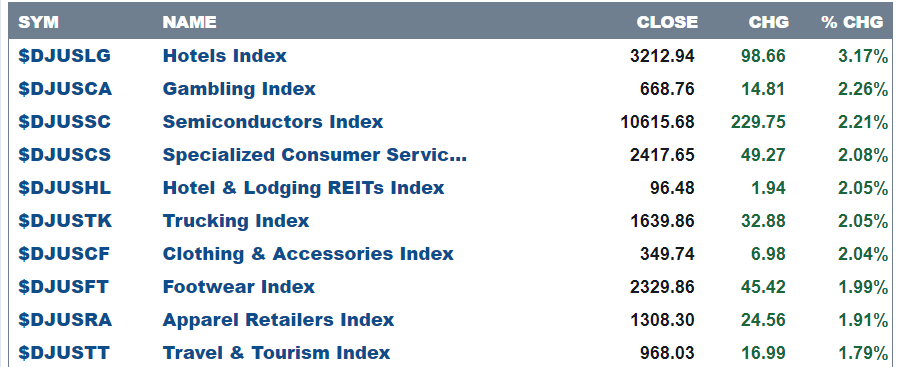
Here are today’s top 10 best performers out of 104 industries.
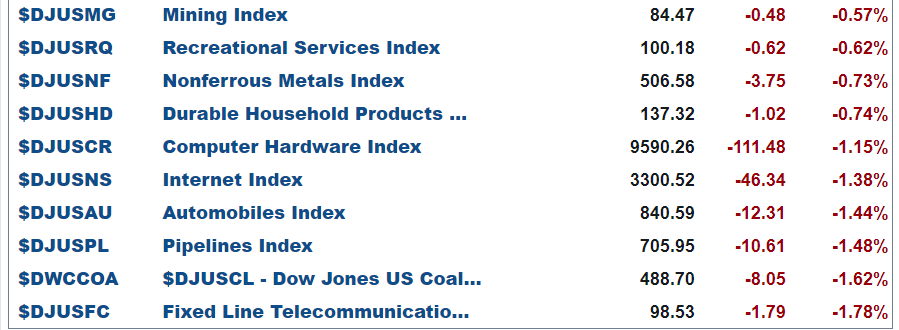
and bottom 10 …
SP500
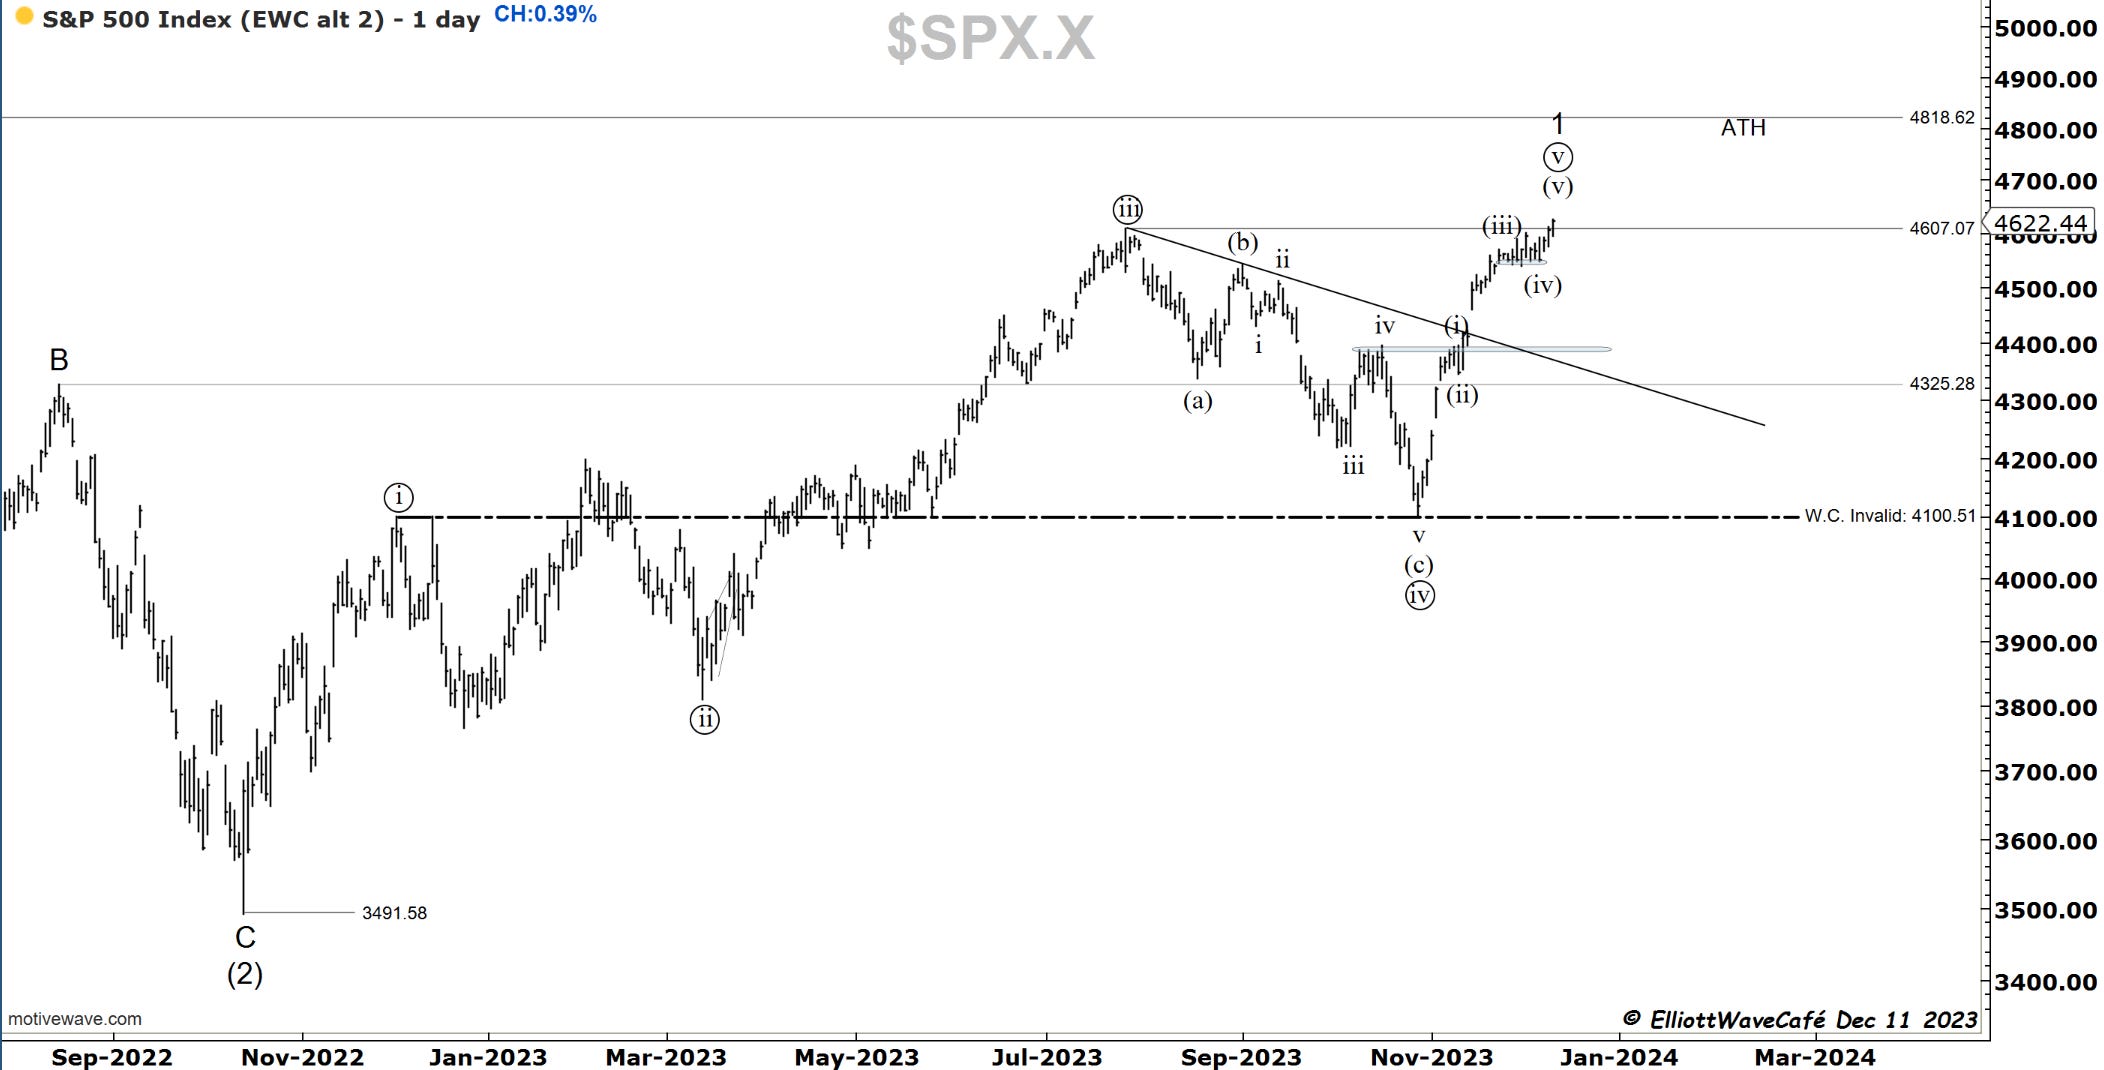
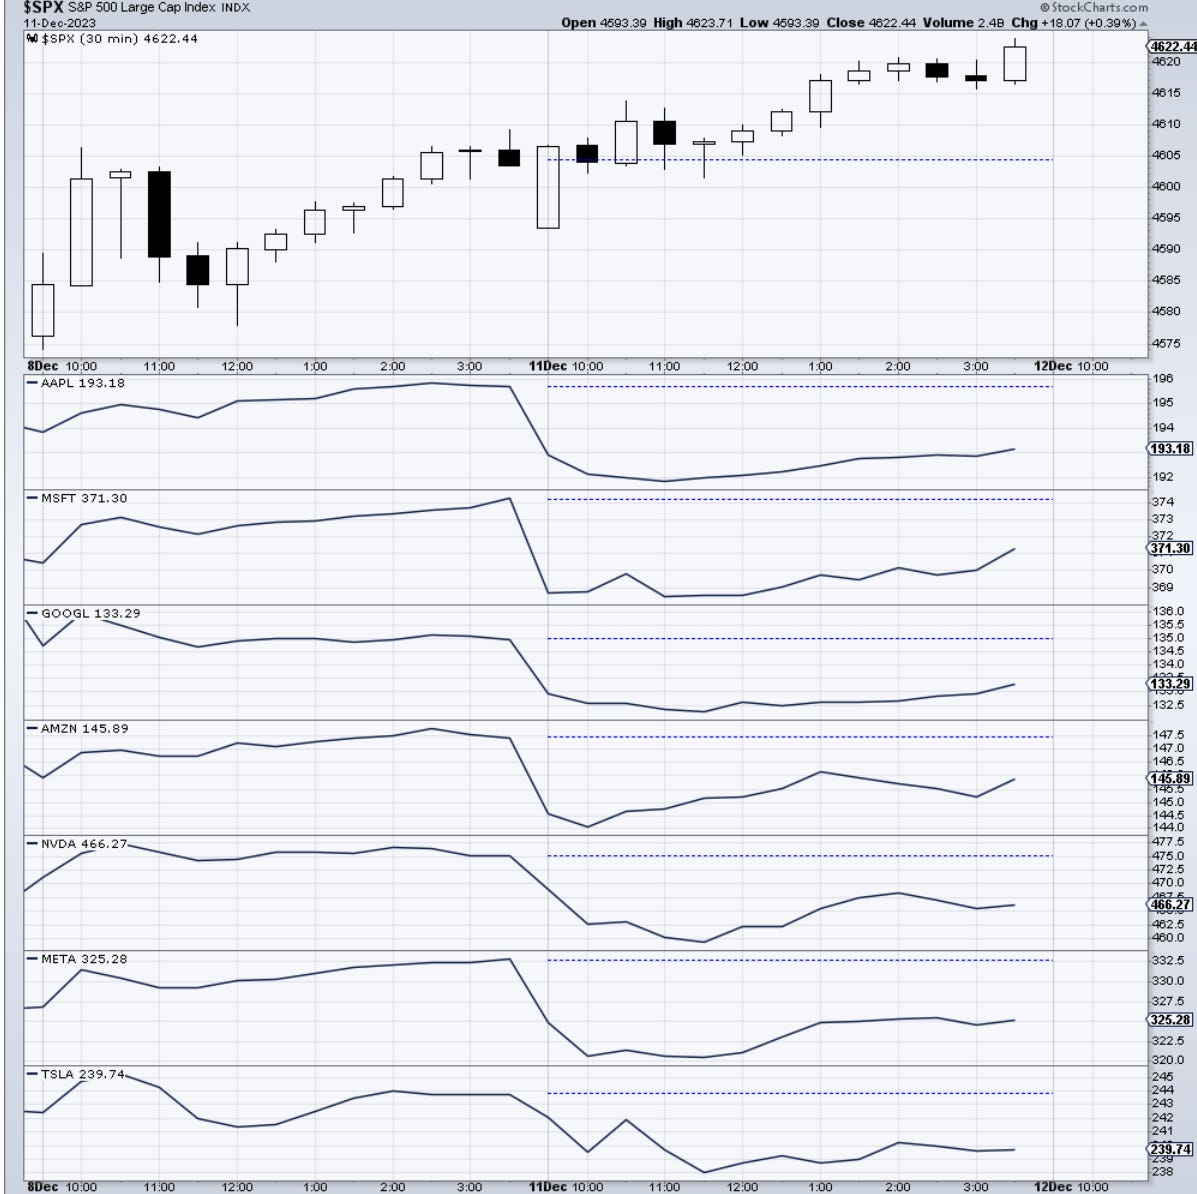
The index climbed above 4607 today after roughly a two-week consolidation period. The very short nature of pullbacks in time and price gives a lot of confidence to a bullish narrative. There were strong moves in some semiconductors stocks and overall in the tech sector but a total lack of participation from the magnificent 7 stocks. There are two camps on this: bulls will argue that those stocks are unnecessary as these markets rotate and pull in a much larger breadth of participation. The bears will say that this is a major divergence and a signal of an unhealthy advance, so it is basically a warning signal. The truth is that the market broke higher and did not correct as per my expectations. On Thursday, I mentioned that any continued move higher would be a 5th wave. Until the current wave (v) becomes larger than (iii) I will keep the current view standing. Getting bullish on the larger market here has elevated risks in my view.
This week has plenty of economic data and a Fed meeting. It could be the perfect catalyst to either break to new ATH or begin correcting the Nov/Dec advance. Price moving below the suggested wave (iv) low would provide an answer to the corrective outlook. Bull or bear here, that’s the cutoff line.
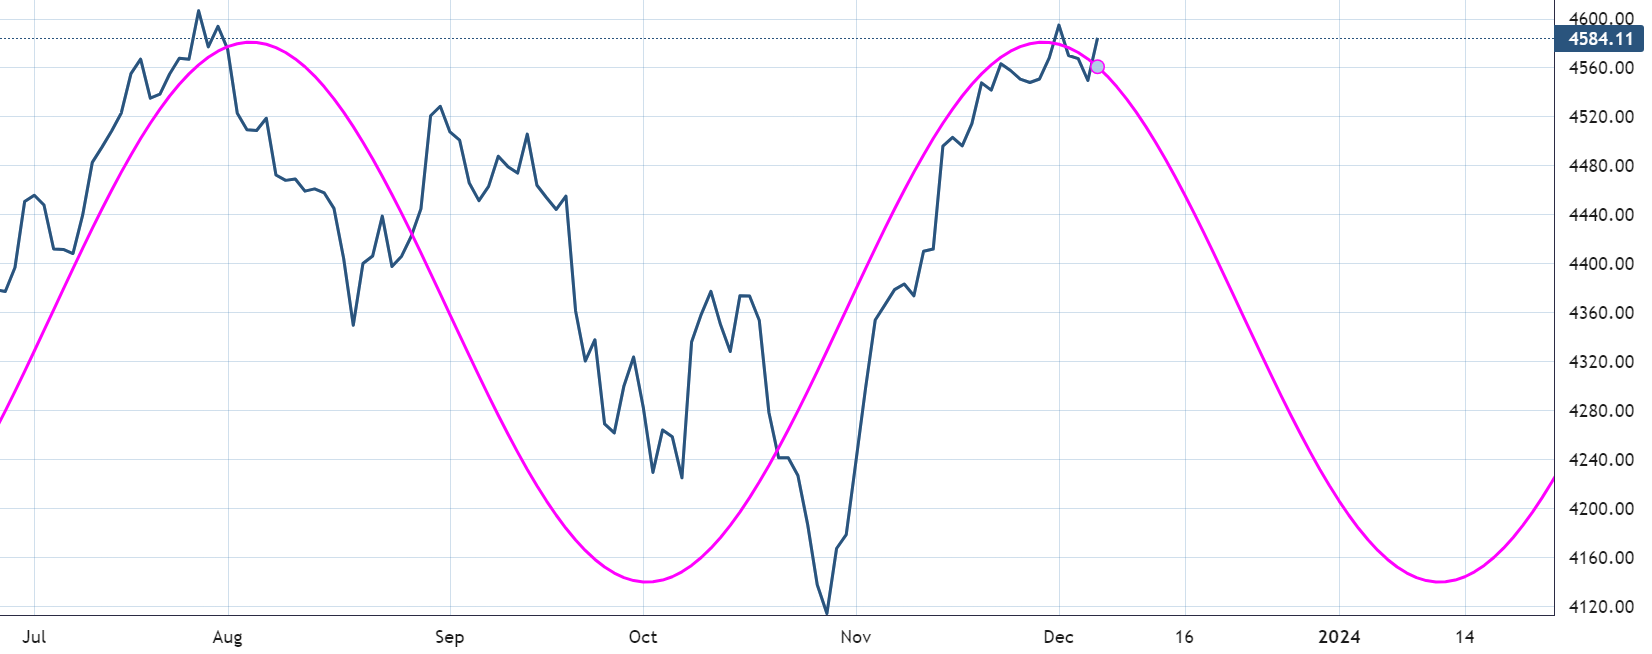
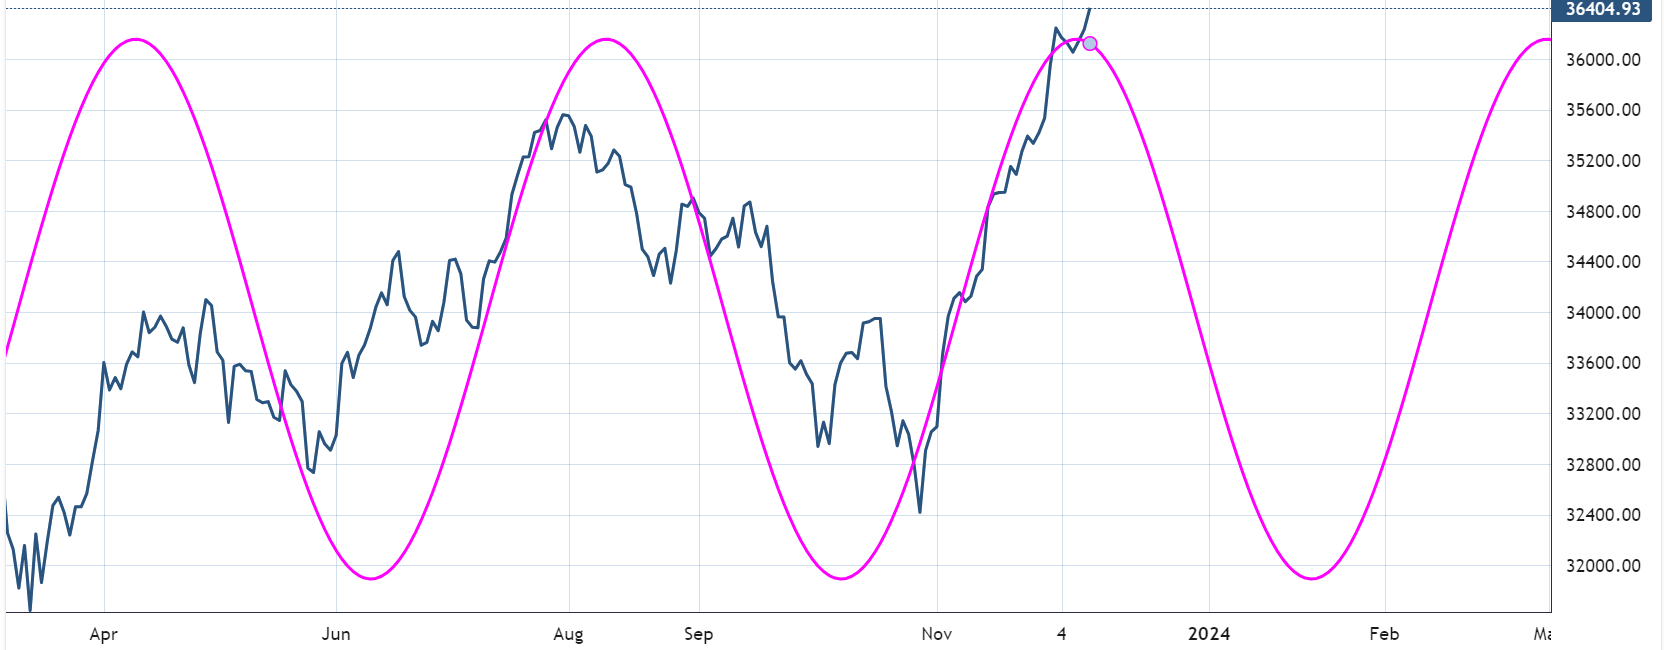
As a reminder, here is the 80-day active cycle in the SP500 for perspective on bullishness.
Nasdaq100
The correction to 15,695 was wave (iv). The current advance is wave (v). There are no signs of a completed pattern yet, but I am on high alert for them appearing this week. The other ultra-bullish option is that wave (iv) was actually a second. That will send this market soaring without much retracement, and I don’t think it’s setting up like that based on my observation of other indicators I follow.
RUSSELL 2000
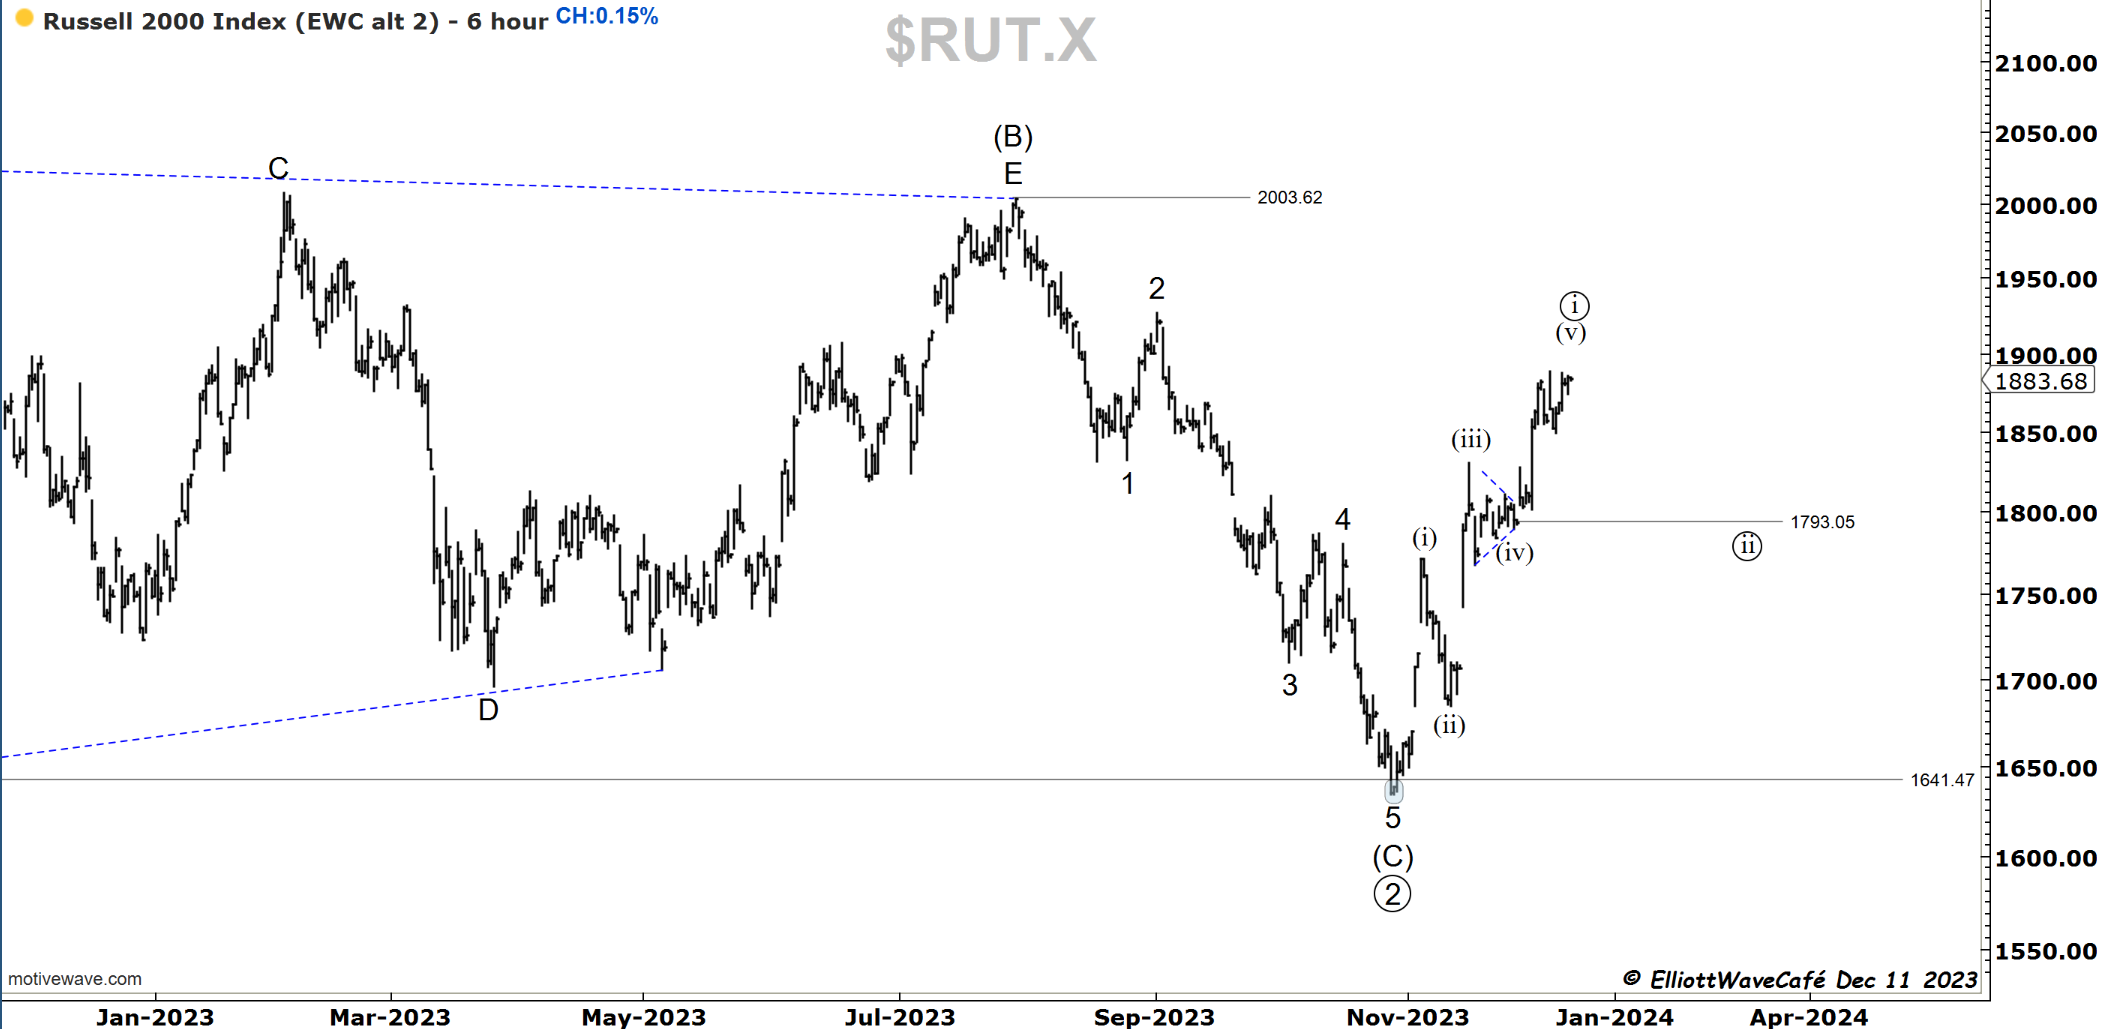
The Russell was a bit calmer today but revisited the highs from last week. I am keeping the current count but notice how the the advancing legs are within close equality of each other. That could be a sign that something else is going on structurally. ( a 1,2 1,2 from the lows without the triangle,or a complex correction). We should know more this week. Once above that (B ) wave high, there should be some clear traveling towards ATH.

Dow30
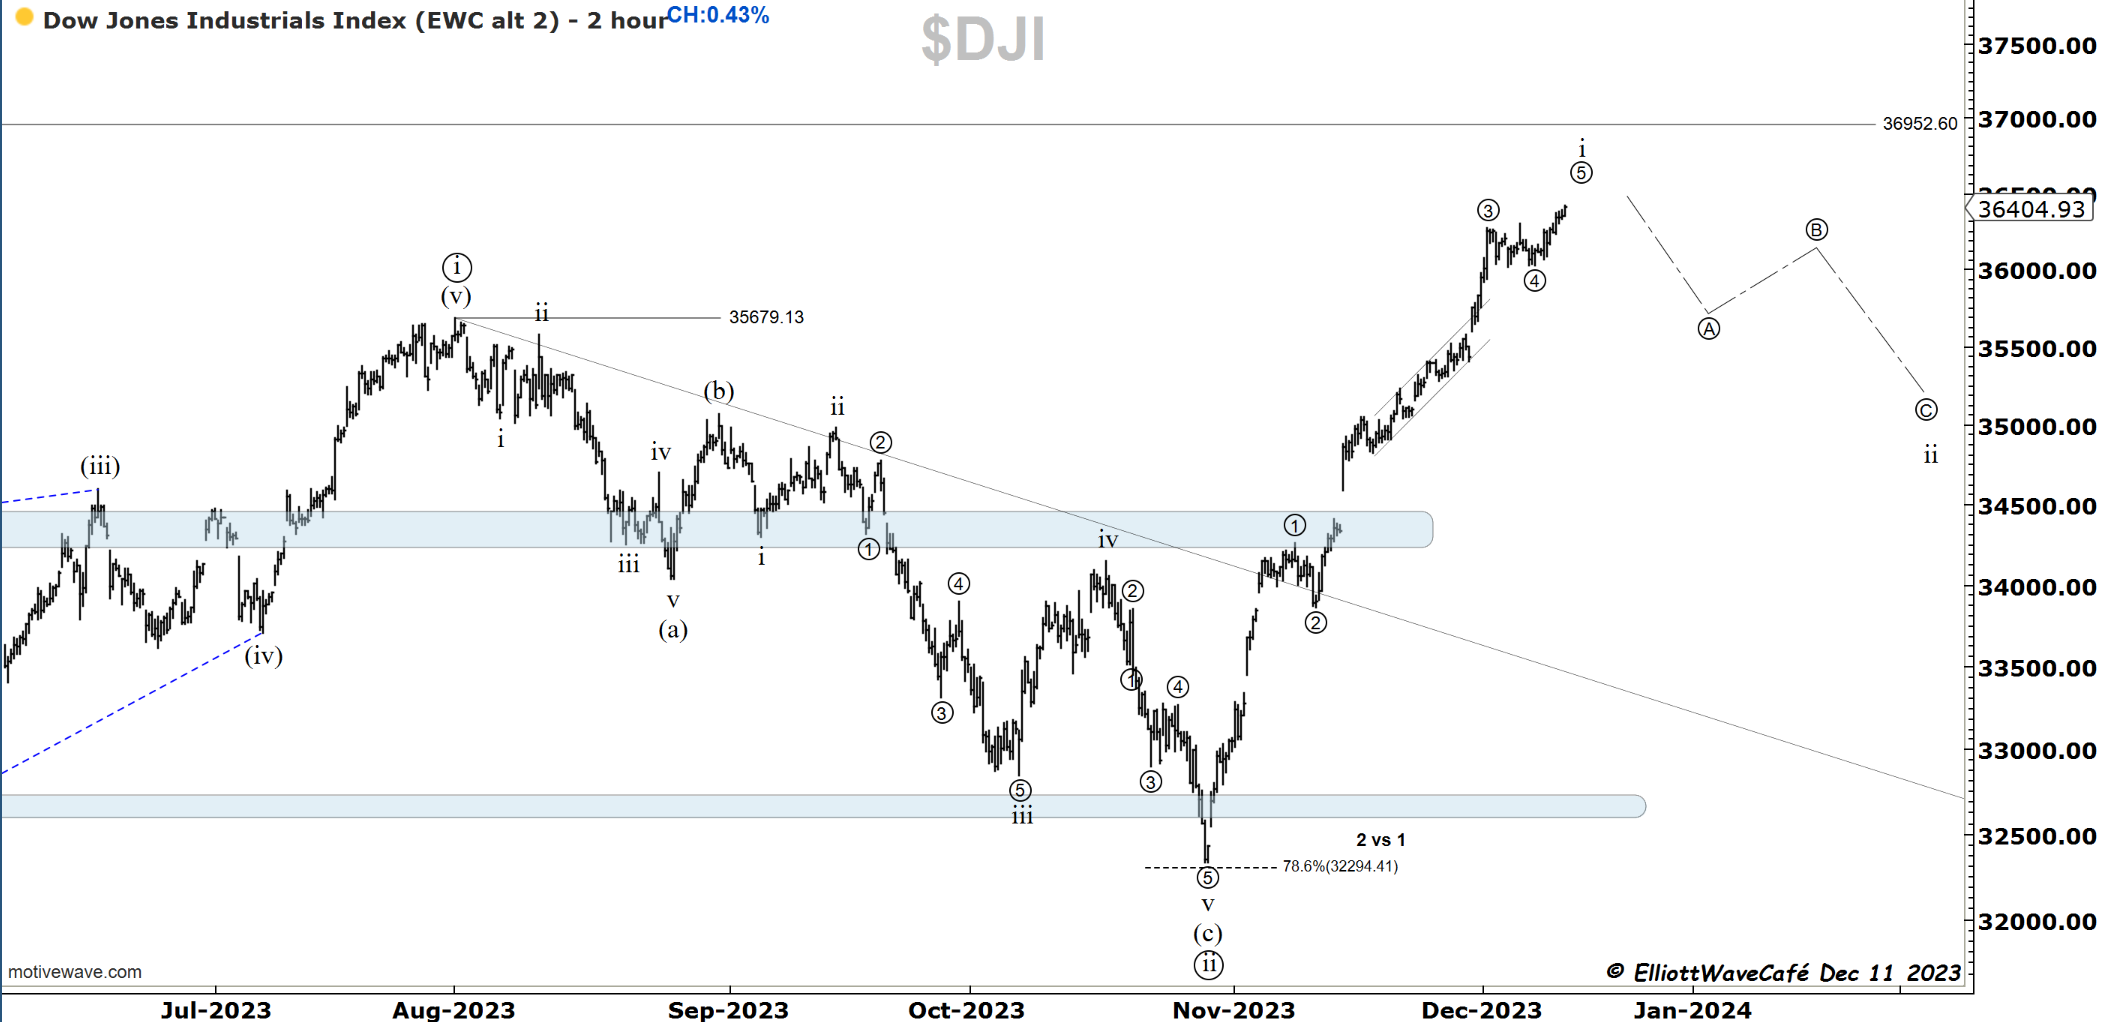
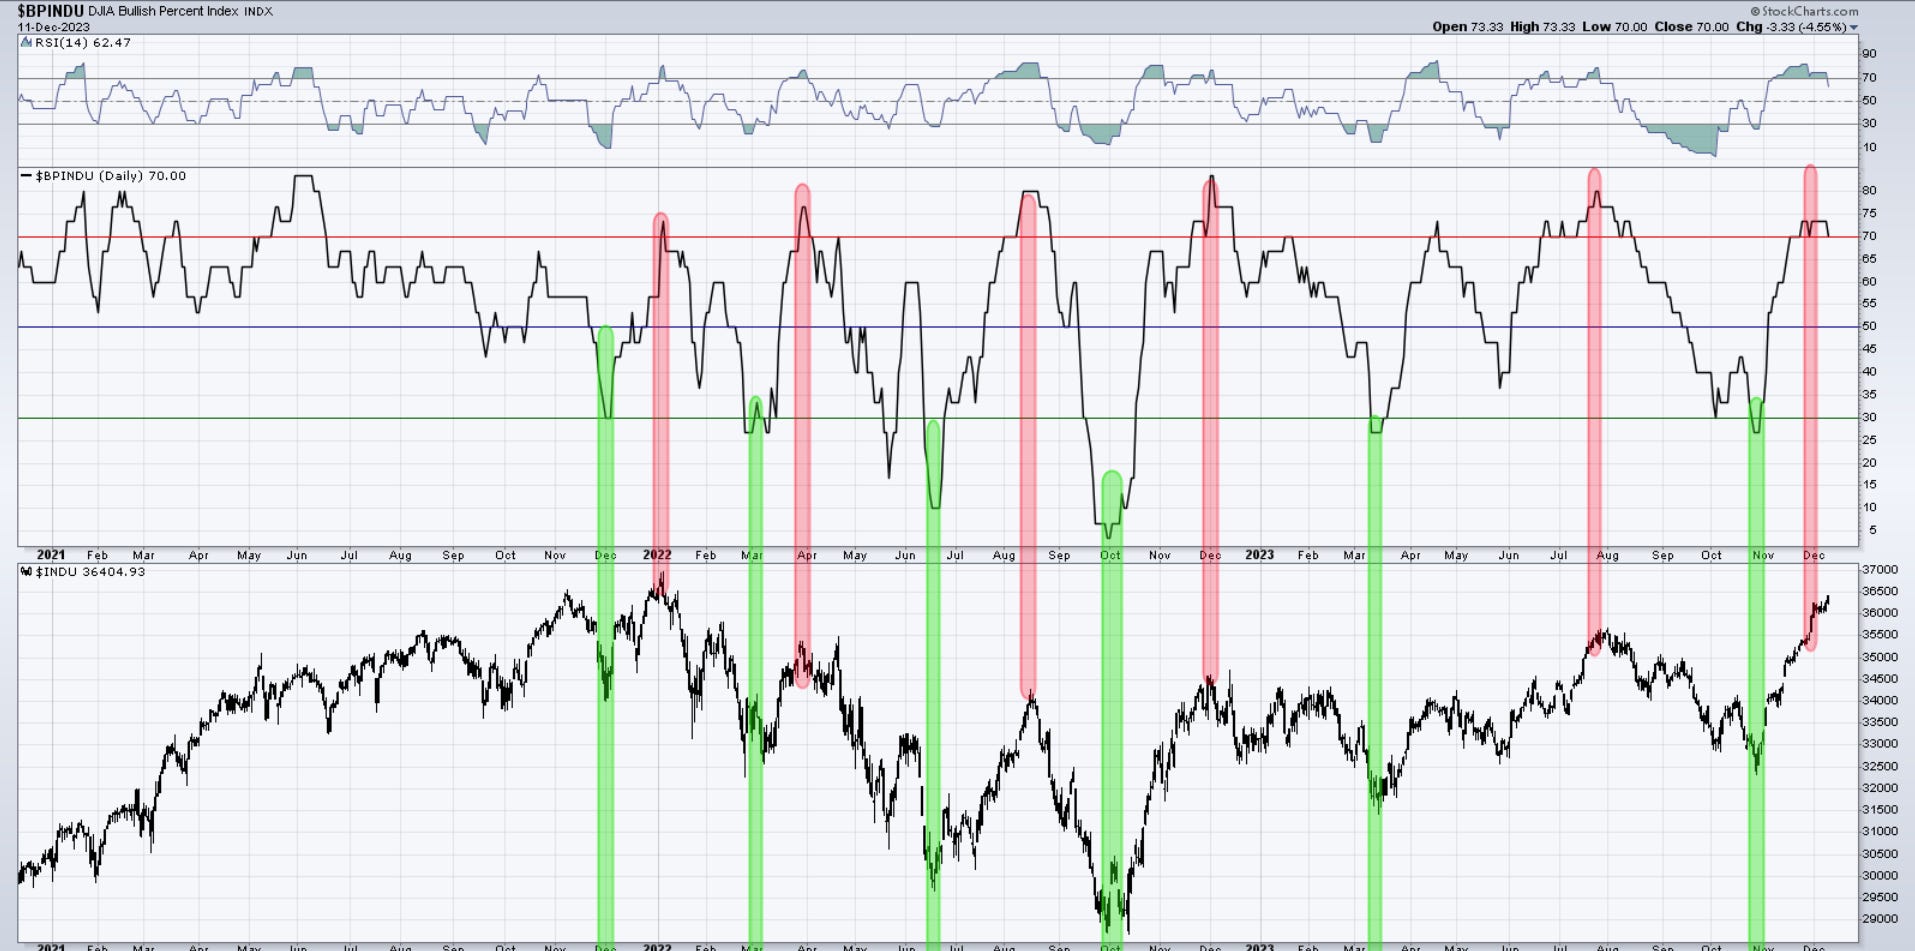
A move higher today extends the duration of wave ((5)) of i. Does it mean that just because we see five waves, we have five waves? My bet is that we’re forming them, yes. However, there is no proof of its completion yet. A break back below wave ((4)) low will be a decent hint. The ATH is within 500 points. The BPI is HOT, and the 80-day cycle is as well. Caution.
US Dollar and Yields
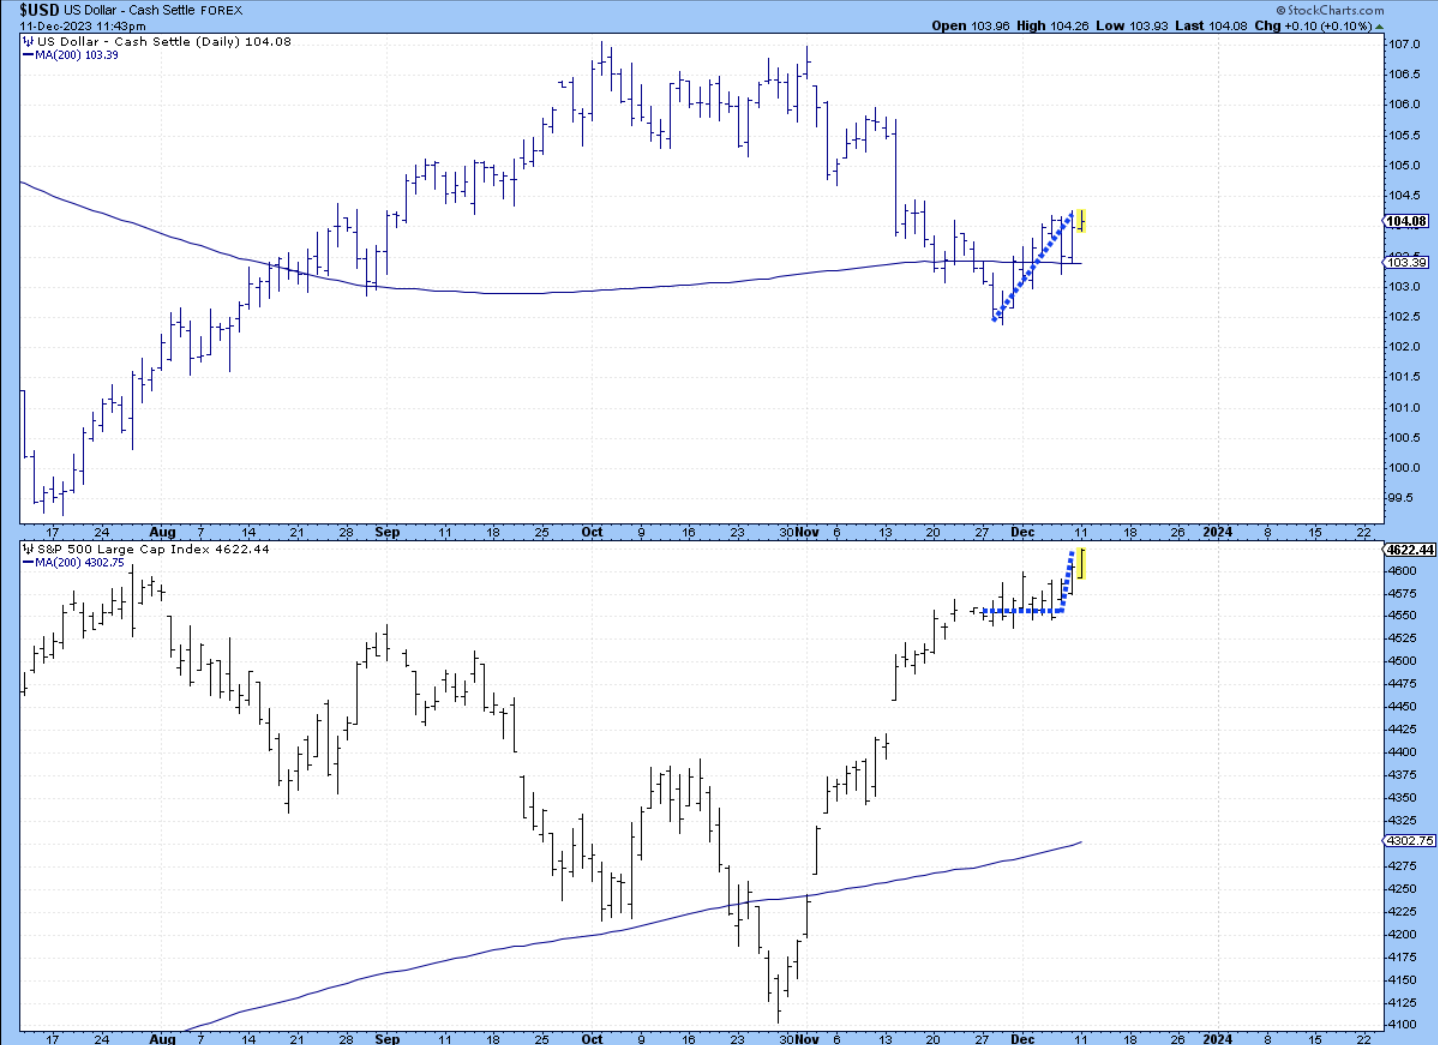
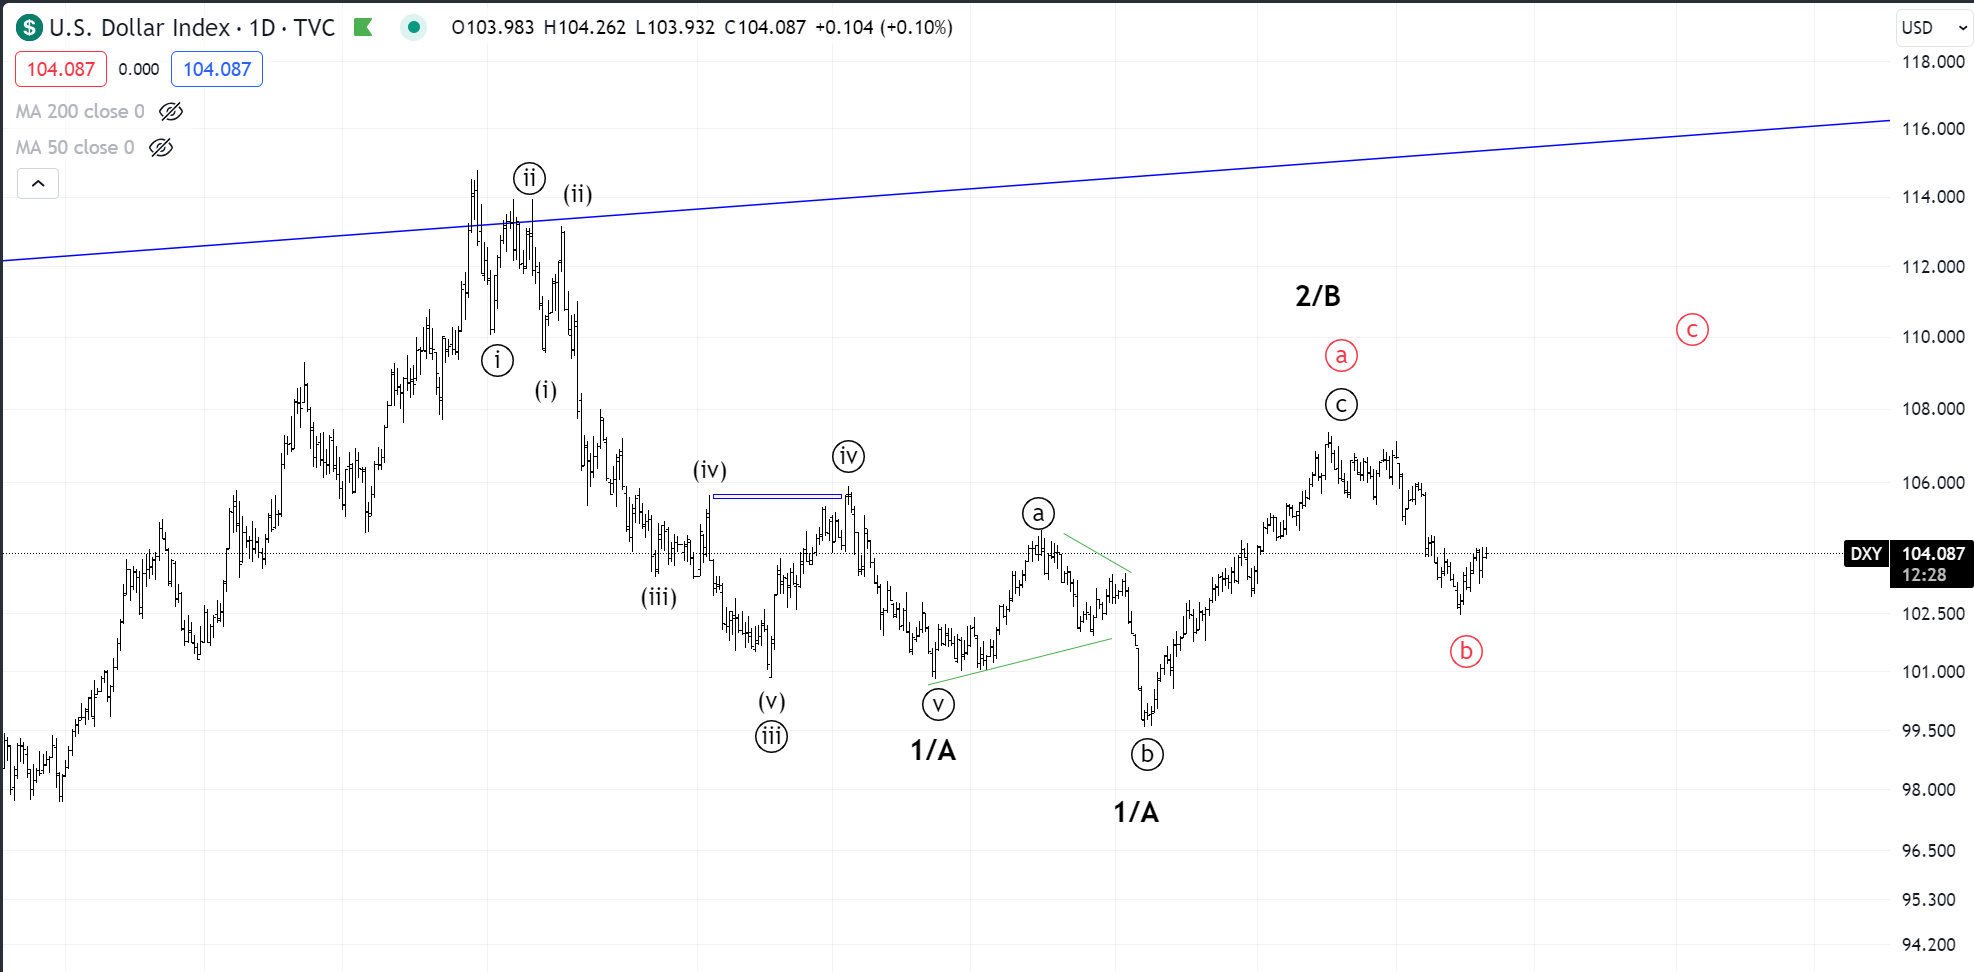
A rising dollar has rarely been beneficial for risk assets. One of my counts suggests this dollar drop was a ((b)) wave of an ongoing wave 2/B. So far, we have bounced from the 102.50 low, but stocks have barely budged. There were a couple of weeks of sideways correction, but nothing more damaging than that. If the market has gotten itself out too far ahead by anticipating a rate-cutting cycle, then the dollar action here seems to be suggesting that. Will see if Fed Powell will temper down those expectations.
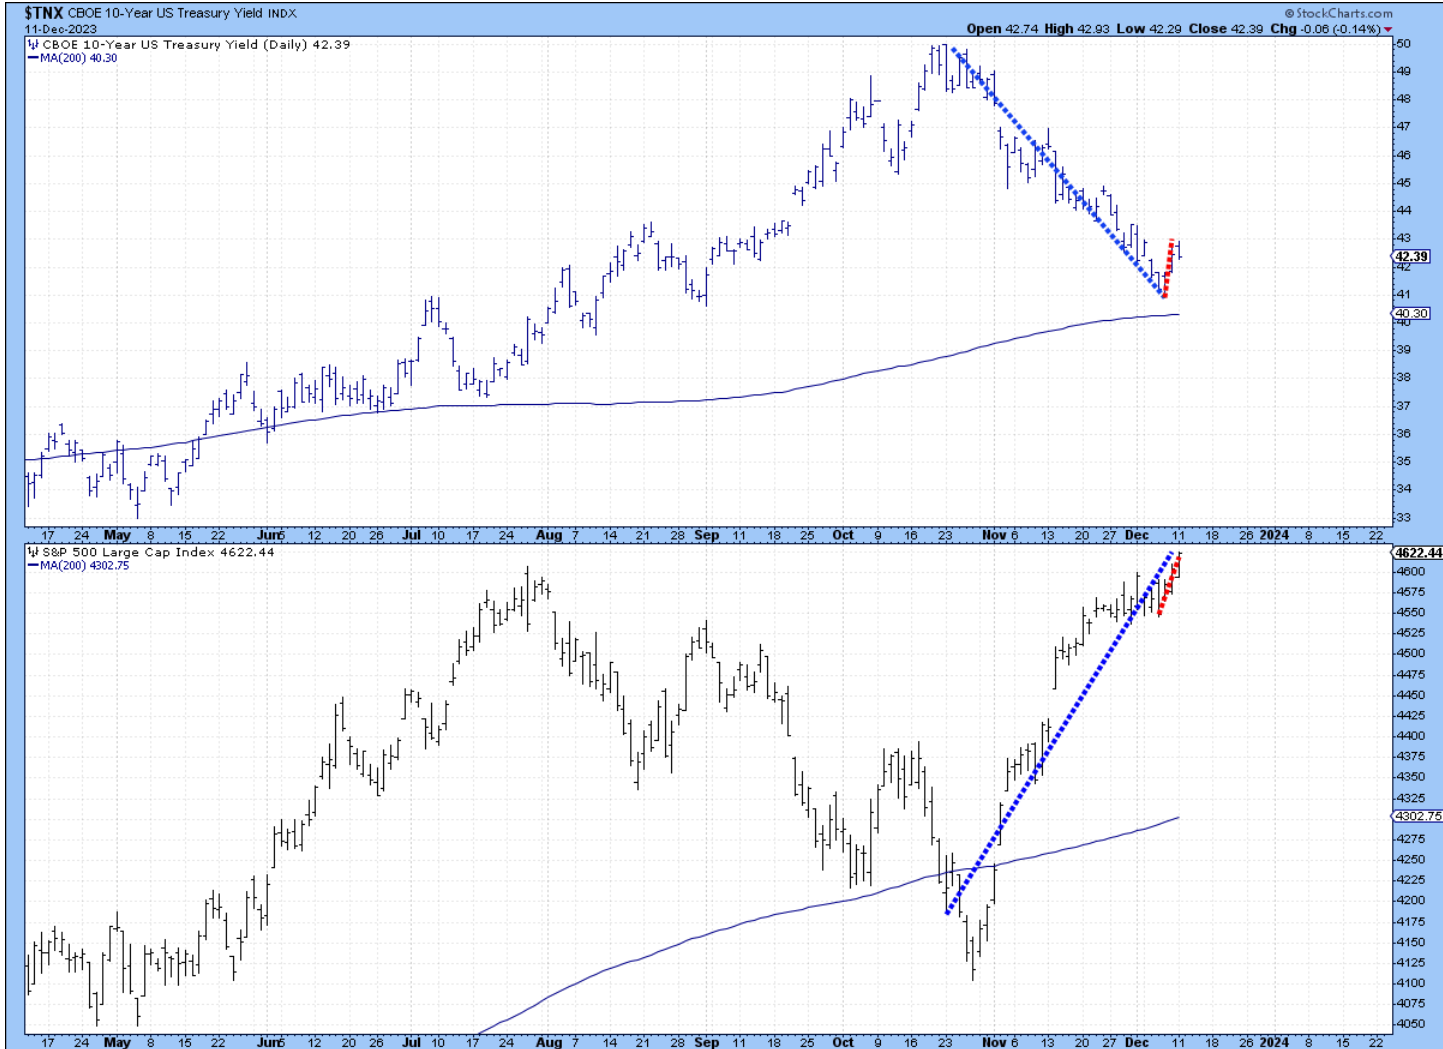
The drop in yields has helped risk rally since the end of October. We discussed this at the time. The yields seem to have found at least a temporary bottom at 4.10%. A continuation higher will likely pressure risk assets. It hasn’t yet, but I would keep a very close eye on this relationship. 4% is a big psychological level and the 200 day is nearby as well. Another reason why being long risk-assets at these levels seems problematic.
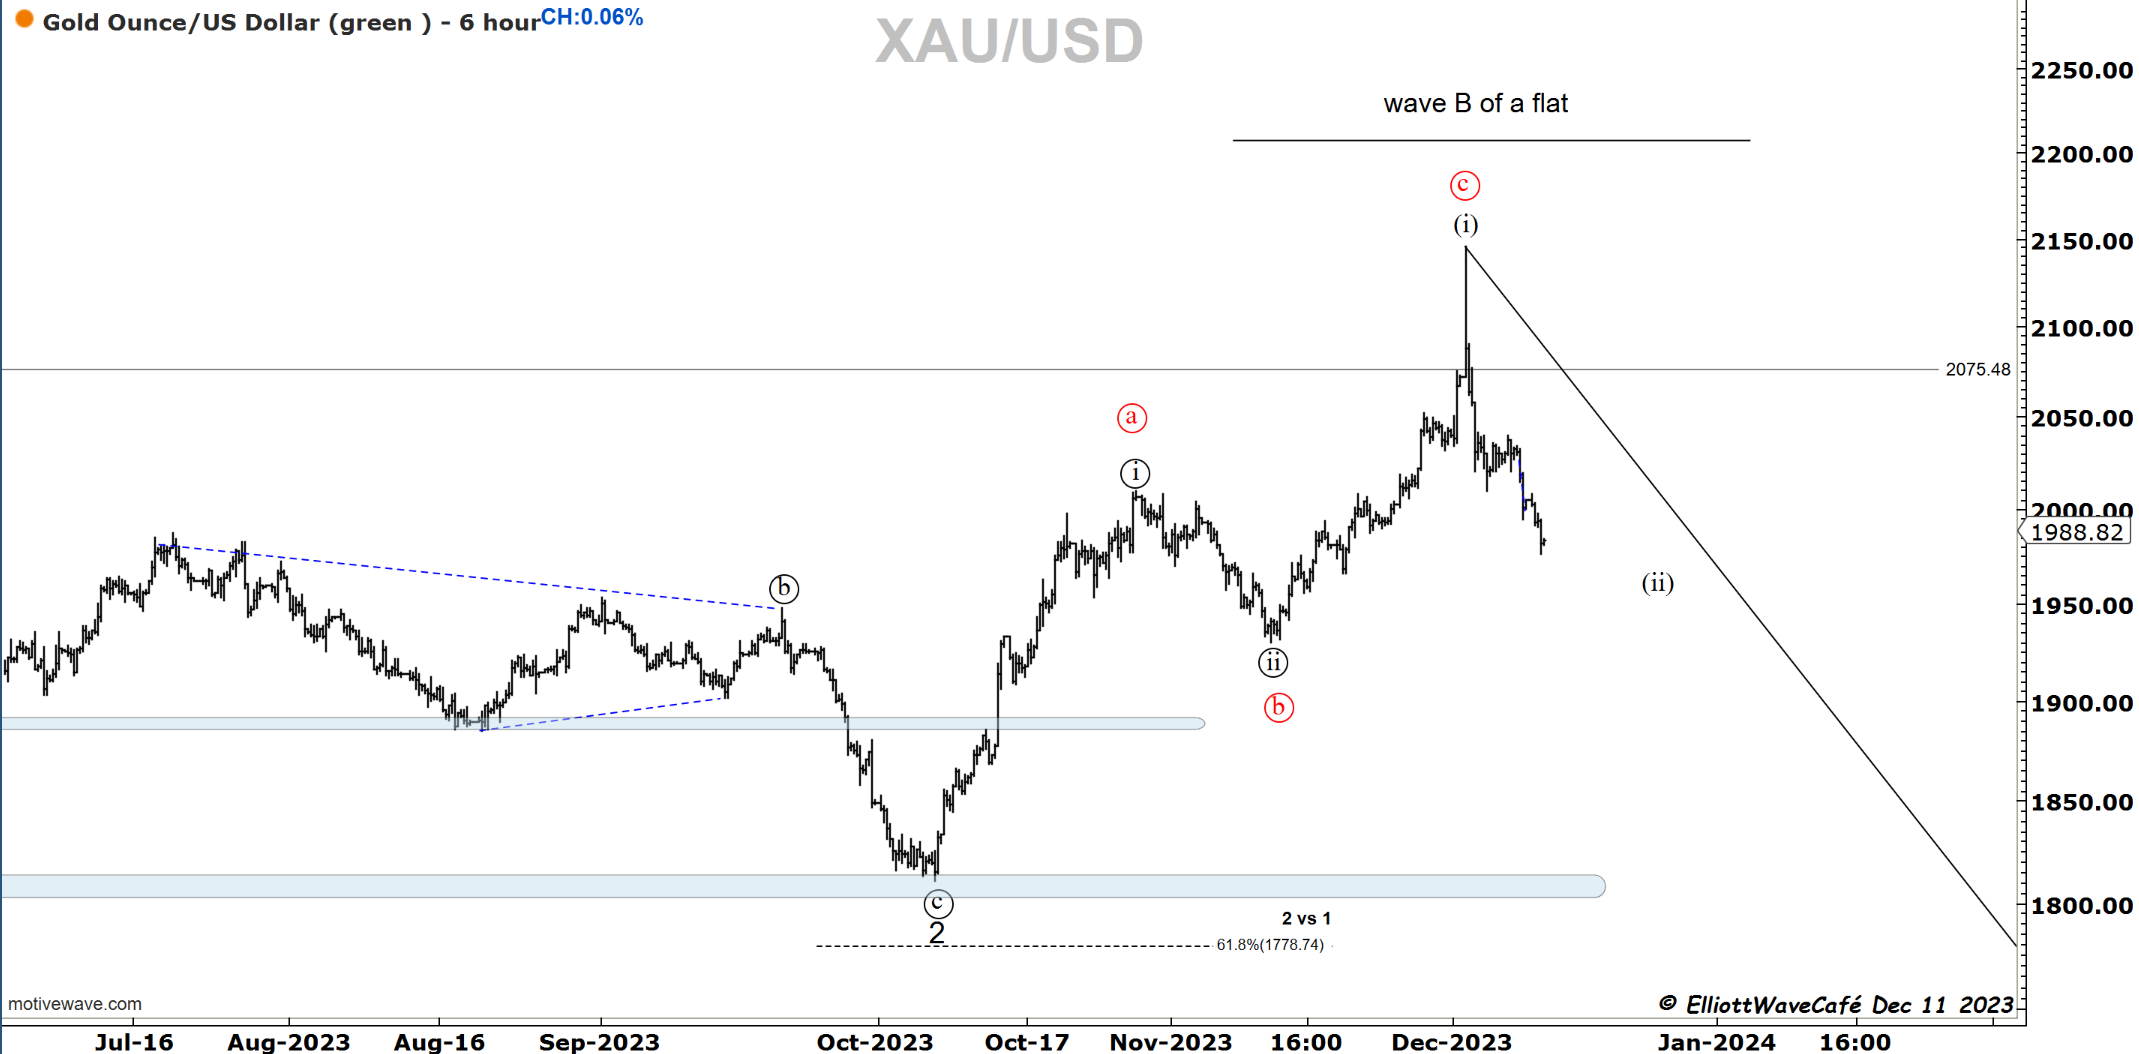
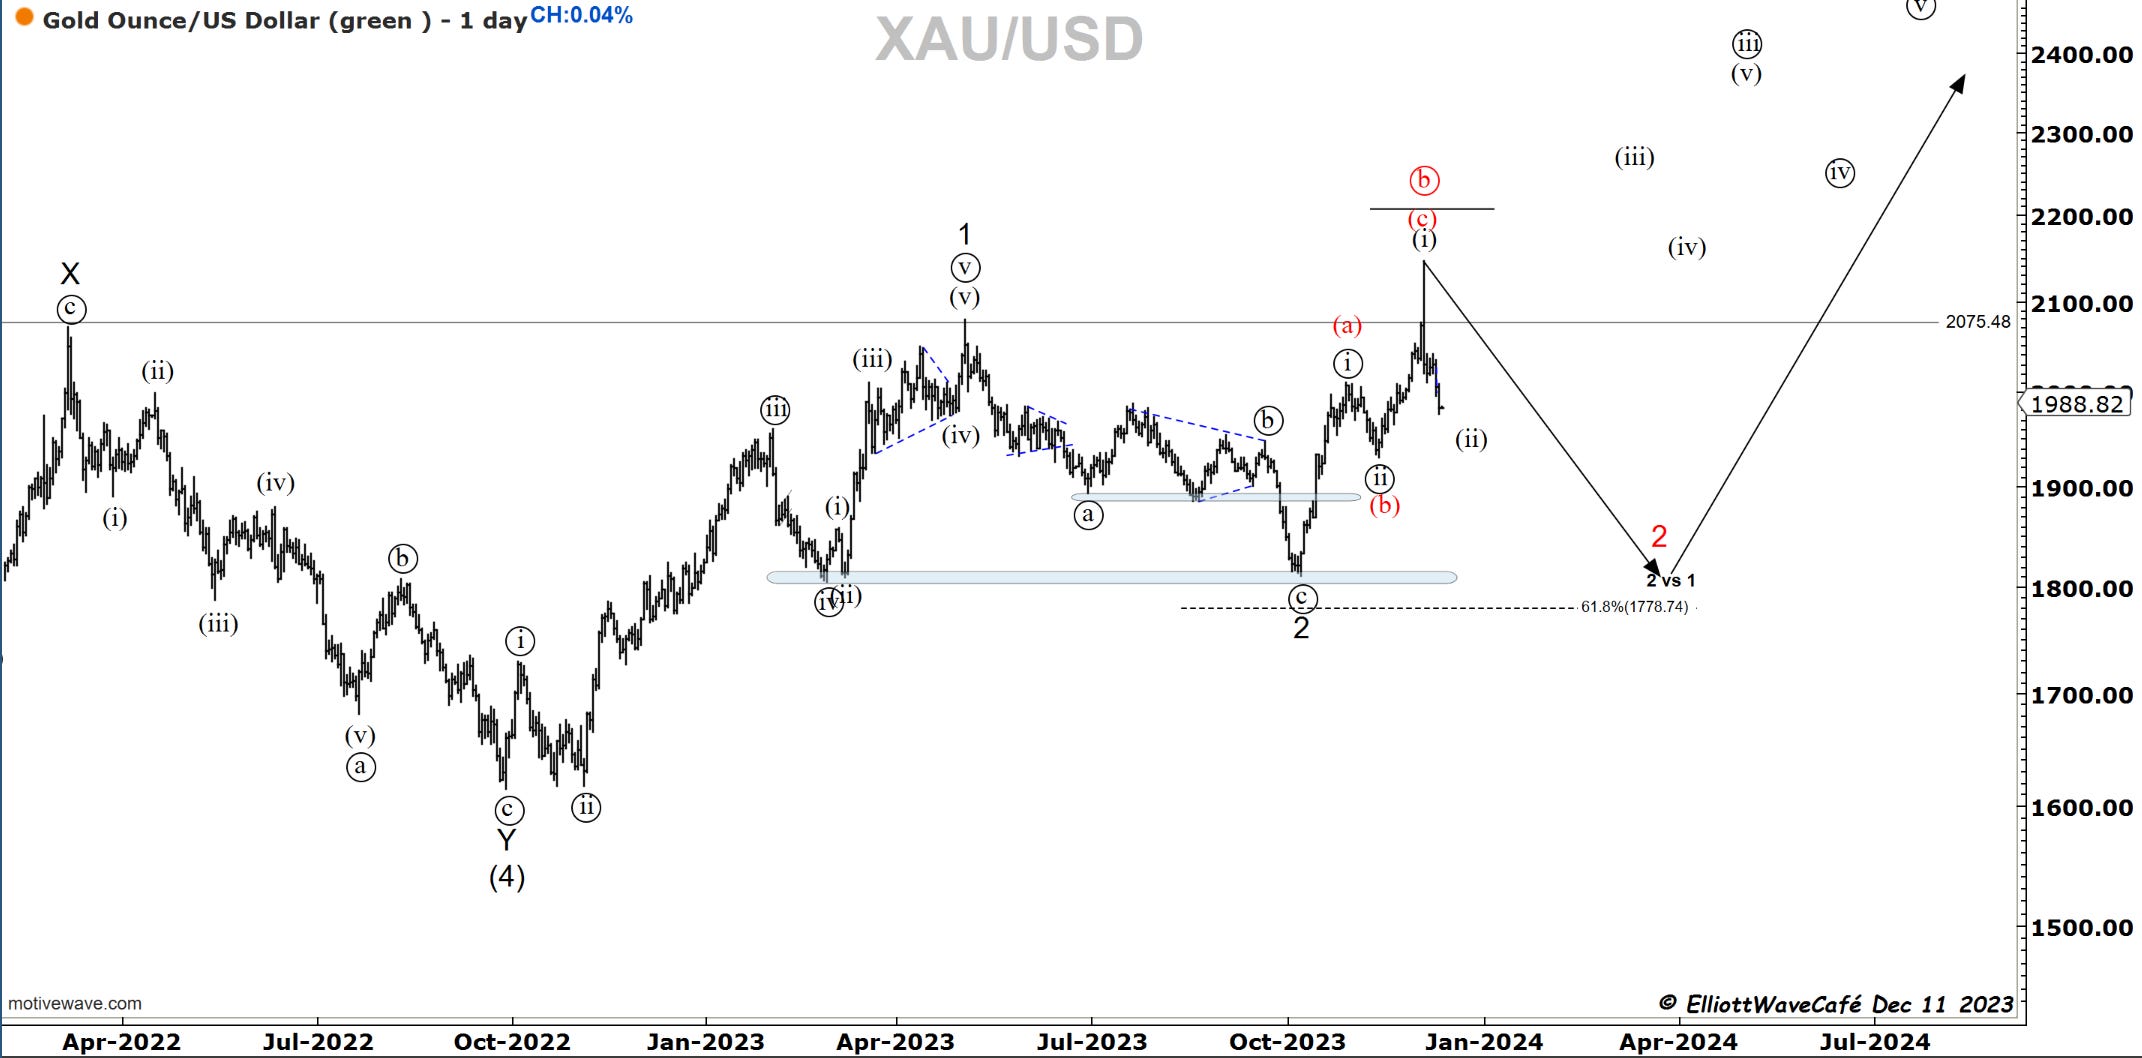
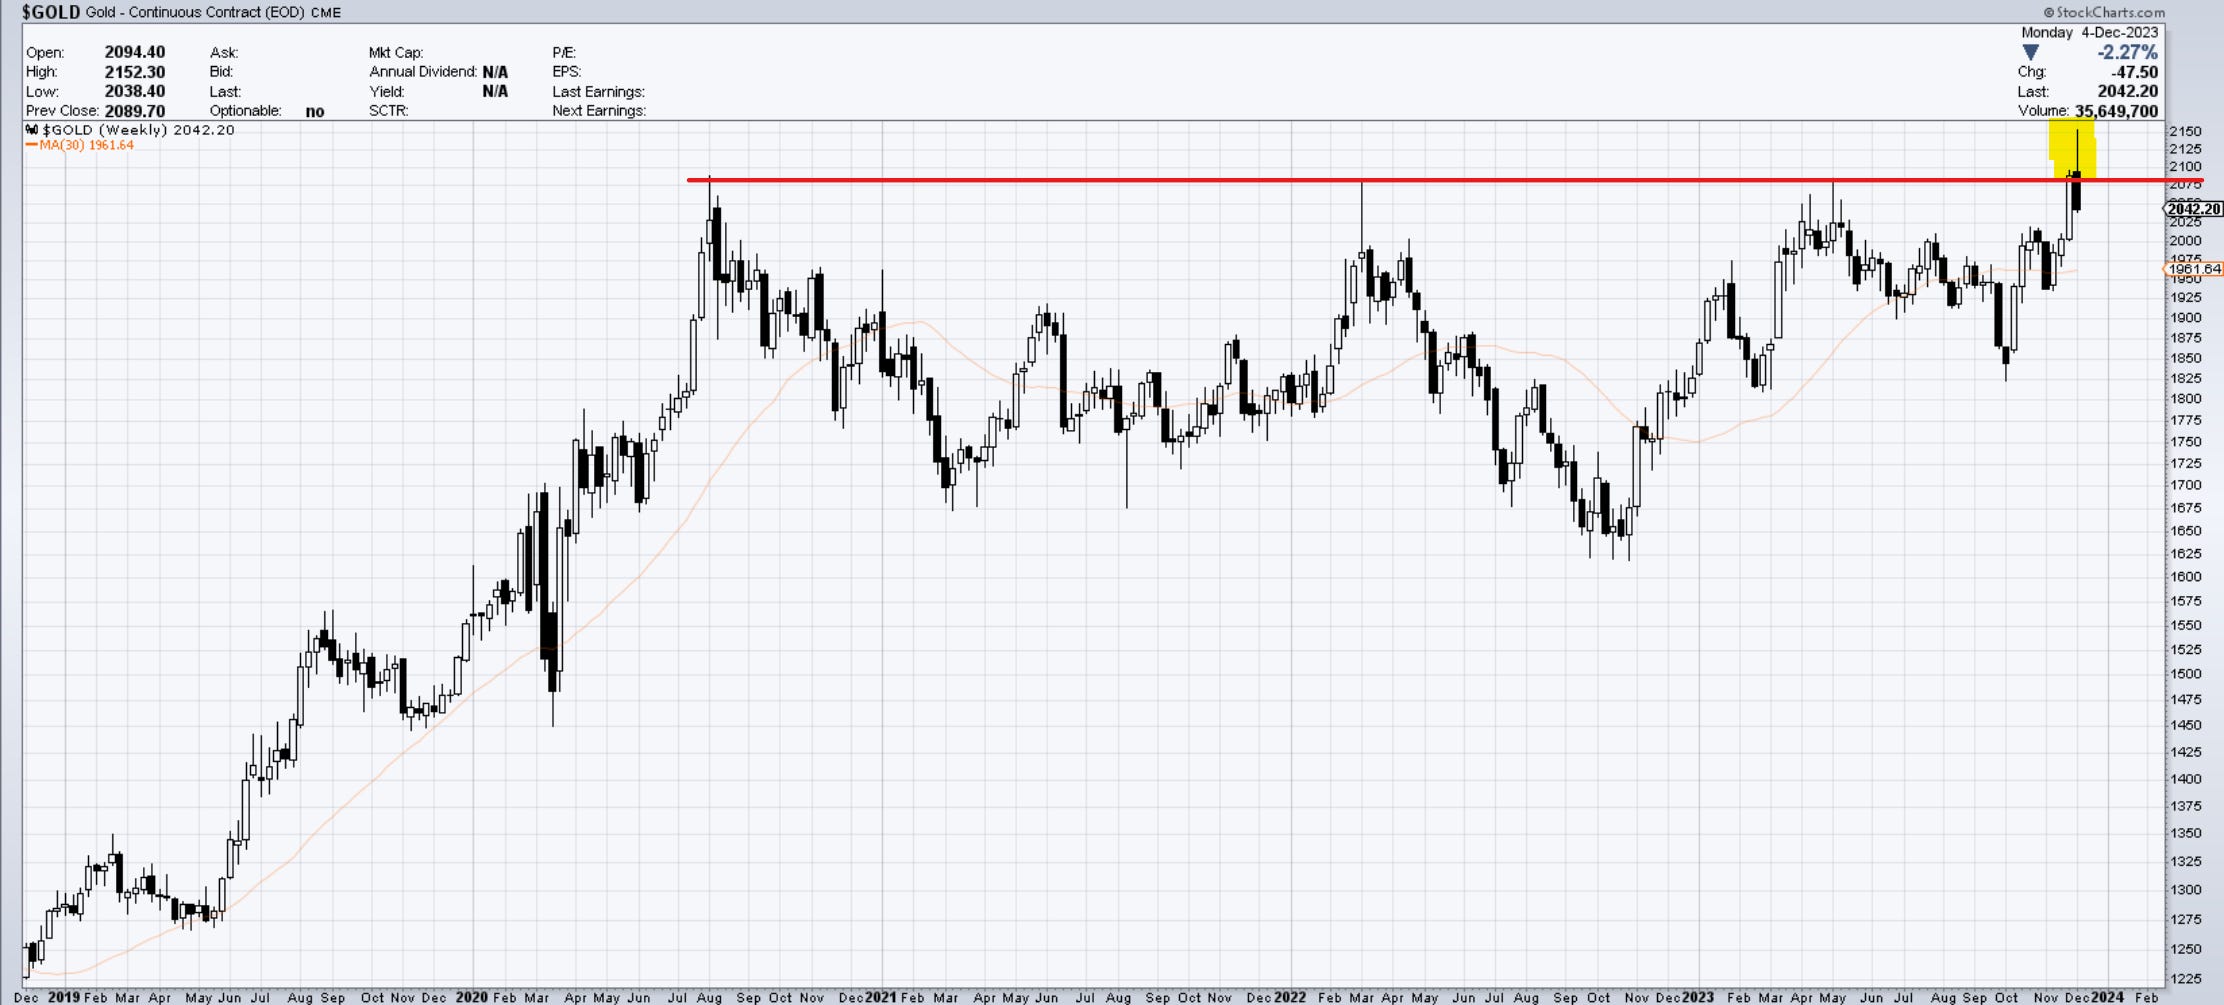
Gold
Gold‘s failed breakout continues to manifest itself through further drops in price. It appears more and more likely that an ABC-type move took place. A move like that to new highs is usually B wave of a flat. That 1,2 1,2 idea is hard to swallow at this juncture.
Bitcoin
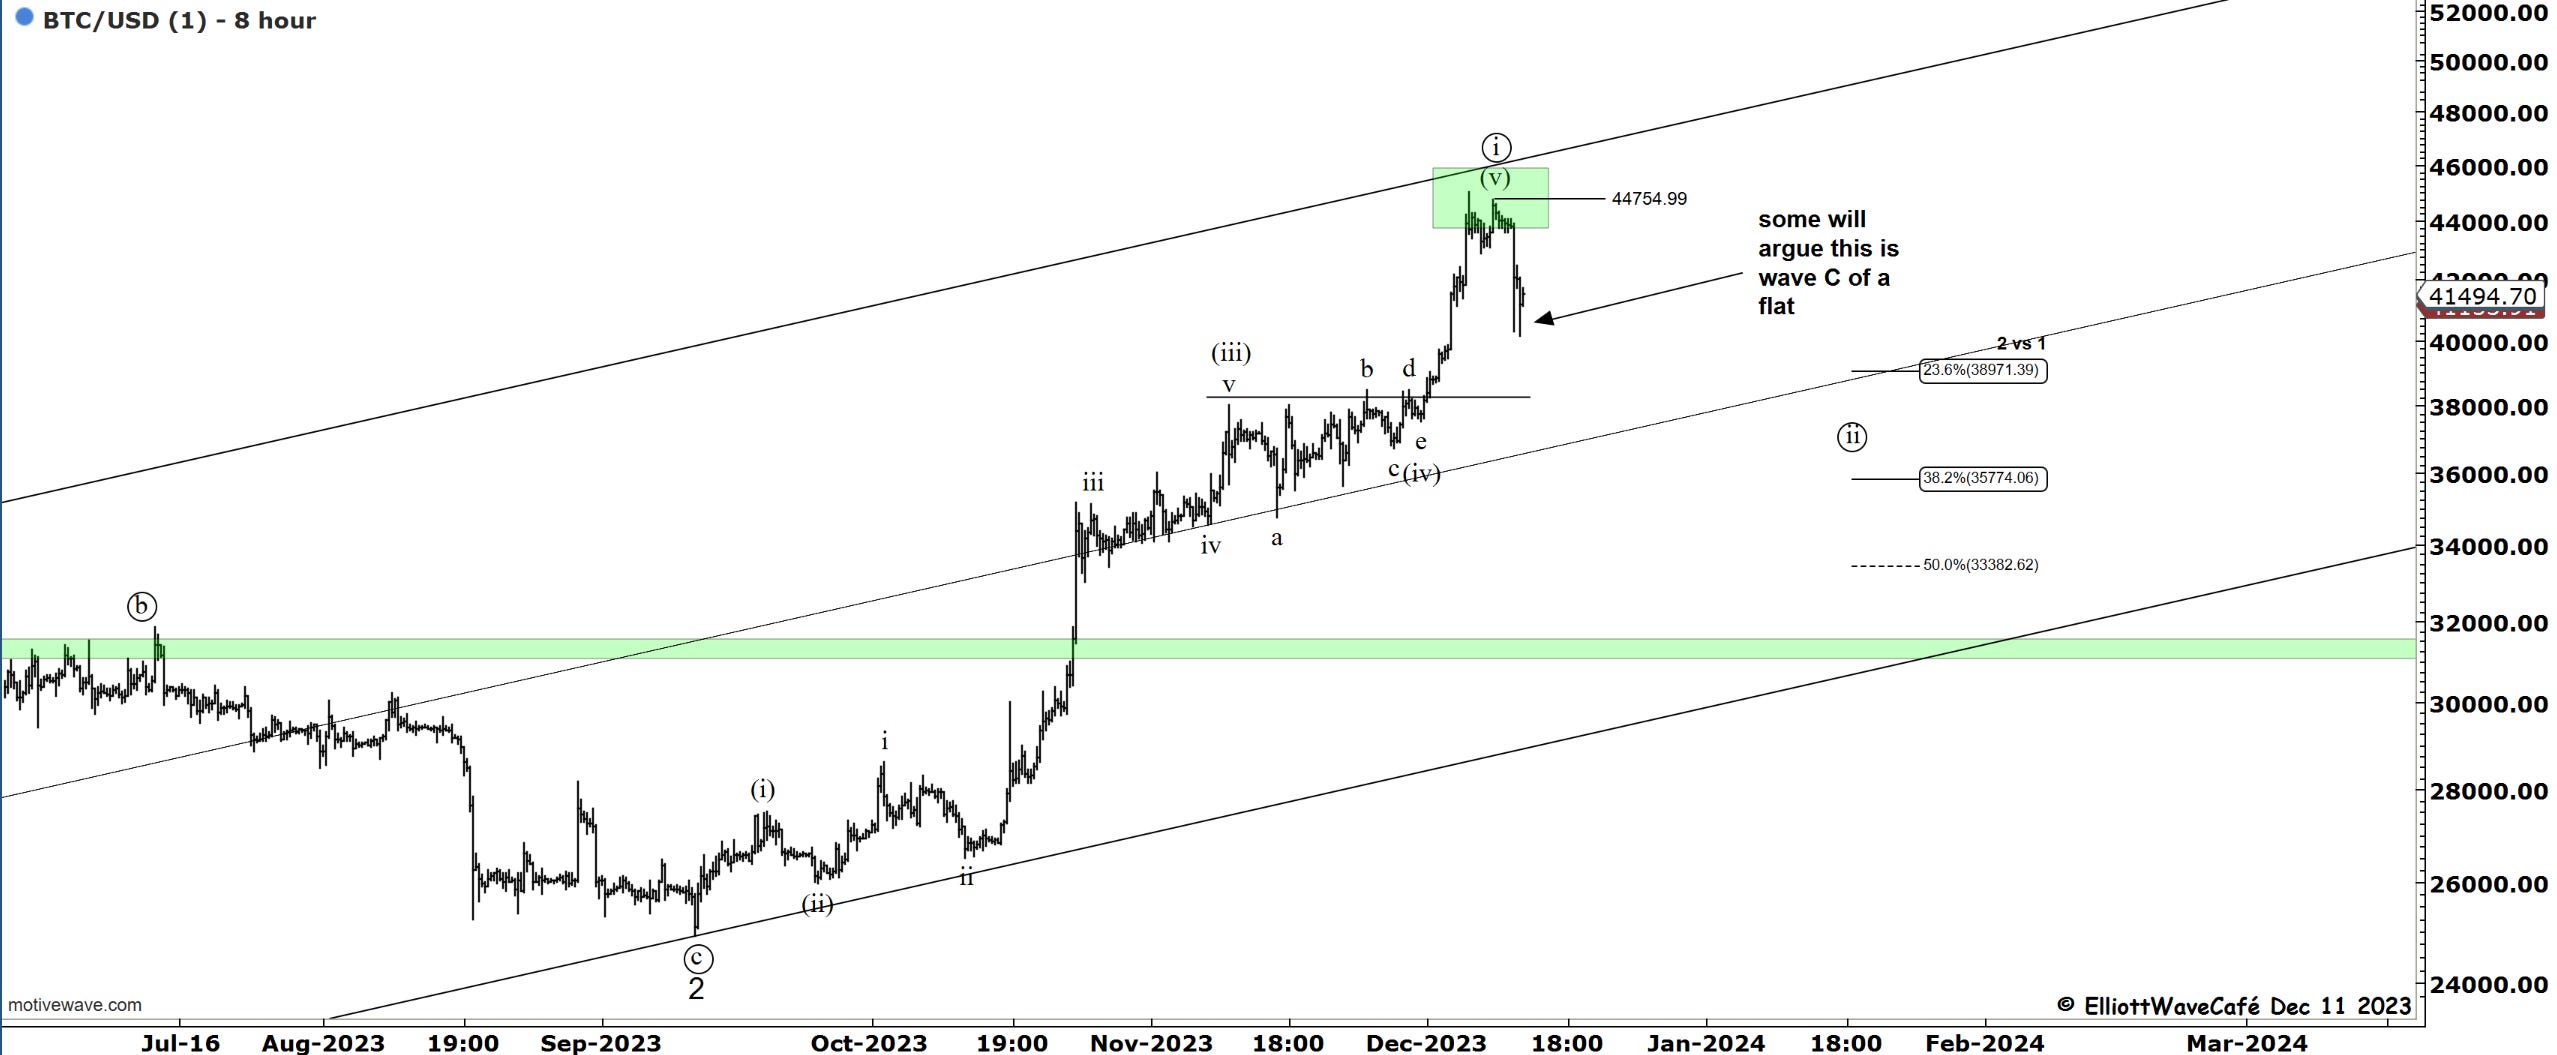
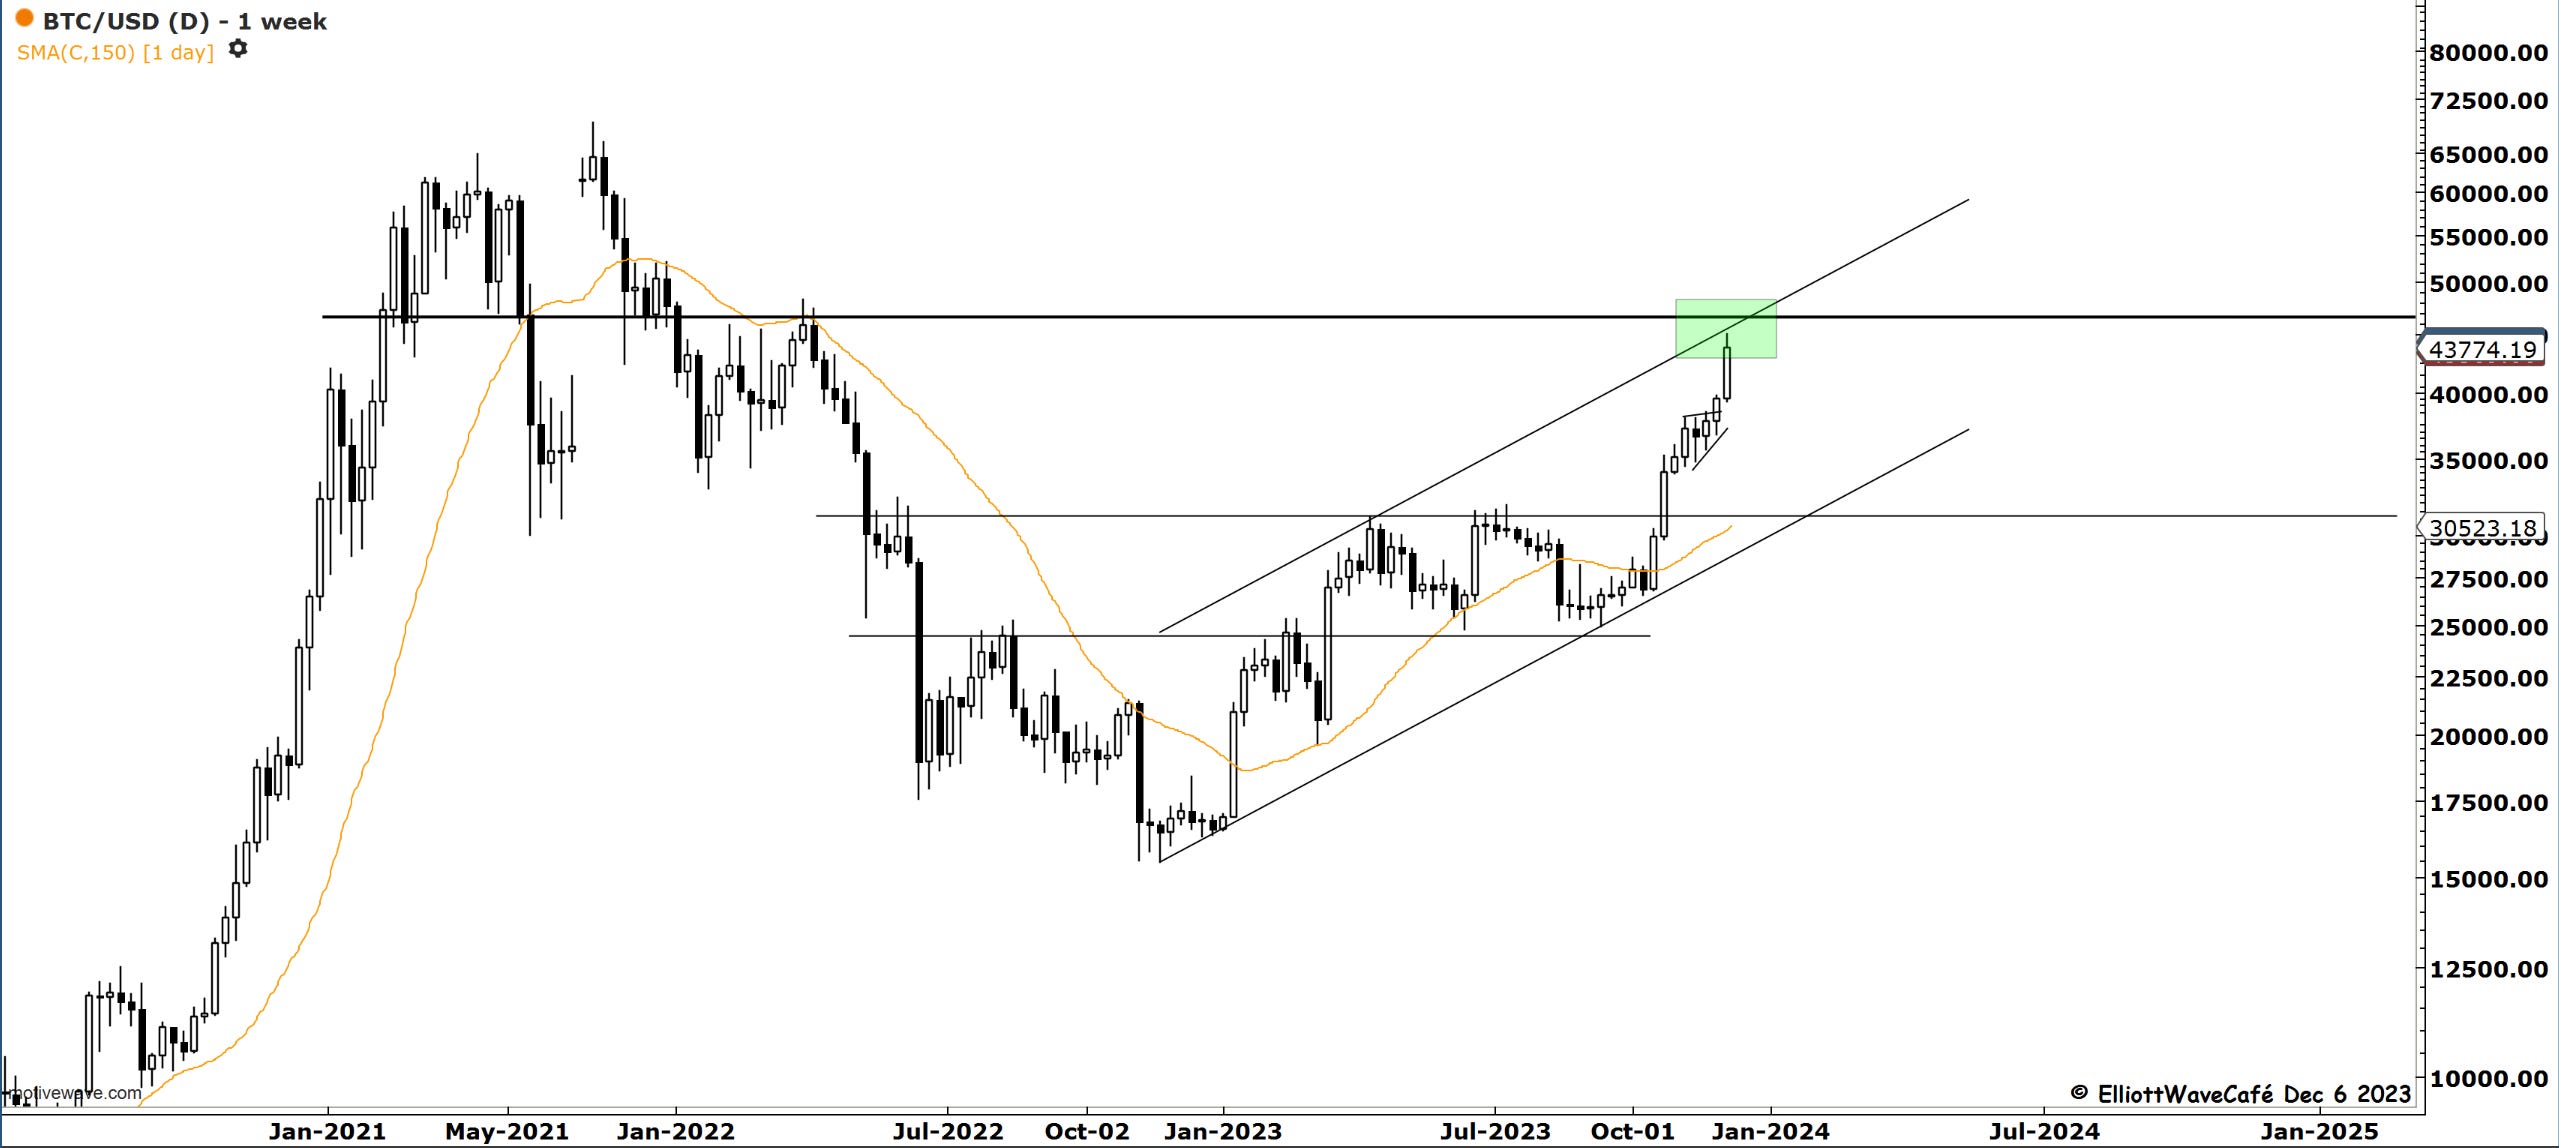
Bitcoin has made another attempt at the highs only to find a dry-up of buyers near 44800. My expectations for a corrective pullback are being confirmed by a drop of roughly 4k in price. It suggests a completed sequence at this point and raises the odds of a developing wave ((ii)). I would expect the middle of the channel line, along with the 38500 level, to provide good bid levels. It would also coincide with a 23.6% fib correction. For those betting that this drop was wave C of a flat I would keep a tight leash below 40k. ( if a wave 1 took place, then sellers will appear on attempts higher). I will explain more in today’s daily video. My view is that BTC will go through an extended corrective mode as suggested by the cycle chart and weekly chart resistance. Also, a resetting of the bullish sentiment is needed. Things have gotten a bit frothy, and “long consensus” was apparently a given.
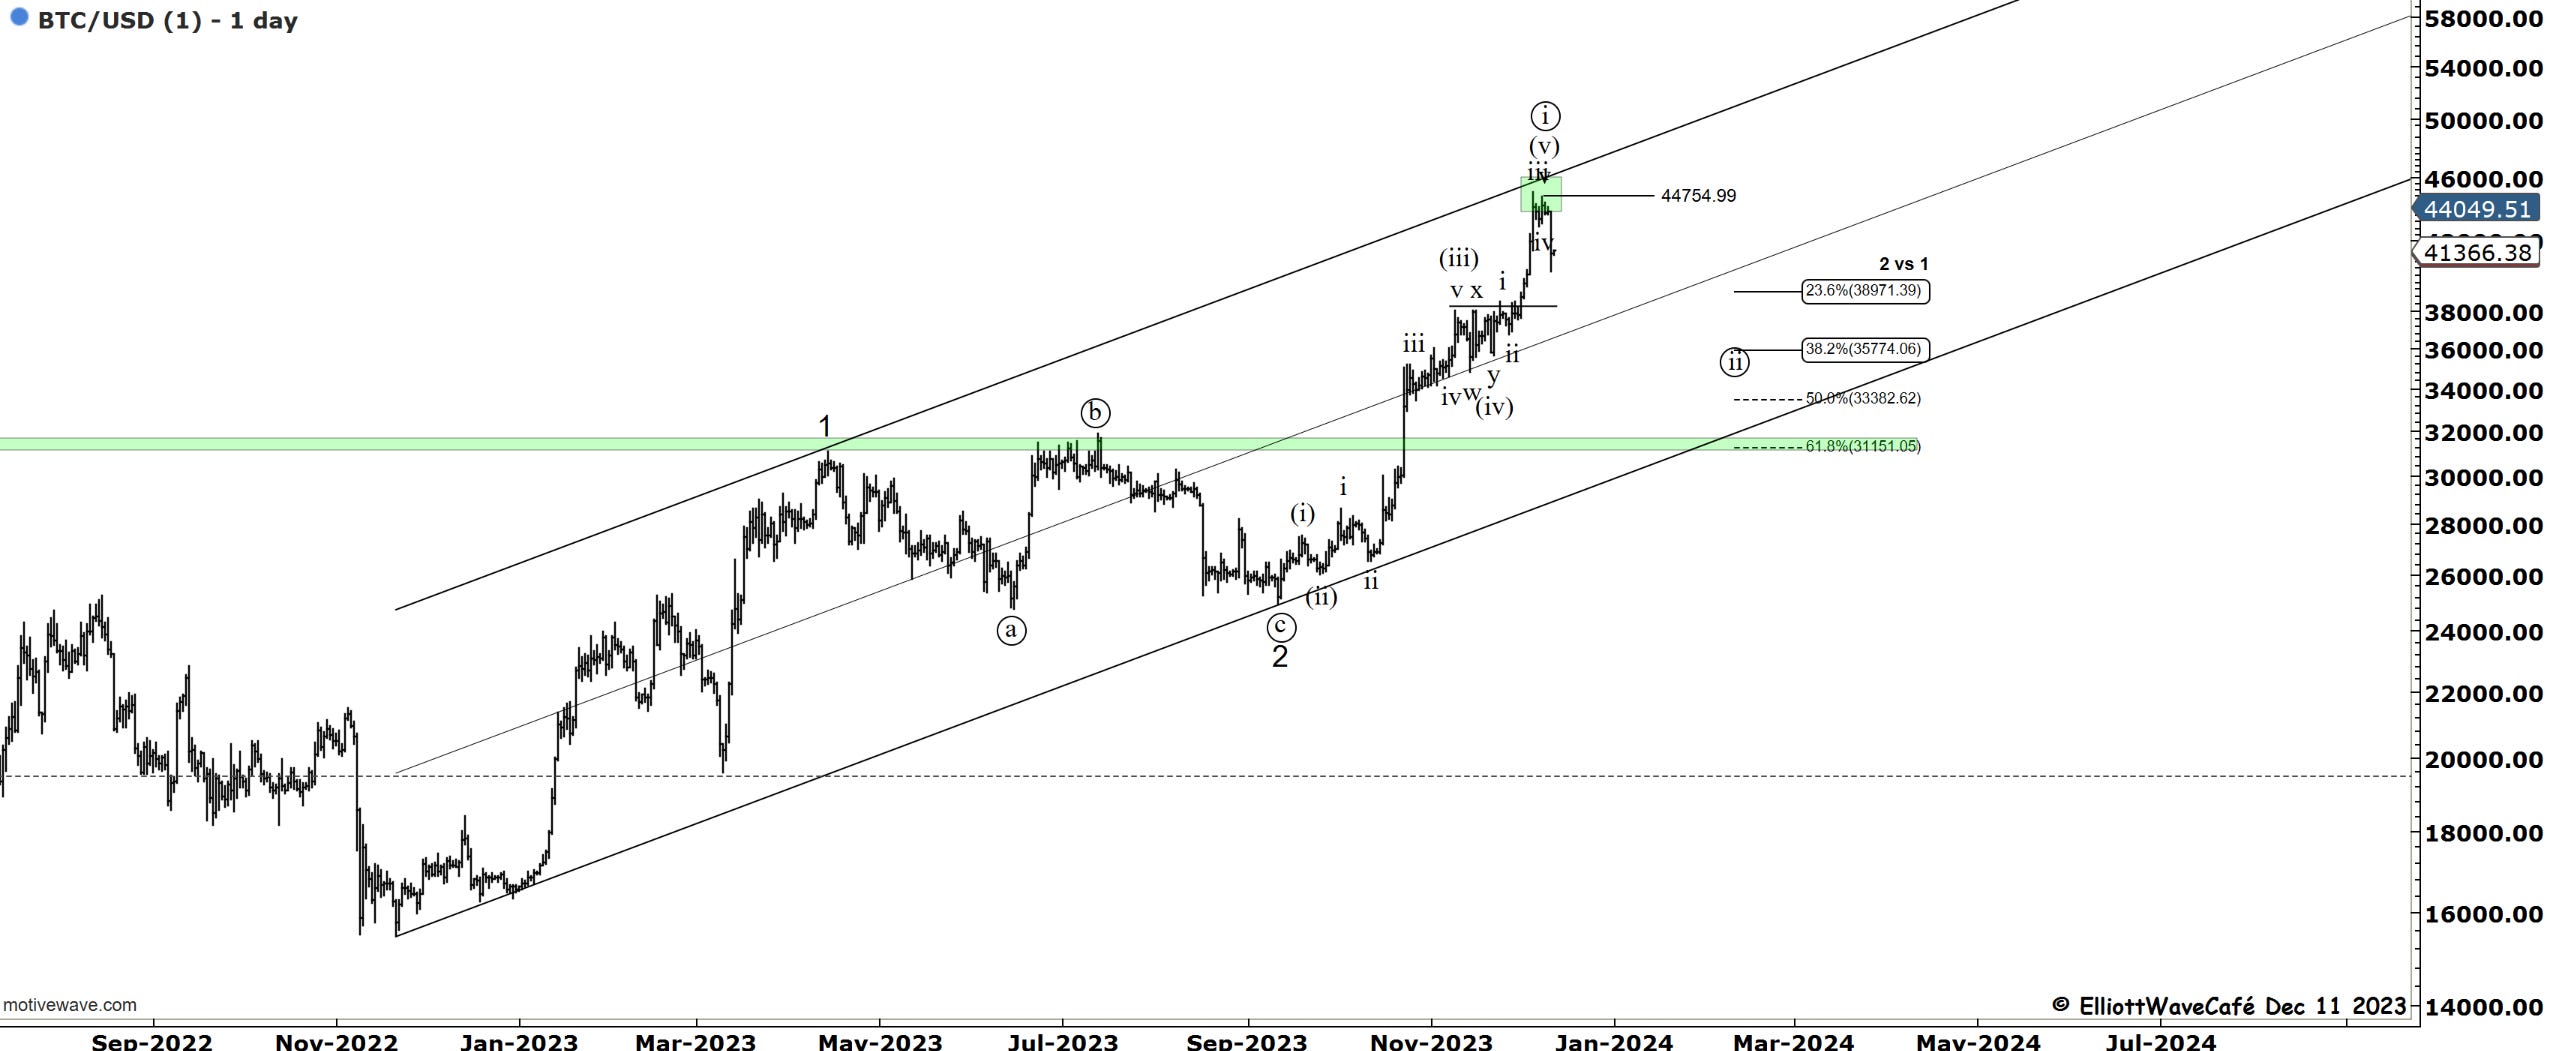
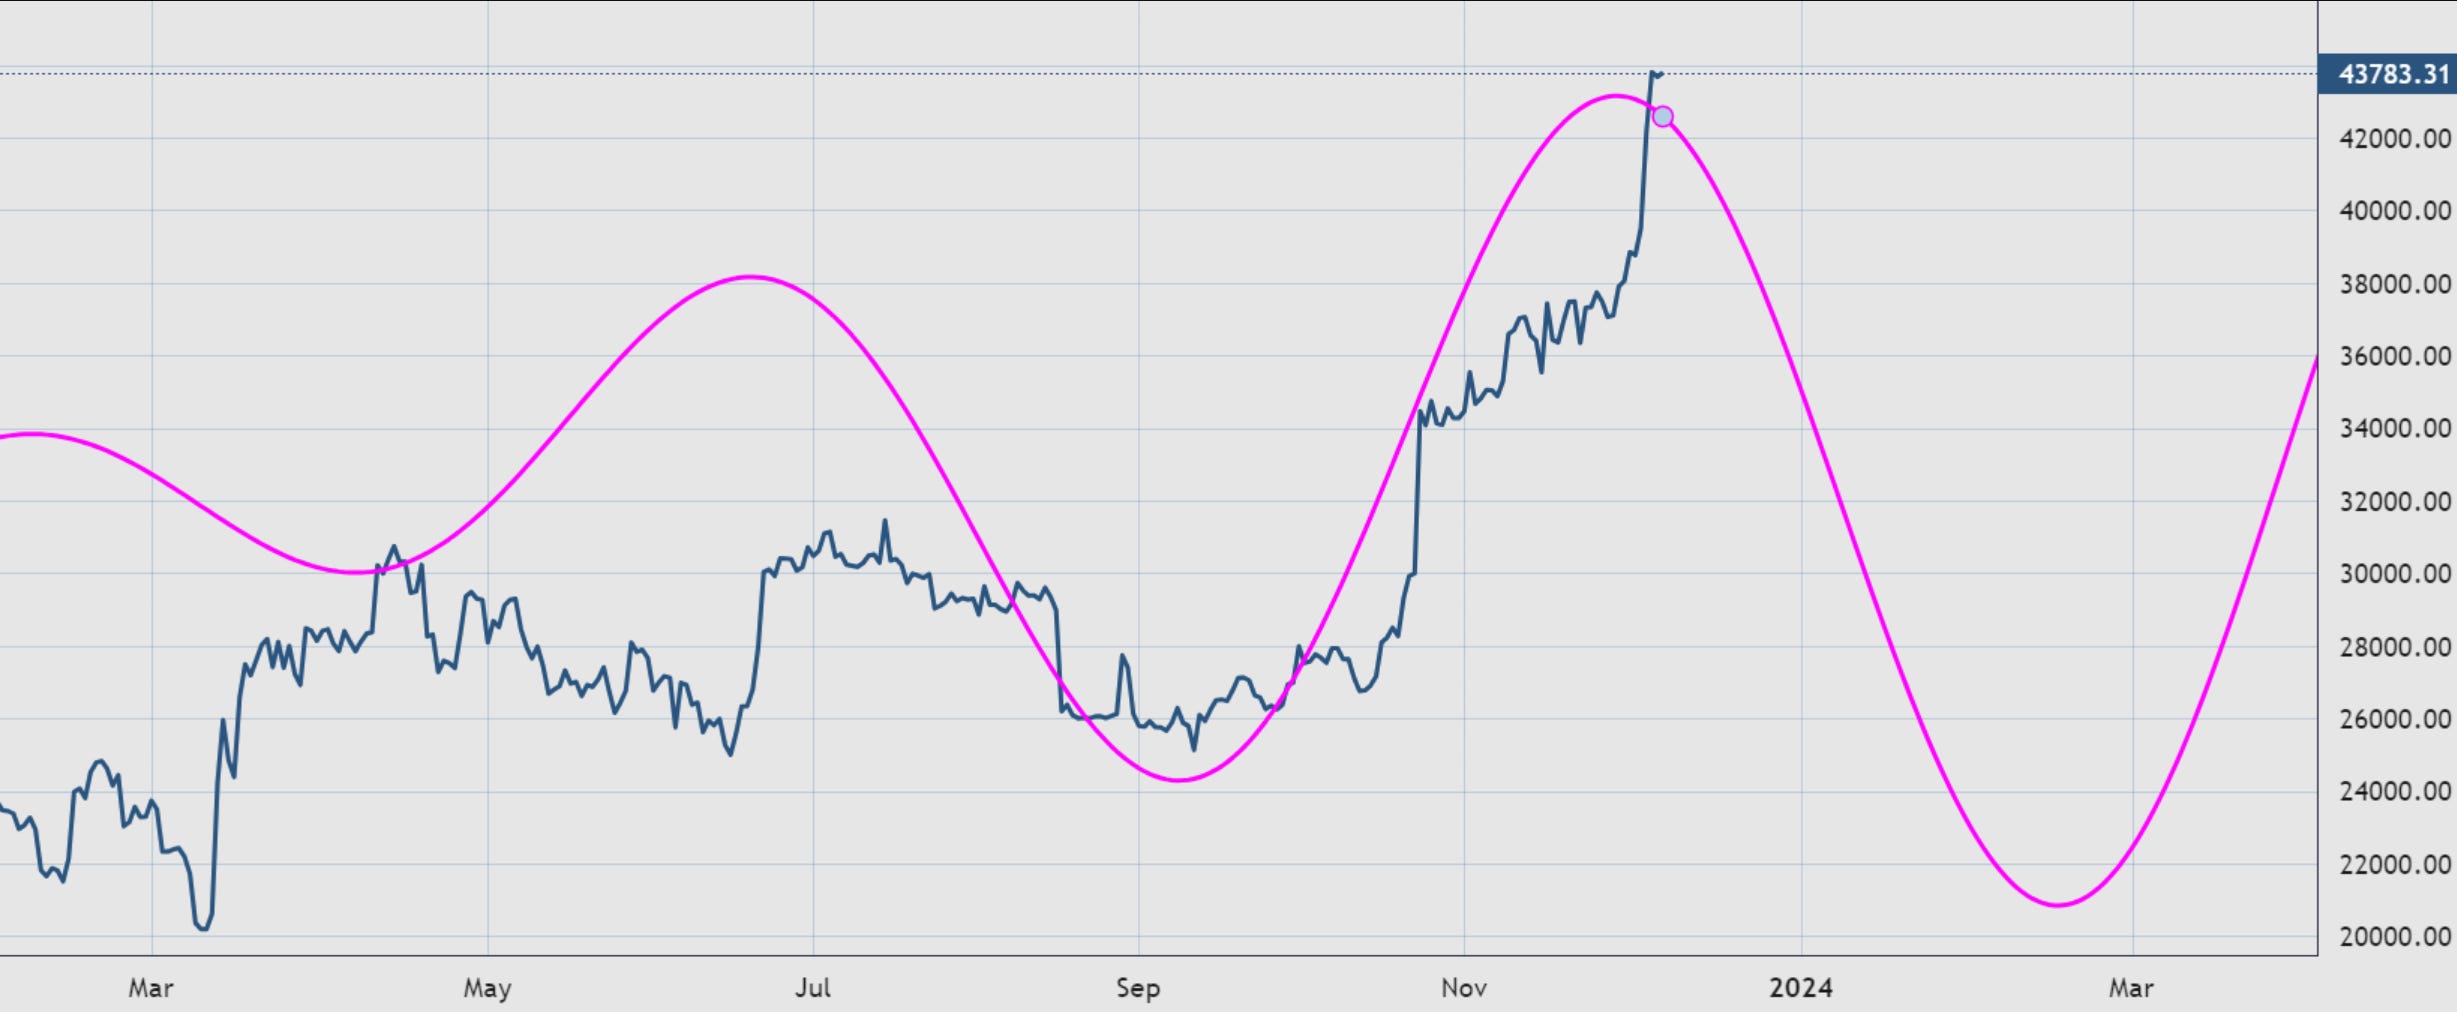
Here is the 150-180 day cycle in BTC suggesting a likely period of weakness upcoming. The depth of the correction is not what we’re looking for here but rather time spent on it.
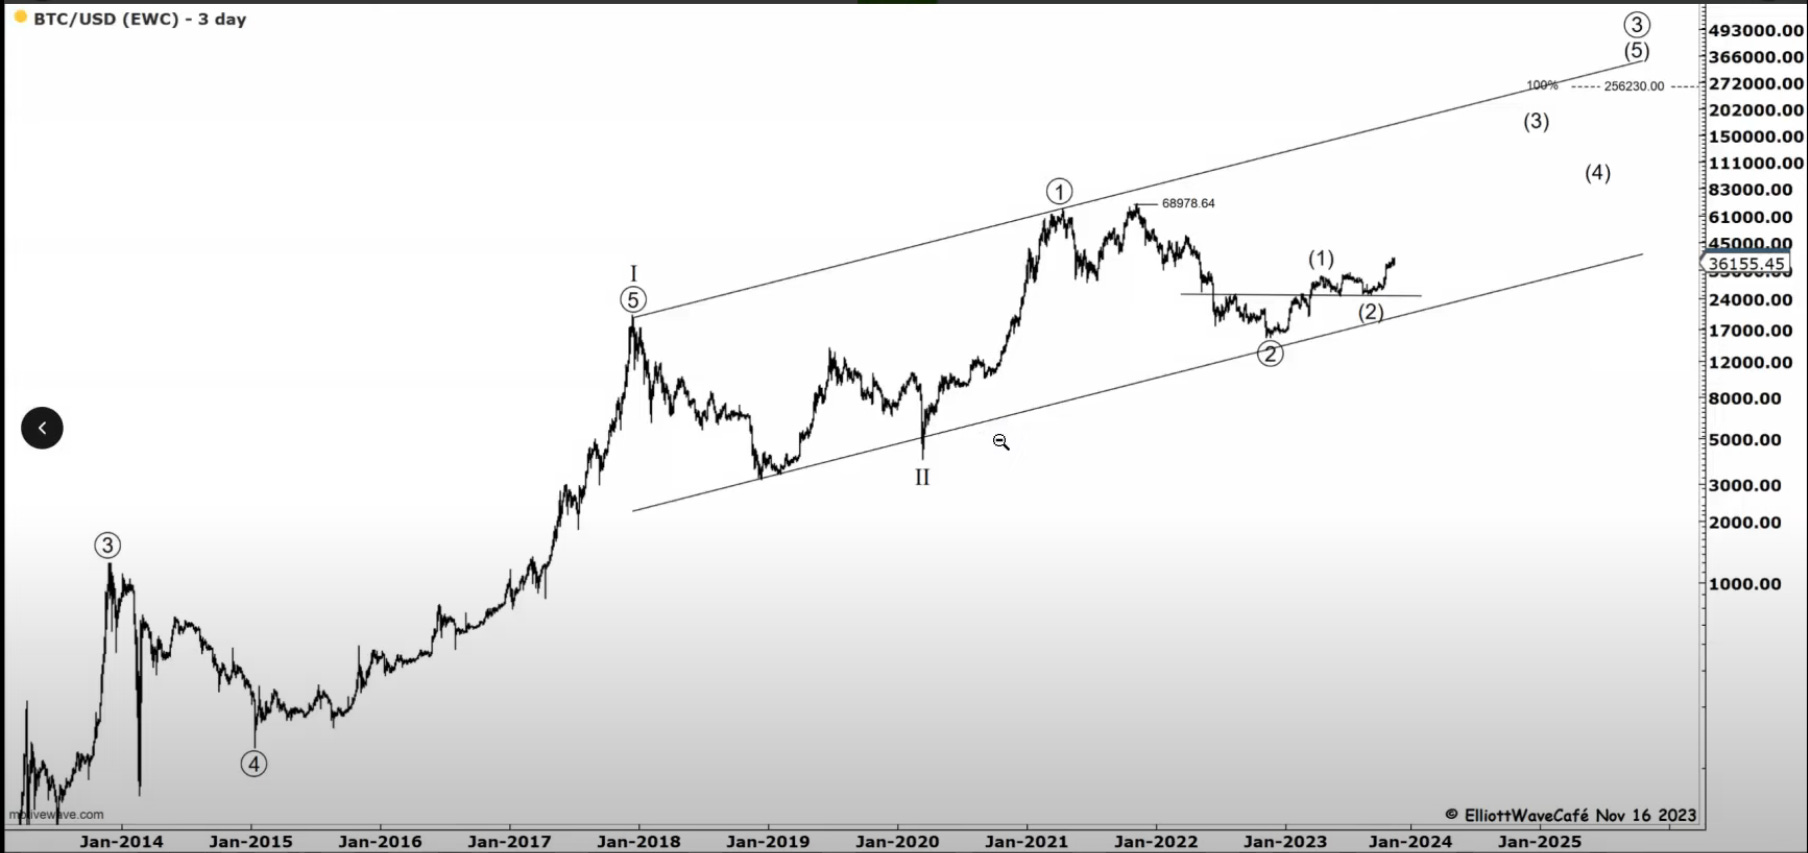
The much larger count can be found here. Presented this on Nov 16th note.
“Double shot” Daily video coming up next,
Have a great day wherever you are! - trade well, and don’t forget to subscribe and drop a like if this letter helps you in any way.
Cris
email: ewcafe@pm.me